All Images
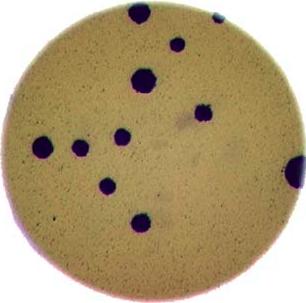
Image 1 of 1: ‘Bacteria colony’
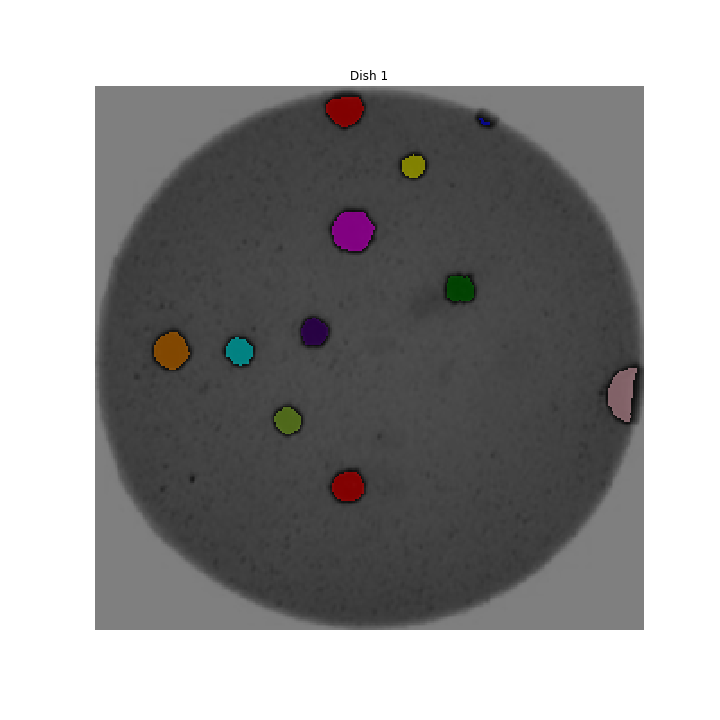
Image 1 of 1: ‘Colonies counted’
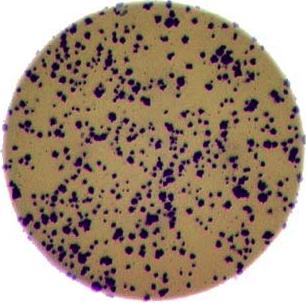
Image 1 of 1: ‘Bacteria colony’
Image 1 of 1: ‘Original size image’
Image 1 of 1: ‘Enlarged image area’
Image 1 of 1: ‘Image of 8’
Image 1 of 1: ‘Image of 0’
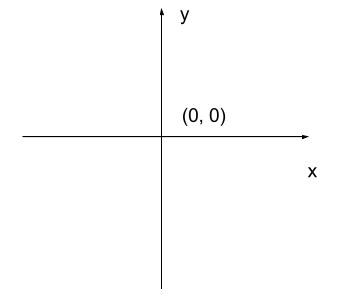
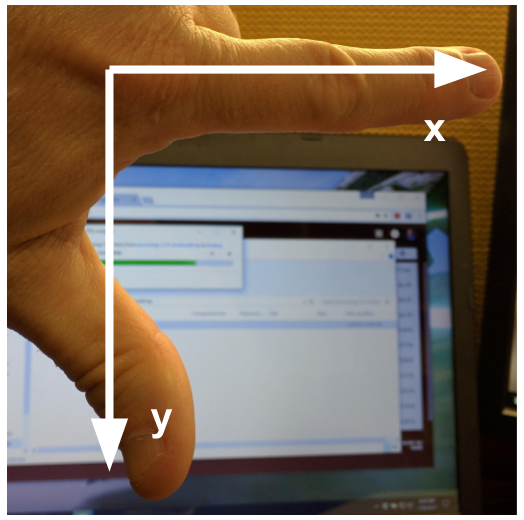
Image 1 of 1: ‘Cartesian coordinate system’
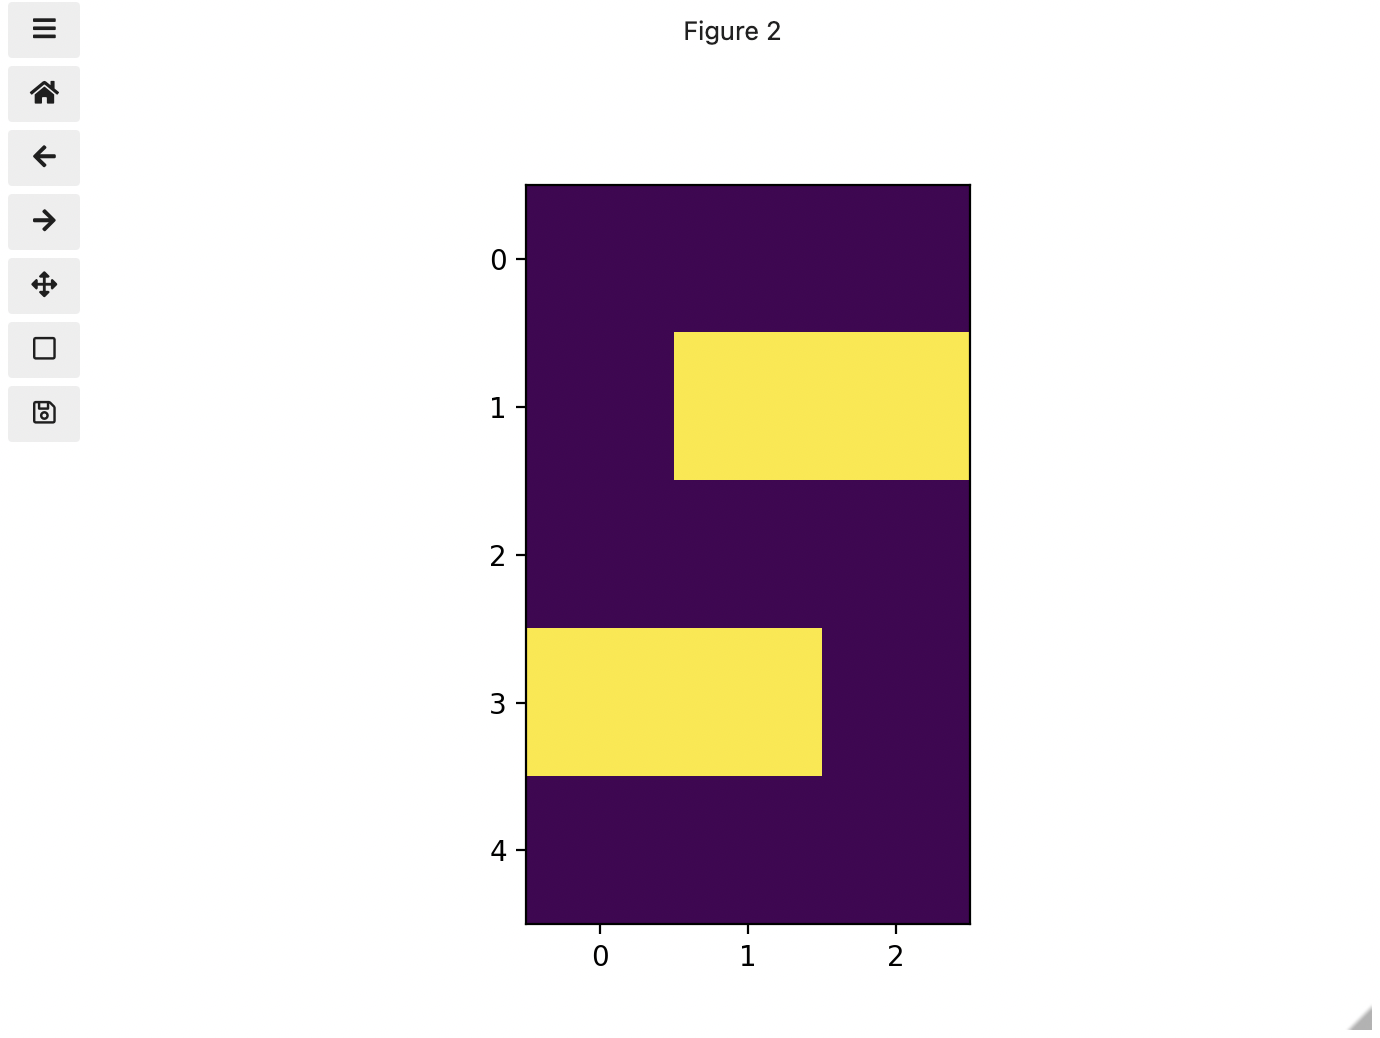
Image 1 of 1: ‘Image coordinate system’
Image 1 of 1: ‘Left-hand coordinate system’
Image 1 of 1: ‘Image of 5’
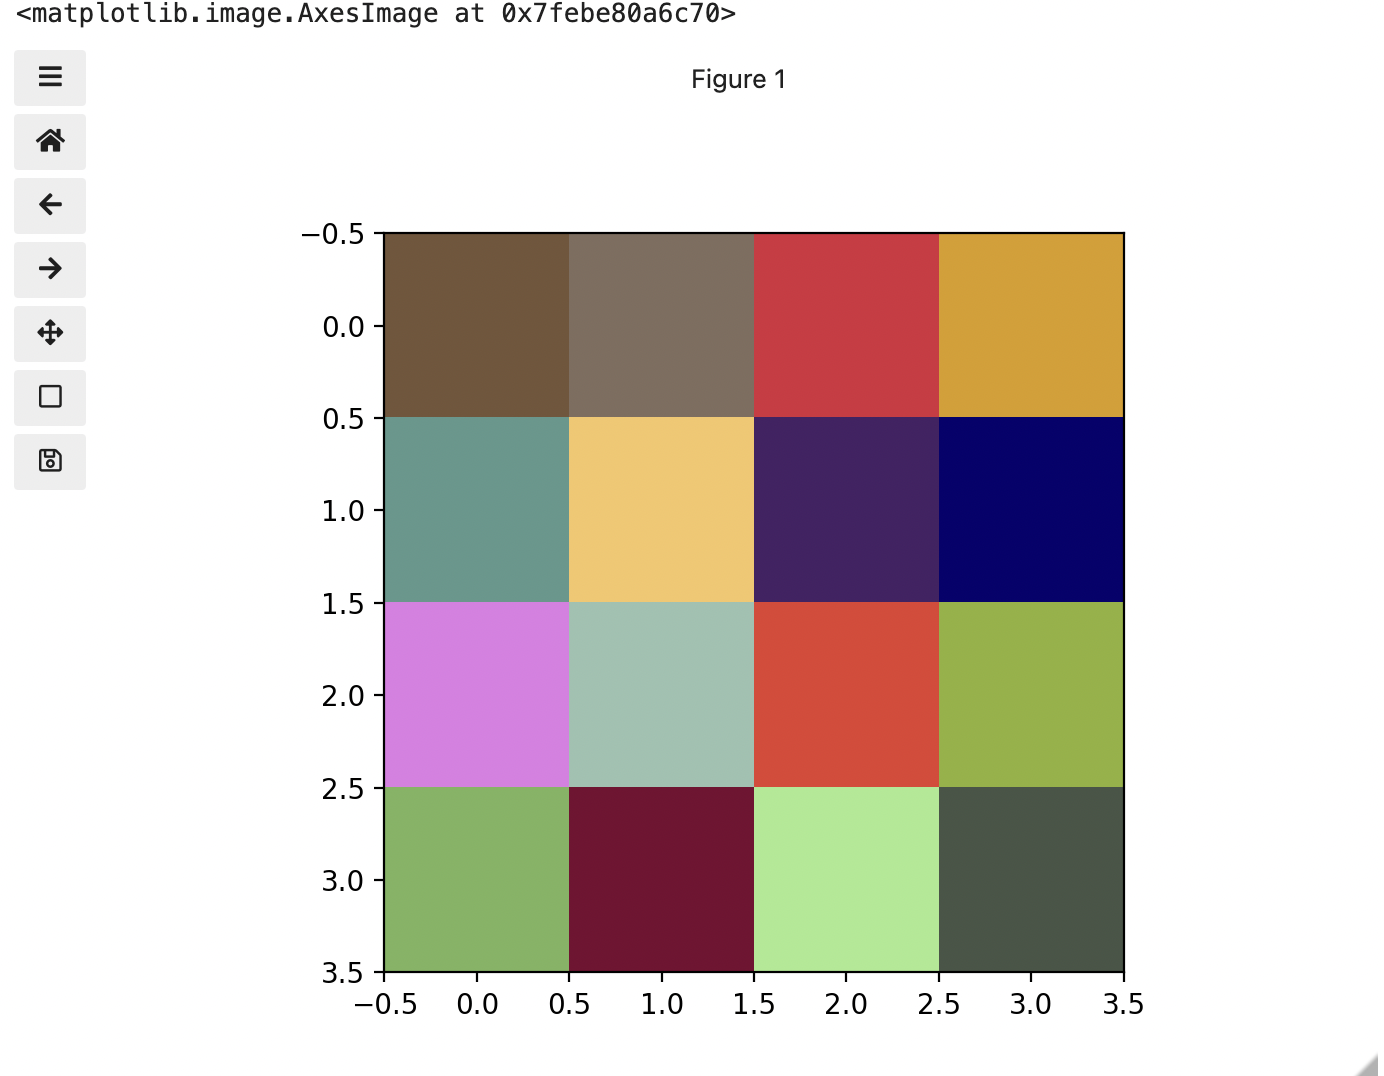
Image 1 of 1: ‘Image of three colours’
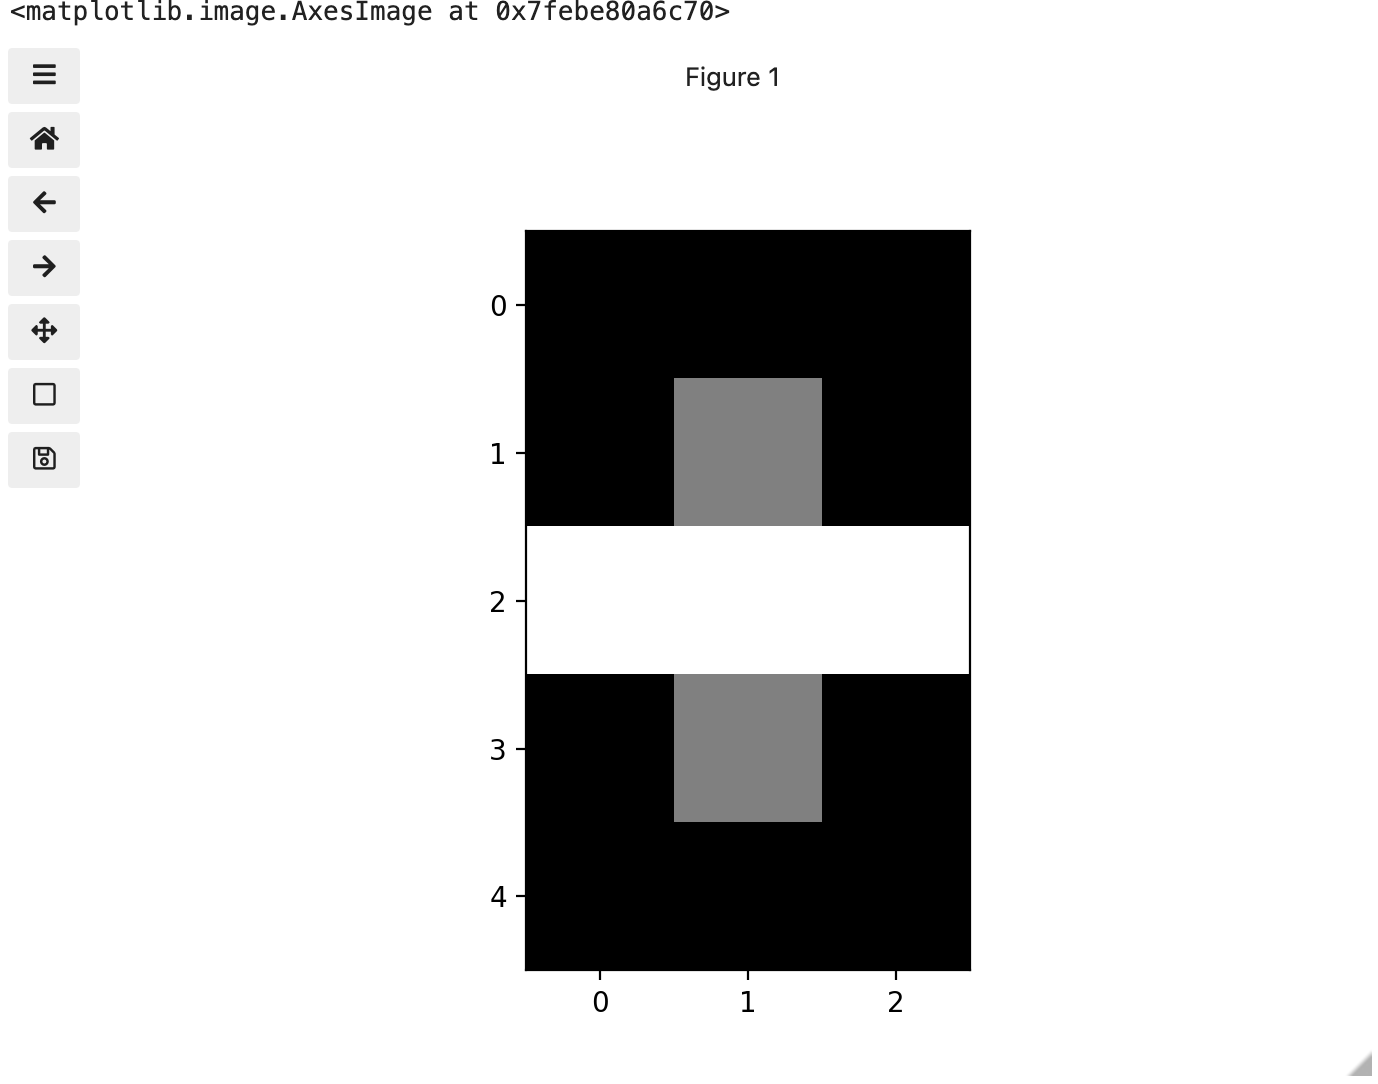
Image 1 of 1: ‘Image in greyscale’
Image 1 of 1: ‘Image of checkerboard’
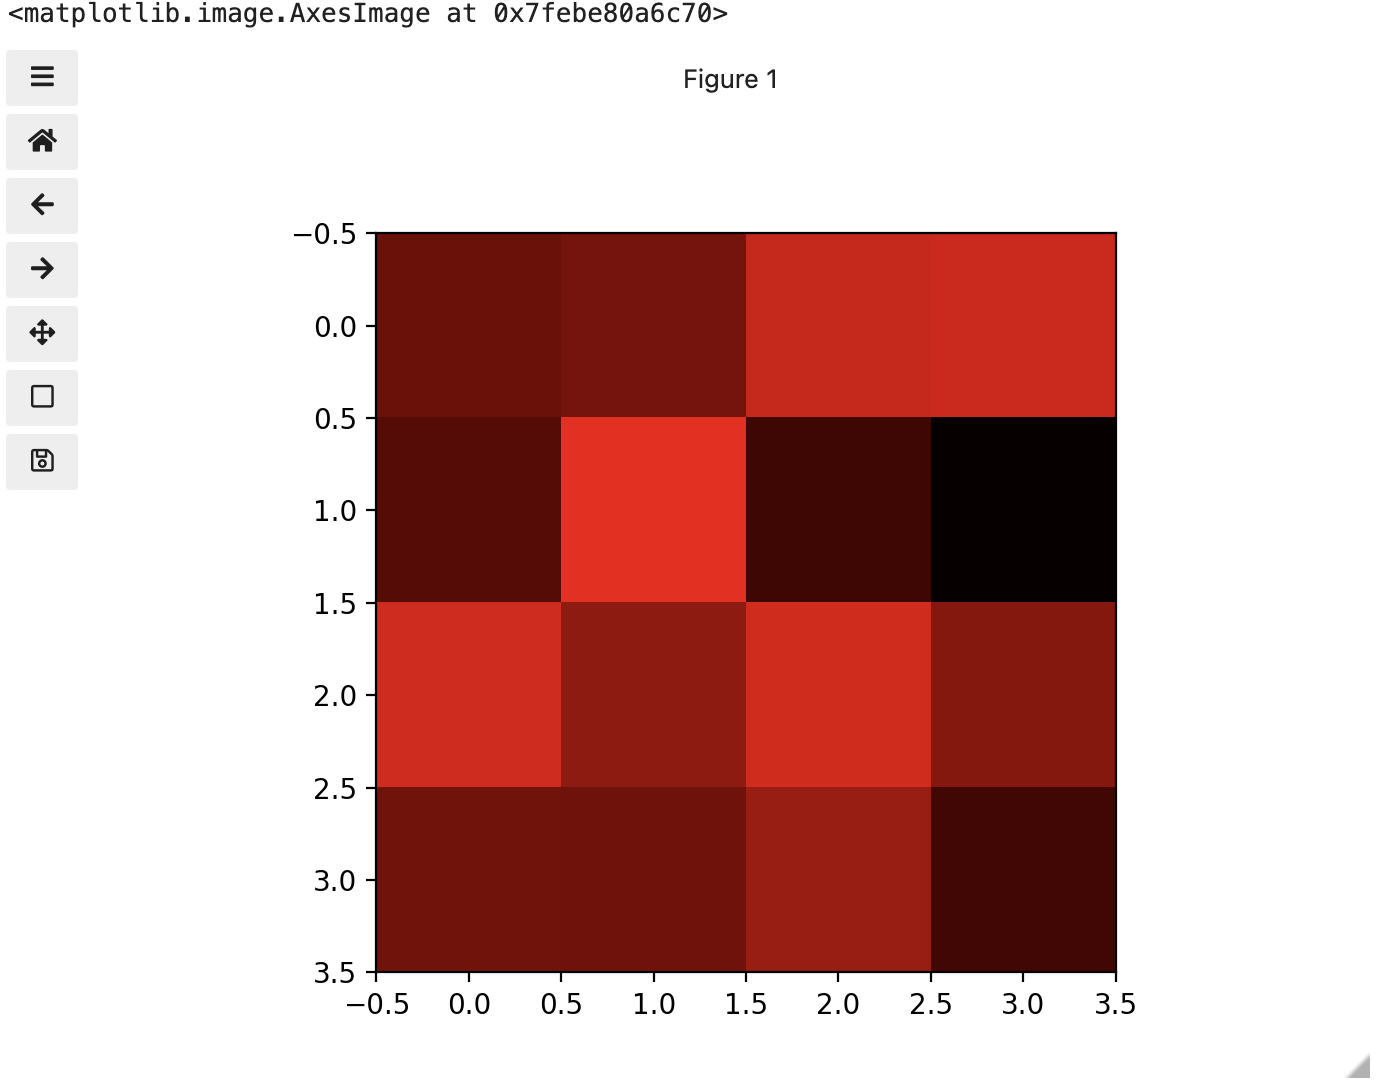
Image 1 of 1: ‘Image of red channel’
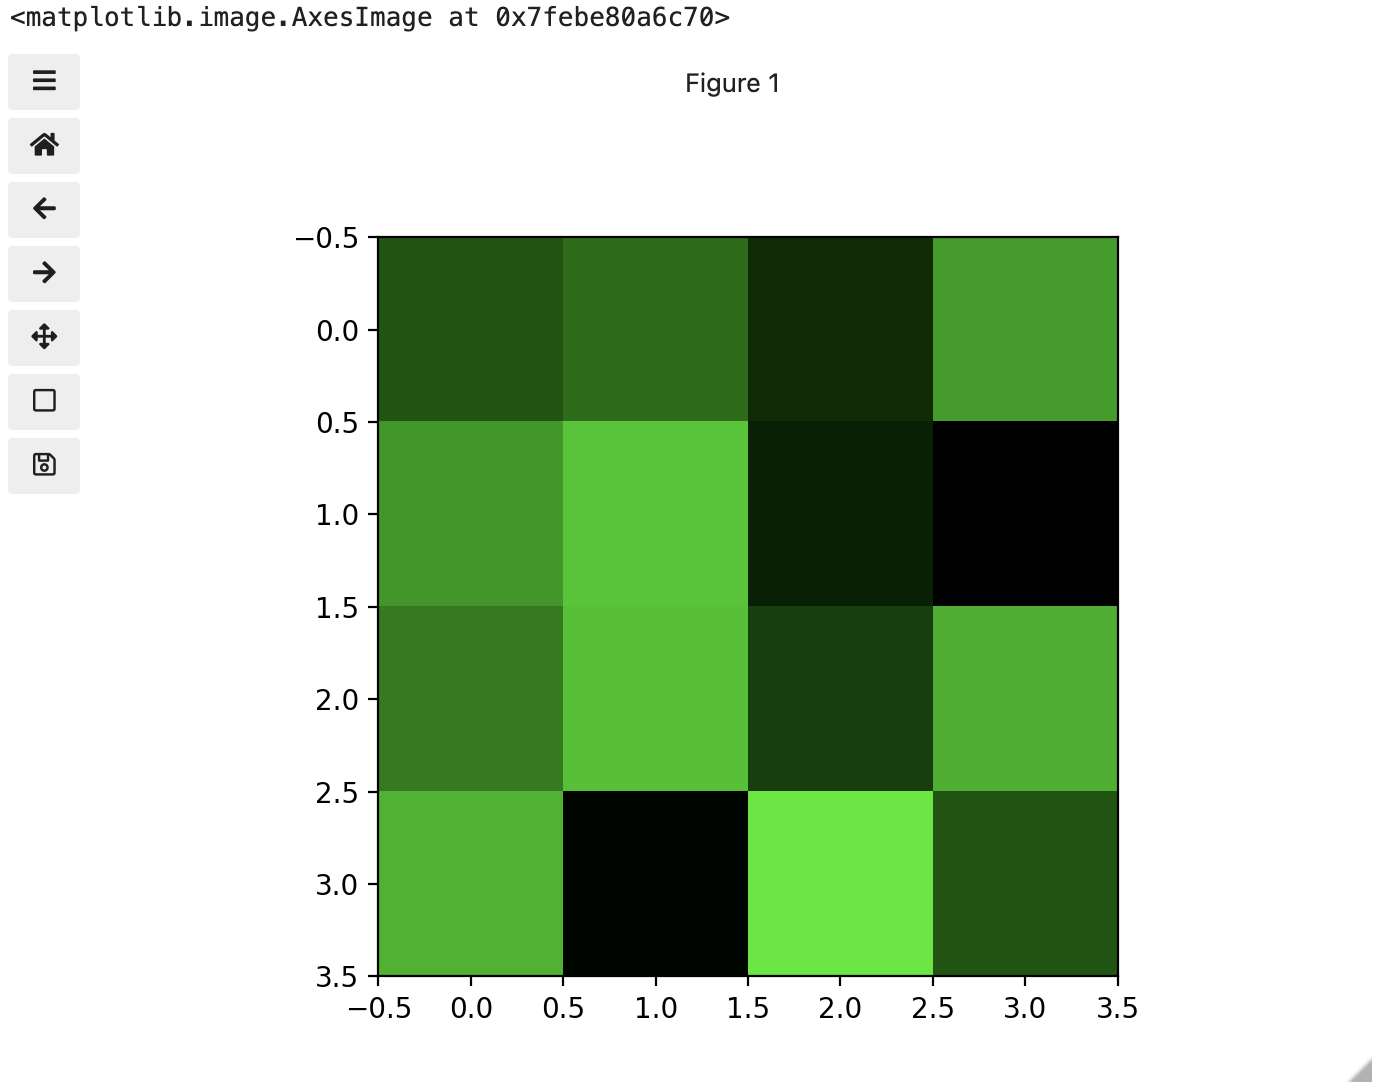
Image 1 of 1: ‘Image of green channel’
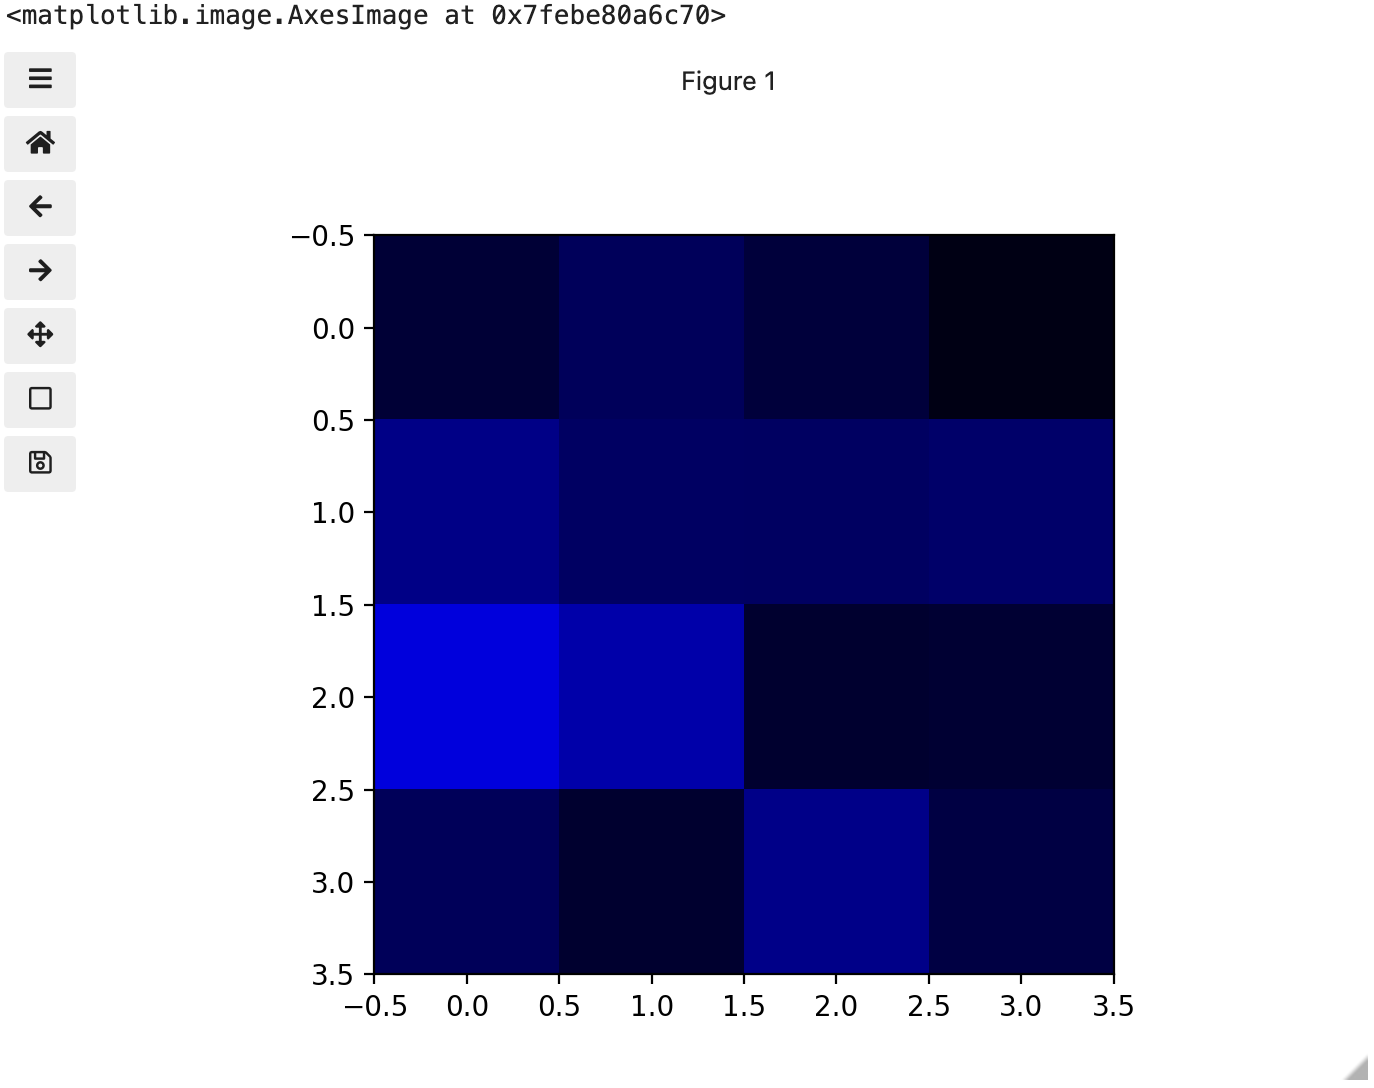
Image 1 of 1: ‘Image of blue channel’
Image 1 of 1: ‘Original image’
Image 1 of 1: ‘Enlarged, uncompressed’
Image 1 of 1: ‘Enlarged, compressed’
Image 1 of 1: ‘Uncompressed histogram’
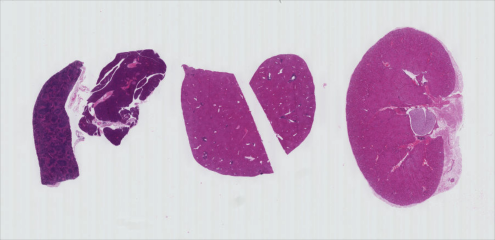
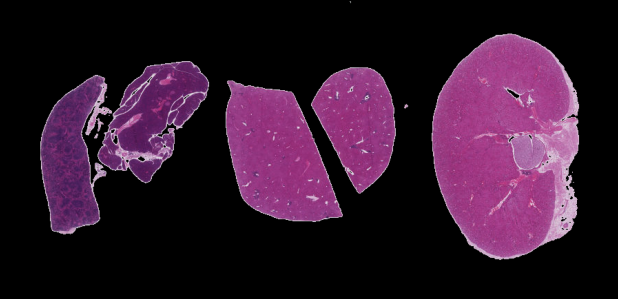
Image 1 of 1: ‘H&E image’
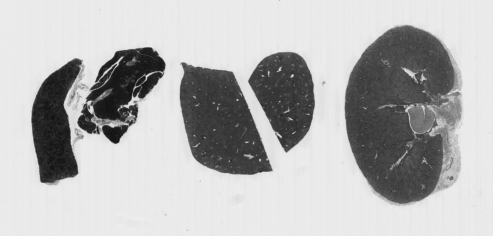
Image 1 of 1: ‘Grayscale H&E image’
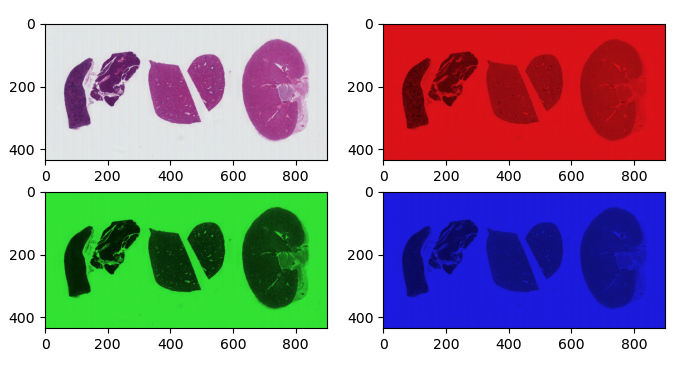
Image 1 of 1: ‘A grid showing each RGB color of the H&E image’
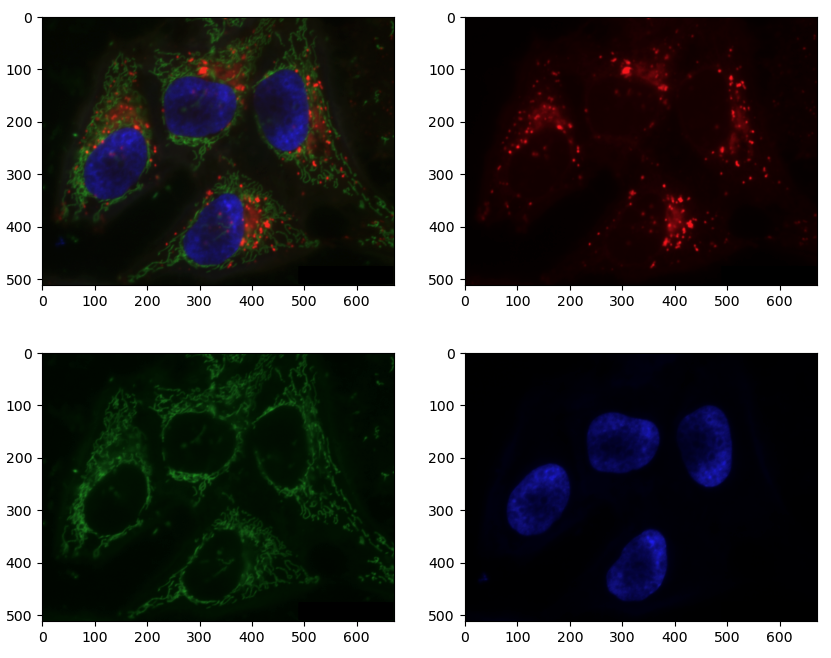
Image 1 of 1: ‘A grid showing each channel of the hela cells image’
Image 1 of 1: ‘H&E image’
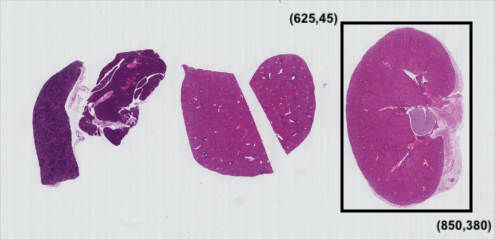
Image 1 of 1: ‘Sub picture coordinates for the kidney tissue section’
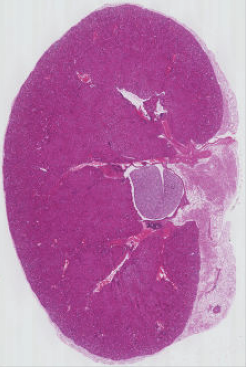
Image 1 of 1: ‘Sub picture of kidney tissue section’
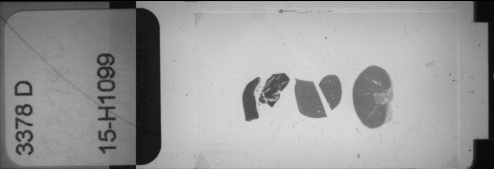
Image 1 of 1: ‘Macro slide image from H&E ndpi’
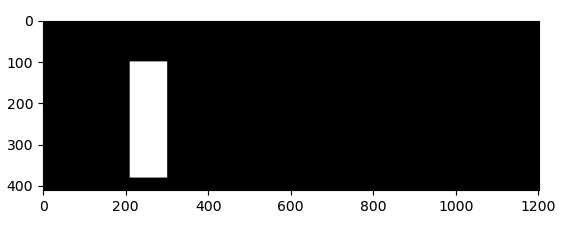
Image 1 of 1: ‘Mask selecting part of H&E slide label’
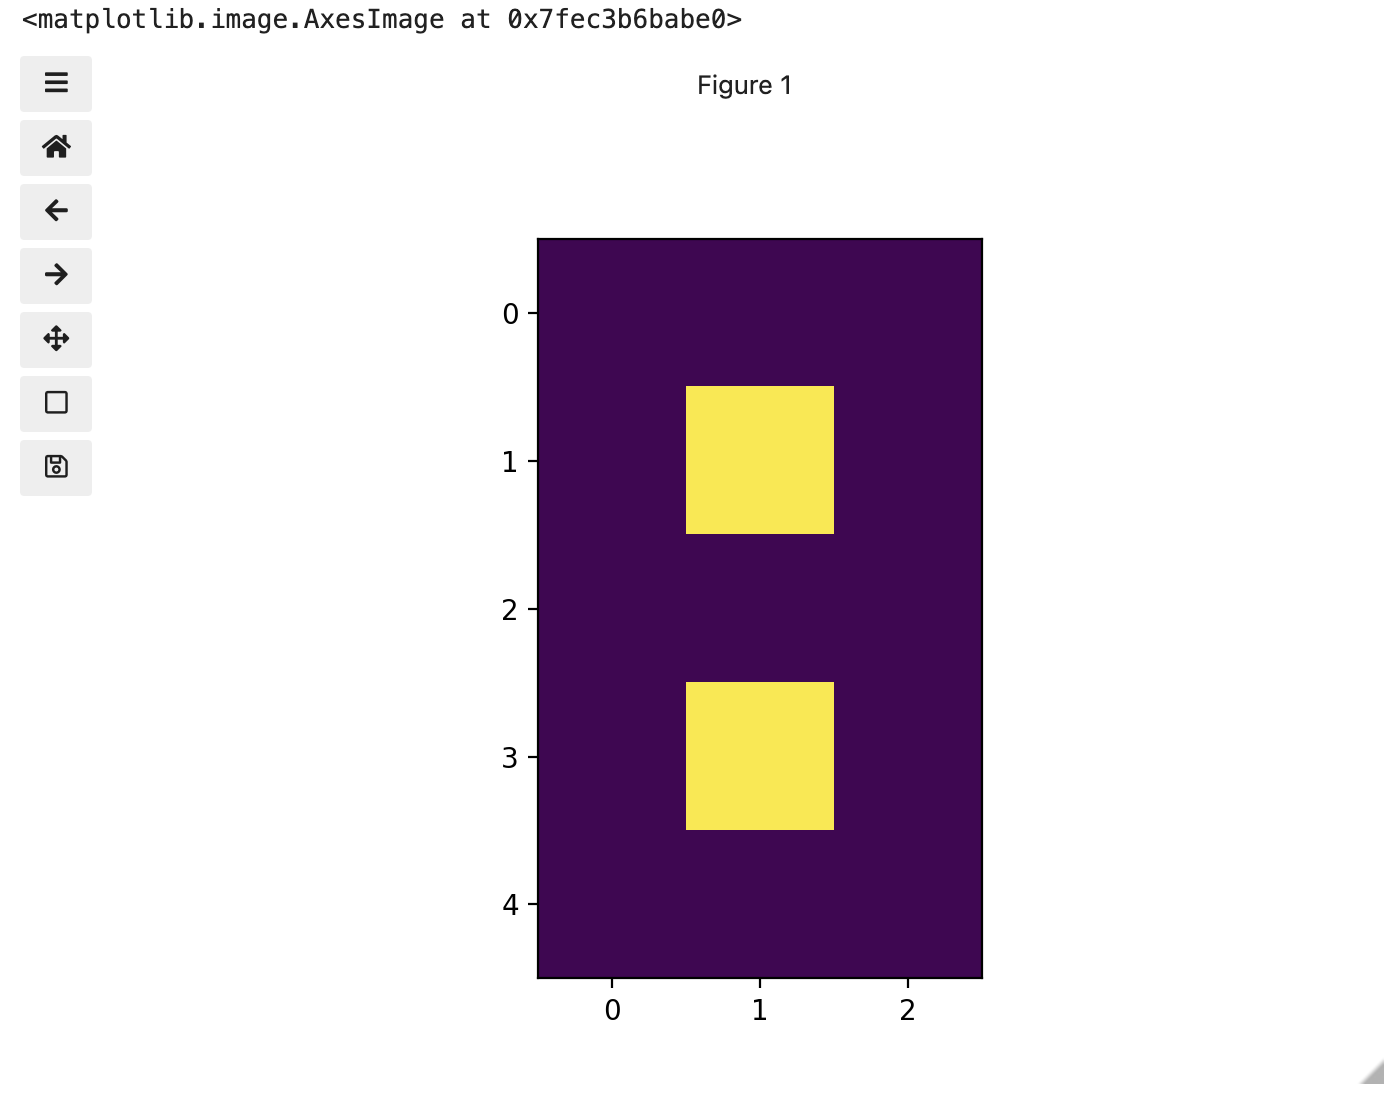
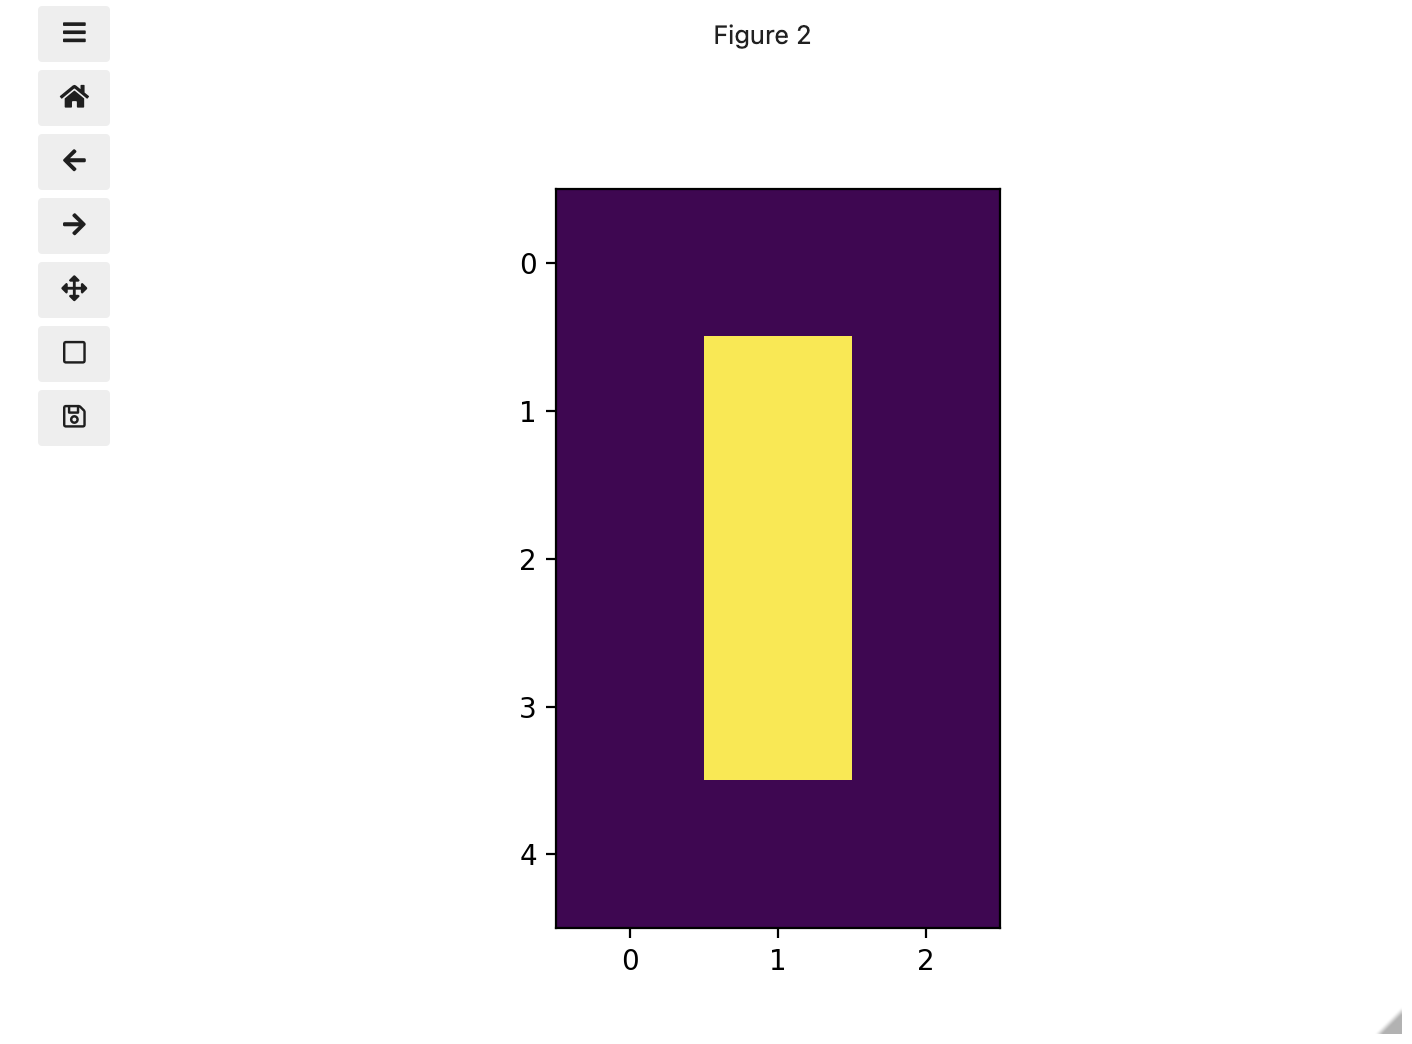
Here is what our constructed mask looks like:
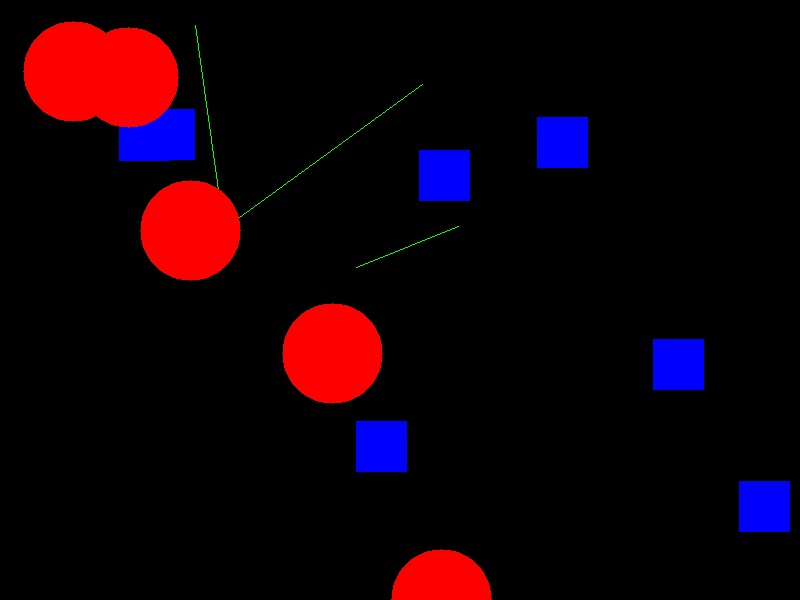
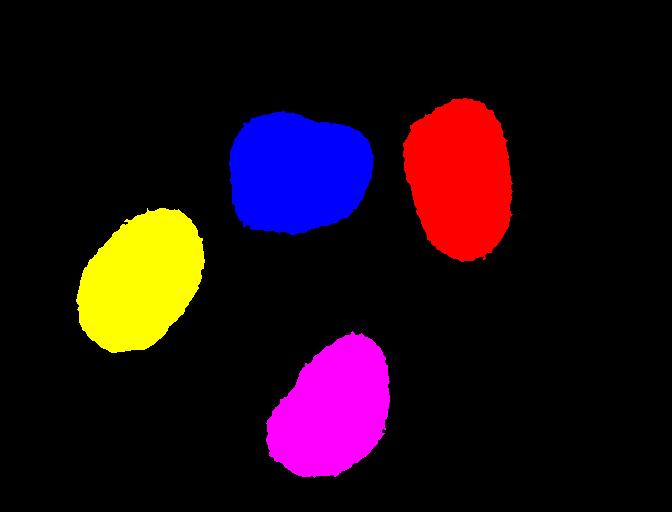
Image 1 of 1: ‘Sample shapes’
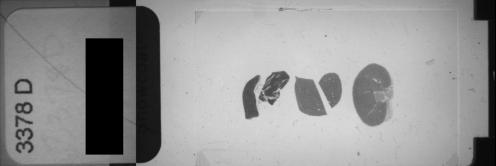
Image 1 of 1: ‘Applied mask’
Image 1 of 1: ‘H&E image’
Image 1 of 1: ‘grayscale verson of IHC image’
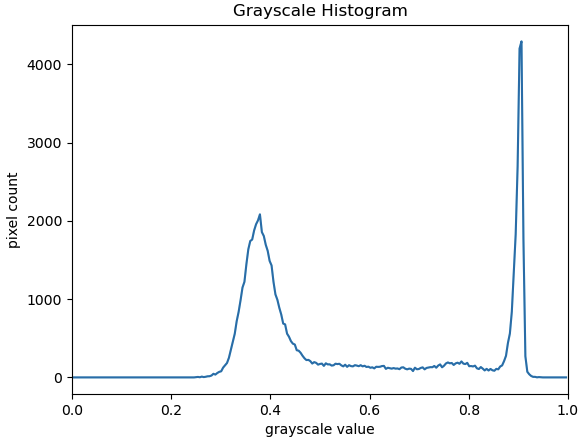
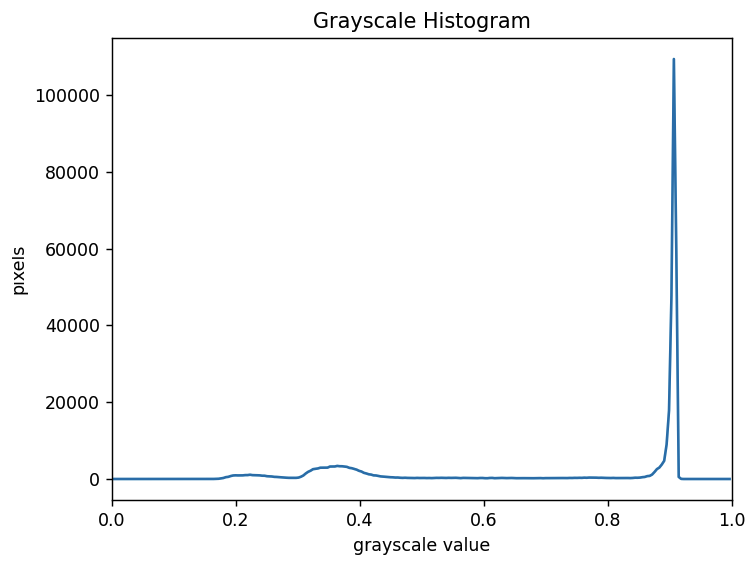
Image 1 of 1: ‘Grayscale H&E histogram’
Image 1 of 1: ‘Grayscale H&E histogram of just kidney section’
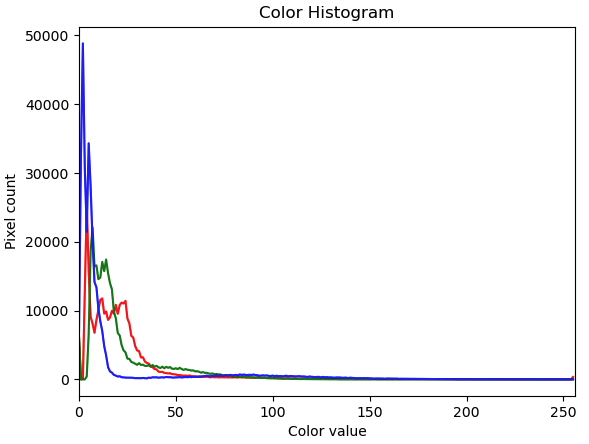
Image 1 of 1: ‘Colour histogram’
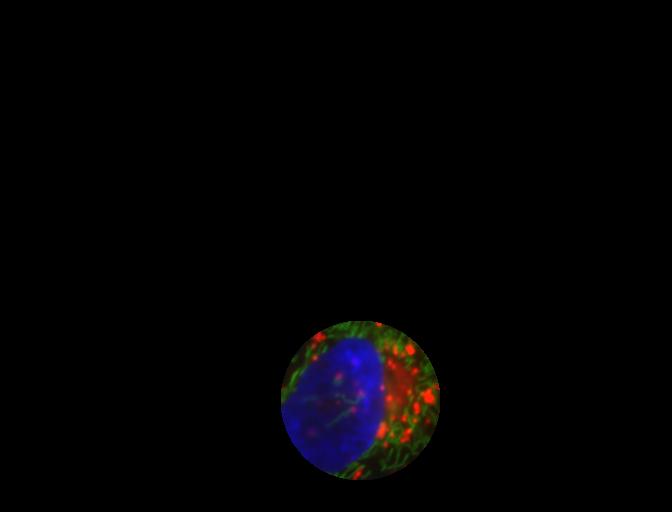
Image 1 of 1: ‘Masked cell’
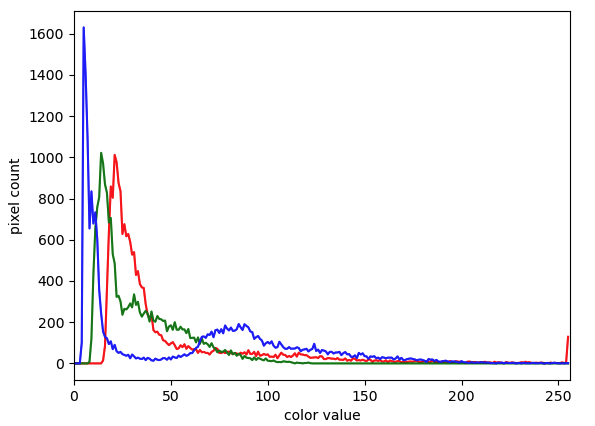
Image 1 of 1: ‘Single cell histogram’
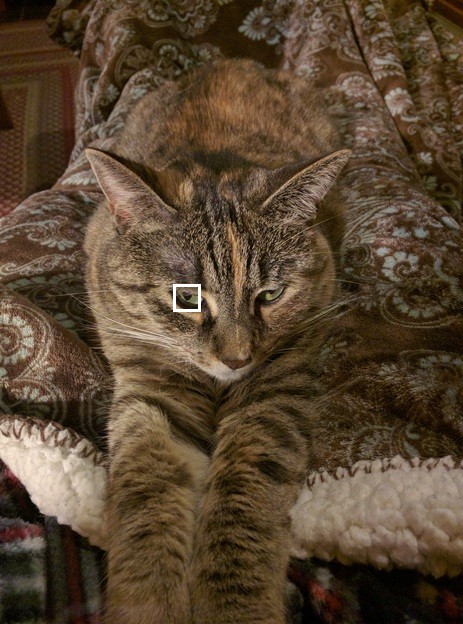
Image 1 of 1: ‘Cat image’
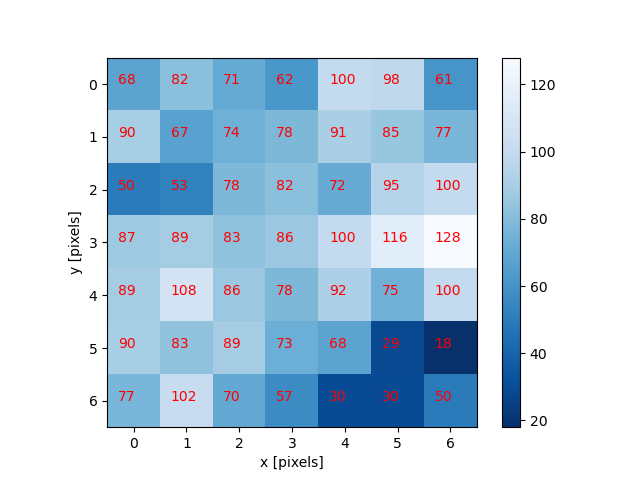
Image 1 of 1: ‘Cat eye pixels’
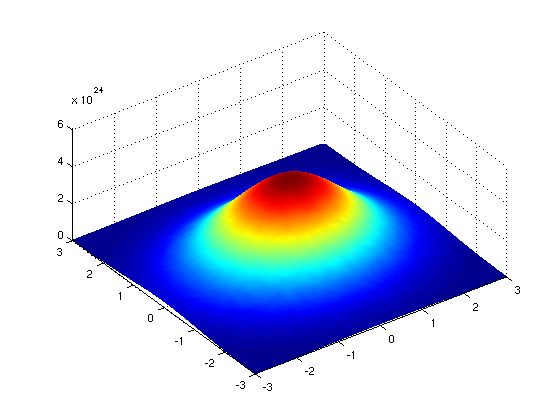
Image 1 of 1: ‘Gaussian function’
A Gaussian function maps random variables into a normal distribution
or “Bell Curve”.
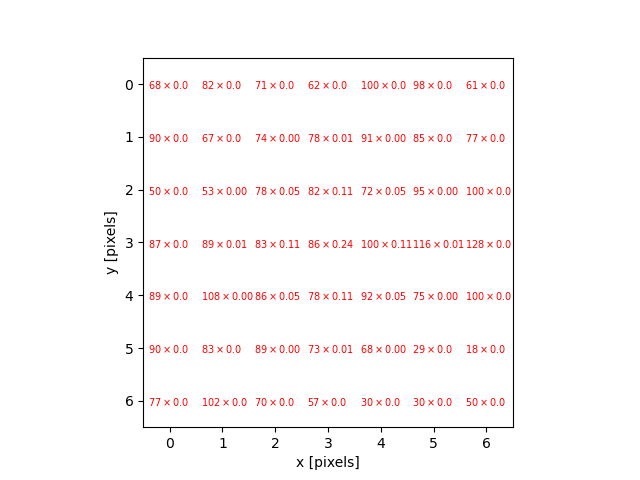
Image 1 of 1: ‘2D Gaussian function’
Image 1 of 1: ‘2D Gaussian function’
Image 1 of 1: ‘Image corner pixels’
Image 1 of 1: ‘Image multiplication’
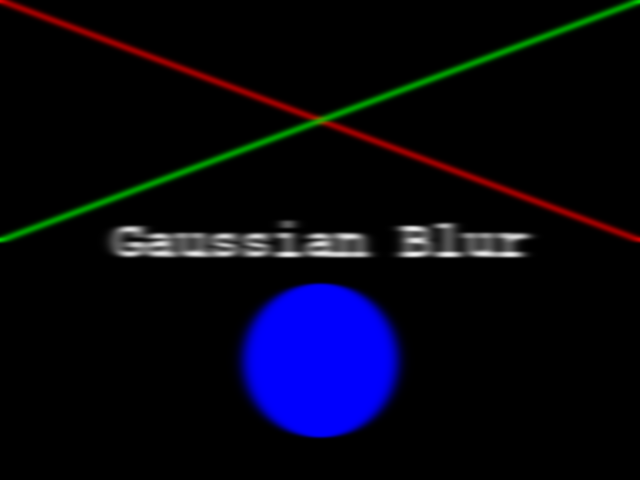
Image 1 of 1: ‘Blur demo animation’
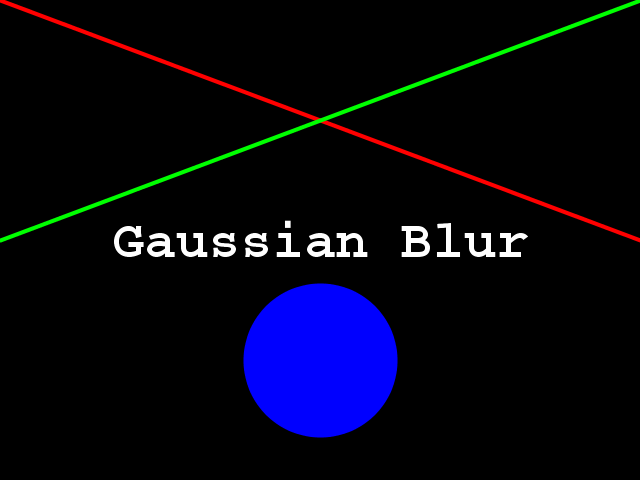
Image 1 of 1: ‘Original image’
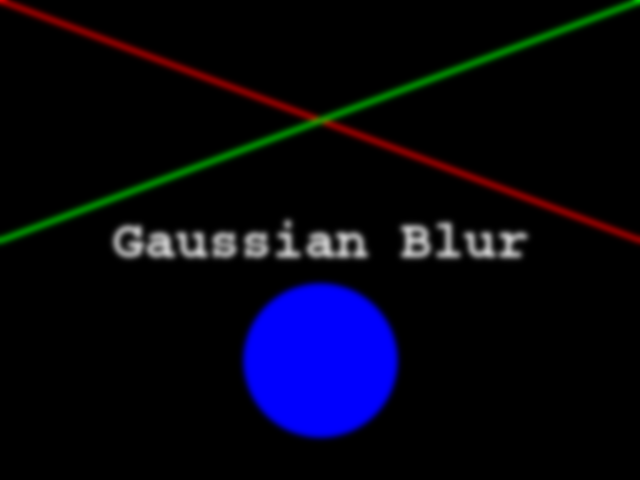
Image 1 of 1: ‘Blurred image’
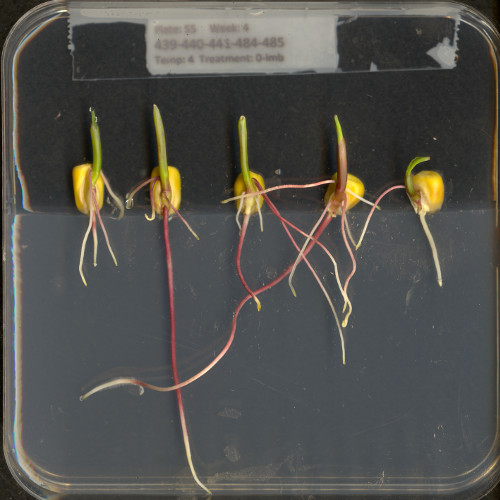
Image 1 of 1: ‘Bacteria colony’
Graysacle version of the Petri dish image
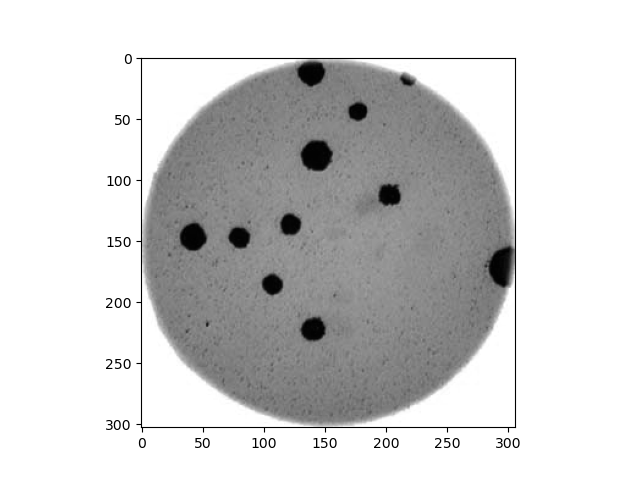
Image 1 of 1: ‘Bacteria colony image with selected pixels marker’
Grayscale Petri dish image marking selected
pixels for profiling
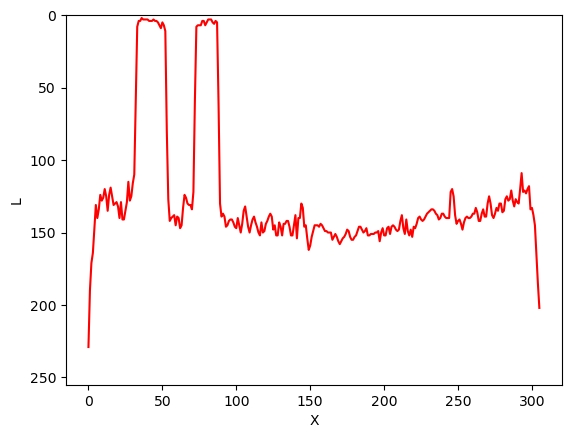
Image 1 of 1: ‘Pixel intensities profile in original image’
Intensities profile line plot of pixels along
Y=150 in original image
Image 1 of 1: ‘Blurred bacteria colony image with selected pixels marker’
Grayscale Petri dish image marking selected
pixels for profiling
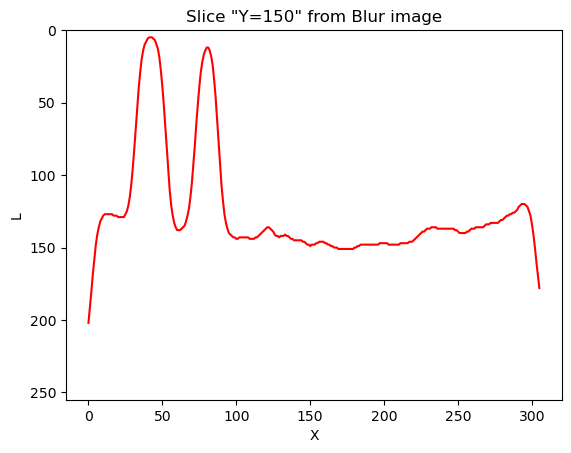
Image 1 of 1: ‘Pixel intensities profile in blurred image’
Intensities profile of pixels along Y=150 in
blurred image
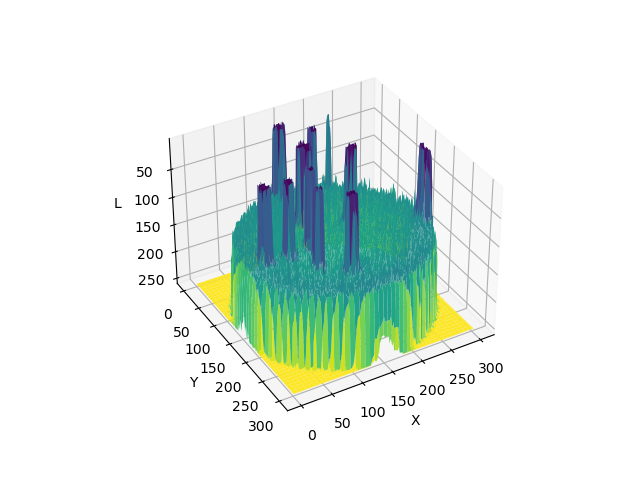
Image 1 of 1: ‘3D surface plot showing pixel intensities across the whole example Petri dish image before blurring’
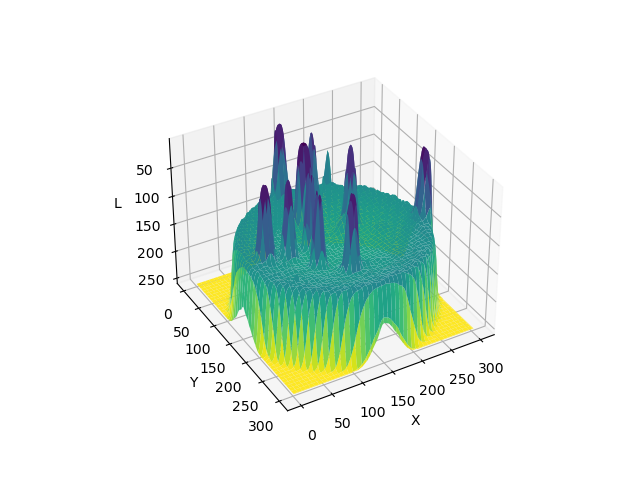
Image 1 of 1: ‘3D surface plot illustrating the smoothing effect on pixel intensities across the whole example Petri dish image after blurring’
A 3D plot of pixel intensities after Gaussian
blurring of the Petri dish image. Note the ‘smoothing’ effect on the
pixel intensities of the colonies in the image, and the ‘flattening’ of
the background noise at relatively low pixel intensities throughout the
image.
Explore
how this plot was created with matplotlib . Image credit:
Carlos H Brandt .
Image 1 of 1: ‘Rectangular kernel blurred image’
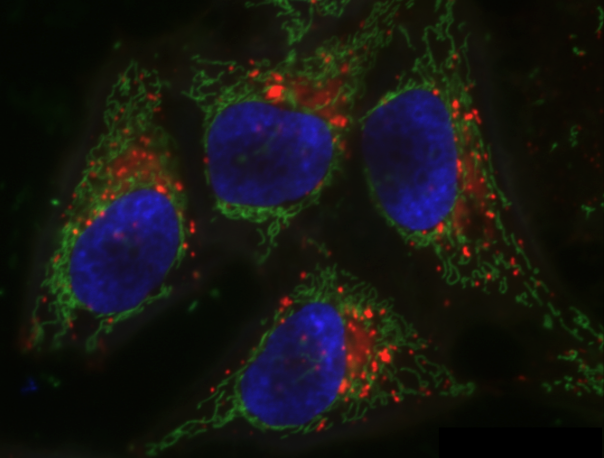
Image 1 of 1: ‘Hela cells image’
Image 1 of 1: ‘Grayscale and blurred nuclei channel’
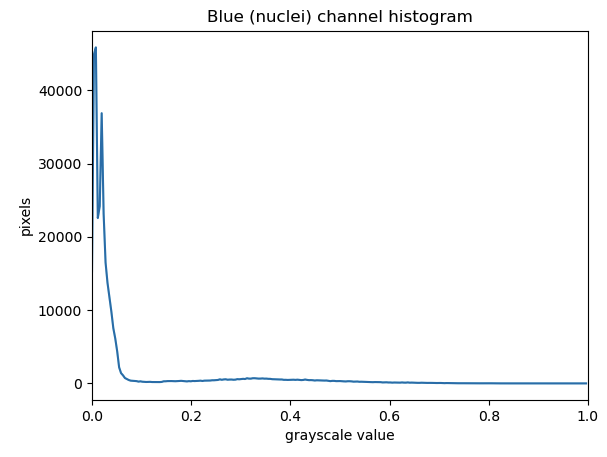
Image 1 of 1: ‘Histogram of the blue channel from the HeLa cells image’
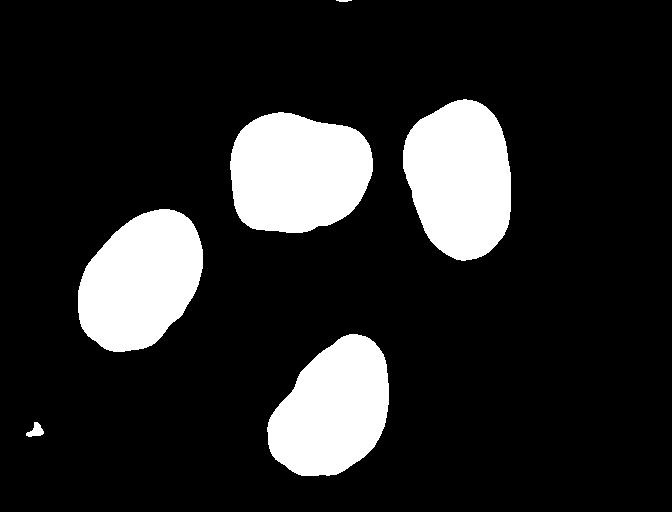
Image 1 of 1: ‘Binary mask created by thresholding the HeLa cells image’
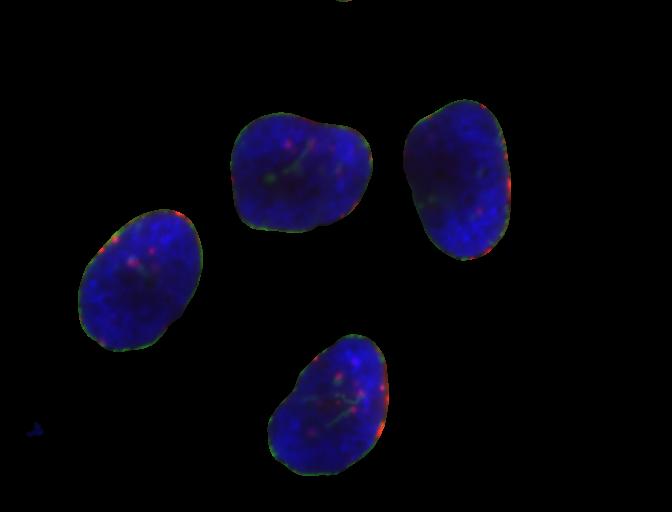
Image 1 of 1: ‘Selected nuclei after applying binary mask to the HeLa cells image’
Image 1 of 1: ‘H&E image’
Image 1 of 1: ‘grayscale H&E image’
Image 1 of 1: ‘Histogram of the grayscale H&E image blurred’
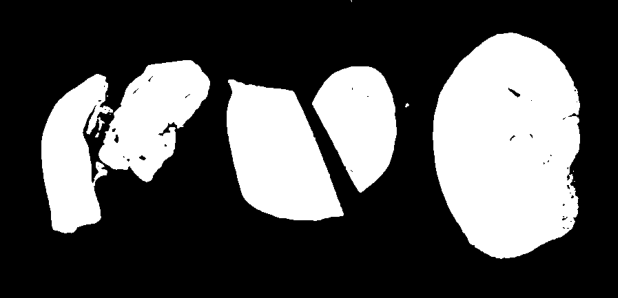
Image 1 of 1: ‘Binary mask created by thresholding the H&E image’
Image 1 of 1: ‘H&E image with background set to 0’
Image 1 of 1: ‘Histogram of the blue channel on the HeLa cells image’
Image 1 of 1: ‘Binary mask of nuclei using otsu thresholding’
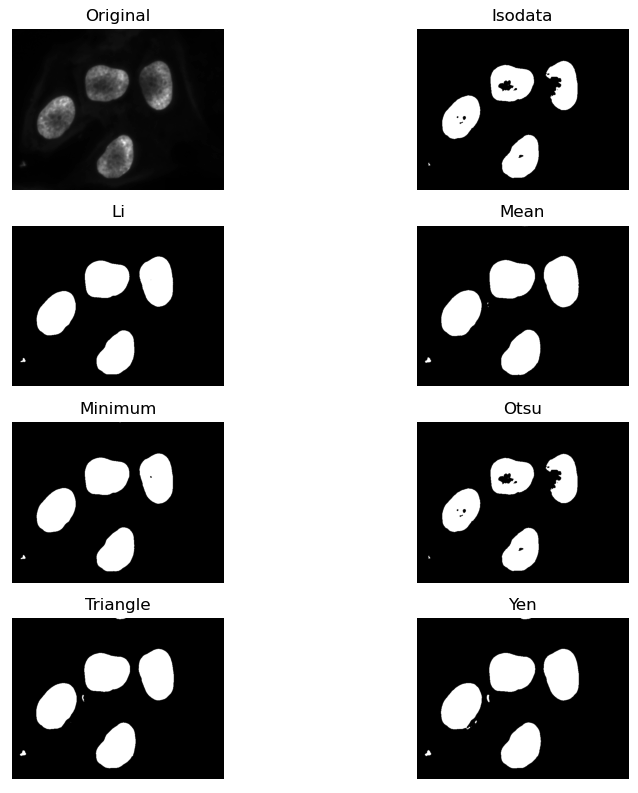
Image 1 of 1: ‘Overview test of all automated thresholders in scikit image’
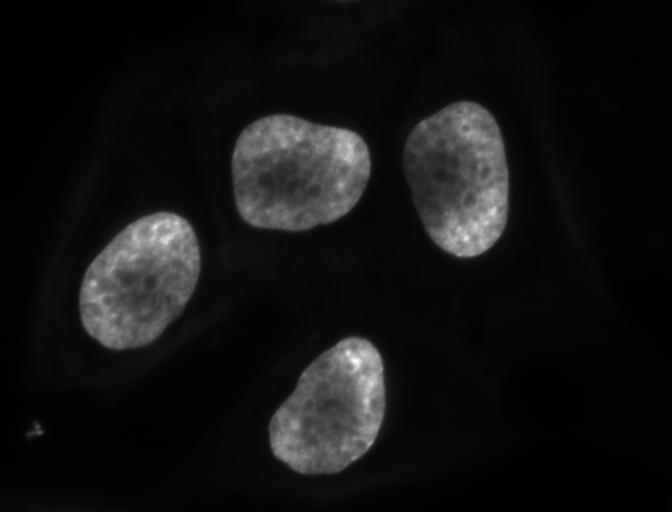
Image 1 of 1: ‘Nuclei channel of HeLa cells’
Image 1 of 1: ‘Mask created by thresholding’
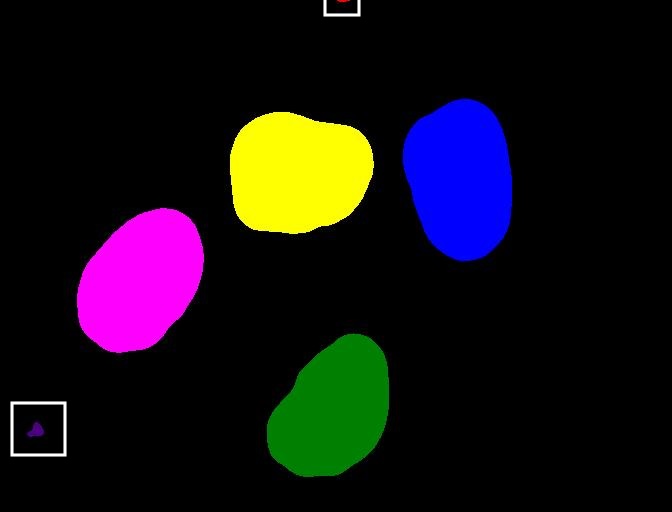
Image 1 of 1: ‘Labeled objects’
Image 1 of 1: ‘Highlighting small labeled objects in cell image’
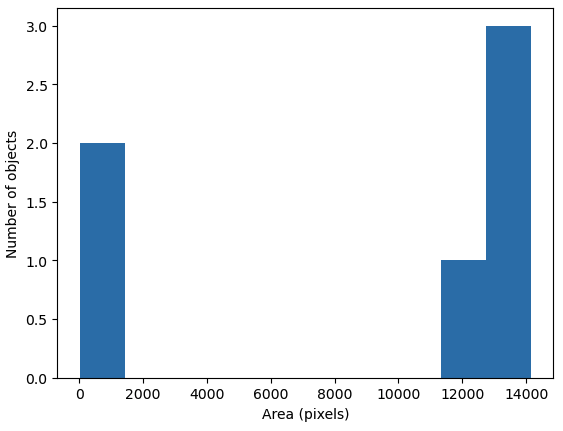
Image 1 of 1: ‘Histogram of object areas’
Image 1 of 1: ‘Objects filtered by area’
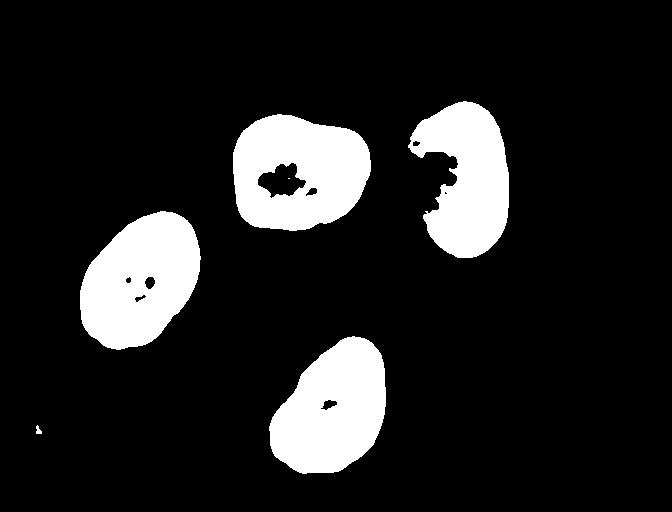
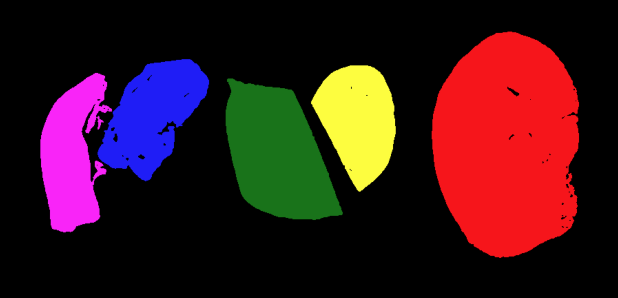
Image 1 of 1: ‘H&E tissue sections segmented’