diagnosis_qc_gigamuga_3_batches_Jackson_Lab_Bubier
Hao He
2021-08-24
Last updated: 2021-08-24
Checks: 7 0
Knit directory: DO_Opioid/
This reproducible R Markdown analysis was created with workflowr (version 1.6.2). The Checks tab describes the reproducibility checks that were applied when the results were created. The Past versions tab lists the development history.
Great! Since the R Markdown file has been committed to the Git repository, you know the exact version of the code that produced these results.
Great job! The global environment was empty. Objects defined in the global environment can affect the analysis in your R Markdown file in unknown ways. For reproduciblity it’s best to always run the code in an empty environment.
The command set.seed(20200504) was run prior to running the code in the R Markdown file. Setting a seed ensures that any results that rely on randomness, e.g. subsampling or permutations, are reproducible.
Great job! Recording the operating system, R version, and package versions is critical for reproducibility.
Nice! There were no cached chunks for this analysis, so you can be confident that you successfully produced the results during this run.
Great job! Using relative paths to the files within your workflowr project makes it easier to run your code on other machines.
Great! You are using Git for version control. Tracking code development and connecting the code version to the results is critical for reproducibility.
The results in this page were generated with repository version 33c0521. See the Past versions tab to see a history of the changes made to the R Markdown and HTML files.
Note that you need to be careful to ensure that all relevant files for the analysis have been committed to Git prior to generating the results (you can use wflow_publish or wflow_git_commit). workflowr only checks the R Markdown file, but you know if there are other scripts or data files that it depends on. Below is the status of the Git repository when the results were generated:
Ignored files:
    Ignored:    .RData
    Ignored:    .Rhistory
    Ignored:    .Rproj.user/
    Ignored:    analysis/Picture1.png
    Ignored:    data/output/

Untracked files:
    Untracked:  analysis/DDO_morphine1_second_set_69k.stdout
    Untracked:  analysis/DO_morphine1.R
    Untracked:  analysis/DO_morphine1.Rout
    Untracked:  analysis/DO_morphine1.sh
    Untracked:  analysis/DO_morphine1.stderr
    Untracked:  analysis/DO_morphine1.stdout
    Untracked:  analysis/DO_morphine1_SNP.R
    Untracked:  analysis/DO_morphine1_SNP.Rout
    Untracked:  analysis/DO_morphine1_SNP.sh
    Untracked:  analysis/DO_morphine1_SNP.stderr
    Untracked:  analysis/DO_morphine1_SNP.stdout
    Untracked:  analysis/DO_morphine1_combined.R
    Untracked:  analysis/DO_morphine1_combined.Rout
    Untracked:  analysis/DO_morphine1_combined.sh
    Untracked:  analysis/DO_morphine1_combined.stderr
    Untracked:  analysis/DO_morphine1_combined.stdout
    Untracked:  analysis/DO_morphine1_combined_69k.R
    Untracked:  analysis/DO_morphine1_combined_69k.Rout
    Untracked:  analysis/DO_morphine1_combined_69k.sh
    Untracked:  analysis/DO_morphine1_combined_69k.stderr
    Untracked:  analysis/DO_morphine1_combined_69k.stdout
    Untracked:  analysis/DO_morphine1_combined_69k_m2.R
    Untracked:  analysis/DO_morphine1_combined_69k_m2.Rout
    Untracked:  analysis/DO_morphine1_combined_69k_m2.sh
    Untracked:  analysis/DO_morphine1_combined_69k_m2.stderr
    Untracked:  analysis/DO_morphine1_combined_69k_m2.stdout
    Untracked:  analysis/DO_morphine1_combined_weight_DOB.R
    Untracked:  analysis/DO_morphine1_combined_weight_DOB.Rout
    Untracked:  analysis/DO_morphine1_combined_weight_DOB.err
    Untracked:  analysis/DO_morphine1_combined_weight_DOB.out
    Untracked:  analysis/DO_morphine1_combined_weight_DOB.sh
    Untracked:  analysis/DO_morphine1_combined_weight_DOB.stderr
    Untracked:  analysis/DO_morphine1_combined_weight_DOB.stdout
    Untracked:  analysis/DO_morphine1_combined_weight_age.R
    Untracked:  analysis/DO_morphine1_combined_weight_age.err
    Untracked:  analysis/DO_morphine1_combined_weight_age.out
    Untracked:  analysis/DO_morphine1_combined_weight_age.sh
    Untracked:  analysis/DO_morphine1_combined_weight_age_GAMMT.R
    Untracked:  analysis/DO_morphine1_combined_weight_age_GAMMT.err
    Untracked:  analysis/DO_morphine1_combined_weight_age_GAMMT.out
    Untracked:  analysis/DO_morphine1_combined_weight_age_GAMMT.sh
    Untracked:  analysis/DO_morphine1_combined_weight_age_GAMMT_chr19.R
    Untracked:  analysis/DO_morphine1_combined_weight_age_GAMMT_chr19.err
    Untracked:  analysis/DO_morphine1_combined_weight_age_GAMMT_chr19.out
    Untracked:  analysis/DO_morphine1_combined_weight_age_GAMMT_chr19.sh
    Untracked:  analysis/DO_morphine1_cph.R
    Untracked:  analysis/DO_morphine1_cph.Rout
    Untracked:  analysis/DO_morphine1_cph.sh
    Untracked:  analysis/DO_morphine1_second_set.R
    Untracked:  analysis/DO_morphine1_second_set.Rout
    Untracked:  analysis/DO_morphine1_second_set.sh
    Untracked:  analysis/DO_morphine1_second_set.stderr
    Untracked:  analysis/DO_morphine1_second_set.stdout
    Untracked:  analysis/DO_morphine1_second_set_69k.R
    Untracked:  analysis/DO_morphine1_second_set_69k.Rout
    Untracked:  analysis/DO_morphine1_second_set_69k.sh
    Untracked:  analysis/DO_morphine1_second_set_69k.stderr
    Untracked:  analysis/DO_morphine1_second_set_SNP.R
    Untracked:  analysis/DO_morphine1_second_set_SNP.Rout
    Untracked:  analysis/DO_morphine1_second_set_SNP.sh
    Untracked:  analysis/DO_morphine1_second_set_SNP.stderr
    Untracked:  analysis/DO_morphine1_second_set_SNP.stdout
    Untracked:  analysis/DO_morphine1_second_set_weight_DOB.R
    Untracked:  analysis/DO_morphine1_second_set_weight_DOB.Rout
    Untracked:  analysis/DO_morphine1_second_set_weight_DOB.err
    Untracked:  analysis/DO_morphine1_second_set_weight_DOB.out
    Untracked:  analysis/DO_morphine1_second_set_weight_DOB.sh
    Untracked:  analysis/DO_morphine1_second_set_weight_DOB.stderr
    Untracked:  analysis/DO_morphine1_second_set_weight_DOB.stdout
    Untracked:  analysis/DO_morphine1_second_set_weight_age.R
    Untracked:  analysis/DO_morphine1_second_set_weight_age.Rout
    Untracked:  analysis/DO_morphine1_second_set_weight_age.err
    Untracked:  analysis/DO_morphine1_second_set_weight_age.out
    Untracked:  analysis/DO_morphine1_second_set_weight_age.sh
    Untracked:  analysis/DO_morphine1_second_set_weight_age.stderr
    Untracked:  analysis/DO_morphine1_second_set_weight_age.stdout
    Untracked:  analysis/DO_morphine1_weight_DOB.R
    Untracked:  analysis/DO_morphine1_weight_DOB.sh
    Untracked:  analysis/DO_morphine1_weight_age.R
    Untracked:  analysis/DO_morphine1_weight_age.sh
    Untracked:  analysis/DO_morphine_gemma.R
    Untracked:  analysis/DO_morphine_gemma.err
    Untracked:  analysis/DO_morphine_gemma.out
    Untracked:  analysis/DO_morphine_gemma.sh
    Untracked:  analysis/DO_morphine_gemma_firstmin.R
    Untracked:  analysis/DO_morphine_gemma_firstmin.err
    Untracked:  analysis/DO_morphine_gemma_firstmin.out
    Untracked:  analysis/DO_morphine_gemma_firstmin.sh
    Untracked:  analysis/DO_morphine_gemma_withpermu.R
    Untracked:  analysis/DO_morphine_gemma_withpermu.err
    Untracked:  analysis/DO_morphine_gemma_withpermu.out
    Untracked:  analysis/DO_morphine_gemma_withpermu.sh
    Untracked:  analysis/DO_morphine_gemma_withpermu_firstbatch_min.depression.R
    Untracked:  analysis/DO_morphine_gemma_withpermu_firstbatch_min.depression.err
    Untracked:  analysis/DO_morphine_gemma_withpermu_firstbatch_min.depression.out
    Untracked:  analysis/DO_morphine_gemma_withpermu_firstbatch_min.depression.sh
    Untracked:  analysis/Plot_DO_morphine1_SNP.R
    Untracked:  analysis/Plot_DO_morphine1_SNP.Rout
    Untracked:  analysis/Plot_DO_morphine1_SNP.sh
    Untracked:  analysis/Plot_DO_morphine1_SNP.stderr
    Untracked:  analysis/Plot_DO_morphine1_SNP.stdout
    Untracked:  analysis/Plot_DO_morphine1_second_set_SNP.R
    Untracked:  analysis/Plot_DO_morphine1_second_set_SNP.Rout
    Untracked:  analysis/Plot_DO_morphine1_second_set_SNP.sh
    Untracked:  analysis/Plot_DO_morphine1_second_set_SNP.stderr
    Untracked:  analysis/Plot_DO_morphine1_second_set_SNP.stdout
    Untracked:  analysis/scripts/
    Untracked:  analysis/workflow_proc.R
    Untracked:  analysis/workflow_proc.sh
    Untracked:  analysis/workflow_proc.stderr
    Untracked:  analysis/workflow_proc.stdout
    Untracked:  analysis/x.R
    Untracked:  code/cfw/
    Untracked:  code/gemma_plot.R
    Untracked:  code/reconst_utils.R
    Untracked:  data/69k_grid_pgmap.RData
    Untracked:  data/FinalReport/
    Untracked:  data/GM/
    Untracked:  data/GM_covar.csv
    Untracked:  data/GM_covar_07092018_morphine.csv
    Untracked:  data/Jackson_Lab_Bubier_MURGIGV01/
    Untracked:  data/MasterMorphine Second Set DO w DOB2.xlsx
    Untracked:  data/MasterMorphine Second Set DO.xlsx
    Untracked:  data/cc_variants.sqlite
    Untracked:  data/combined/
    Untracked:  data/first/
    Untracked:  data/founder_geno.csv
    Untracked:  data/genetic_map.csv
    Untracked:  data/gm.json
    Untracked:  data/gwas.sh
    Untracked:  data/marker_grid_0.02cM_plus.txt
    Untracked:  data/mouse_genes_mgi.sqlite
    Untracked:  data/pheno.csv
    Untracked:  data/pheno_qtl2.csv
    Untracked:  data/pheno_qtl2_07092018_morphine.csv
    Untracked:  data/pheno_qtl2_w_dob.csv
    Untracked:  data/physical_map.csv
    Untracked:  data/rnaseq/
    Untracked:  data/sample_geno.csv
    Untracked:  data/second/
    Untracked:  figure/
    Untracked:  glimma-plots/
    Untracked:  output/DO_morphine_Min.depression.png
    Untracked:  output/DO_morphine_Min.depression22222_violin_chr5.pdf
    Untracked:  output/DO_morphine_Min.depression_coefplot.pdf
    Untracked:  output/DO_morphine_Min.depression_coefplot_blup.pdf
    Untracked:  output/DO_morphine_Min.depression_coefplot_blup_chr5.png
    Untracked:  output/DO_morphine_Min.depression_coefplot_blup_chrX.png
    Untracked:  output/DO_morphine_Min.depression_coefplot_chr5.png
    Untracked:  output/DO_morphine_Min.depression_coefplot_chrX.png
    Untracked:  output/DO_morphine_Min.depression_peak_genes_chr5.png
    Untracked:  output/DO_morphine_Min.depression_violin_chr5.png
    Untracked:  output/DO_morphine_Recovery.Time.png
    Untracked:  output/DO_morphine_Recovery.Time_coefplot.pdf
    Untracked:  output/DO_morphine_Recovery.Time_coefplot_blup.pdf
    Untracked:  output/DO_morphine_Recovery.Time_coefplot_blup_chr11.png
    Untracked:  output/DO_morphine_Recovery.Time_coefplot_blup_chr4.png
    Untracked:  output/DO_morphine_Recovery.Time_coefplot_blup_chr7.png
    Untracked:  output/DO_morphine_Recovery.Time_coefplot_blup_chr9.png
    Untracked:  output/DO_morphine_Recovery.Time_coefplot_chr11.png
    Untracked:  output/DO_morphine_Recovery.Time_coefplot_chr4.png
    Untracked:  output/DO_morphine_Recovery.Time_coefplot_chr7.png
    Untracked:  output/DO_morphine_Recovery.Time_coefplot_chr9.png
    Untracked:  output/DO_morphine_Status_bin.png
    Untracked:  output/DO_morphine_Status_bin_coefplot.pdf
    Untracked:  output/DO_morphine_Status_bin_coefplot_blup.pdf
    Untracked:  output/DO_morphine_Survival.Time.png
    Untracked:  output/DO_morphine_Survival.Time_coefplot.pdf
    Untracked:  output/DO_morphine_Survival.Time_coefplot_blup.pdf
    Untracked:  output/DO_morphine_Survival.Time_coefplot_blup_chr17.png
    Untracked:  output/DO_morphine_Survival.Time_coefplot_blup_chr8.png
    Untracked:  output/DO_morphine_Survival.Time_coefplot_chr17.png
    Untracked:  output/DO_morphine_Survival.Time_coefplot_chr8.png
    Untracked:  output/DO_morphine_combine_batch_peak_violin.pdf
    Untracked:  output/DO_morphine_combined_69k_m2_Min.depression.png
    Untracked:  output/DO_morphine_combined_69k_m2_Min.depression_coefplot.pdf
    Untracked:  output/DO_morphine_combined_69k_m2_Min.depression_coefplot_blup.pdf
    Untracked:  output/DO_morphine_combined_69k_m2_Recovery.Time.png
    Untracked:  output/DO_morphine_combined_69k_m2_Recovery.Time_coefplot.pdf
    Untracked:  output/DO_morphine_combined_69k_m2_Recovery.Time_coefplot_blup.pdf
    Untracked:  output/DO_morphine_combined_69k_m2_Status_bin.png
    Untracked:  output/DO_morphine_combined_69k_m2_Status_bin_coefplot.pdf
    Untracked:  output/DO_morphine_combined_69k_m2_Status_bin_coefplot_blup.pdf
    Untracked:  output/DO_morphine_combined_69k_m2_Survival.Time.png
    Untracked:  output/DO_morphine_combined_69k_m2_Survival.Time_coefplot.pdf
    Untracked:  output/DO_morphine_combined_69k_m2_Survival.Time_coefplot_blup.pdf
    Untracked:  output/DO_morphine_coxph_24hrs_kinship_QTL.png
    Untracked:  output/DO_morphine_cphout.RData
    Untracked:  output/DO_morphine_first_batch_peak_in_second_batch_violin.pdf
    Untracked:  output/DO_morphine_first_batch_peak_in_second_batch_violin_sidebyside.pdf
    Untracked:  output/DO_morphine_first_batch_peak_violin.pdf
    Untracked:  output/DO_morphine_operm.cph.RData
    Untracked:  output/DO_morphine_second_batch_on_first_batch_peak_violin.pdf
    Untracked:  output/DO_morphine_second_batch_peak_ch6surv_on_first_batchviolin.pdf
    Untracked:  output/DO_morphine_second_batch_peak_ch6surv_on_first_batchviolin2.pdf
    Untracked:  output/DO_morphine_second_batch_peak_in_first_batch_violin.pdf
    Untracked:  output/DO_morphine_second_batch_peak_in_first_batch_violin_sidebyside.pdf
    Untracked:  output/DO_morphine_second_batch_peak_violin.pdf
    Untracked:  output/DO_morphine_secondbatch_69k_Min.depression.png
    Untracked:  output/DO_morphine_secondbatch_69k_Min.depression_coefplot.pdf
    Untracked:  output/DO_morphine_secondbatch_69k_Min.depression_coefplot_blup.pdf
    Untracked:  output/DO_morphine_secondbatch_69k_Recovery.Time.png
    Untracked:  output/DO_morphine_secondbatch_69k_Recovery.Time_coefplot.pdf
    Untracked:  output/DO_morphine_secondbatch_69k_Recovery.Time_coefplot_blup.pdf
    Untracked:  output/DO_morphine_secondbatch_69k_Status_bin.png
    Untracked:  output/DO_morphine_secondbatch_69k_Status_bin_coefplot.pdf
    Untracked:  output/DO_morphine_secondbatch_69k_Status_bin_coefplot_blup.pdf
    Untracked:  output/DO_morphine_secondbatch_69k_Survival.Time.png
    Untracked:  output/DO_morphine_secondbatch_69k_Survival.Time_coefplot.pdf
    Untracked:  output/DO_morphine_secondbatch_69k_Survival.Time_coefplot_blup.pdf
    Untracked:  output/DO_morphine_secondbatch_Min.depression.png
    Untracked:  output/DO_morphine_secondbatch_Min.depression_coefplot.pdf
    Untracked:  output/DO_morphine_secondbatch_Min.depression_coefplot_blup.pdf
    Untracked:  output/DO_morphine_secondbatch_Recovery.Time.png
    Untracked:  output/DO_morphine_secondbatch_Recovery.Time_coefplot.pdf
    Untracked:  output/DO_morphine_secondbatch_Recovery.Time_coefplot_blup.pdf
    Untracked:  output/DO_morphine_secondbatch_Status_bin.png
    Untracked:  output/DO_morphine_secondbatch_Status_bin_coefplot.pdf
    Untracked:  output/DO_morphine_secondbatch_Status_bin_coefplot_blup.pdf
    Untracked:  output/DO_morphine_secondbatch_Survival.Time.png
    Untracked:  output/DO_morphine_secondbatch_Survival.Time_coefplot.pdf
    Untracked:  output/DO_morphine_secondbatch_Survival.Time_coefplot_blup.pdf
    Untracked:  output/apr_69kchr_combined.RData
    Untracked:  output/apr_69kchr_k_loco_combined.rds
    Untracked:  output/apr_69kchr_second_set.RData
    Untracked:  output/combine_batch_variation.RData
    Untracked:  output/combined_gm.RData
    Untracked:  output/combined_gm.k_loco.rds
    Untracked:  output/combined_gm.k_overall.rds
    Untracked:  output/combined_gm.probs_36state.rds
    Untracked:  output/combined_gm.probs_8state.rds
    Untracked:  output/coxph/
    Untracked:  output/do.morphine.RData
    Untracked:  output/do.morphine.k_loco.rds
    Untracked:  output/do.morphine.probs_36state.rds
    Untracked:  output/do.morphine.probs_8state.rds
    Untracked:  output/first_batch_variation.RData
    Untracked:  output/old_temp/
    Untracked:  output/pr_69k_combined.RData
    Untracked:  output/pr_69kchr_combined.RData
    Untracked:  output/pr_69kchr_second_set.RData
    Untracked:  output/qtl.morphine.69k.out.combined.RData
    Untracked:  output/qtl.morphine.69k.out.combined_m2.RData
    Untracked:  output/qtl.morphine.69k.out.second_set.RData
    Untracked:  output/qtl.morphine.operm.RData
    Untracked:  output/qtl.morphine.out.RData
    Untracked:  output/qtl.morphine.out.combined_gm.RData
    Untracked:  output/qtl.morphine.out.combined_weight_DOB.RData
    Untracked:  output/qtl.morphine.out.combined_weight_age.RData
    Untracked:  output/qtl.morphine.out.second_set.RData
    Untracked:  output/qtl.morphine.out.second_set.weight_DOB.RData
    Untracked:  output/qtl.morphine.out.second_set.weight_age.RData
    Untracked:  output/qtl.morphine.out.weight_DOB.RData
    Untracked:  output/qtl.morphine.out.weight_age.RData
    Untracked:  output/qtl.morphine1.snpout.RData
    Untracked:  output/qtl.morphine2.snpout.RData
    Untracked:  output/second_batch_variation.RData
    Untracked:  output/second_set_apr_69kchr_k_loco.rds
    Untracked:  output/second_set_gm.RData
    Untracked:  output/second_set_gm.k_loco.rds
    Untracked:  output/second_set_gm.probs_36state.rds
    Untracked:  output/second_set_gm.probs_8state.rds
    Untracked:  output/topSNP_chr5_mindepression.csv
    Untracked:  output/zoompeak_Min.depression_9.pdf
    Untracked:  output/zoompeak_Recovery.Time_16.pdf
    Untracked:  output/zoompeak_Status_bin_11.pdf
    Untracked:  output/zoompeak_Survival.Time_1.pdf

Unstaged changes:
    Modified:   _workflowr.yml
    Modified:   analysis/batches_3_do_diversity_report.Rmd
Note that any generated files, e.g. HTML, png, CSS, etc., are not included in this status report because it is ok for generated content to have uncommitted changes.
These are the previous versions of the repository in which changes were made to the R Markdown (analysis/diagnosis_qc_gigamuga_3_batches_Jackson_Lab_Bubier.Rmd) and HTML (docs/diagnosis_qc_gigamuga_3_batches_Jackson_Lab_Bubier.html) files. If you’ve configured a remote Git repository (see ?wflow_git_remote), click on the hyperlinks in the table below to view the files as they were in that past version.
| File | Version | Author | Date | Message |
|---|---|---|---|---|
| Rmd | 33c0521 | xhyuo | 2021-08-24 | add batch 20210809 |
| html | 3268005 | xhyuo | 2021-07-09 | Build site. |
| Rmd | 5b3aaa6 | xhyuo | 2021-07-09 | update one batch |
| html | f5b6ad7 | xhyuo | 2021-06-01 | Build site. |
| Rmd | b07104a | xhyuo | 2021-06-01 | 3batches screensize |
| html | 11cf315 | xhyuo | 2021-06-01 | Build site. |
| Rmd | 1f46505 | xhyuo | 2021-06-01 | 3batches |
Genotype diagnostics for diversity outbred mice
We first load the R/qtl2 package and the data. We’ll also load the R/broman package for some utilities and plotting functions, and R/qtlcharts for interactive graphs.
library
library(broman)
library(qtl2)
library(qtlcharts)
library(ggplot2)
library(ggrepel)
library(DOQTL)
library(mclust)
library(tidyverse)
library(reshape2)
library(DT)
source("code/reconst_utils.R")
options(stringsAsFactors = F)
Generate json file for 3 batches
#total sample id
#load json file for the 3 batches
gm <- get(load("data/Jackson_Lab_Bubier_MURGIGV01/gm_3batches.RData"))

gm
Object of class cross2 (crosstype "do")
Total individuals 412
No. genotyped individuals 412
No. phenotyped individuals 412
No. with both geno & pheno 412
No. phenotypes 1
No. covariates 4
No. phenotype covariates 0
No. chromosomes 20
Total markers 112728
No. markers by chr:
1 2 3 4 5 6 7 8 9 10 11 12 13 14 15 16
8555 8666 6420 6615 6571 6443 6294 5677 5870 5447 6352 5167 5274 5039 4555 4369
17 18 19 X
4330 4002 3108 3974 Missing data per sample
percent_missing <- n_missing(gm, "ind", "prop")*100
miss_dat <- data.frame(Mouse=seq_along(percent_missing),
                       id = names(percent_missing),
                       Percent_missing_genotype_data = percent_missing,
                       batch = as.character(do.call(rbind.data.frame,
                                                      strsplit(ind_ids(gm), "_"))[,5]),
                       labels = as.character(do.call(rbind.data.frame,
                                                       strsplit(ind_ids(gm), "V01_"))[,2]))
miss_dat <- miss_dat %>%
  mutate(labels2 = case_when(
    percent_missing <= 10 ~ "",
    TRUE ~ labels
  ))

#iplot
setScreenSize(height = 300, width = 400)
Set screen size to height=300 x width=400iplot(miss_dat$Mouse,
miss_dat$Percent_missing_genotype_data,
indID=paste0(miss_dat$labels, " (", round(miss_dat$Percent_missing_genotype_data,2), "%)"),
chartOpts=list(xlab="Mouse",
ylab="Percent missing genotype data",
ylim=c(0, 100)))#save into pdf
pdf(file = "data/Jackson_Lab_Bubier_MURGIGV01/Percent_missing_genotype_data.pdf", width = 10, height = 10)
# Change point shapes and colors
p <- ggplot(data = miss_dat,
aes(x=Mouse, y=Percent_missing_genotype_data, color = batch)) +
geom_point() +
geom_hline(yintercept=5, linetype="solid", color = "red") +
geom_text_repel(aes(label=labels2), vjust = 0, nudge_y = 0.01, show.legend = FALSE, size=3) +
theme(text = element_text(size = 20))
p
dev.off()png
2 p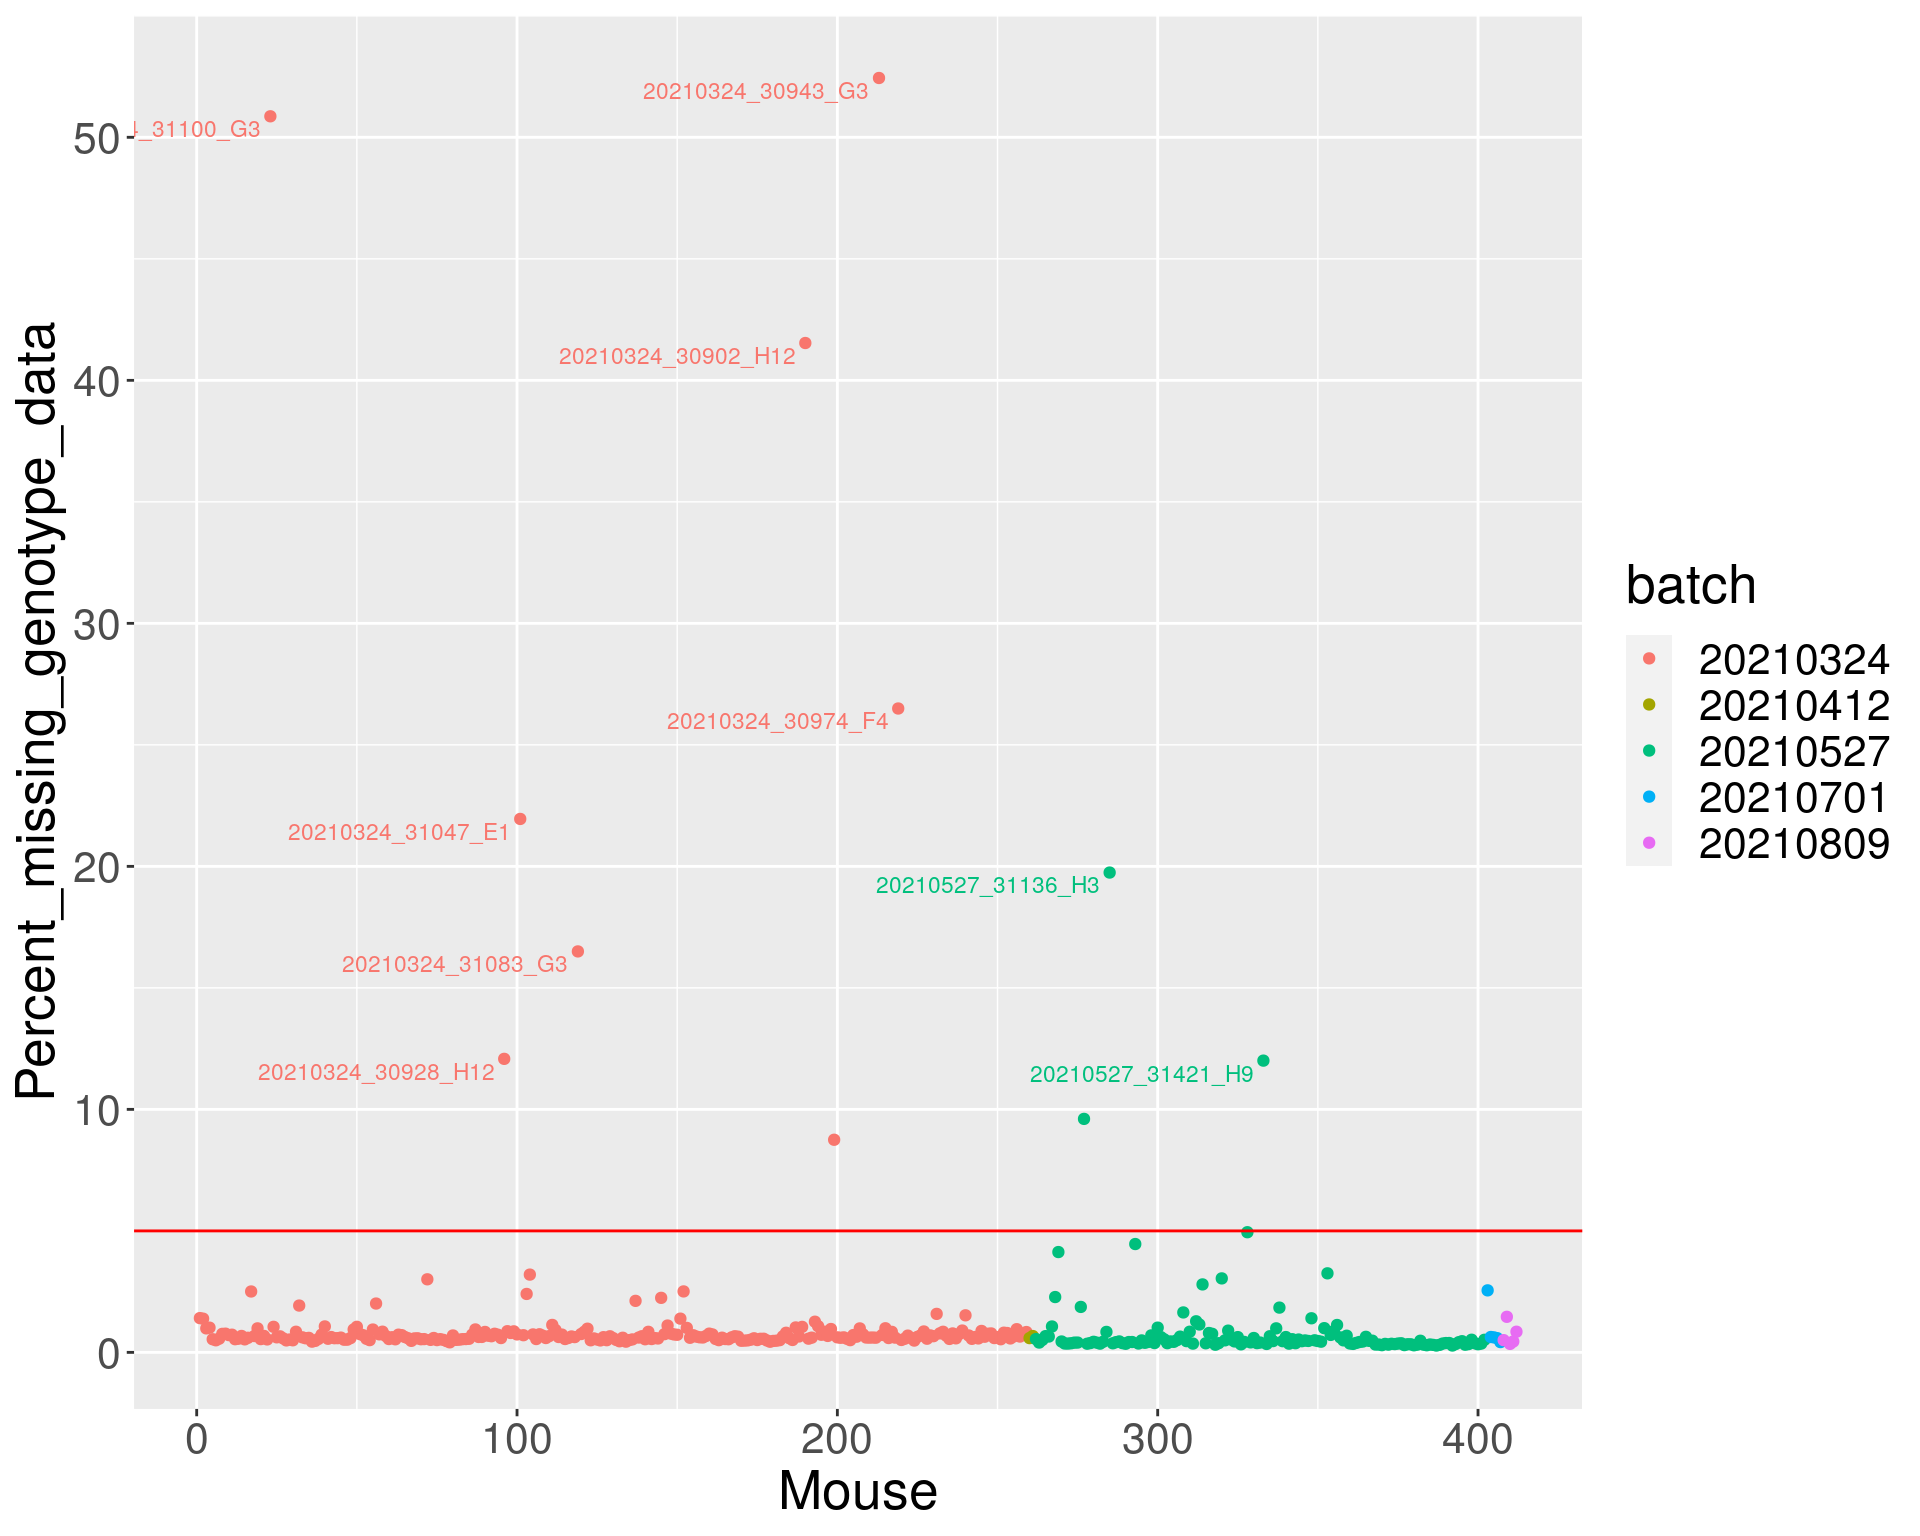
save(percent_missing,
     file = "data/Jackson_Lab_Bubier_MURGIGV01/percent_missing_id.RData")
Sexes
xint <- read_csv_numer("data/Jackson_Lab_Bubier_MURGIGV01/Jackson_Lab_Bubier_MURGIGV01_3_batches_qtl2_chrXint.csv", transpose=TRUE)
yint <- read_csv_numer("data/Jackson_Lab_Bubier_MURGIGV01/Jackson_Lab_Bubier_MURGIGV01_3_batches_qtl2_chrYint.csv", transpose=TRUE)

# Gigamuga marker annotation file from UNC.
gm_marker_file = "http://csbio.unc.edu/MUGA/snps.gigamuga.Rdata" #FIXED
# Read in the UNC GigaMUGA SNPs and clusters.
load(url(gm_marker_file))
#subset down to gm
snps$marker = as.character(snps$marker)

#load the intensities.fst.RData
load("data/Jackson_Lab_Bubier_MURGIGV01/intensities.fst.RData")
#X and Y channel
X <- result[result$channel == "X",]
rownames(X) <- X$snp
X <- X[,c(-1,-2)]

Y <- result[result$channel == "Y",]
rownames(Y) <- Y$snp
Y <- Y[,c(-1,-2)]

#determine predict.sex
predict.sex = determine_sex_chry_m(x = X, y = Y, markers = snps)$sex

gm$covar <- gm$covar %>%
  mutate(id = rownames(gm$covar)) %>%
  left_join(data.frame(id = names(predict.sex),
                       predict.sex = predict.sex,stringsAsFactors = F))
Joining, by = "id"rownames(gm$covar) <- gm$covar$id
#sex order
sex <- gm$covar[rownames(xint),"sex"]
x_pval <- apply(xint, 2, function(a) t.test(a ~ sex)$p.value)
y_pval <- apply(yint, 2, function(a) t.test(a ~ sex)$p.value)
xint_ave <- rowMeans(xint[, x_pval < 0.05/length(x_pval)], na.rm=TRUE)
yint_ave <- rowMeans(yint[, y_pval < 0.05/length(y_pval)], na.rm=TRUE)
point_colors <- as.character( brocolors("web")[c("green", "purple")] )
labels <- paste0(names(xint_ave))
iplot(xint_ave, yint_ave, group=sex, indID=labels,
chartOpts=list(pointcolor=point_colors, pointsize=4,
xlab="Average X chr intensity", ylab="Average Y chr intensity"))phetX <- rowSums(gm$geno$X == 2)/rowSums(gm$geno$X != 0)
iplot(xint_ave, phetX, group=sex, indID=labels,
chartOpts=list(pointcolor=point_colors, pointsize=4,
xlab="Average X chr intensity", ylab="Proportion het on X chr"))Sample duplicates
cg <- compare_geno(gm, cores=10)
summary.cg <- summary(cg, threshold = 0)
#get the name and missing percentage
summary.cg$Name.ind1 <- str_split_fixed(summary.cg$ind1, "_",7)[,6]
summary.cg$Name.ind2 <- str_split_fixed(summary.cg$ind2, "_",7)[,6]
summary.cg$miss.ind1 <- percent_missing[match(summary.cg$ind1, names(percent_missing))]
summary.cg$miss.ind2 <- percent_missing[match(summary.cg$ind2, names(percent_missing))]
summary.cg$remove.id <- ifelse(summary.cg$miss.ind1 > summary.cg$miss.ind2, summary.cg$ind1, summary.cg$ind2)

#filter prop_match>=0.85 or same name for Name.ind1 and Name.ind2
filtered.summary.cg <- summary.cg %>%
  mutate(same.sample = case_when(
    Name.ind1 == Name.ind2 ~ TRUE,
    Name.ind1 != Name.ind2 ~ FALSE
  )) %>%
  filter(prop_match >= 0.85 | same.sample == TRUE)

save(filtered.summary.cg,
     file = "data/Jackson_Lab_Bubier_MURGIGV01/filtered.summary.cg.RData")

#display filtered.summary.cg
DT::datatable(filtered.summary.cg, filter = list(position = 'top', clear = FALSE),
              options = list(pageLength = 40, scrollY = "300px", scrollX = "40px"))
#plot prop matrix for same.sample = false and prop_match >= 0.85
filter.id <- data.frame(id = unique(c(filtered.summary.cg[filtered.summary.cg$same.sample == F,]$ind1,
filtered.summary.cg[filtered.summary.cg$same.sample == F,]$ind2)))
filter.id$name <- do.call(rbind.data.frame,
strsplit(filter.id$id, "V01_"))[,2]
filter.id <- filter.id[order(filter.id$name),]
gm_filter <- gm[filter.id$id,]
#replace id names
old_ids <- do.call(rbind.data.frame,
strsplit(ind_ids(gm_filter), "V01_"))[,2]
new_ids <- setNames(old_ids,
ind_ids(gm_filter))
gm_filter <- replace_ids(gm_filter, new_ids)
#save gm_filter for same.sample = false and prop_match >= 0.85
save(gm_filter, file = "data/Jackson_Lab_Bubier_MURGIGV01/gm_filterprop_match_0.85.RData")
#compare geno
filter.cg <- compare_geno(gm_filter, cores=10, proportion = TRUE)
filter.cg[lower.tri(filter.cg)] <- NA
filter.cg[filter.cg < 0.5] <- NA # for ggplot lowest value 0.5
diag(filter.cg) <- 0
# Melt the correlation matrix
melted_cormat <- melt(filter.cg, na.rm = TRUE)
# Heatmap
p <- ggplot(data = melted_cormat, aes(Var2, Var1, fill = value))+
geom_tile(color = "white")+
scale_fill_gradient2(low = "white", high = "red",
limit = c(0.5,1), space = "Lab",
name="Proportions of matching genotypes") +
scale_y_discrete(position = "right") +
xlab("") +
ylab("") +
theme_bw() +
theme(panel.border = element_blank(), panel.grid.major = element_blank(),
panel.grid.minor = element_blank(), axis.line = element_line(colour = "black")) +
theme(axis.text.x = element_text(angle = 90, vjust = 0.5,
size = 10, hjust = 1),
axis.text.y = element_text(size = 10)) +
coord_fixed()
p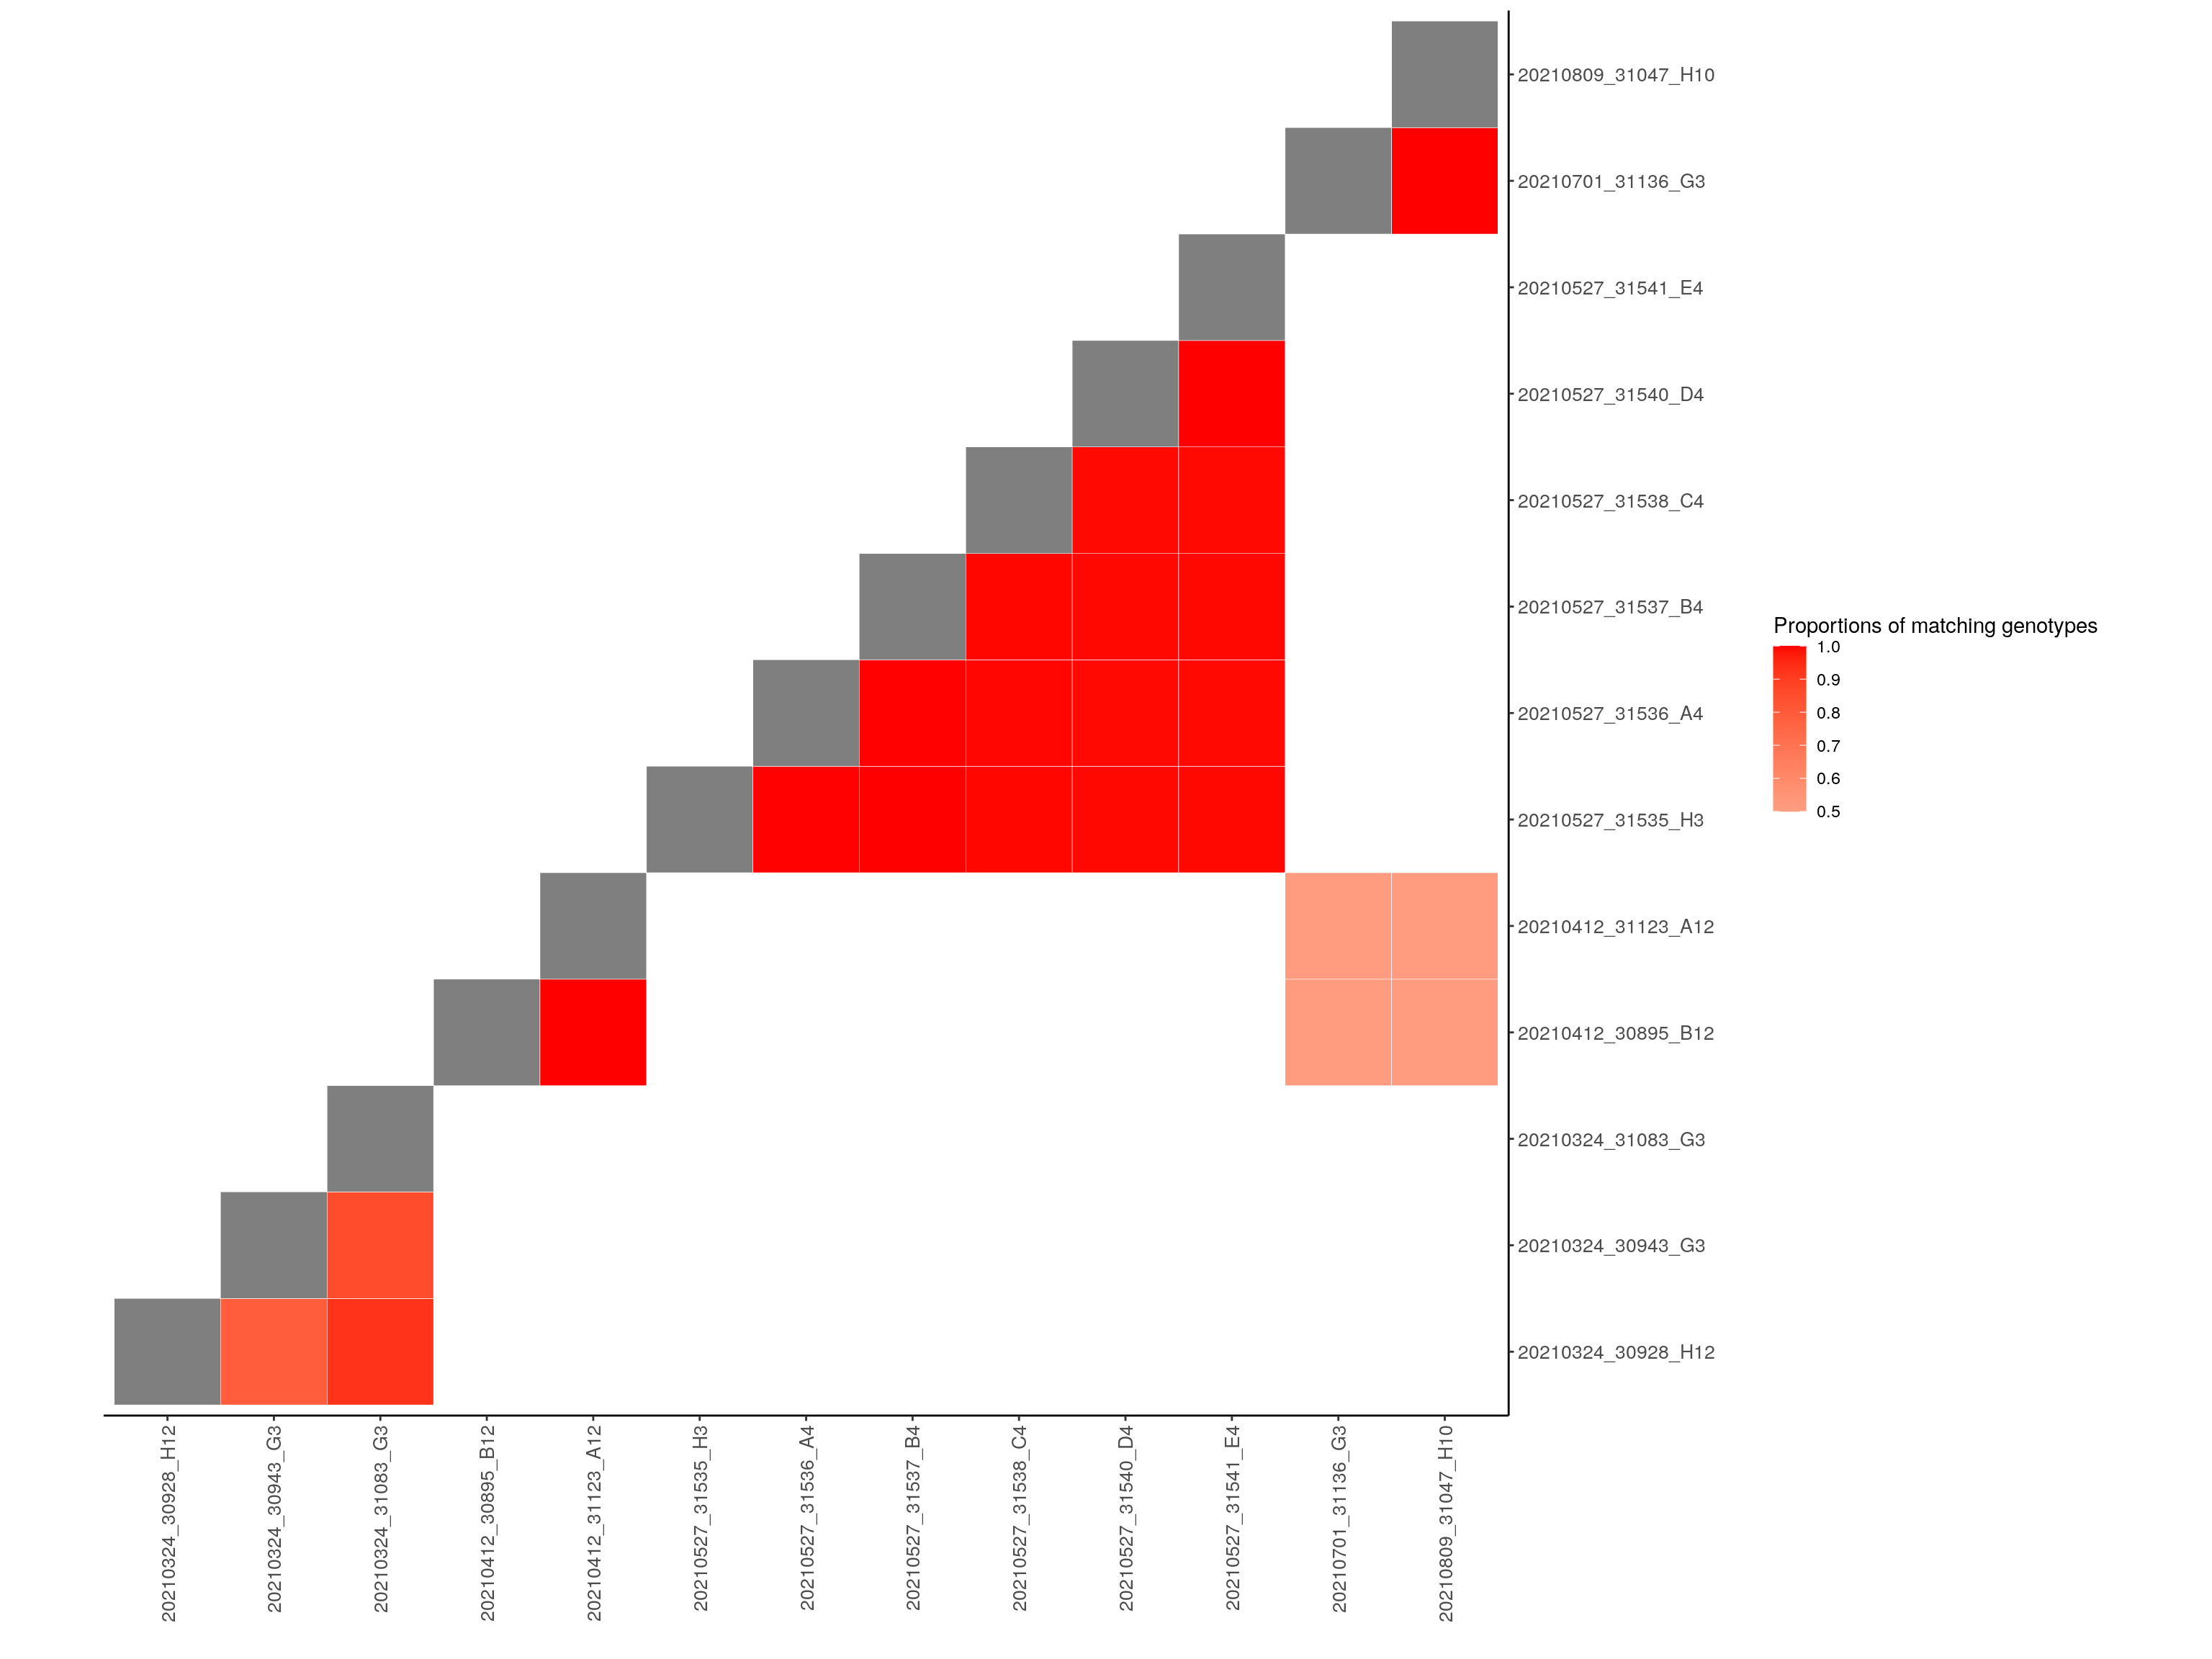
| Version | Author | Date |
|---|---|---|
| 11cf315 | xhyuo | 2021-06-01 |
pdf(file = "data/Jackson_Lab_Bubier_MURGIGV01/Proportion_matching_genotypes_before_removal_samples.pdf", width = 20, height = 20)
par(mar=c(5.1,0.6,0.6, 0.6))
hist(cg[upper.tri(cg)], breaks=seq(0, 1, length=201),
     main="", yaxt="n", ylab="", xlab="Proportion matching genotypes")
rug(cg[upper.tri(cg)])
dev.off()
png
2 par(mar=c(5.1,0.6,0.6, 0.6))
hist(cg[upper.tri(cg)], breaks=seq(0, 1, length=201),
main="", yaxt="n", ylab="", xlab="Proportion matching genotypes")
rug(cg[upper.tri(cg)])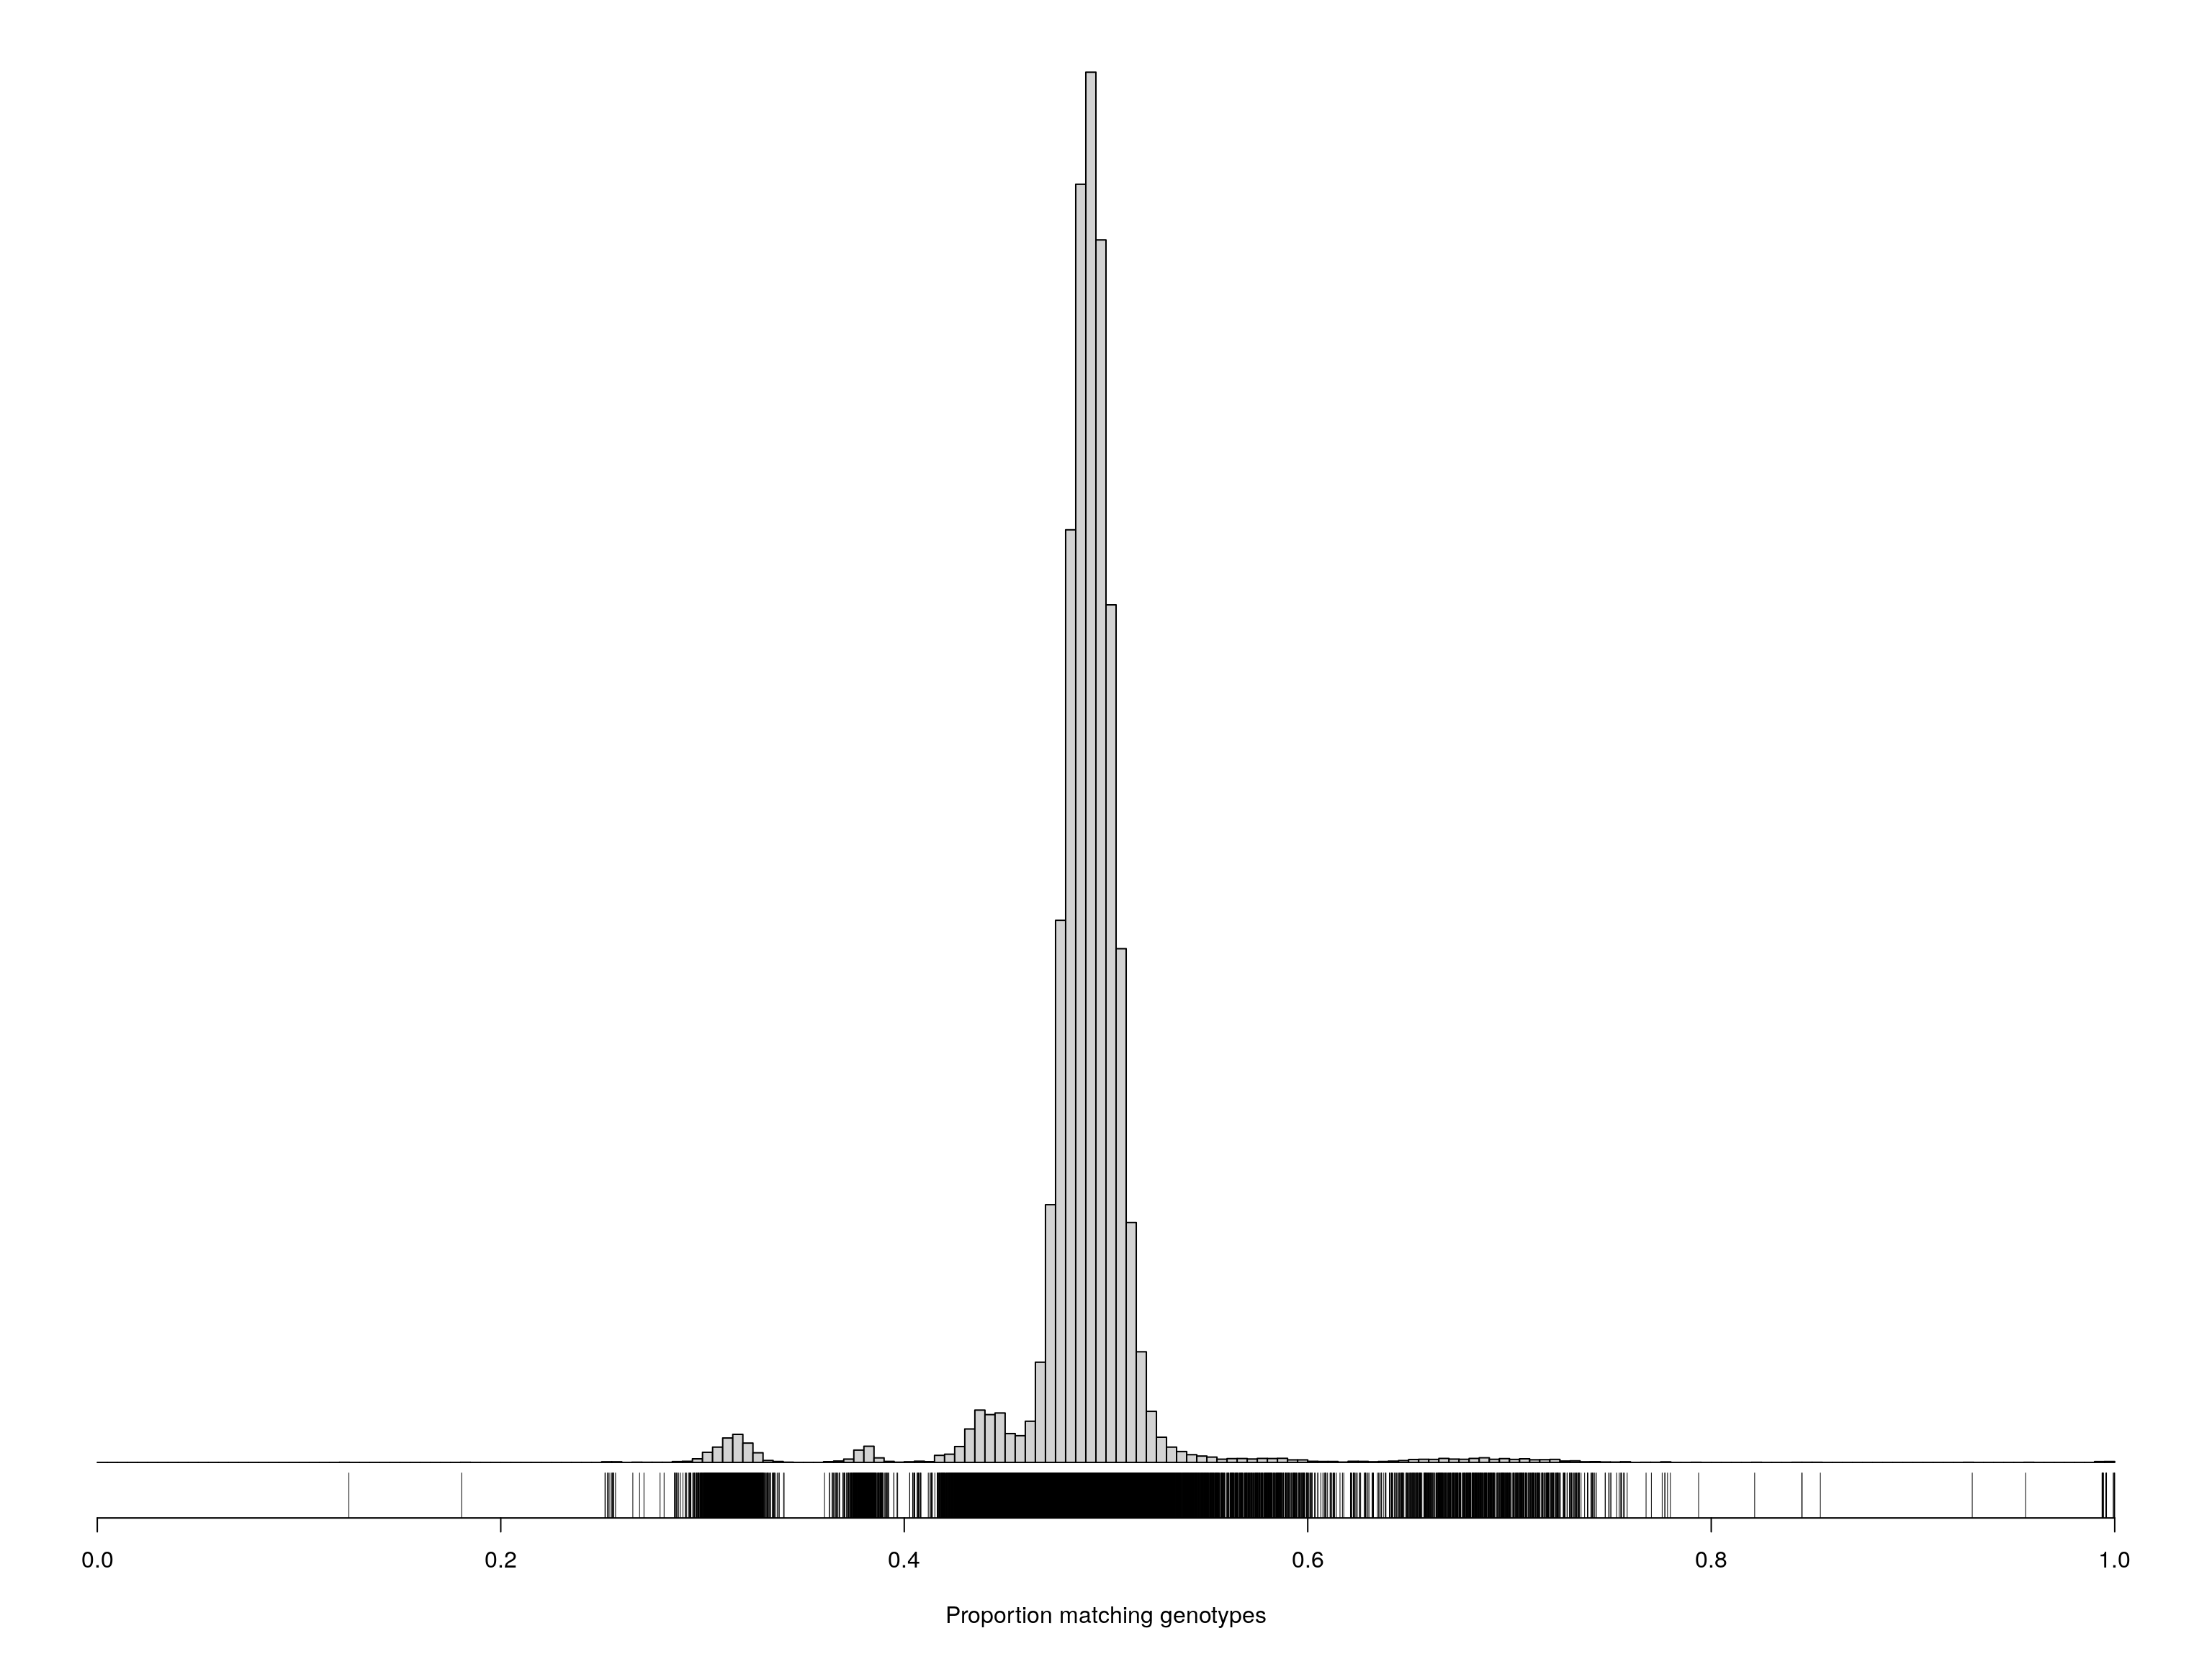
pdf(file = "data/Jackson_Lab_Bubier_MURGIGV01/Proportion_matching_genotypes_after_removal_samples_percent_missing_5.pdf",width = 20, height = 20)
cgsub <- cg[percent_missing < 5, percent_missing < 5]
par(mar=c(5.1,0.6,0.6, 0.6))
hist(cgsub[upper.tri(cgsub)], breaks=seq(0, 1, length=201),
     main="", yaxt="n", ylab="", xlab="Proportion matching genotypes")
rug(cgsub[upper.tri(cgsub)])
dev.off()
png
2 cgsub <- cg[percent_missing < 5, percent_missing < 5]
par(mar=c(5.1,0.6,0.6, 0.6))
hist(cgsub[upper.tri(cgsub)], breaks=seq(0, 1, length=201),
main="", yaxt="n", ylab="", xlab="Proportion matching genotypes")
rug(cgsub[upper.tri(cgsub)])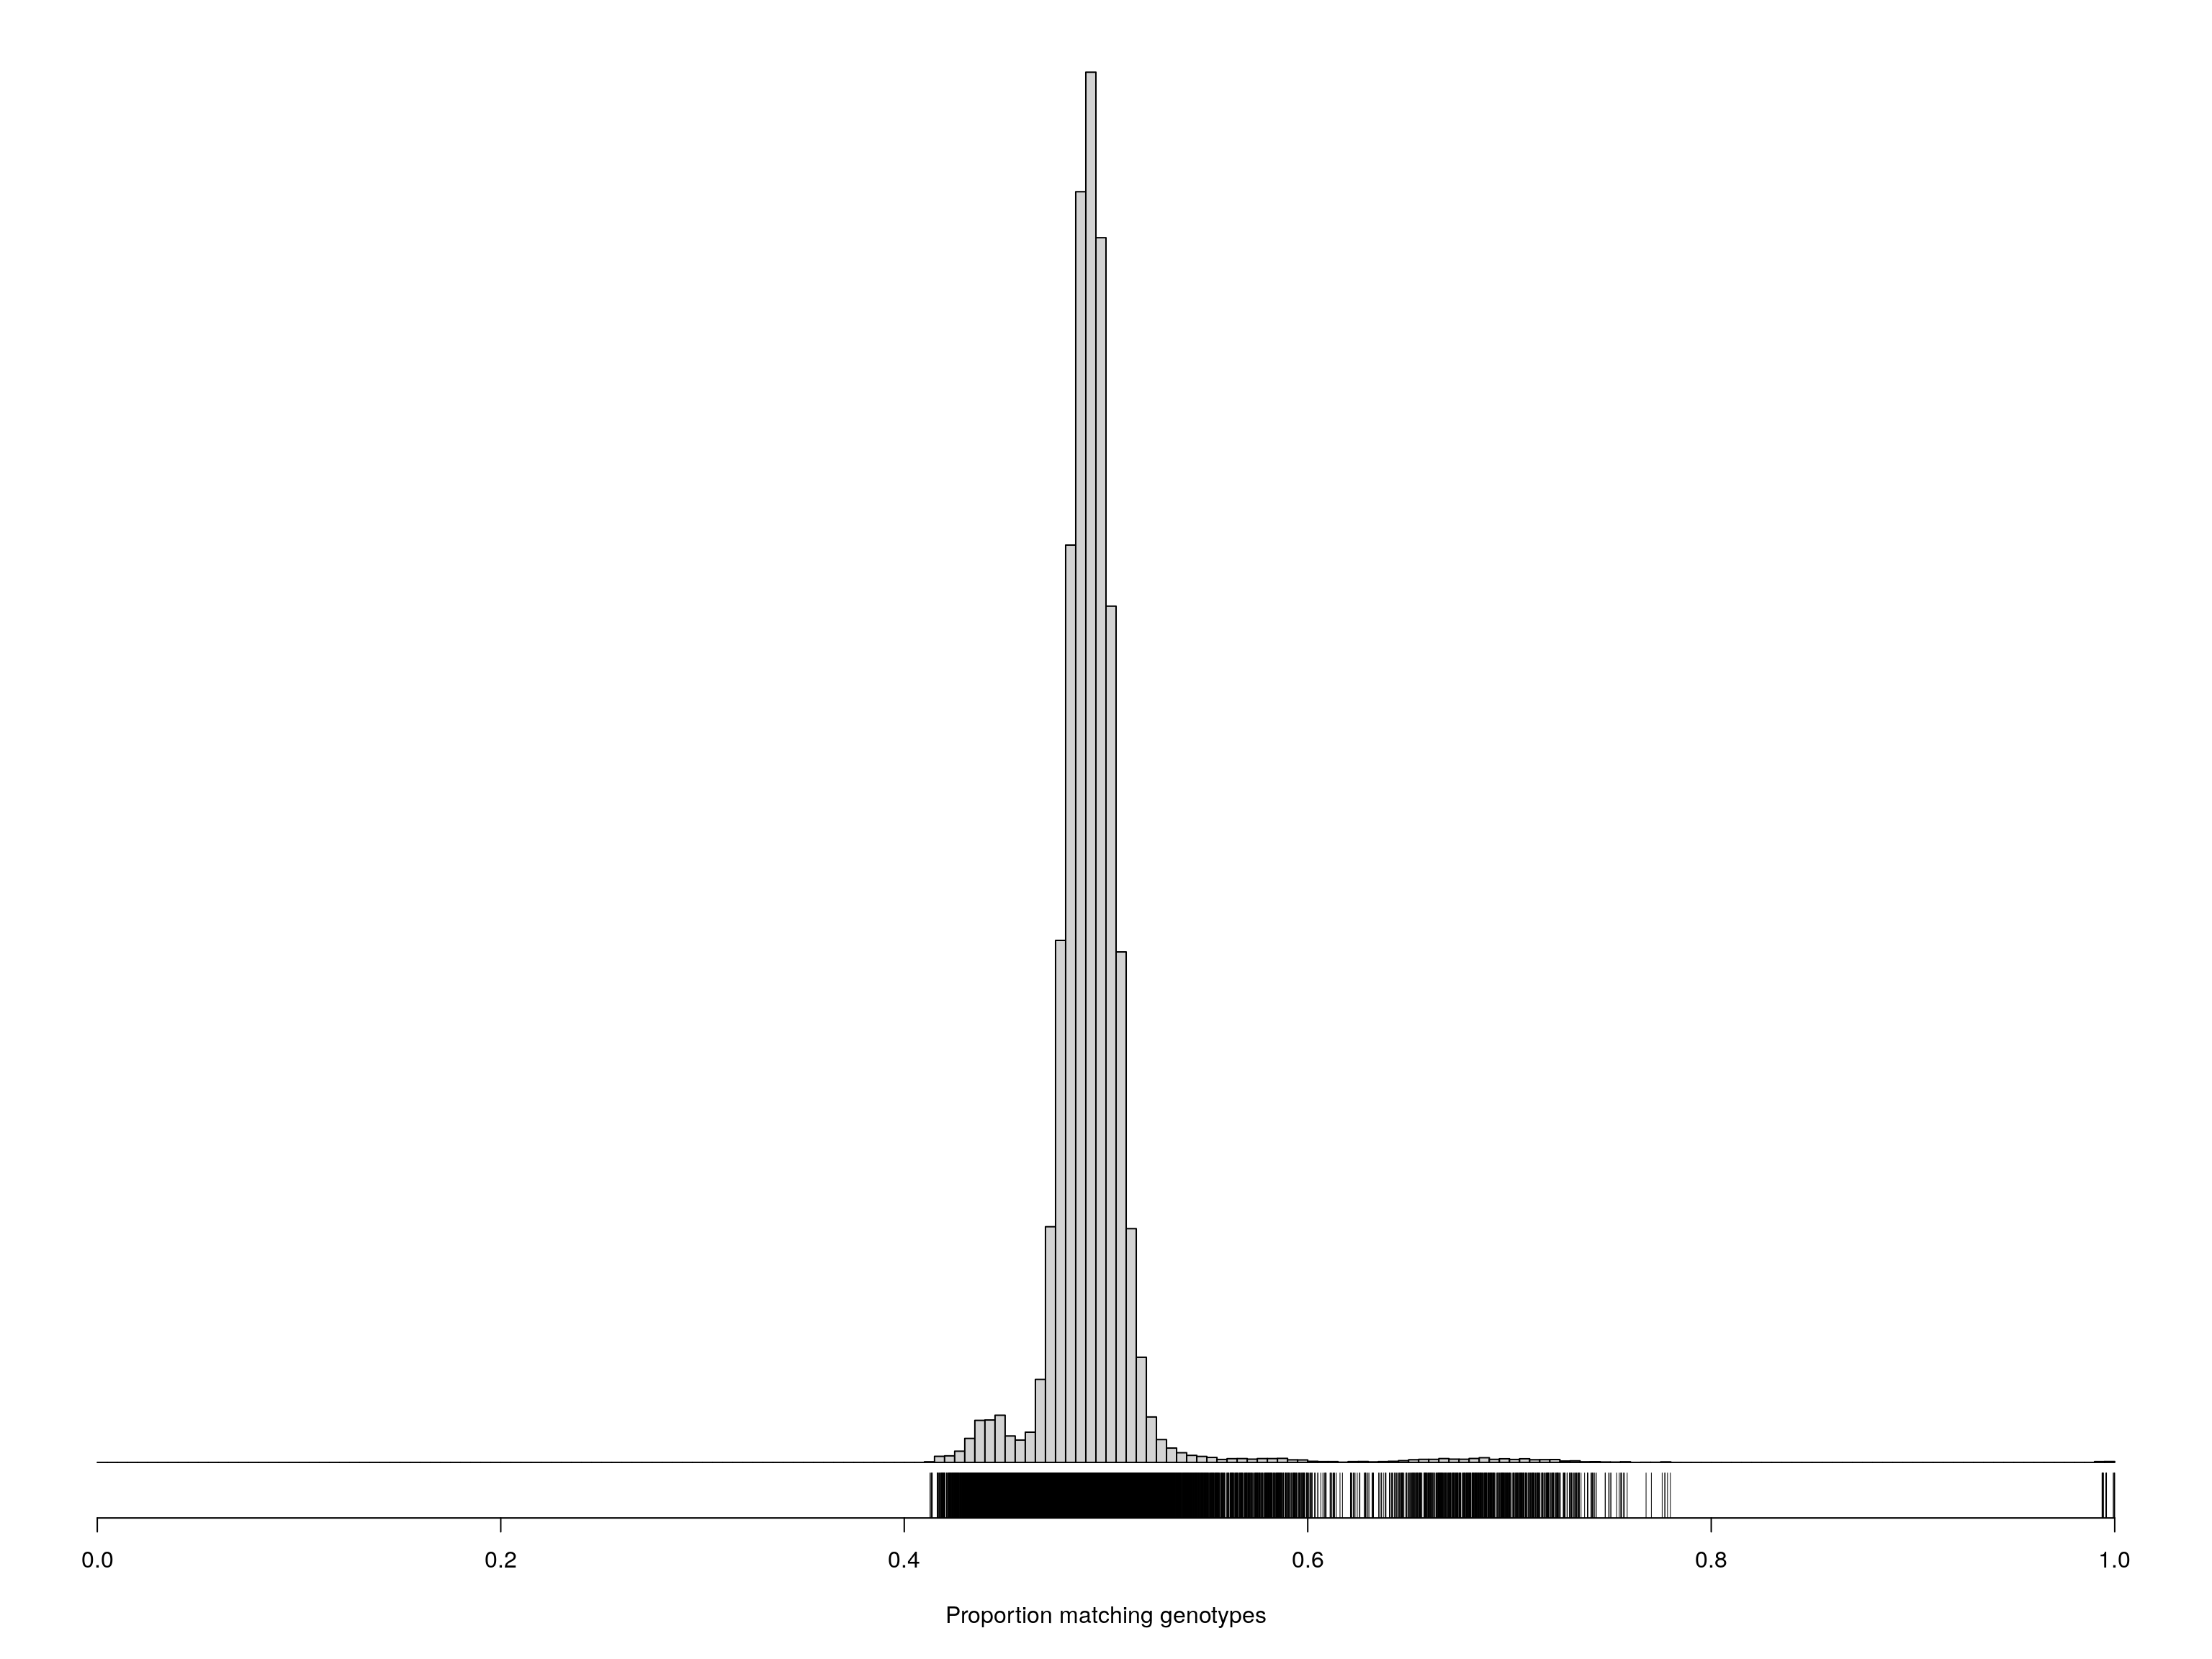
#show samples with missing genotypes >5
miss_dat_5 <- miss_dat %>%
  arrange(desc(Percent_missing_genotype_data)) %>%
  filter(labels2 != "")
dim(miss_dat_5)
[1] 9 6#display miss_dat
DT::datatable(miss_dat_5,filter = list(position = 'top', clear = FALSE),
options = list(pageLength = 40, scrollY = "300px", scrollX = "40px"))Array intensities and Genotype frequencies
#result object is Array intensities 286518*3284
result <- result[seq(1, nrow(result), by=2),-(1:2)] + result[-seq(1, nrow(result), by=2),-(1:2)]
result <- result[,intersect(ind_ids(gm), colnames(result))]
n <- names(sort(percent_missing[intersect(ind_ids(gm), colnames(result))], decreasing=TRUE))
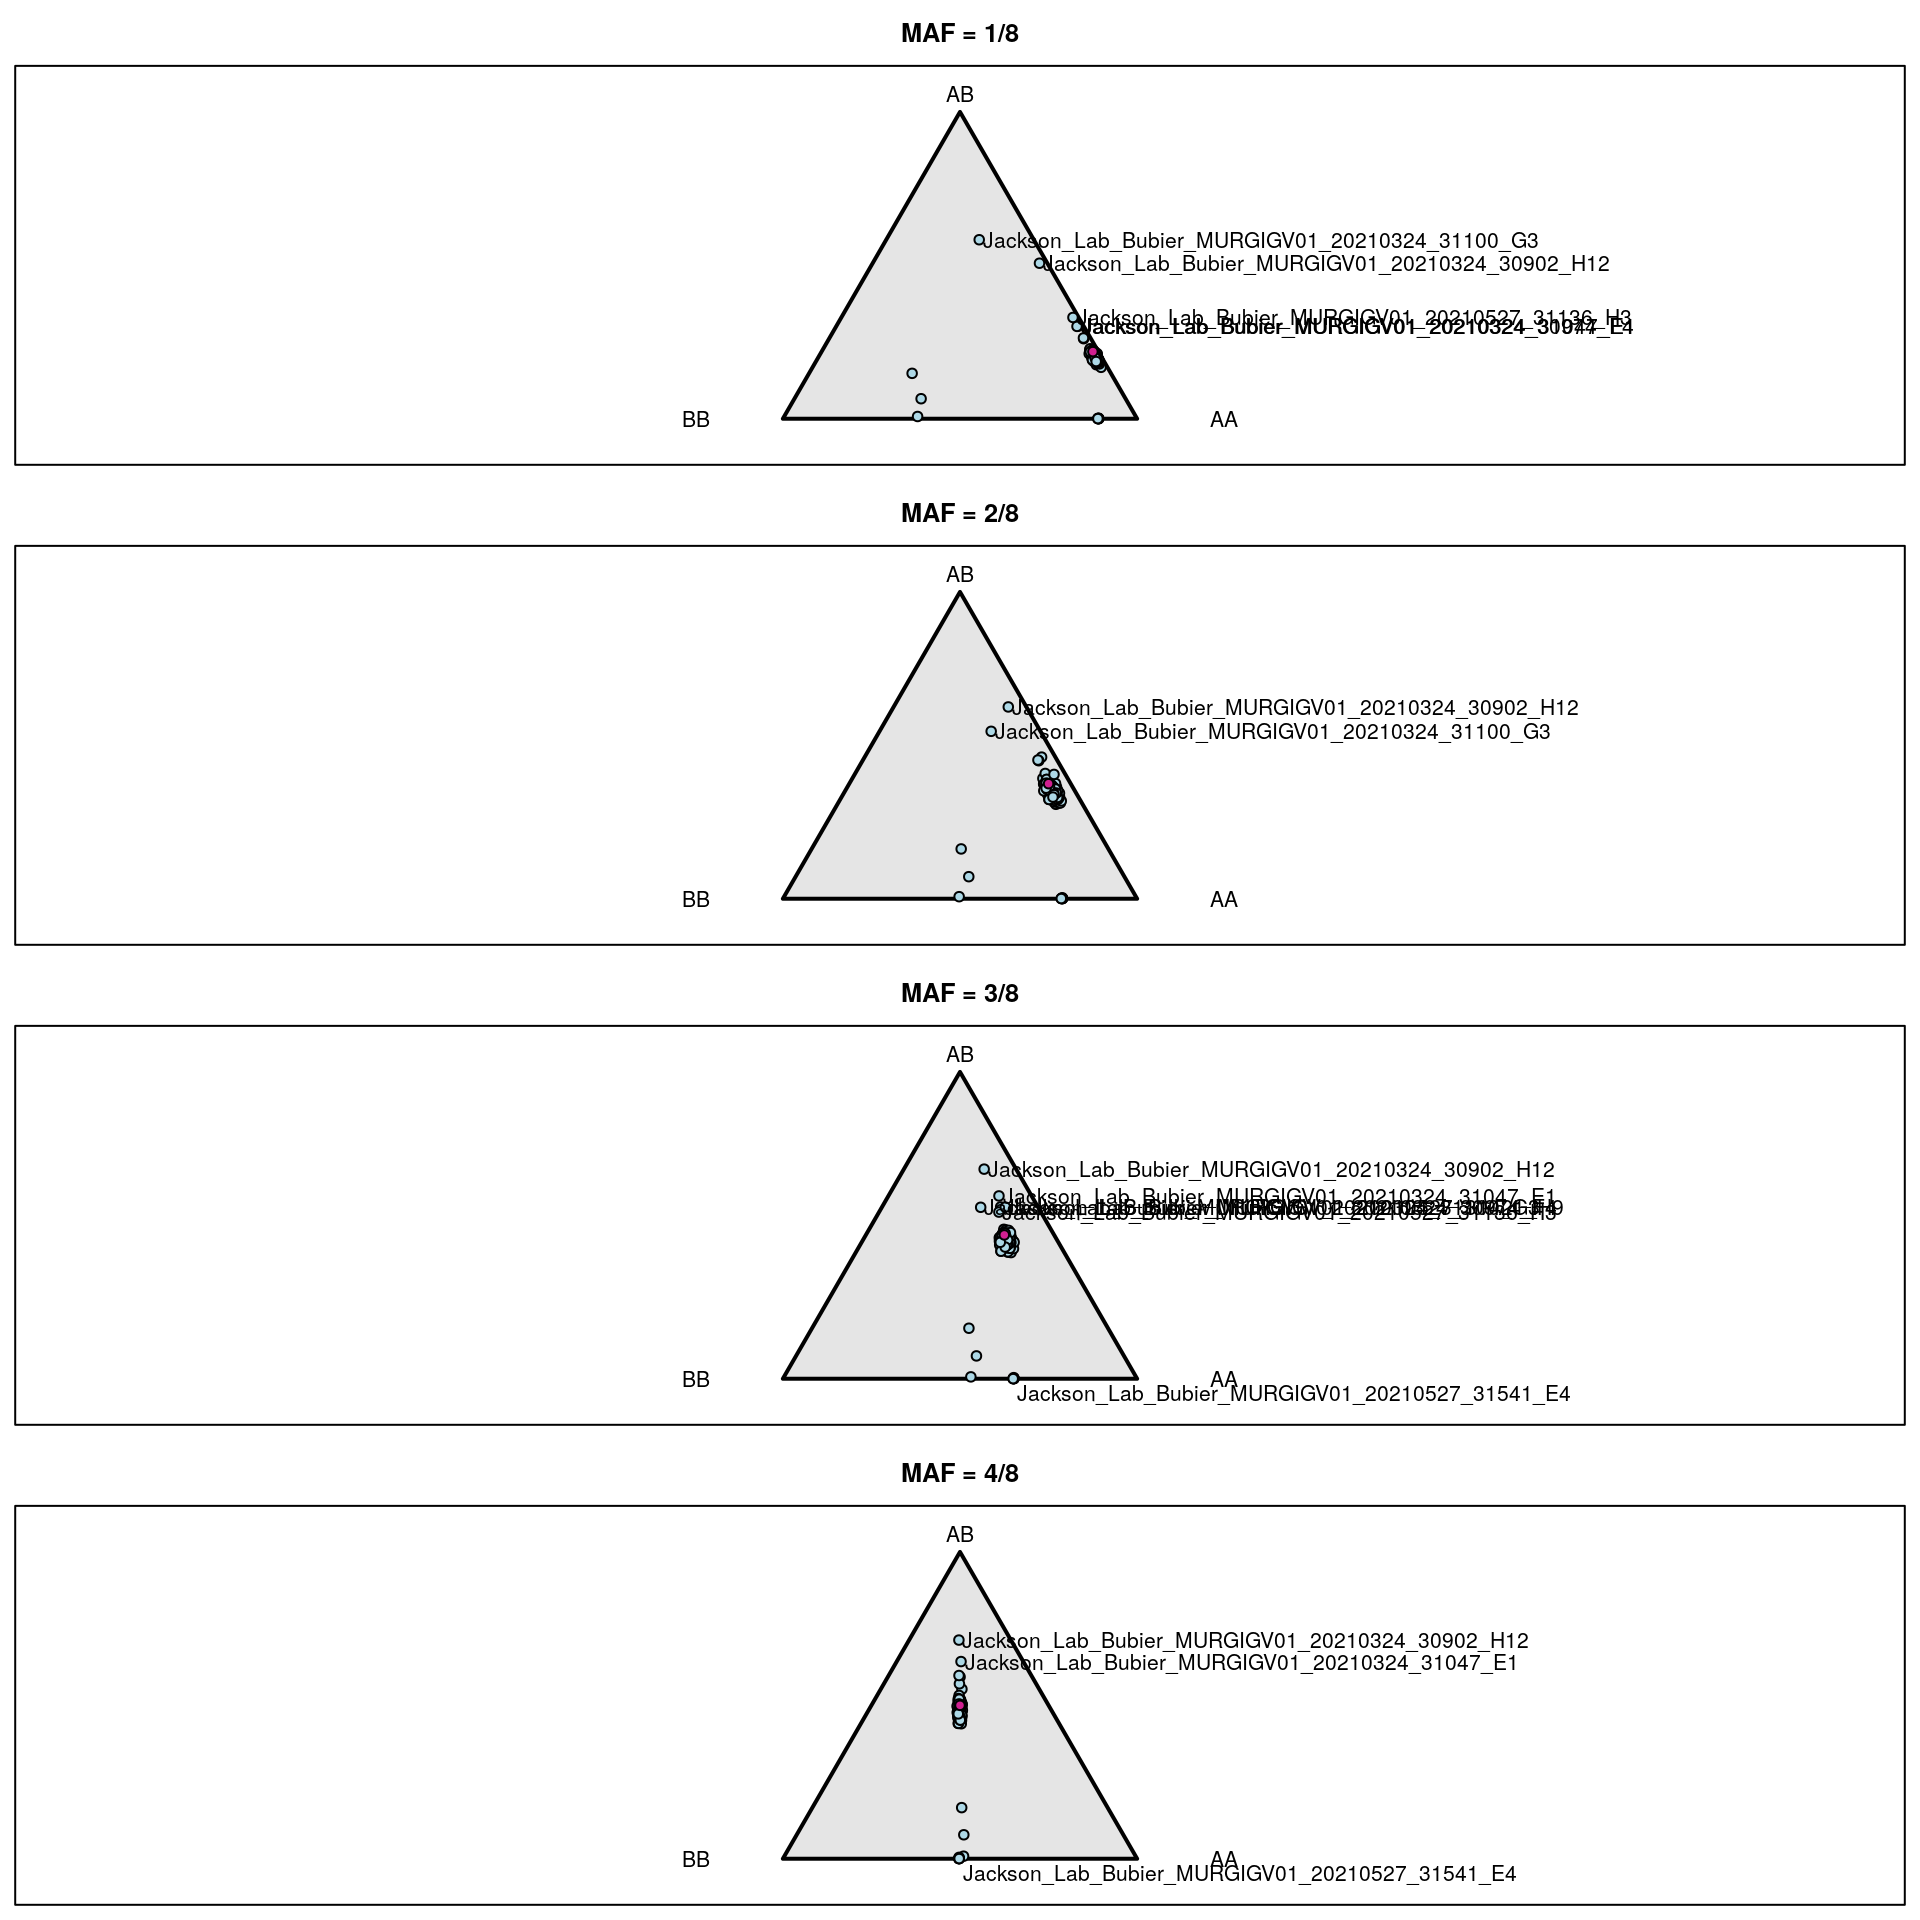
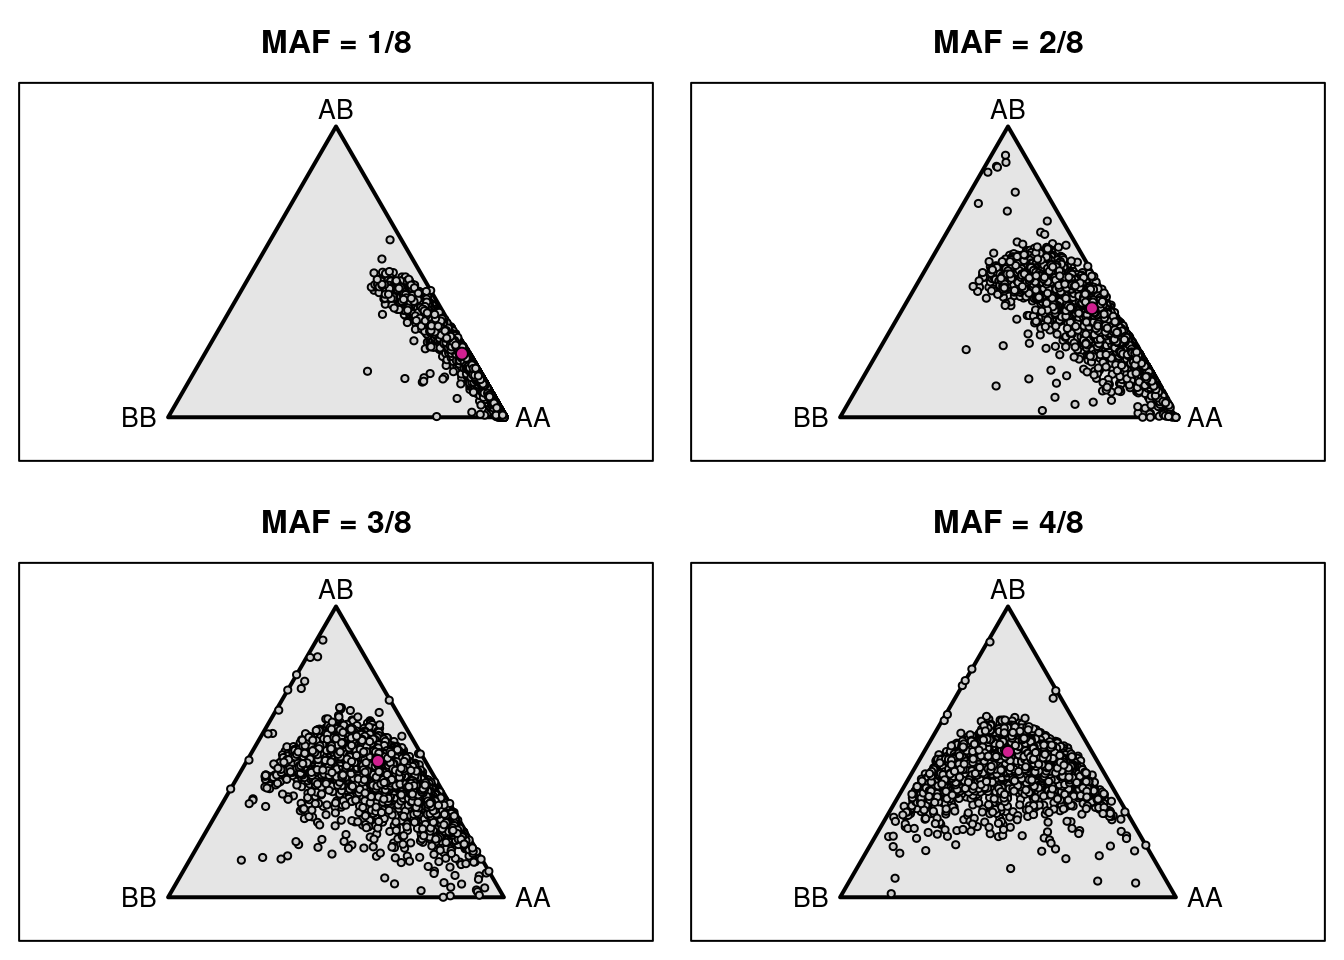
iboxplot(log10(t(result[,n])+1), orderByMedian=FALSE, chartOpts=list(ylab="log10(SNP intensity + 1)"))# Genotype frequencies
g <- do.call("cbind", gm$geno[1:19])
fg <- do.call("cbind", gm$founder_geno[1:19])
g <- g[,colSums(fg==0)==0]
fg <- fg[,colSums(fg==0)==0]
fgn <- colSums(fg==3)
gf_ind <- vector("list", 4)
for(i in 1:4) {
gf_ind[[i]] <- t(apply(g[,fgn==i], 1, function(a) table(factor(a, 1:3))/sum(a != 0)))
}
par(mfrow=c(4,1), mar=c(0.6, 0.6, 2.6, 0.6))
for(i in 1:4) {
triplot(c("AA", "AB", "BB"), main=paste0("MAF = ", i, "/8"))
tripoints(gf_ind[[i]], pch=21, bg="lightblue")
tripoints(c((1-i/8)^2, 2*i/8*(1-i/8), (i/8)^2), pch=21, bg="violetred")
if(i>=3) { # label mouse with lowest het
wh <- which(gf_ind[[i]][,2] == min(gf_ind[[i]][,2]))
tritext(gf_ind[[i]][wh,,drop=FALSE] + c(0.02, -0.02, 0),
names(wh), adj=c(0, 1))
}
# label other mice
if(i==1) {
lab <- rownames(gf_ind[[i]])[gf_ind[[i]][,2]>0.3]
}
else if(i==2) {
lab <- rownames(gf_ind[[i]])[gf_ind[[i]][,2]>0.48]
}
else if(i==3) {
lab <- rownames(gf_ind[[i]])[gf_ind[[i]][,2]>0.51]
}
else if(i==4) {
lab <- rownames(gf_ind[[i]])[gf_ind[[i]][,2]>0.6]
}
for(ind in lab) {
if(grepl("^F", ind) && i != 3) {
tritext(gf_ind[[i]][ind,,drop=FALSE] + c(-0.01, 0, +0.01), ind, adj=c(1,0.5))
} else {
tritext(gf_ind[[i]][ind,,drop=FALSE] + c(0.01, 0, -0.01), ind, adj=c(0,0.5))
}
}
}
Crossover counts and Genotyping error LOD scores
#load pre-caluated results
load("data/Jackson_Lab_Bubier_MURGIGV01/pr.RData")
load("data/Jackson_Lab_Bubier_MURGIGV01/m.RData")
load("data/Jackson_Lab_Bubier_MURGIGV01/nxo.RData")

#crossover
setScreenSize(height = 300, width = 400)
Set screen size to height=300 x width=400totxo <- rowSums(nxo)[ind_ids(gm)]
all.equal(ind_ids(gm), names(totxo))[1] TRUEiplot(seq_along(totxo),
totxo,
group=gm$covar$ngen,
chartOpts=list(xlab="Mouse", ylab="Number of crossovers",
margin=list(left=80,top=40,right=40,bottom=40,inner=5),
axispos=list(xtitle=25,ytitle=50,xlabel=5,ylabel=5)))#save crossover into pdf
pdf(file = "data/Jackson_Lab_Bubier_MURGIGV01/number_crossover.pdf")
cross_over <- data.frame(Mouse = seq_along(totxo), Number_crossovers = totxo, generation = gm$covar$ngen)
names(totxo) <- as.character(do.call(rbind.data.frame, strsplit(names(totxo), "V01_"))[,2])
names(totxo)[totxo <= 800 & totxo >= 400] = ""
# Change point shapes and colors
p <-ggplot(cross_over, aes(x=Mouse, y=Number_crossovers, fill = generation, color=generation)) +
geom_point() +
geom_text_repel(aes(label=names(totxo),hjust=0,vjust=0), show.legend = FALSE, max.overlaps = 15)
p
dev.off()png
2 p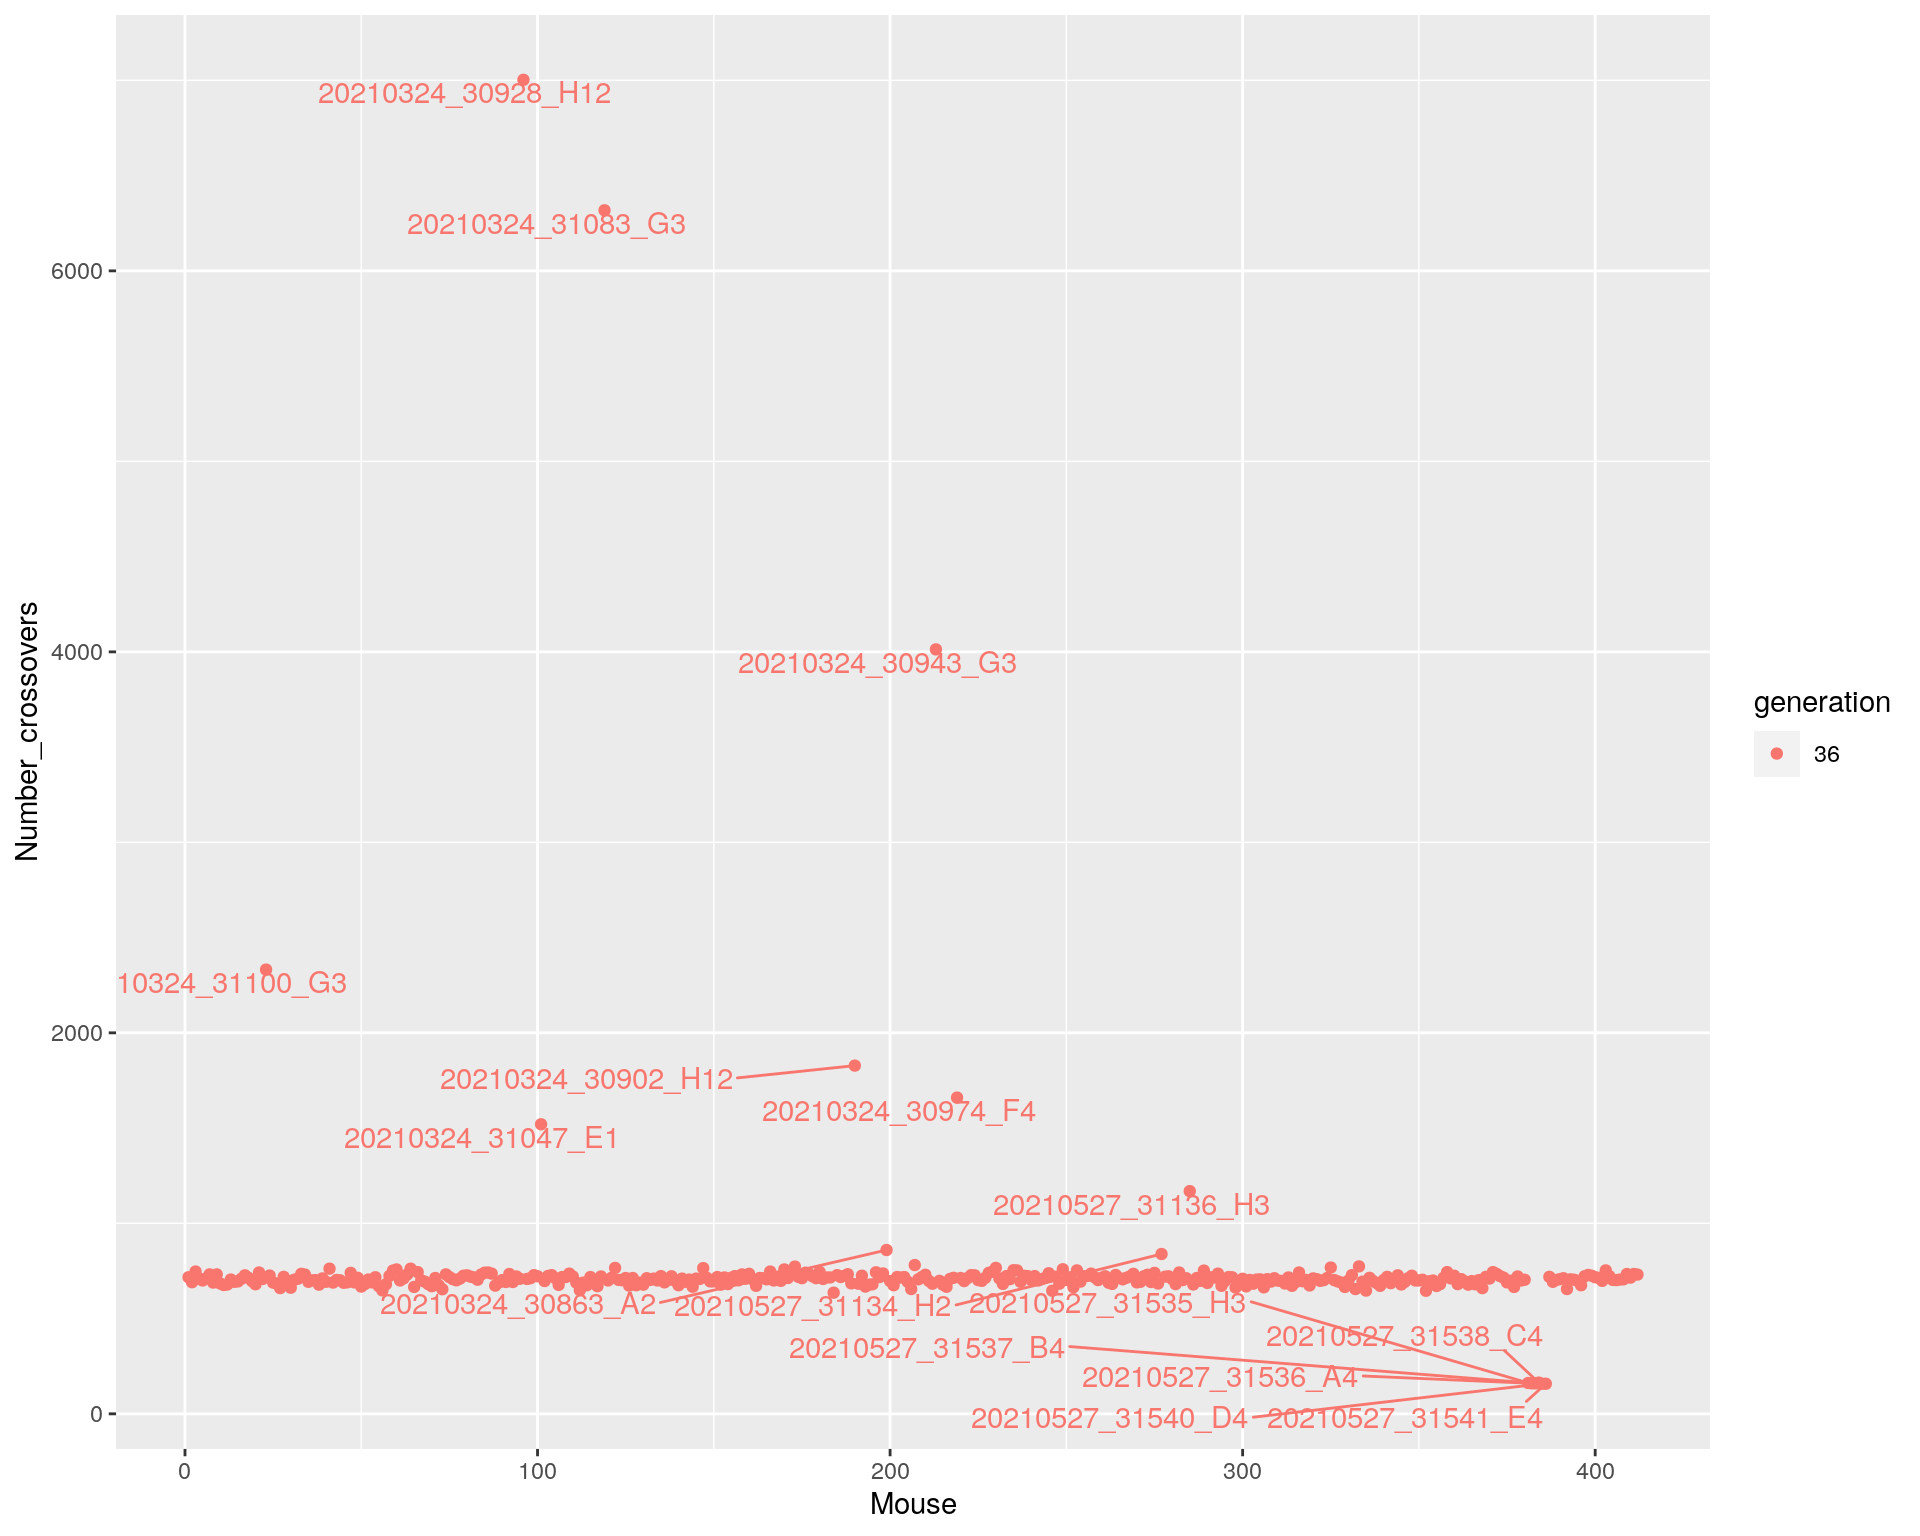
#Here are the crossover counts for those  mice with percent_missing >= 5:
tmp <- cbind(percent_missing=round(percent_missing,2), total_xo=totxo)[percent_missing >= 5,]
#display miss_dat
DT::datatable(tmp[order(tmp[,1]),], filter = list(position = 'top', clear = FALSE),
              options = list(pageLength = 40, scrollY = "300px", scrollX = "40px"))
# Genotyping error LOD scores
load("data/Jackson_Lab_Bubier_MURGIGV01/e.RData")
errors_ind <- rowSums(e>2)/n_typed(gm)*100
lab <- paste0(names(errors_ind), " (", myround(percent_missing,1), "%)")
setScreenSize(height = 300, width = 400)Set screen size to height=300 x width=400iplot(seq_along(errors_ind), errors_ind, indID=lab,
chartOpts=list(xlab="Mouse", ylab="Percent genotyping errors", ylim=c(0, 8),
axispos=list(xtitle=25, ytitle=50, xlabel=5, ylabel=5)))save(errors_ind, file = "data/Jackson_Lab_Bubier_MURGIGV01/errors_ind.RData")
# Apparent genotyping errors
load("data/Jackson_Lab_Bubier_MURGIGV01/snpg.RData")
gobs <- do.call("cbind", gm$geno)
gobs[gobs==0] <- NA
par(pty="s")
err_direct <- rowMeans(snpg != gobs, na.rm=TRUE)*100
errors_ind_0 <- rowSums(e > 0)/n_typed(gm)*100
par(mar=c(4.1,4.1,0.6, 0.6))
grayplot(errors_ind_0, err_direct,
xlab="Percent errors (error LOD > 0)",
ylab="Percent errors (obs vs predicted)",
xlim=c(0, 2), ylim=c(0, 2))
abline(0,1,lty=2, col="gray60")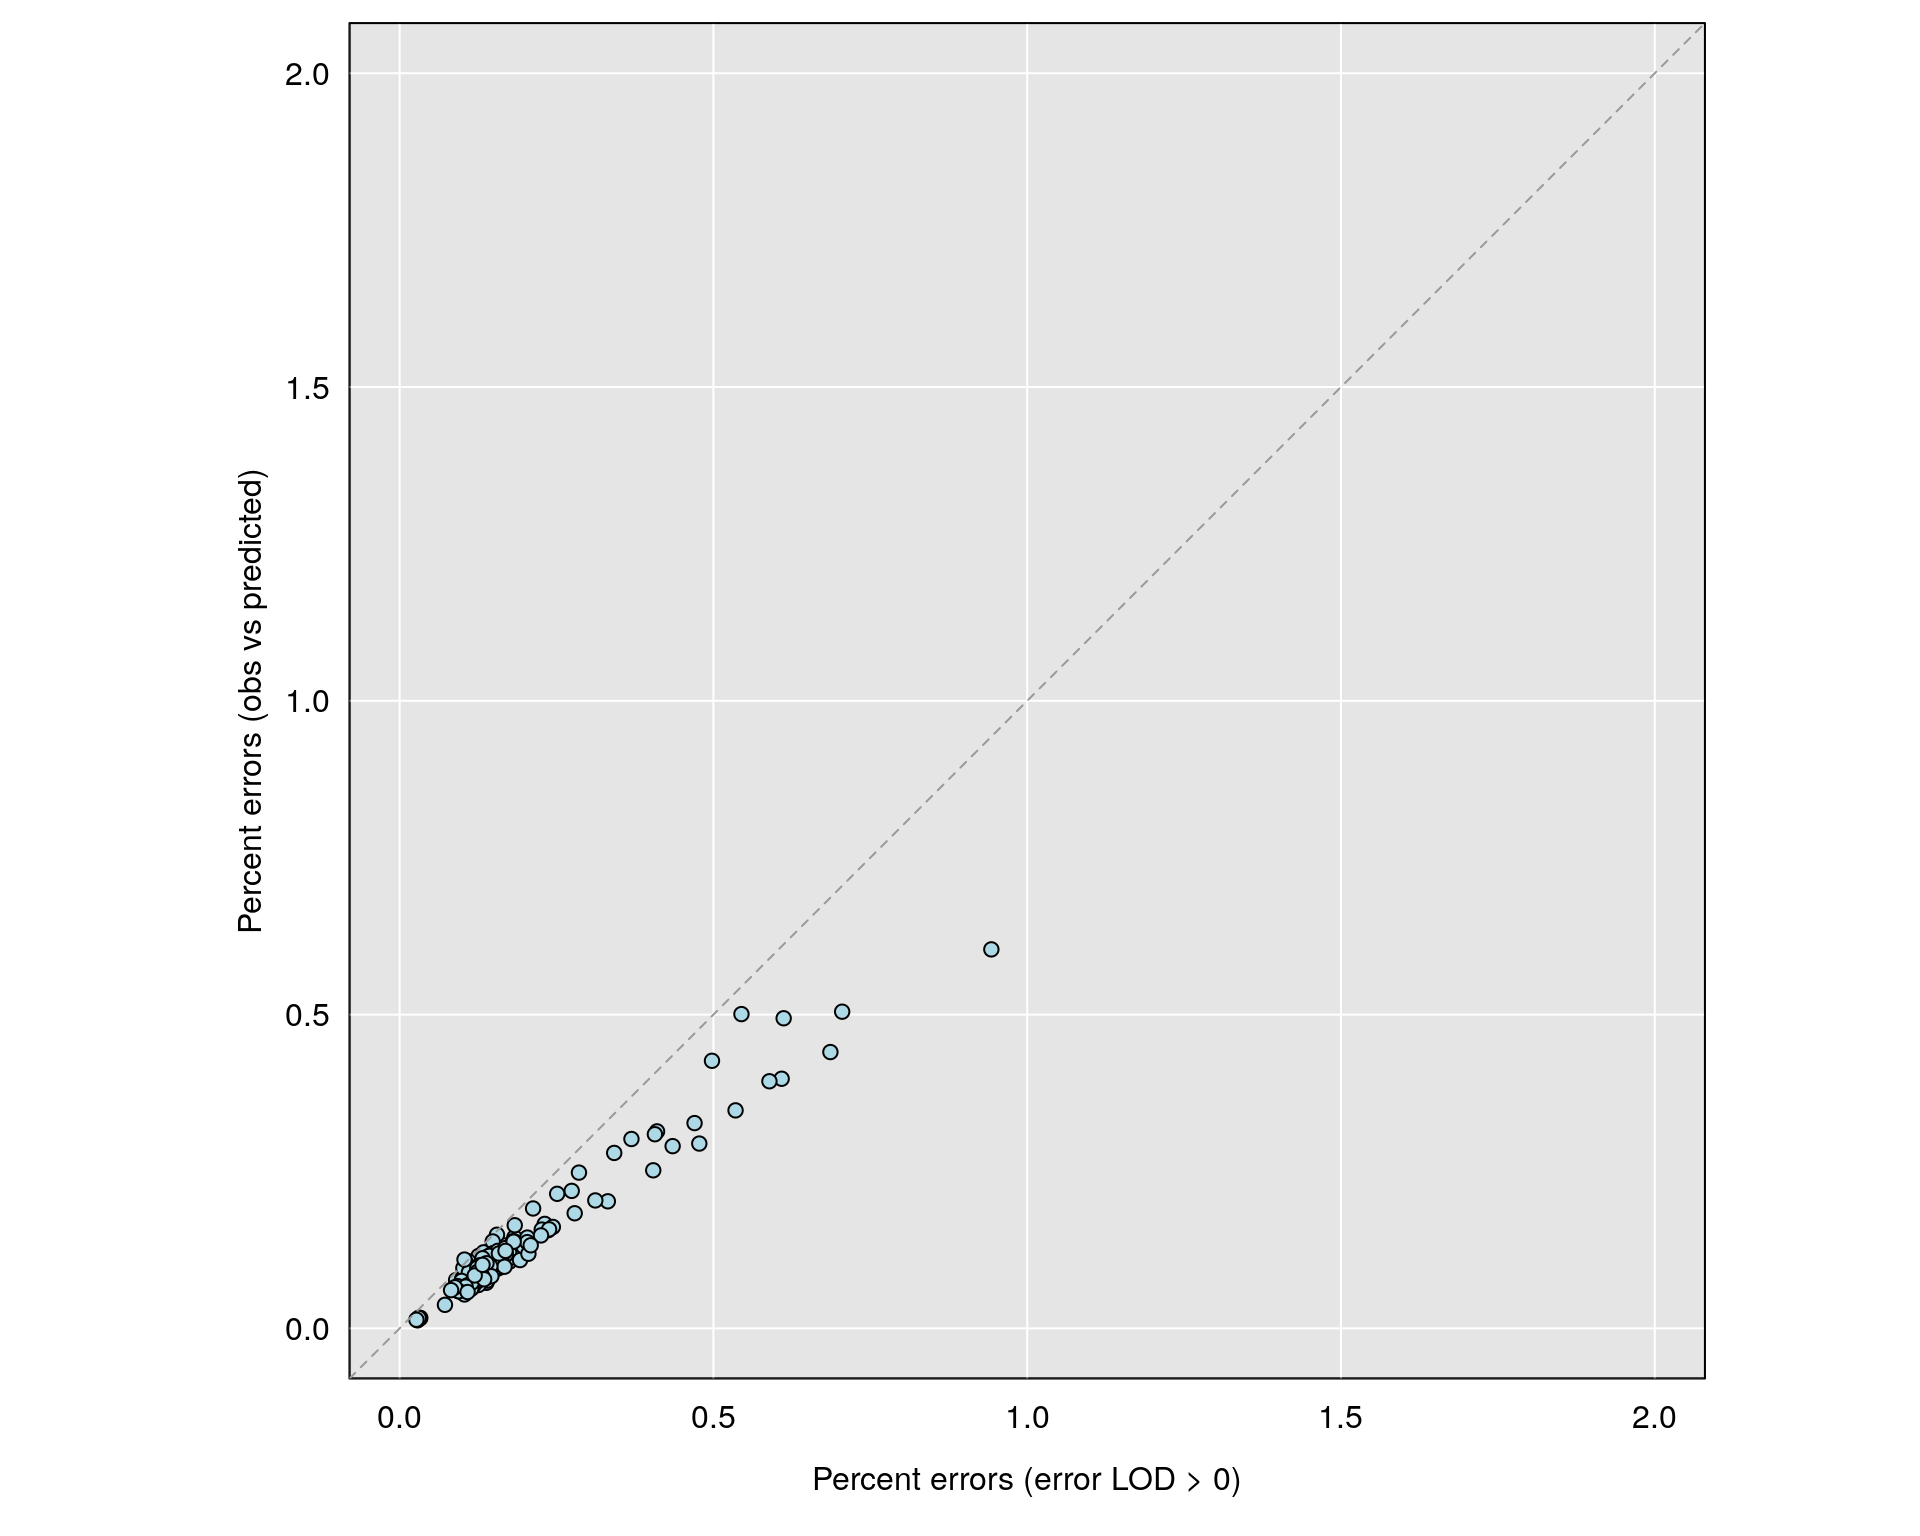
pdf(file = "data/Jackson_Lab_Bubier_MURGIGV01/Percent_genotype_errors_obs_vs_predicted.pdf",width = 20, height = 20)
par(pty="s")
err_direct <- rowMeans(snpg != gobs, na.rm=TRUE)*100
errors_ind_0 <- rowSums(e > 0)/n_typed(gm)*100
par(mar=c(4.1,4.1,0.6, 0.6))
grayplot(errors_ind_0, err_direct,
         xlab="Percent errors (error LOD > 0)",
         ylab="Percent errors (obs vs predicted)",
         xlim=c(0, 2), ylim=c(0, 2))
abline(0,1,lty=2, col="gray60")
dev.off()
png
2 Missing data in Markers and Genotype frequencies Markers
#It can also be useful to look at the proportion of missing genotypes by marker.
#Markers with a lot of missing data were likely difficult to call, and so the genotypes that were called may contain a lot of errors.
pmis_mar <- n_missing(gm, "marker", "proportion")*100

par(mar=c(5.1,0.6,0.6, 0.6))
hist(pmis_mar, breaks=seq(0, 100, length=201),
     main="", yaxt="n", ylab="", xlab="Percent missing genotypes")
rug(pmis_mar)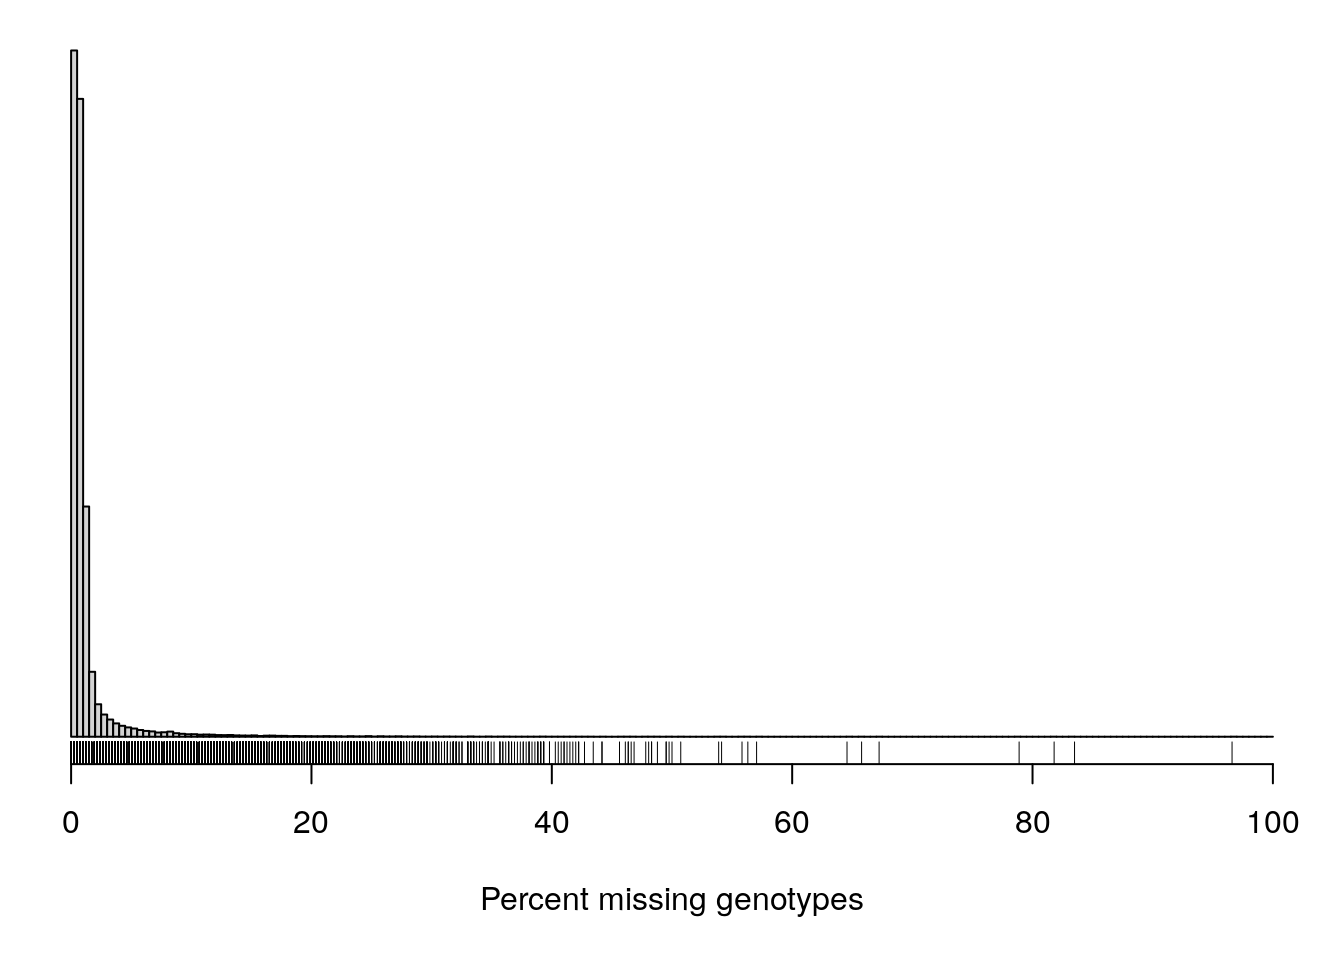
pdf(file = "data/Jackson_Lab_Bubier_MURGIGV01/Percent_missing_genotype_data_per_marker.pdf")
par(mar=c(5.1,0.6,0.6, 0.6))
hist(pmis_mar, breaks=seq(0, 100, length=201),
     main="", yaxt="n", ylab="", xlab="Percent missing genotypes")
rug(pmis_mar)
dev.off()
png
2 # Genotype frequencies Markers
gf_mar <- t(apply(g, 2, function(a) table(factor(a, 1:3))/sum(a != 0)))
gn_mar <- t(apply(g, 2, function(a) table(factor(a, 1:3))))
pdf(file = "data/Jackson_Lab_Bubier_MURGIGV01/genotype_frequency_marker.pdf")
par(mfrow=c(2,2), mar=c(0.6, 0.6, 2.6, 0.6))
for(i in 1:4) {
  triplot(c("AA", "AB", "BB"), main=paste0("MAF = ", i, "/8"))
  z <- gf_mar[fgn==i,]
  z <- z[rowSums(is.na(z)) < 3,]
  tripoints(z, pch=21, bg="gray80", cex=0.6)
  tripoints(c((1-i/8)^2, 2*i/8*(1-i/8), (i/8)^2), pch=21, bg="violetred")
}
dev.off()png
2 par(mfrow=c(2,2), mar=c(0.6, 0.6, 2.6, 0.6))
for(i in 1:4) {
triplot(c("AA", "AB", "BB"), main=paste0("MAF = ", i, "/8"))
z <- gf_mar[fgn==i,]
z <- z[rowSums(is.na(z)) < 3,]
tripoints(z, pch=21, bg="gray80", cex=0.6)
tripoints(c((1-i/8)^2, 2*i/8*(1-i/8), (i/8)^2), pch=21, bg="violetred")
}
dev.off()null device
1 # Genotype errors Markers
errors_mar <- colSums(e>2)/n_typed(gm, "marker")*100
grayplot(pmis_mar, errors_mar,
xlab="Proportion missing", ylab="Proportion genotyping errors")
pdf(file = "data/Jackson_Lab_Bubier_MURGIGV01/genotype_error_marker.pdf")
grayplot(pmis_mar, errors_mar,
xlab="Proportion missing", ylab="Proportion genotyping errors")
dev.off()pdf
2 Remove bad samples
#qc_infor
#percent missing
qc_info <- left_join(gm$covar, miss_dat)
Joining, by = "id"#add cross_over
cross_over$id <- rownames(cross_over)
qc_info <- qc_info %>% left_join(cross_over[,-1])Joining, by = "id"#mismatch sex
qc_info <- qc_info %>%
mutate(sex.match = case_when(
predict.sex == sex ~ TRUE,
predict.sex != sex ~ FALSE
))
#genotype errors
qc_info <- qc_info %>%
left_join(
data.frame(id = names(errors_ind),
genotype_erros = errors_ind,stringsAsFactors = F)
)Joining, by = "id"#add duplicated id to be remove
qc_info <- qc_info %>%
mutate(remove.id.duplicated = case_when(
id %in% unique(c(filtered.summary.cg$remove.id)) ~ TRUE,
!(id %in% unique(c(filtered.summary.cg$remove.id))) ~ FALSE
))
#bad sample label
qc_info <- qc_info %>%
mutate(bad.sample = case_when(
(ngen ==1 | Number_crossovers <= 200 | Number_crossovers >=1000 | percent_missing >= 10 | genotype_erros >= 1 | remove.id.duplicated == TRUE) ~ TRUE,
TRUE ~ FALSE
))
#Note for two sample
qc_info[qc_info$id == "Jackson_Lab_Bubier_MURGIGV01_20210701_30895_G1", "bad.sample"] <- FALSE
qc_info[qc_info$id == "Jackson_Lab_Bubier_MURGIGV01_20210809_31047_H10", "bad.sample"] <- FALSE
save(qc_info, file = "data/Jackson_Lab_Bubier_MURGIGV01/qc_info.RData")
write.csv(qc_info, file = "data/Jackson_Lab_Bubier_MURGIGV01/qc_info.csv", quote = FALSE)
#display qc_info
DT::datatable(qc_info, filter = list(position = 'top', clear = FALSE),
options = list(pageLength = 40, scrollY = "300px", scrollX = "40px"))#remove bad samples
gm.no.bad <- gm[paste0("-",as.character(qc_info[qc_info$bad.sample == TRUE, "id"])),]
gm.no.badObject of class cross2 (crosstype "do")
Total individuals 395
No. genotyped individuals 395
No. phenotyped individuals 395
No. with both geno & pheno 395
No. phenotypes 1
No. covariates 6
No. phenotype covariates 0
No. chromosomes 20
Total markers 112728
No. markers by chr:
1 2 3 4 5 6 7 8 9 10 11 12 13 14 15 16
8555 8666 6420 6615 6571 6443 6294 5677 5870 5447 6352 5167 5274 5039 4555 4369
17 18 19 X
4330 4002 3108 3974 # subjects
# update other stuff
e <- e[ind_ids(gm.no.bad),]
g <- g[ind_ids(gm.no.bad),]
snpg <- snpg[ind_ids(gm.no.bad),]
length(errors_mar[errors_mar > 5])[1] 262# omit the markers with error rates >5%.
bad_markers <- find_markerpos(gm.no.bad, names(errors_mar[errors_mar > 5]))
save(bad_markers, file = "data/Jackson_Lab_Bubier_MURGIGV01/bad_markers.RData")
#drop bad markers
gm_after_qc <- drop_markers(gm.no.bad, names(errors_mar)[errors_mar > 5])
gm_after_qcObject of class cross2 (crosstype "do")
Total individuals 395
No. genotyped individuals 395
No. phenotyped individuals 395
No. with both geno & pheno 395
No. phenotypes 1
No. covariates 6
No. phenotype covariates 0
No. chromosomes 20
Total markers 112466
No. markers by chr:
1 2 3 4 5 6 7 8 9 10 11 12 13 14 15 16
8528 8648 6402 6605 6556 6423 6281 5664 5857 5436 6341 5153 5263 5025 4543 4359
17 18 19 X
4320 3985 3104 3973 save(gm_after_qc, file = paste0("data/Jackson_Lab_Bubier_MURGIGV01/gm_DO", length(ind_ids(gm_after_qc)) ,"_qc.RData"))
save(e,g,snpg, file = "data/Jackson_Lab_Bubier_MURGIGV01/e_g_snpg_qc.RData")
#replace id
new.id <- str_split_fixed(ind_ids(gm_after_qc), "_",7)[,6]
names(new.id) <- ind_ids(gm_after_qc)
gm_after_qc <- replace_ids(gm_after_qc, new.id)
gm_after_qcObject of class cross2 (crosstype "do")
Total individuals 395
No. genotyped individuals 395
No. phenotyped individuals 395
No. with both geno & pheno 395
No. phenotypes 1
No. covariates 6
No. phenotype covariates 0
No. chromosomes 20
Total markers 112466
No. markers by chr:
1 2 3 4 5 6 7 8 9 10 11 12 13 14 15 16
8528 8648 6402 6605 6556 6423 6281 5664 5857 5436 6341 5153 5263 5025 4543 4359
17 18 19 X
4320 3985 3104 3973 save(gm_after_qc, file = paste0("data/Jackson_Lab_Bubier_MURGIGV01/gm_DO", length(ind_ids(gm_after_qc)) ,"_qc_newid.RData"))
sessionInfo()R version 4.0.3 (2020-10-10)
Platform: x86_64-pc-linux-gnu (64-bit)
Running under: Ubuntu 20.04.2 LTS
Matrix products: default
BLAS/LAPACK: /usr/lib/x86_64-linux-gnu/openblas-pthread/libopenblasp-r0.3.8.so
locale:
[1] LC_CTYPE=en_US.UTF-8 LC_NUMERIC=C
[3] LC_TIME=en_US.UTF-8 LC_COLLATE=en_US.UTF-8
[5] LC_MONETARY=en_US.UTF-8 LC_MESSAGES=C
[7] LC_PAPER=en_US.UTF-8 LC_NAME=C
[9] LC_ADDRESS=C LC_TELEPHONE=C
[11] LC_MEASUREMENT=en_US.UTF-8 LC_IDENTIFICATION=C
attached base packages:
[1] stats4 parallel stats graphics grDevices utils datasets
[8] methods base
other attached packages:
[1] DT_0.17 reshape2_1.4.4
[3] forcats_0.5.1 stringr_1.4.0
[5] dplyr_1.0.4 purrr_0.3.4
[7] readr_1.4.0 tidyr_1.1.2
[9] tibble_3.0.6 tidyverse_1.3.0
[11] mclust_5.4.7 DOQTL_1.19.0
[13] VariantAnnotation_1.36.0 Rsamtools_2.6.0
[15] SummarizedExperiment_1.20.0 Biobase_2.50.0
[17] MatrixGenerics_1.2.1 matrixStats_0.58.0
[19] BSgenome.Mmusculus.UCSC.mm10_1.4.0 BSgenome_1.58.0
[21] rtracklayer_1.50.0 Biostrings_2.58.0
[23] XVector_0.30.0 GenomicRanges_1.42.0
[25] GenomeInfoDb_1.26.7 IRanges_2.24.1
[27] S4Vectors_0.28.1 BiocGenerics_0.36.1
[29] ggrepel_0.9.1 ggplot2_3.3.3
[31] qtlcharts_0.12-10 qtl2_0.24
[33] broman_0.72-4 workflowr_1.6.2
loaded via a namespace (and not attached):
[1] readxl_1.3.1 backports_1.2.1 BiocFileCache_1.14.0
[4] plyr_1.8.6 crosstalk_1.1.1 BiocParallel_1.24.1
[7] digest_0.6.27 foreach_1.5.1 htmltools_0.5.1.1
[10] regress_1.3-21 gdata_2.18.0 magrittr_2.0.1
[13] memoise_2.0.0 cluster_2.1.1 doParallel_1.0.16
[16] QTLRel_1.6 annotate_1.68.0 modelr_0.1.8
[19] askpass_1.1 prettyunits_1.1.1 colorspace_2.0-0
[22] rvest_0.3.6 blob_1.2.1 rappdirs_0.3.3
[25] haven_2.3.1 xfun_0.21 crayon_1.4.1
[28] RCurl_1.98-1.2 jsonlite_1.7.2 qtl_1.47-9
[31] iterators_1.0.13 glue_1.4.2 gtable_0.3.0
[34] zlibbioc_1.36.0 DelayedArray_0.16.3 kernlab_0.9-29
[37] Rhdf5lib_1.12.1 prabclus_2.3-2 DEoptimR_1.0-8
[40] scales_1.1.1 DBI_1.1.1 Rcpp_1.0.6
[43] xtable_1.8-4 progress_1.2.2 bit_4.0.4
[46] htmlwidgets_1.5.3 httr_1.4.2 fpc_2.2-9
[49] modeltools_0.2-23 ellipsis_0.3.1 farver_2.0.3
[52] pkgconfig_2.0.3 XML_3.99-0.5 flexmix_2.3-17
[55] nnet_7.3-15 dbplyr_2.1.0 labeling_0.4.2
[58] tidyselect_1.1.0 rlang_0.4.10 later_1.1.0.1
[61] AnnotationDbi_1.52.0 munsell_0.5.0 cellranger_1.1.0
[64] tools_4.0.3 cachem_1.0.4 cli_2.3.0
[67] generics_0.1.0 RSQLite_2.2.3 broom_0.7.4
[70] evaluate_0.14 fastmap_1.1.0 yaml_2.2.1
[73] knitr_1.31 bit64_4.0.5 fs_1.5.0
[76] robustbase_0.93-7 whisker_0.4 xml2_1.3.2
[79] biomaRt_2.46.3 rstudioapi_0.13 compiler_4.0.3
[82] curl_4.3 reprex_1.0.0 stringi_1.5.3
[85] highr_0.8 annotationTools_1.64.0 GenomicFeatures_1.42.3
[88] lattice_0.20-41 Matrix_1.2-18 vctrs_0.3.6
[91] pillar_1.4.7 lifecycle_1.0.0 rhdf5filters_1.2.1
[94] RUnit_0.4.32 data.table_1.13.6 bitops_1.0-6
[97] corpcor_1.6.9 httpuv_1.5.5 R6_2.5.0
[100] hwriter_1.3.2 promises_1.2.0.1 codetools_0.2-18
[103] MASS_7.3-53 gtools_3.8.2 assertthat_0.2.1
[106] rhdf5_2.34.0 openssl_1.4.3 rprojroot_2.0.2
[109] withr_2.4.1 GenomicAlignments_1.26.0 GenomeInfoDbData_1.2.4
[112] diptest_0.75-7 hms_1.0.0 grid_4.0.3
[115] class_7.3-18 rmarkdown_2.6 git2r_0.28.0
[118] lubridate_1.7.9.2 This R Markdown site was created with workflowr