Plot_DO_morphine_secondbatch
Hao He
2023-02-21
Last updated: 2023-02-21
Checks: 7 0
Knit directory: DO_Opioid/
This reproducible R Markdown analysis was created with workflowr (version 1.6.2). The Checks tab describes the reproducibility checks that were applied when the results were created. The Past versions tab lists the development history.
Great! Since the R Markdown file has been committed to the Git repository, you know the exact version of the code that produced these results.
Great job! The global environment was empty. Objects defined in the global environment can affect the analysis in your R Markdown file in unknown ways. For reproduciblity it’s best to always run the code in an empty environment.
The command set.seed(20200504) was run prior to running the code in the R Markdown file. Setting a seed ensures that any results that rely on randomness, e.g. subsampling or permutations, are reproducible.
Great job! Recording the operating system, R version, and package versions is critical for reproducibility.
Nice! There were no cached chunks for this analysis, so you can be confident that you successfully produced the results during this run.
Great job! Using relative paths to the files within your workflowr project makes it easier to run your code on other machines.
Great! You are using Git for version control. Tracking code development and connecting the code version to the results is critical for reproducibility.
The results in this page were generated with repository version cc3ae27. See the Past versions tab to see a history of the changes made to the R Markdown and HTML files.
Note that you need to be careful to ensure that all relevant files for the analysis have been committed to Git prior to generating the results (you can use wflow_publish or wflow_git_commit). workflowr only checks the R Markdown file, but you know if there are other scripts or data files that it depends on. Below is the status of the Git repository when the results were generated:
Ignored files:
    Ignored:    .RData
    Ignored:    .Rhistory
    Ignored:    .Rproj.user/
    Ignored:    analysis/Picture1.png

Untracked files:
    Untracked:  Rplot_rz.png
    Untracked:  TIMBR.test.prop.bm.MN.RET.RData
    Untracked:  TIMBR.test.random.RData
    Untracked:  TIMBR.test.rz.transformed_TVb_ml.RData
    Untracked:  analysis/DDO_morphine1_second_set_69k.stdout
    Untracked:  analysis/DO_Fentanyl.R
    Untracked:  analysis/DO_Fentanyl.err
    Untracked:  analysis/DO_Fentanyl.out
    Untracked:  analysis/DO_Fentanyl.sh
    Untracked:  analysis/DO_Fentanyl_69k.R
    Untracked:  analysis/DO_Fentanyl_69k.err
    Untracked:  analysis/DO_Fentanyl_69k.out
    Untracked:  analysis/DO_Fentanyl_69k.sh
    Untracked:  analysis/DO_Fentanyl_Cohort2_GCTA_herit.R
    Untracked:  analysis/DO_Fentanyl_Cohort2_gemma.R
    Untracked:  analysis/DO_Fentanyl_Cohort2_mapping.R
    Untracked:  analysis/DO_Fentanyl_Cohort2_mapping.err
    Untracked:  analysis/DO_Fentanyl_Cohort2_mapping.out
    Untracked:  analysis/DO_Fentanyl_Cohort2_mapping.sh
    Untracked:  analysis/DO_Fentanyl_GCTA_herit.R
    Untracked:  analysis/DO_Fentanyl_alternate_metrics_69k.R
    Untracked:  analysis/DO_Fentanyl_alternate_metrics_69k.err
    Untracked:  analysis/DO_Fentanyl_alternate_metrics_69k.out
    Untracked:  analysis/DO_Fentanyl_alternate_metrics_69k.sh
    Untracked:  analysis/DO_Fentanyl_alternate_metrics_array.R
    Untracked:  analysis/DO_Fentanyl_alternate_metrics_array.err
    Untracked:  analysis/DO_Fentanyl_alternate_metrics_array.out
    Untracked:  analysis/DO_Fentanyl_alternate_metrics_array.sh
    Untracked:  analysis/DO_Fentanyl_array.R
    Untracked:  analysis/DO_Fentanyl_array.err
    Untracked:  analysis/DO_Fentanyl_array.out
    Untracked:  analysis/DO_Fentanyl_array.sh
    Untracked:  analysis/DO_Fentanyl_combining2Cohort_GCTA_herit.R
    Untracked:  analysis/DO_Fentanyl_combining2Cohort_gemma.R
    Untracked:  analysis/DO_Fentanyl_combining2Cohort_mapping.R
    Untracked:  analysis/DO_Fentanyl_combining2Cohort_mapping.err
    Untracked:  analysis/DO_Fentanyl_combining2Cohort_mapping.out
    Untracked:  analysis/DO_Fentanyl_combining2Cohort_mapping.sh
    Untracked:  analysis/DO_Fentanyl_combining2Cohort_mapping_CoxPH.R
    Untracked:  analysis/DO_Fentanyl_finalreport_to_plink.sh
    Untracked:  analysis/DO_Fentanyl_gemma.R
    Untracked:  analysis/DO_Fentanyl_gemma.err
    Untracked:  analysis/DO_Fentanyl_gemma.out
    Untracked:  analysis/DO_Fentanyl_gemma.sh
    Untracked:  analysis/DO_morphine1.R
    Untracked:  analysis/DO_morphine1.Rout
    Untracked:  analysis/DO_morphine1.sh
    Untracked:  analysis/DO_morphine1.stderr
    Untracked:  analysis/DO_morphine1.stdout
    Untracked:  analysis/DO_morphine1_SNP.R
    Untracked:  analysis/DO_morphine1_SNP.Rout
    Untracked:  analysis/DO_morphine1_SNP.sh
    Untracked:  analysis/DO_morphine1_SNP.stderr
    Untracked:  analysis/DO_morphine1_SNP.stdout
    Untracked:  analysis/DO_morphine1_combined.R
    Untracked:  analysis/DO_morphine1_combined.Rout
    Untracked:  analysis/DO_morphine1_combined.sh
    Untracked:  analysis/DO_morphine1_combined.stderr
    Untracked:  analysis/DO_morphine1_combined.stdout
    Untracked:  analysis/DO_morphine1_combined_69k.R
    Untracked:  analysis/DO_morphine1_combined_69k.Rout
    Untracked:  analysis/DO_morphine1_combined_69k.sh
    Untracked:  analysis/DO_morphine1_combined_69k.stderr
    Untracked:  analysis/DO_morphine1_combined_69k.stdout
    Untracked:  analysis/DO_morphine1_combined_69k_m2.R
    Untracked:  analysis/DO_morphine1_combined_69k_m2.Rout
    Untracked:  analysis/DO_morphine1_combined_69k_m2.sh
    Untracked:  analysis/DO_morphine1_combined_69k_m2.stderr
    Untracked:  analysis/DO_morphine1_combined_69k_m2.stdout
    Untracked:  analysis/DO_morphine1_combined_weight_DOB.R
    Untracked:  analysis/DO_morphine1_combined_weight_DOB.Rout
    Untracked:  analysis/DO_morphine1_combined_weight_DOB.err
    Untracked:  analysis/DO_morphine1_combined_weight_DOB.out
    Untracked:  analysis/DO_morphine1_combined_weight_DOB.sh
    Untracked:  analysis/DO_morphine1_combined_weight_DOB.stderr
    Untracked:  analysis/DO_morphine1_combined_weight_DOB.stdout
    Untracked:  analysis/DO_morphine1_combined_weight_age.R
    Untracked:  analysis/DO_morphine1_combined_weight_age.err
    Untracked:  analysis/DO_morphine1_combined_weight_age.out
    Untracked:  analysis/DO_morphine1_combined_weight_age.sh
    Untracked:  analysis/DO_morphine1_combined_weight_age_GAMMT.R
    Untracked:  analysis/DO_morphine1_combined_weight_age_GAMMT.err
    Untracked:  analysis/DO_morphine1_combined_weight_age_GAMMT.out
    Untracked:  analysis/DO_morphine1_combined_weight_age_GAMMT.sh
    Untracked:  analysis/DO_morphine1_combined_weight_age_GAMMT_chr19.R
    Untracked:  analysis/DO_morphine1_combined_weight_age_GAMMT_chr19.err
    Untracked:  analysis/DO_morphine1_combined_weight_age_GAMMT_chr19.out
    Untracked:  analysis/DO_morphine1_combined_weight_age_GAMMT_chr19.sh
    Untracked:  analysis/DO_morphine1_cph.R
    Untracked:  analysis/DO_morphine1_cph.Rout
    Untracked:  analysis/DO_morphine1_cph.sh
    Untracked:  analysis/DO_morphine1_second_set.R
    Untracked:  analysis/DO_morphine1_second_set.Rout
    Untracked:  analysis/DO_morphine1_second_set.sh
    Untracked:  analysis/DO_morphine1_second_set.stderr
    Untracked:  analysis/DO_morphine1_second_set.stdout
    Untracked:  analysis/DO_morphine1_second_set_69k.R
    Untracked:  analysis/DO_morphine1_second_set_69k.Rout
    Untracked:  analysis/DO_morphine1_second_set_69k.sh
    Untracked:  analysis/DO_morphine1_second_set_69k.stderr
    Untracked:  analysis/DO_morphine1_second_set_SNP.R
    Untracked:  analysis/DO_morphine1_second_set_SNP.Rout
    Untracked:  analysis/DO_morphine1_second_set_SNP.sh
    Untracked:  analysis/DO_morphine1_second_set_SNP.stderr
    Untracked:  analysis/DO_morphine1_second_set_SNP.stdout
    Untracked:  analysis/DO_morphine1_second_set_weight_DOB.R
    Untracked:  analysis/DO_morphine1_second_set_weight_DOB.Rout
    Untracked:  analysis/DO_morphine1_second_set_weight_DOB.err
    Untracked:  analysis/DO_morphine1_second_set_weight_DOB.out
    Untracked:  analysis/DO_morphine1_second_set_weight_DOB.sh
    Untracked:  analysis/DO_morphine1_second_set_weight_DOB.stderr
    Untracked:  analysis/DO_morphine1_second_set_weight_DOB.stdout
    Untracked:  analysis/DO_morphine1_second_set_weight_age.R
    Untracked:  analysis/DO_morphine1_second_set_weight_age.Rout
    Untracked:  analysis/DO_morphine1_second_set_weight_age.err
    Untracked:  analysis/DO_morphine1_second_set_weight_age.out
    Untracked:  analysis/DO_morphine1_second_set_weight_age.sh
    Untracked:  analysis/DO_morphine1_second_set_weight_age.stderr
    Untracked:  analysis/DO_morphine1_second_set_weight_age.stdout
    Untracked:  analysis/DO_morphine1_weight_DOB.R
    Untracked:  analysis/DO_morphine1_weight_DOB.sh
    Untracked:  analysis/DO_morphine1_weight_age.R
    Untracked:  analysis/DO_morphine1_weight_age.sh
    Untracked:  analysis/DO_morphine_gemma.R
    Untracked:  analysis/DO_morphine_gemma.err
    Untracked:  analysis/DO_morphine_gemma.out
    Untracked:  analysis/DO_morphine_gemma.sh
    Untracked:  analysis/DO_morphine_gemma_firstmin.R
    Untracked:  analysis/DO_morphine_gemma_firstmin.err
    Untracked:  analysis/DO_morphine_gemma_firstmin.out
    Untracked:  analysis/DO_morphine_gemma_firstmin.sh
    Untracked:  analysis/DO_morphine_gemma_withpermu.R
    Untracked:  analysis/DO_morphine_gemma_withpermu.err
    Untracked:  analysis/DO_morphine_gemma_withpermu.out
    Untracked:  analysis/DO_morphine_gemma_withpermu.sh
    Untracked:  analysis/DO_morphine_gemma_withpermu_firstbatch_min.depression.R
    Untracked:  analysis/DO_morphine_gemma_withpermu_firstbatch_min.depression.err
    Untracked:  analysis/DO_morphine_gemma_withpermu_firstbatch_min.depression.out
    Untracked:  analysis/DO_morphine_gemma_withpermu_firstbatch_min.depression.sh
    Untracked:  analysis/Plot_DO_morphine1_SNP.R
    Untracked:  analysis/Plot_DO_morphine1_SNP.Rout
    Untracked:  analysis/Plot_DO_morphine1_SNP.sh
    Untracked:  analysis/Plot_DO_morphine1_SNP.stderr
    Untracked:  analysis/Plot_DO_morphine1_SNP.stdout
    Untracked:  analysis/Plot_DO_morphine1_second_set_SNP.R
    Untracked:  analysis/Plot_DO_morphine1_second_set_SNP.Rout
    Untracked:  analysis/Plot_DO_morphine1_second_set_SNP.sh
    Untracked:  analysis/Plot_DO_morphine1_second_set_SNP.stderr
    Untracked:  analysis/Plot_DO_morphine1_second_set_SNP.stdout
    Untracked:  analysis/download_GSE100356_sra.sh
    Untracked:  analysis/fentanyl_2cohorts_coxph.R
    Untracked:  analysis/fentanyl_2cohorts_coxph.err
    Untracked:  analysis/fentanyl_2cohorts_coxph.out
    Untracked:  analysis/fentanyl_2cohorts_coxph.sh
    Untracked:  analysis/fentanyl_scanone.cph.R
    Untracked:  analysis/fentanyl_scanone.cph.err
    Untracked:  analysis/fentanyl_scanone.cph.out
    Untracked:  analysis/fentanyl_scanone.cph.sh
    Untracked:  analysis/geo_rnaseq.R
    Untracked:  analysis/heritability_first_second_batch.R
    Untracked:  analysis/nf-rnaseq-b6.R
    Untracked:  analysis/plot_fentanyl_2cohorts_coxph.R
    Untracked:  analysis/scripts/
    Untracked:  analysis/tibmr.R
    Untracked:  analysis/timbr_demo.R
    Untracked:  analysis/workflow_proc.R
    Untracked:  analysis/workflow_proc.sh
    Untracked:  analysis/workflow_proc.stderr
    Untracked:  analysis/workflow_proc.stdout
    Untracked:  analysis/x.R
    Untracked:  code/cfw/
    Untracked:  code/gemma_plot.R
    Untracked:  code/process.sanger.snp.R
    Untracked:  code/reconst_utils.R
    Untracked:  data/69k_grid_pgmap.RData
    Untracked:  data/Composite Post Kevins Program Group 2 Fentanyl Prepped for Hao.xlsx
    Untracked:  data/DO_WBP_Data_JAB_to_map.xlsx
    Untracked:  data/Fentanyl_alternate_metrics.xlsx
    Untracked:  data/FinalReport/
    Untracked:  data/GM/
    Untracked:  data/GM_covar.csv
    Untracked:  data/GM_covar_07092018_morphine.csv
    Untracked:  data/Jackson_Lab_Bubier_MURGIGV01/
    Untracked:  data/MPD_Upload_October.csv
    Untracked:  data/MPD_Upload_October_updated_sex.csv
    Untracked:  data/Master Fentanyl DO Study Sheet.xlsx
    Untracked:  data/MasterMorphine Second Set DO w DOB2.xlsx
    Untracked:  data/MasterMorphine Second Set DO.xlsx
    Untracked:  data/Morphine CC DO mice Updated with Published inbred strains.csv
    Untracked:  data/Morphine_CC_DO_mice_Updated_with_Published_inbred_strains.csv
    Untracked:  data/cc_variants.sqlite
    Untracked:  data/combined/
    Untracked:  data/fentanyl/
    Untracked:  data/fentanyl2/
    Untracked:  data/fentanyl_1_2/
    Untracked:  data/fentanyl_2cohorts_coxph_data.Rdata
    Untracked:  data/first/
    Untracked:  data/founder_geno.csv
    Untracked:  data/genetic_map.csv
    Untracked:  data/gm.json
    Untracked:  data/gwas.sh
    Untracked:  data/marker_grid_0.02cM_plus.txt
    Untracked:  data/mouse_genes_mgi.sqlite
    Untracked:  data/pheno.csv
    Untracked:  data/pheno_qtl2.csv
    Untracked:  data/pheno_qtl2_07092018_morphine.csv
    Untracked:  data/pheno_qtl2_w_dob.csv
    Untracked:  data/physical_map.csv
    Untracked:  data/rnaseq/
    Untracked:  data/sample_geno.csv
    Untracked:  data/second/
    Untracked:  figure/
    Untracked:  glimma-plots/
    Untracked:  output/DO_Fentanyl_Cohort2_MinDepressionRR_coefplot.pdf
    Untracked:  output/DO_Fentanyl_Cohort2_MinDepressionRR_coefplot_blup.pdf
    Untracked:  output/DO_Fentanyl_Cohort2_RRDepressionRateHrSLOPE_coefplot.pdf
    Untracked:  output/DO_Fentanyl_Cohort2_RRRecoveryRateHrSLOPE_coefplot.pdf
    Untracked:  output/DO_Fentanyl_Cohort2_RRRecoveryRateHrSLOPE_coefplot_blup.pdf
    Untracked:  output/DO_Fentanyl_Cohort2_StartofRecoveryHr_coefplot.pdf
    Untracked:  output/DO_Fentanyl_Cohort2_StartofRecoveryHr_coefplot_blup.pdf
    Untracked:  output/DO_Fentanyl_Cohort2_Statusbin_coefplot.pdf
    Untracked:  output/DO_Fentanyl_Cohort2_Statusbin_coefplot_blup.pdf
    Untracked:  output/DO_Fentanyl_Cohort2_SteadyStateDepressionDurationHrINTERVAL_coefplot.pdf
    Untracked:  output/DO_Fentanyl_Cohort2_TimetoDead(Hr)_coefplot.pdf
    Untracked:  output/DO_Fentanyl_Cohort2_TimetoDeadHr_coefplot.pdf
    Untracked:  output/DO_Fentanyl_Cohort2_TimetoDeadHr_coefplot_blup.pdf
    Untracked:  output/DO_Fentanyl_Cohort2_TimetoProjectedRecoveryHr_coefplot.pdf
    Untracked:  output/DO_Fentanyl_Cohort2_TimetoProjectedRecoveryHr_coefplot_blup.pdf
    Untracked:  output/DO_Fentanyl_Cohort2_TimetoSteadyRRDepression(Hr)_coefplot.pdf
    Untracked:  output/DO_Fentanyl_Cohort2_TimetoSteadyRRDepressionHr_coefplot.pdf
    Untracked:  output/DO_Fentanyl_Cohort2_TimetoSteadyRRDepressionHr_coefplot_blup.pdf
    Untracked:  output/DO_Fentanyl_Cohort2_TimetoThresholdRecoveryHr_coefplot.pdf
    Untracked:  output/DO_Fentanyl_Cohort2_TimetoThresholdRecoveryHr_coefplot_blup.pdf
    Untracked:  output/DO_morphine_Min.depression.png
    Untracked:  output/DO_morphine_Min.depression22222_violin_chr5.pdf
    Untracked:  output/DO_morphine_Min.depression_coefplot.pdf
    Untracked:  output/DO_morphine_Min.depression_coefplot_blup.pdf
    Untracked:  output/DO_morphine_Min.depression_coefplot_blup_chr5.png
    Untracked:  output/DO_morphine_Min.depression_coefplot_blup_chrX.png
    Untracked:  output/DO_morphine_Min.depression_coefplot_chr5.png
    Untracked:  output/DO_morphine_Min.depression_coefplot_chrX.png
    Untracked:  output/DO_morphine_Min.depression_peak_genes_chr5.png
    Untracked:  output/DO_morphine_Min.depression_violin_chr5.png
    Untracked:  output/DO_morphine_Recovery.Time.png
    Untracked:  output/DO_morphine_Recovery.Time_coefplot.pdf
    Untracked:  output/DO_morphine_Recovery.Time_coefplot_blup.pdf
    Untracked:  output/DO_morphine_Recovery.Time_coefplot_blup_chr11.png
    Untracked:  output/DO_morphine_Recovery.Time_coefplot_blup_chr4.png
    Untracked:  output/DO_morphine_Recovery.Time_coefplot_blup_chr7.png
    Untracked:  output/DO_morphine_Recovery.Time_coefplot_blup_chr9.png
    Untracked:  output/DO_morphine_Recovery.Time_coefplot_chr11.png
    Untracked:  output/DO_morphine_Recovery.Time_coefplot_chr4.png
    Untracked:  output/DO_morphine_Recovery.Time_coefplot_chr7.png
    Untracked:  output/DO_morphine_Recovery.Time_coefplot_chr9.png
    Untracked:  output/DO_morphine_Status_bin.png
    Untracked:  output/DO_morphine_Status_bin_coefplot.pdf
    Untracked:  output/DO_morphine_Status_bin_coefplot_blup.pdf
    Untracked:  output/DO_morphine_Survival.Time.png
    Untracked:  output/DO_morphine_Survival.Time_coefplot.pdf
    Untracked:  output/DO_morphine_Survival.Time_coefplot_blup.pdf
    Untracked:  output/DO_morphine_Survival.Time_coefplot_blup_chr17.png
    Untracked:  output/DO_morphine_Survival.Time_coefplot_blup_chr8.png
    Untracked:  output/DO_morphine_Survival.Time_coefplot_chr17.png
    Untracked:  output/DO_morphine_Survival.Time_coefplot_chr8.png
    Untracked:  output/DO_morphine_combine_batch_peak_violin.pdf
    Untracked:  output/DO_morphine_combined_69k_m2_Min.depression.png
    Untracked:  output/DO_morphine_combined_69k_m2_Min.depression_coefplot.pdf
    Untracked:  output/DO_morphine_combined_69k_m2_Min.depression_coefplot_blup.pdf
    Untracked:  output/DO_morphine_combined_69k_m2_Recovery.Time.png
    Untracked:  output/DO_morphine_combined_69k_m2_Recovery.Time_coefplot.pdf
    Untracked:  output/DO_morphine_combined_69k_m2_Recovery.Time_coefplot_blup.pdf
    Untracked:  output/DO_morphine_combined_69k_m2_Status_bin.png
    Untracked:  output/DO_morphine_combined_69k_m2_Status_bin_coefplot.pdf
    Untracked:  output/DO_morphine_combined_69k_m2_Status_bin_coefplot_blup.pdf
    Untracked:  output/DO_morphine_combined_69k_m2_Survival.Time.png
    Untracked:  output/DO_morphine_combined_69k_m2_Survival.Time_coefplot.pdf
    Untracked:  output/DO_morphine_combined_69k_m2_Survival.Time_coefplot_blup.pdf
    Untracked:  output/DO_morphine_coxph_24hrs_kinship_QTL.png
    Untracked:  output/DO_morphine_cphout.RData
    Untracked:  output/DO_morphine_first_batch_peak_in_second_batch_violin.pdf
    Untracked:  output/DO_morphine_first_batch_peak_in_second_batch_violin_sidebyside.pdf
    Untracked:  output/DO_morphine_first_batch_peak_violin.pdf
    Untracked:  output/DO_morphine_operm.cph.RData
    Untracked:  output/DO_morphine_second_batch_on_first_batch_peak_violin.pdf
    Untracked:  output/DO_morphine_second_batch_peak_ch6surv_on_first_batchviolin.pdf
    Untracked:  output/DO_morphine_second_batch_peak_ch6surv_on_first_batchviolin2.pdf
    Untracked:  output/DO_morphine_second_batch_peak_in_first_batch_violin.pdf
    Untracked:  output/DO_morphine_second_batch_peak_in_first_batch_violin_sidebyside.pdf
    Untracked:  output/DO_morphine_second_batch_peak_violin.pdf
    Untracked:  output/DO_morphine_secondbatch_69k_Min.depression.png
    Untracked:  output/DO_morphine_secondbatch_69k_Min.depression_coefplot.pdf
    Untracked:  output/DO_morphine_secondbatch_69k_Min.depression_coefplot_blup.pdf
    Untracked:  output/DO_morphine_secondbatch_69k_Recovery.Time.png
    Untracked:  output/DO_morphine_secondbatch_69k_Recovery.Time_coefplot.pdf
    Untracked:  output/DO_morphine_secondbatch_69k_Recovery.Time_coefplot_blup.pdf
    Untracked:  output/DO_morphine_secondbatch_69k_Status_bin.png
    Untracked:  output/DO_morphine_secondbatch_69k_Status_bin_coefplot.pdf
    Untracked:  output/DO_morphine_secondbatch_69k_Status_bin_coefplot_blup.pdf
    Untracked:  output/DO_morphine_secondbatch_69k_Survival.Time.png
    Untracked:  output/DO_morphine_secondbatch_69k_Survival.Time_coefplot.pdf
    Untracked:  output/DO_morphine_secondbatch_69k_Survival.Time_coefplot_blup.pdf
    Untracked:  output/DO_morphine_secondbatch_Min.depression.png
    Untracked:  output/DO_morphine_secondbatch_Min.depression_coefplot.pdf
    Untracked:  output/DO_morphine_secondbatch_Min.depression_coefplot_blup.pdf
    Untracked:  output/DO_morphine_secondbatch_Recovery.Time.png
    Untracked:  output/DO_morphine_secondbatch_Recovery.Time_coefplot.pdf
    Untracked:  output/DO_morphine_secondbatch_Recovery.Time_coefplot_blup.pdf
    Untracked:  output/DO_morphine_secondbatch_Status_bin.png
    Untracked:  output/DO_morphine_secondbatch_Status_bin_coefplot.pdf
    Untracked:  output/DO_morphine_secondbatch_Status_bin_coefplot_blup.pdf
    Untracked:  output/DO_morphine_secondbatch_Survival.Time.png
    Untracked:  output/DO_morphine_secondbatch_Survival.Time_coefplot.pdf
    Untracked:  output/DO_morphine_secondbatch_Survival.Time_coefplot_blup.pdf
    Untracked:  output/Fentanyl/
    Untracked:  output/KPNA3.pdf
    Untracked:  output/SSC4D.pdf
    Untracked:  output/TIMBR.test.RData
    Untracked:  output/apr_69kchr_combined.RData
    Untracked:  output/apr_69kchr_k_loco_combined.rds
    Untracked:  output/apr_69kchr_second_set.RData
    Untracked:  output/combine_batch_variation.RData
    Untracked:  output/combined_gm.RData
    Untracked:  output/combined_gm.k_loco.rds
    Untracked:  output/combined_gm.k_overall.rds
    Untracked:  output/combined_gm.probs_8state.rds
    Untracked:  output/coxph/
    Untracked:  output/do.morphine.RData
    Untracked:  output/do.morphine.k_loco.rds
    Untracked:  output/do.morphine.probs_36state.rds
    Untracked:  output/do.morphine.probs_8state.rds
    Untracked:  output/do_Fentanyl_combine2cohort_MeanDepressionBR_coefplot.pdf
    Untracked:  output/do_Fentanyl_combine2cohort_MeanDepressionBR_coefplot_blup.pdf
    Untracked:  output/do_Fentanyl_combine2cohort_MinDepressionBR_coefplot.pdf
    Untracked:  output/do_Fentanyl_combine2cohort_MinDepressionBR_coefplot_blup.pdf
    Untracked:  output/do_Fentanyl_combine2cohort_MinDepressionRR_coefplot.pdf
    Untracked:  output/do_Fentanyl_combine2cohort_MinDepressionRR_coefplot_blup.pdf
    Untracked:  output/do_Fentanyl_combine2cohort_RRRecoveryRateHr_coefplot.pdf
    Untracked:  output/do_Fentanyl_combine2cohort_RRRecoveryRateHr_coefplot_blup.pdf
    Untracked:  output/do_Fentanyl_combine2cohort_StartofRecoveryHr_coefplot.pdf
    Untracked:  output/do_Fentanyl_combine2cohort_StartofRecoveryHr_coefplot_blup.pdf
    Untracked:  output/do_Fentanyl_combine2cohort_Statusbin_coefplot.pdf
    Untracked:  output/do_Fentanyl_combine2cohort_Statusbin_coefplot_blup.pdf
    Untracked:  output/do_Fentanyl_combine2cohort_SteadyStateDepressionDurationHr_coefplot.pdf
    Untracked:  output/do_Fentanyl_combine2cohort_SteadyStateDepressionDurationHr_coefplot_blup.pdf
    Untracked:  output/do_Fentanyl_combine2cohort_SurvivalTime_coefplot.pdf
    Untracked:  output/do_Fentanyl_combine2cohort_SurvivalTime_coefplot_blup.pdf
    Untracked:  output/do_Fentanyl_combine2cohort_TimetoDeadHr_coefplot.pdf
    Untracked:  output/do_Fentanyl_combine2cohort_TimetoDeadHr_coefplot_blup.pdf
    Untracked:  output/do_Fentanyl_combine2cohort_TimetoMostlyDeadHr_coefplot.pdf
    Untracked:  output/do_Fentanyl_combine2cohort_TimetoMostlyDeadHr_coefplot_blup.pdf
    Untracked:  output/do_Fentanyl_combine2cohort_TimetoProjectedRecoveryHr_coefplot.pdf
    Untracked:  output/do_Fentanyl_combine2cohort_TimetoProjectedRecoveryHr_coefplot_blup.pdf
    Untracked:  output/do_Fentanyl_combine2cohort_TimetoRecoveryHr_coefplot.pdf
    Untracked:  output/do_Fentanyl_combine2cohort_TimetoRecoveryHr_coefplot_blup.pdf
    Untracked:  output/first_batch_variation.RData
    Untracked:  output/first_second_survival_peak_chr.xlsx
    Untracked:  output/hsq_1_first_batch_herit_qtl2.RData
    Untracked:  output/hsq_2_second_batch_herit_qtl2.RData
    Untracked:  output/old_temp/
    Untracked:  output/pr_69kchr_combined.RData
    Untracked:  output/pr_69kchr_second_set.RData
    Untracked:  output/qtl.morphine.69k.out.combined.RData
    Untracked:  output/qtl.morphine.69k.out.combined_m2.RData
    Untracked:  output/qtl.morphine.69k.out.second_set.RData
    Untracked:  output/qtl.morphine.operm.RData
    Untracked:  output/qtl.morphine.out.RData
    Untracked:  output/qtl.morphine.out.combined_gm.RData
    Untracked:  output/qtl.morphine.out.combined_gm.female.RData
    Untracked:  output/qtl.morphine.out.combined_gm.male.RData
    Untracked:  output/qtl.morphine.out.combined_weight_DOB.RData
    Untracked:  output/qtl.morphine.out.combined_weight_age.RData
    Untracked:  output/qtl.morphine.out.female.RData
    Untracked:  output/qtl.morphine.out.male.RData
    Untracked:  output/qtl.morphine.out.second_set.RData
    Untracked:  output/qtl.morphine.out.second_set.female.RData
    Untracked:  output/qtl.morphine.out.second_set.male.RData
    Untracked:  output/qtl.morphine.out.second_set.weight_DOB.RData
    Untracked:  output/qtl.morphine.out.second_set.weight_age.RData
    Untracked:  output/qtl.morphine.out.weight_DOB.RData
    Untracked:  output/qtl.morphine.out.weight_age.RData
    Untracked:  output/qtl.morphine1.snpout.RData
    Untracked:  output/qtl.morphine2.snpout.RData
    Untracked:  output/second_batch_pheno.csv
    Untracked:  output/second_batch_variation.RData
    Untracked:  output/second_set_apr_69kchr_k_loco.rds
    Untracked:  output/second_set_gm.RData
    Untracked:  output/second_set_gm.k_loco.rds
    Untracked:  output/second_set_gm.probs_36state.rds
    Untracked:  output/second_set_gm.probs_8state.rds
    Untracked:  output/topSNP_chr5_mindepression.csv
    Untracked:  output/zoompeak_Min.depression_9.pdf
    Untracked:  output/zoompeak_Recovery.Time_16.pdf
    Untracked:  output/zoompeak_Status_bin_11.pdf
    Untracked:  output/zoompeak_Survival.Time_1.pdf
    Untracked:  output/zoompeak_fentanyl_Survival.Time_2.pdf
    Untracked:  sra-tools_v2.10.7.sif

Unstaged changes:
    Modified:   _workflowr.yml
    Modified:   analysis/Plot_DO_Fentanyl_Cohort2_mapping.Rmd
    Modified:   analysis/Plot_DO_Fentanyl_combining2Cohort_mapping.Rmd
    Modified:   analysis/Plot_DO_fentanyl.Rmd
    Modified:   analysis/marker_violin.Rmd
Note that any generated files, e.g. HTML, png, CSS, etc., are not included in this status report because it is ok for generated content to have uncommitted changes.
These are the previous versions of the repository in which changes were made to the R Markdown (analysis/Plot_DO_morphine_combined.Rmd) and HTML (docs/Plot_DO_morphine_combined.html) files. If you’ve configured a remote Git repository (see ?wflow_git_remote), click on the hyperlinks in the table below to view the files as they were in that past version.
| File | Version | Author | Date | Message |
|---|---|---|---|---|
| Rmd | cc3ae27 | xhyuo | 2023-02-21 | update with sex specific morphine plot |
| html | 8fe8543 | xhyuo | 2023-02-20 | Build site. |
| Rmd | b46775c | xhyuo | 2023-02-20 | update with sex specific morphine |
| html | 422da68 | xhyuo | 2020-07-12 | Build site. |
| Rmd | f210d8a | xhyuo | 2020-07-12 | Plot_DO_morphine_combined |
Last update: 2023-02-21
loading libraries
library(ggplot2)
library(gridExtra)
library(GGally)
library(parallel)
library(qtl2)
library(parallel)
library(survival)
library(regress)
library(abind)
library("readxl")

rz.transform <- function(y) {
  rankY=rank(y, ties.method="average", na.last="keep")
  rzT=qnorm(rankY/(length(na.exclude(rankY))+1))
  return(rzT)
}
load("code/do.colors.RData")
Read phenotype data
# Read phenotype data for first batch-----------------------------------------------------
#morphine pheno
morphine.pheno <- read.csv("data/pheno_qtl2_07092018_morphine.csv",header = T)
#remove duplicate id
morphine.pheno <- morphine.pheno[!morphine.pheno$X %in% c("morphine_DO_jbubier_13645_C9", "morphine_DO_jbubier_13554_H1"),]
morphine.pheno <- data.frame(ID = morphine.pheno$X,
                             Sex = NA,
                             GENERATION = NA,
                             GROUP = NA,
                             Date = NA,
                             Status24 = morphine.pheno$Status,
                             Survival.Time = morphine.pheno$Survival.Time,
                             Recovery.Time = morphine.pheno$Recovery.Time,
                             Min.depression = morphine.pheno$Min.depression,
                             Status_bin = morphine.pheno$Status_bin,
                             RL = "NO")
rownames(morphine.pheno) <- gsub("morphine_DO_jbubier_","", morphine.pheno$ID)
rownames(morphine.pheno) <- gsub("\\_.*","", rownames(morphine.pheno))

# Read phenotype data for second batch-----------------------------------------------------
second_set <- read_xlsx(path = "data/MasterMorphine Second Set DO.xlsx",
                        sheet = 1)
second_set <- as.data.frame(second_set)
colnames(second_set)[2] <- "Sex"
colnames(second_set)[6] <- "Status24"
#character
second_set[,c("ID", "Sex", "GROUP", "Status24")] <- lapply(second_set[, c("ID", "Sex", "GROUP", "Status24")], as.character)
second_set$Status_bin <- ifelse(second_set$Status24 == "ALIVE", 1, 0)
rownames(second_set) <- second_set$ID

#remove outlier
second_set <- second_set[second_set$ID != "empty",]
colnames(second_set) <- c("ID","Sex","GENERATION","GROUP","Date",
                          "Status24", "Survival.Time","Recovery.Time", "Min.depression",
                          "Status_bin")
#remove negative survival time subjects
second_set <- second_set[!(!is.na(second_set$Survival.Time) & second_set$Survival.Time < 0),]
second_set$Survival.Time[!is.na(second_set$Survival.Time) & second_set$Survival.Time > 15] <- NA
second_set$Recovery.Time[!is.na(second_set$Recovery.Time) & second_set$Recovery.Time > 24] <- NA
second_set$Min.depression[!is.na(second_set$Min.depression) & second_set$Min.depression > 1] <- NA
second_set$RL = "YES"

#combined pheno
pheno <- rbind(morphine.pheno, second_set)

#load json object
load("/projects/csna/csna_workflow/data/Jackson_Lab_11_batches/gm_DO2816_qc.RData")
#replace id names
old_ids <- paste0(as.character(do.call(rbind.data.frame, strsplit(ind_ids(gm_DO2816_qc), "_"))[,6]))
old_ids <- make.unique(as.character(old_ids), sep = "_")
new_ids <- setNames(old_ids,
                    ind_ids(gm_DO2816_qc))
combined_gm <- replace_ids(gm_DO2816_qc, new_ids)[intersect(rownames(pheno),old_ids), ]
combined_gm
# Object of class cross2 (crosstype "do")
#
# Total individuals               646
# No. genotyped individuals       646
# No. phenotyped individuals      646
# No. with both geno & pheno      646
#
# No. phenotypes                    1
# No. covariates                    4
# No. phenotype covariates          0
#
# No. chromosomes                  20
# Total markers                112455
#
# No. markers by chr:
#    1    2    3    4    5    6    7    8    9   10   11   12   13   14   15   16
# 8530 8649 6403 6600 6559 6427 6281 5660 5854 5439 6338 5151 5257 5025 4547 4355
#   17   18   19    X
# 4321 3986 3102 3971

#update pheno
pheno <- merge(pheno, combined_gm$covar, by = "row.names", all.y = "TRUE")
rownames(pheno) <- pheno$Row.names
pheno <- pheno[,-1]
#remove generation 32 35
pheno <- pheno[!pheno$ngen %in% c("32", "35"),]

combined_gm <- combined_gm[rownames(pheno),]
combined_gm
# Object of class cross2 (crosstype "do")
#
# Total individuals               637
# No. genotyped individuals       637
# No. phenotyped individuals      637
# No. with both geno & pheno      637
#
# No. phenotypes                    1
# No. covariates                    4
# No. phenotype covariates          0
#
# No. chromosomes                  20
# Total markers                112455
#
# No. markers by chr:
#    1    2    3    4    5    6    7    8    9   10   11   12   13   14   15   16
# 8530 8649 6403 6600 6559 6427 6281 5660 5854 5439 6338 5151 5257 5025 4547 4355
#   17   18   19    X
# 4321 3986 3102 3971

#covar
#first batch
covar1 <- read.csv("data/GM_covar_07092018_morphine.csv",header = T)
#remove duplicate id
covar1 <- covar1[!covar1$X %in% c("morphine_DO_jbubier_13645_C9", "morphine_DO_jbubier_13554_H1"),]
rownames(covar1) <- gsub("morphine_DO_jbubier_","", covar1$id)
rownames(covar1) <- gsub("\\_.*","", rownames(covar1))
covar1 <- covar1[,c(2:5)]
colnames(covar1) <- c("ID", "Sex", "GENERATION", "Date")

#second batch
covar2 <- second_set[,c("ID", "Sex", "GENERATION", "Date")]
covar2$Date <- as.character(covar2$Date)

#combine covar
covar <- rbind(covar1, covar2)
covar <- covar[rownames(pheno),]
covar$Sex <- as.factor(covar$Sex)
covar$Date <- as.factor(covar$Date)

all.equal(rownames(pheno), rownames(covar))
# [1] TRUE

#boxplot for the pheno by generation
data <- cbind(pheno, covar)
#boxplot
#survival time
surv <- data[,c(1, 7, 11, 14, 15, 19)]
surv$ngen <- factor(surv$ngen, levels = as.character(c(29:34)))
p1 <- ggplot(surv, aes(x=ngen, y=Survival.Time, group = ngen, fill = ngen, alpha = 0.9)) +
  geom_boxplot(show.legend = F , outlier.size = 1.5, notchwidth = 0.85) +
  geom_jitter(color="black", size=0.8, alpha=0.9) +
  scale_fill_brewer(palette="Blues") +
  ylab("Survival Time") +
  xlab("Generation") +
  labs(fill = "") +
  theme(legend.position = "none",
        panel.grid.major = element_blank(),
        panel.grid.minor = element_blank(),
        panel.background = element_blank(),
        axis.line = element_line(colour = "black"),
        text = element_text(size=16),
        axis.title=element_text(size=16)) +
  guides(shape = guide_legend(override.aes = list(size = 12)))
p1
# Warning: Removed 384 rows containing non-finite values (stat_boxplot).
# Warning: Removed 384 rows containing missing values (geom_point).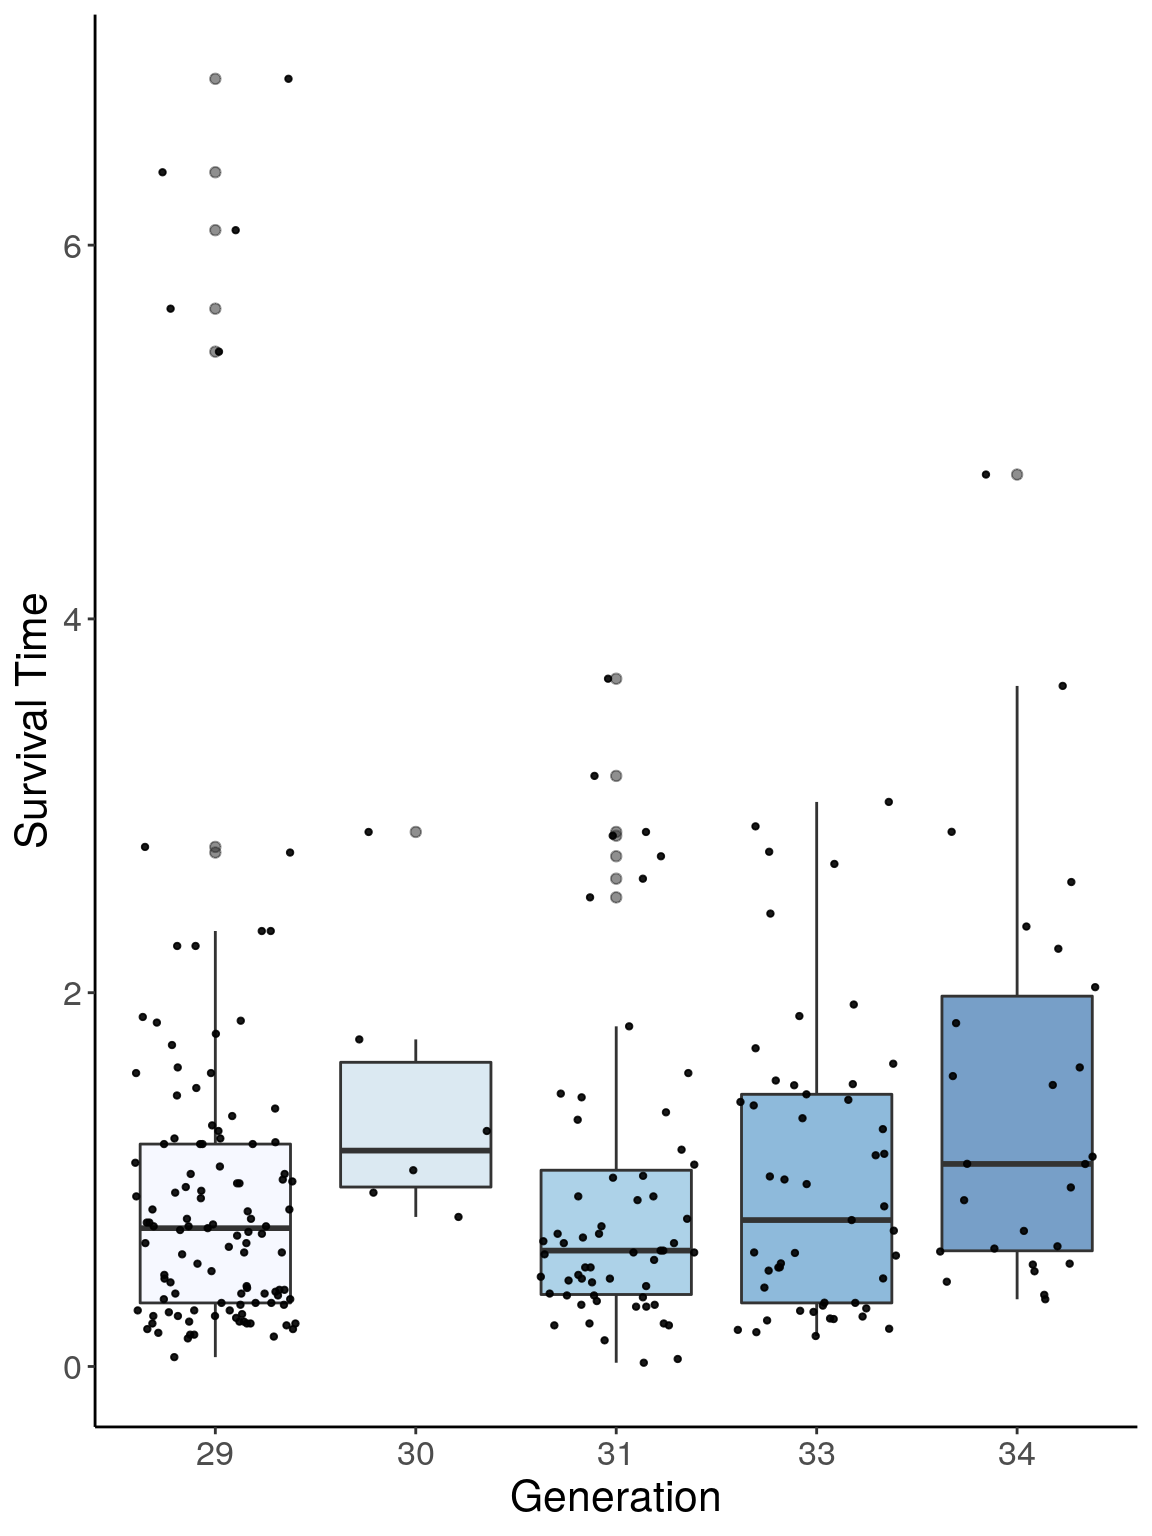
p1.1 <- ggplot(surv, aes(x=sex, y=Survival.Time, group = sex, fill = sex, alpha = 0.9)) +
  geom_boxplot(show.legend = F , outlier.size = 1.5, notchwidth = 0.85) +
  geom_jitter(color="black", size=0.8, alpha=0.9) +
  scale_fill_brewer(palette="Blues") +
  ylab("Survival Time") +
  xlab("sex") +
  labs(fill = "") +
  theme(legend.position = "none",
        panel.grid.major = element_blank(),
        panel.grid.minor = element_blank(),
        panel.background = element_blank(),
        axis.line = element_line(colour = "black"),
        text = element_text(size=16),
        axis.title=element_text(size=16)) +
  guides(shape = guide_legend(override.aes = list(size = 12)))
p1.1
# Warning: Removed 384 rows containing non-finite values (stat_boxplot).

# Warning: Removed 384 rows containing missing values (geom_point).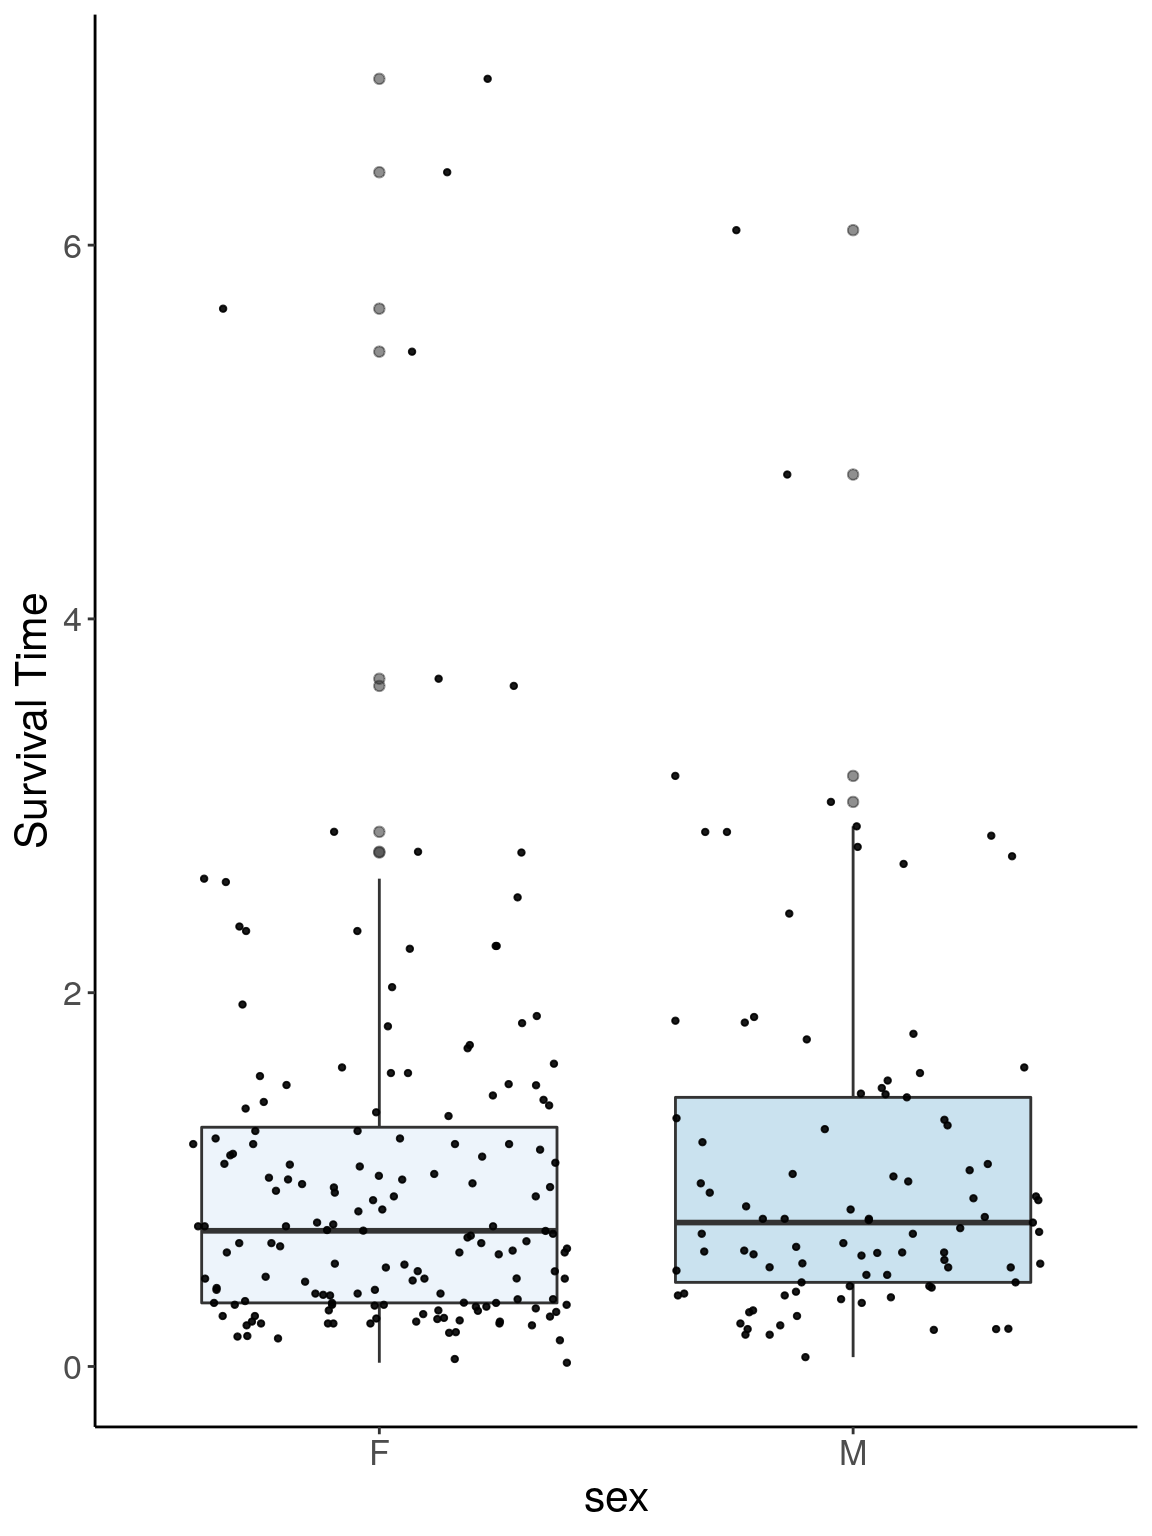
p1.2 <- ggplot(surv, aes(x=RL, y=Survival.Time, group = RL, fill = RL, alpha = 0.9)) +
  geom_boxplot(show.legend = F , outlier.size = 1.5, notchwidth = 0.85) +
  geom_jitter(color="black", size=0.8, alpha=0.9) +
  scale_fill_brewer(palette="Blues") +
  ylab("Survival Time") +
  xlab("RL") +
  labs(fill = "") +
  theme(legend.position = "none",
        panel.grid.major = element_blank(),
        panel.grid.minor = element_blank(),
        panel.background = element_blank(),
        axis.line = element_line(colour = "black"),
        text = element_text(size=16),
        axis.title=element_text(size=16)) +
  guides(shape = guide_legend(override.aes = list(size = 12)))
p1.2
# Warning: Removed 384 rows containing non-finite values (stat_boxplot).

# Warning: Removed 384 rows containing missing values (geom_point).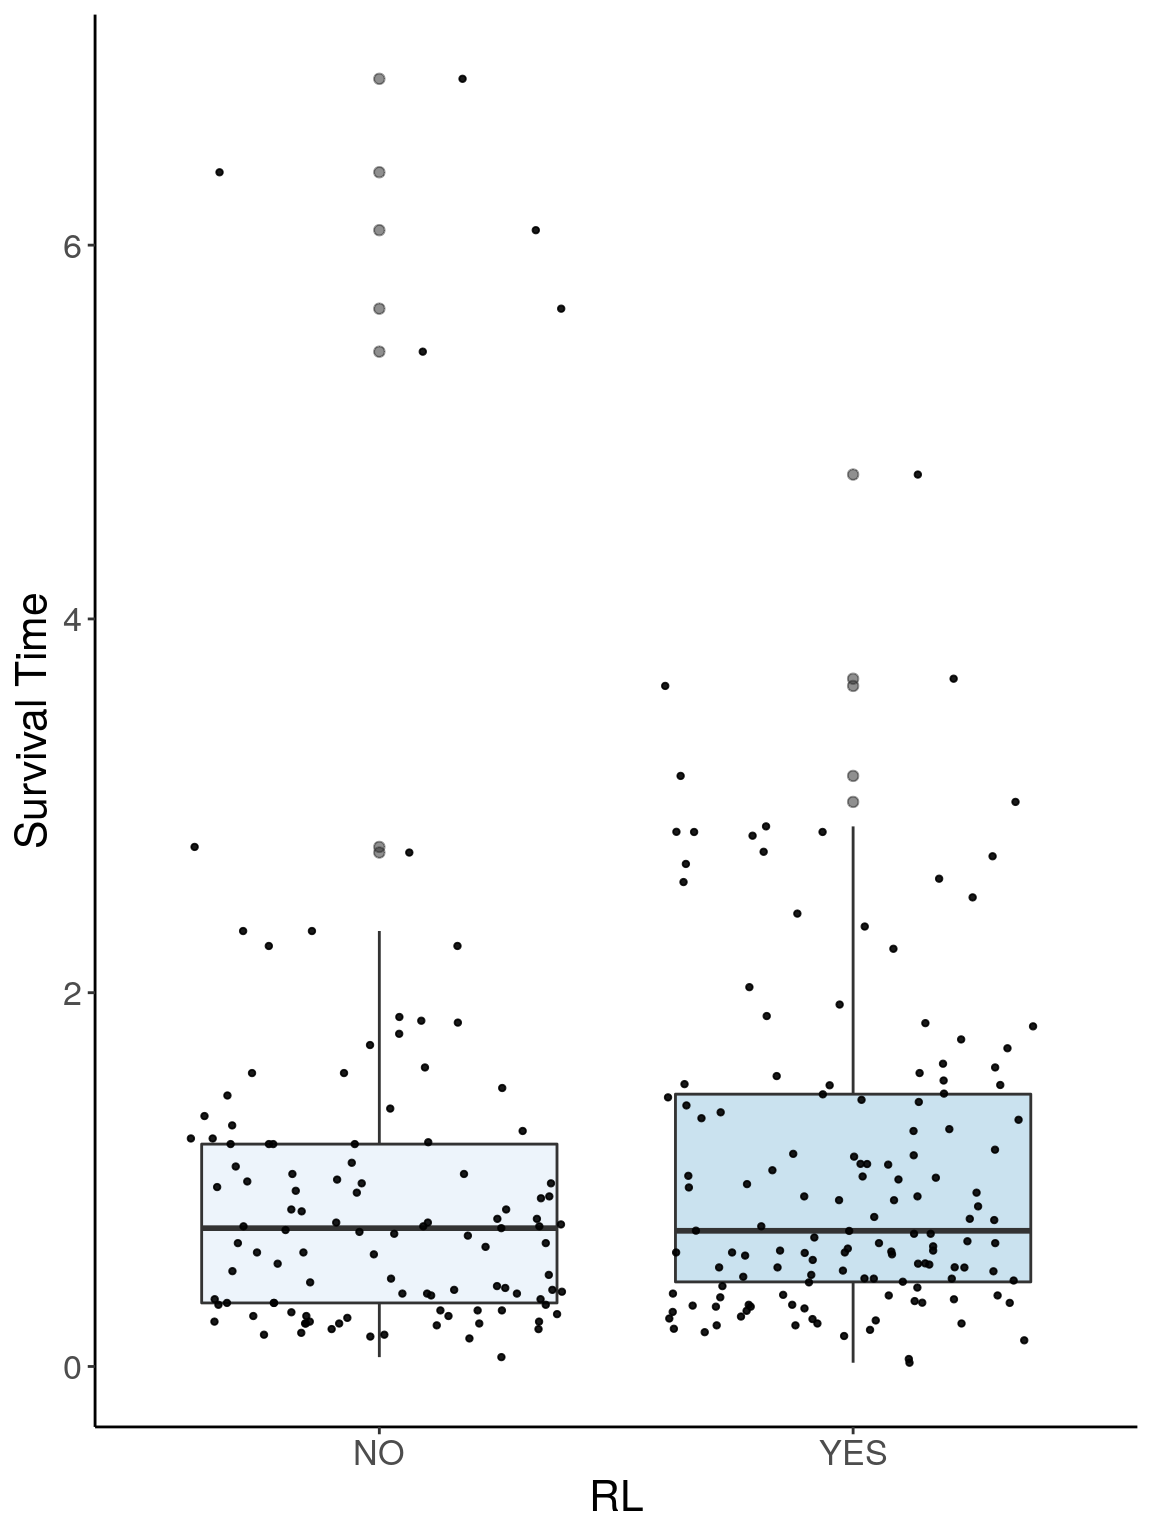
reco <- data[,c(1, 8, 11, 14, 15, 19)]
reco$ngen <- factor(reco$ngen, levels = as.character(c(29:35)))
p2 <- ggplot(reco, aes(x=ngen, y=Recovery.Time, group = ngen, fill = ngen, alpha = 0.9)) +
  geom_boxplot(show.legend = F , outlier.size = 1.5, notchwidth = 0.85) +
  geom_jitter(color="black", size=0.8, alpha=0.9) +
  scale_fill_brewer(palette="Blues") +
  ylab("Recovery Time") +
  xlab("Generation") +
  labs(fill = "") +
  theme(legend.position = "none",
        panel.grid.major = element_blank(),
        panel.grid.minor = element_blank(),
        panel.background = element_blank(),
        axis.line = element_line(colour = "black"),
        text = element_text(size=16),
        axis.title=element_text(size=16)) +
  guides(shape = guide_legend(override.aes = list(size = 12)))
p2
# Warning: Removed 266 rows containing non-finite values (stat_boxplot).
# Warning: Removed 266 rows containing missing values (geom_point).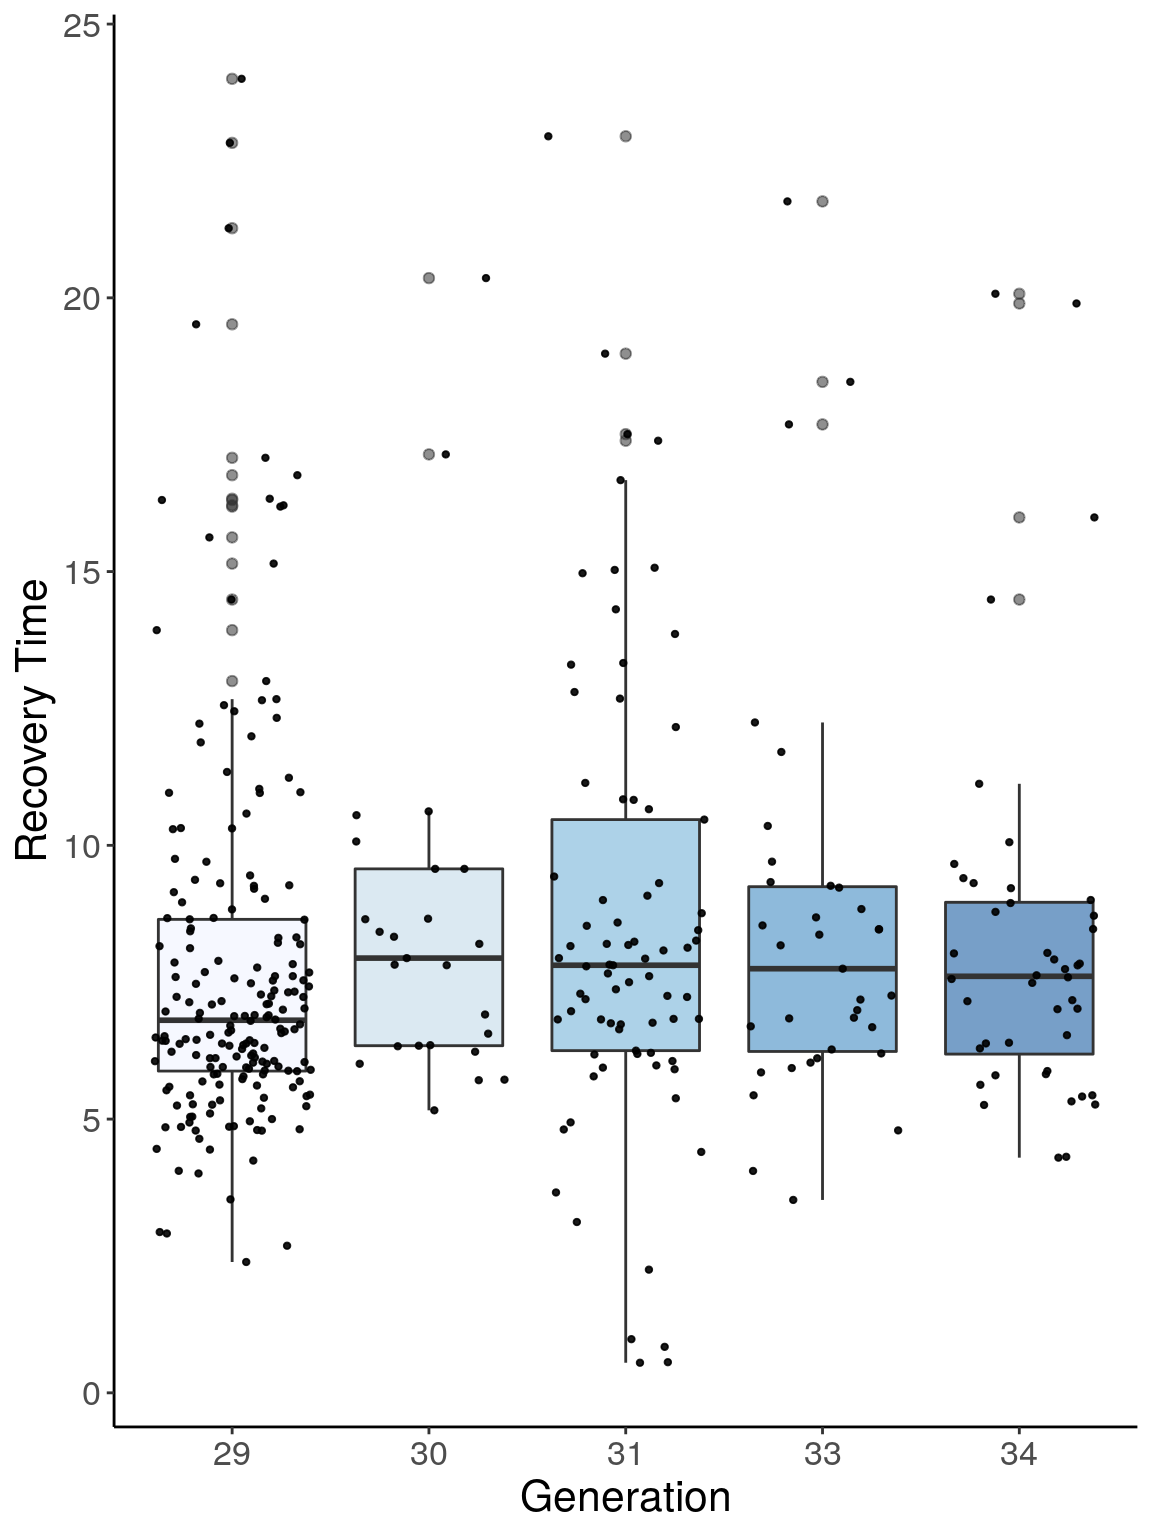
p2.1 <- ggplot(reco, aes(x=sex, y=Recovery.Time, group = sex, fill = sex, alpha = 0.9)) +
  geom_boxplot(show.legend = F , outlier.size = 1.5, notchwidth = 0.85) +
  geom_jitter(color="black", size=0.8, alpha=0.9) +
  scale_fill_brewer(palette="Blues") +
  ylab("Recovery Time") +
  xlab("sex") +
  labs(fill = "") +
  theme(legend.position = "none",
        panel.grid.major = element_blank(),
        panel.grid.minor = element_blank(),
        panel.background = element_blank(),
        axis.line = element_line(colour = "black"),
        text = element_text(size=16),
        axis.title=element_text(size=16)) +
  guides(shape = guide_legend(override.aes = list(size = 12)))
p2.1
# Warning: Removed 266 rows containing non-finite values (stat_boxplot).

# Warning: Removed 266 rows containing missing values (geom_point).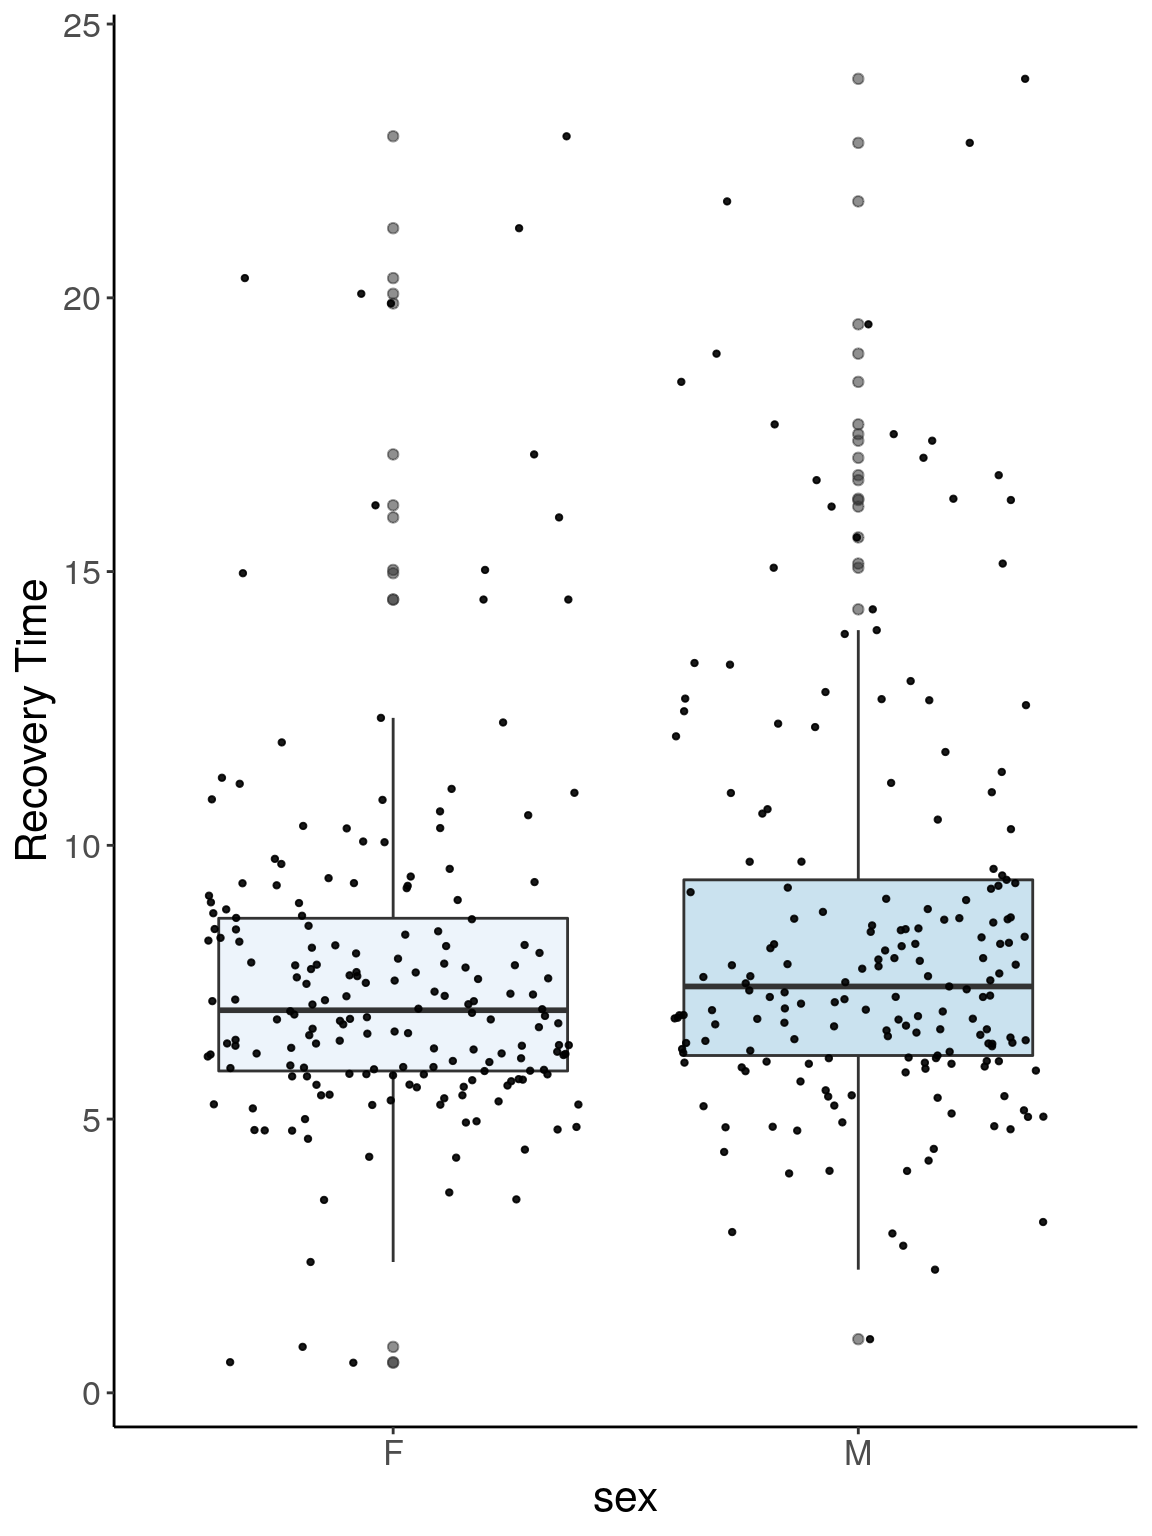
p2.2 <- ggplot(reco, aes(x=RL, y=Recovery.Time, group = RL, fill = RL, alpha = 0.9)) +
  geom_boxplot(show.legend = F , outlier.size = 1.5, notchwidth = 0.85) +
  geom_jitter(color="black", size=0.8, alpha=0.9) +
  scale_fill_brewer(palette="Blues") +
  ylab("Recovery Time") +
  xlab("RL") +
  labs(fill = "") +
  theme(legend.position = "none",
        panel.grid.major = element_blank(),
        panel.grid.minor = element_blank(),
        panel.background = element_blank(),
        axis.line = element_line(colour = "black"),
        text = element_text(size=16),
        axis.title=element_text(size=16)) +
  guides(shape = guide_legend(override.aes = list(size = 12)))
p2.2
# Warning: Removed 266 rows containing non-finite values (stat_boxplot).

# Warning: Removed 266 rows containing missing values (geom_point).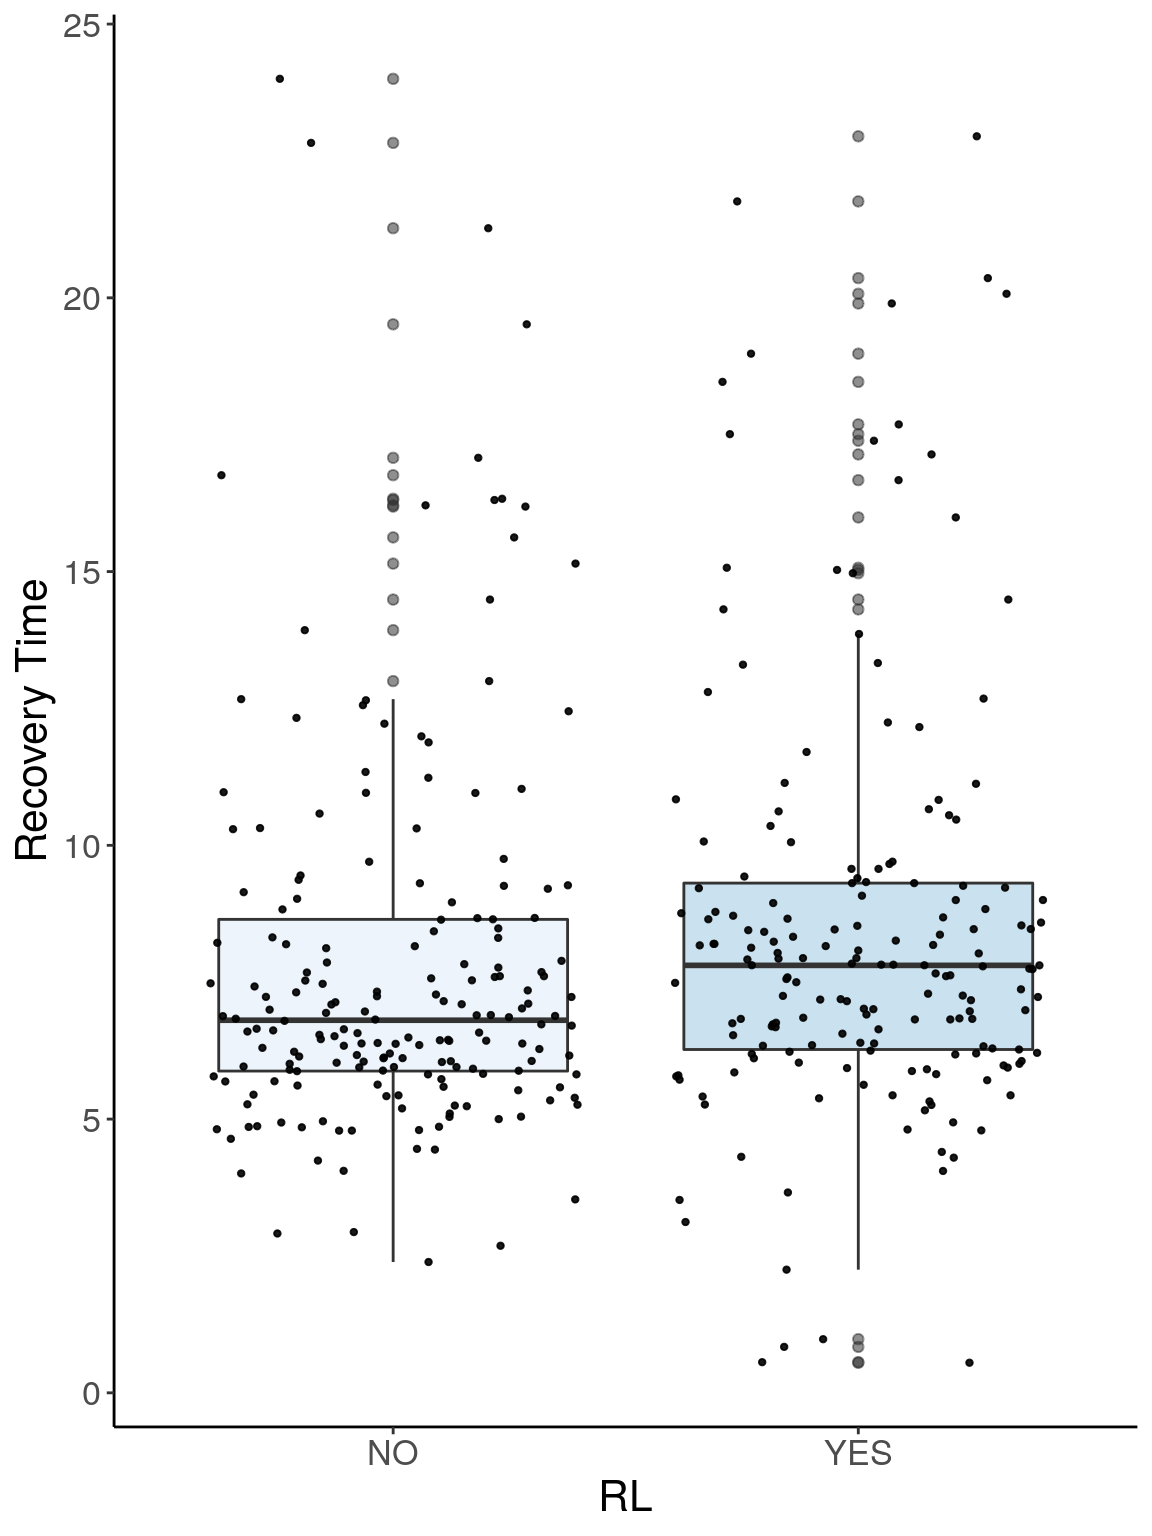
dep <- data[,c(1, 9, 11, 14, 15, 19)]
dep$ngen <- factor(dep$ngen, levels = as.character(c(29:35)))
p3 <- ggplot(dep, aes(x=ngen, y=Min.depression, group = ngen, fill = ngen, alpha = 0.9)) +
  geom_boxplot(show.legend = F , outlier.size = 1.5, notchwidth = 0.85) +
  geom_jitter(color="black", size=0.8, alpha=0.9) +
  scale_fill_brewer(palette="Blues") +
  ylab("Min depression") +
  xlab("Generation") +
  labs(fill = "") +
  theme(legend.position = "none",
        panel.grid.major = element_blank(),
        panel.grid.minor = element_blank(),
        panel.background = element_blank(),
        axis.line = element_line(colour = "black"),
        text = element_text(size=16),
        axis.title=element_text(size=16)) +
  guides(shape = guide_legend(override.aes = list(size = 12)))
p3
# Warning: Removed 41 rows containing non-finite values (stat_boxplot).
# Warning: Removed 41 rows containing missing values (geom_point).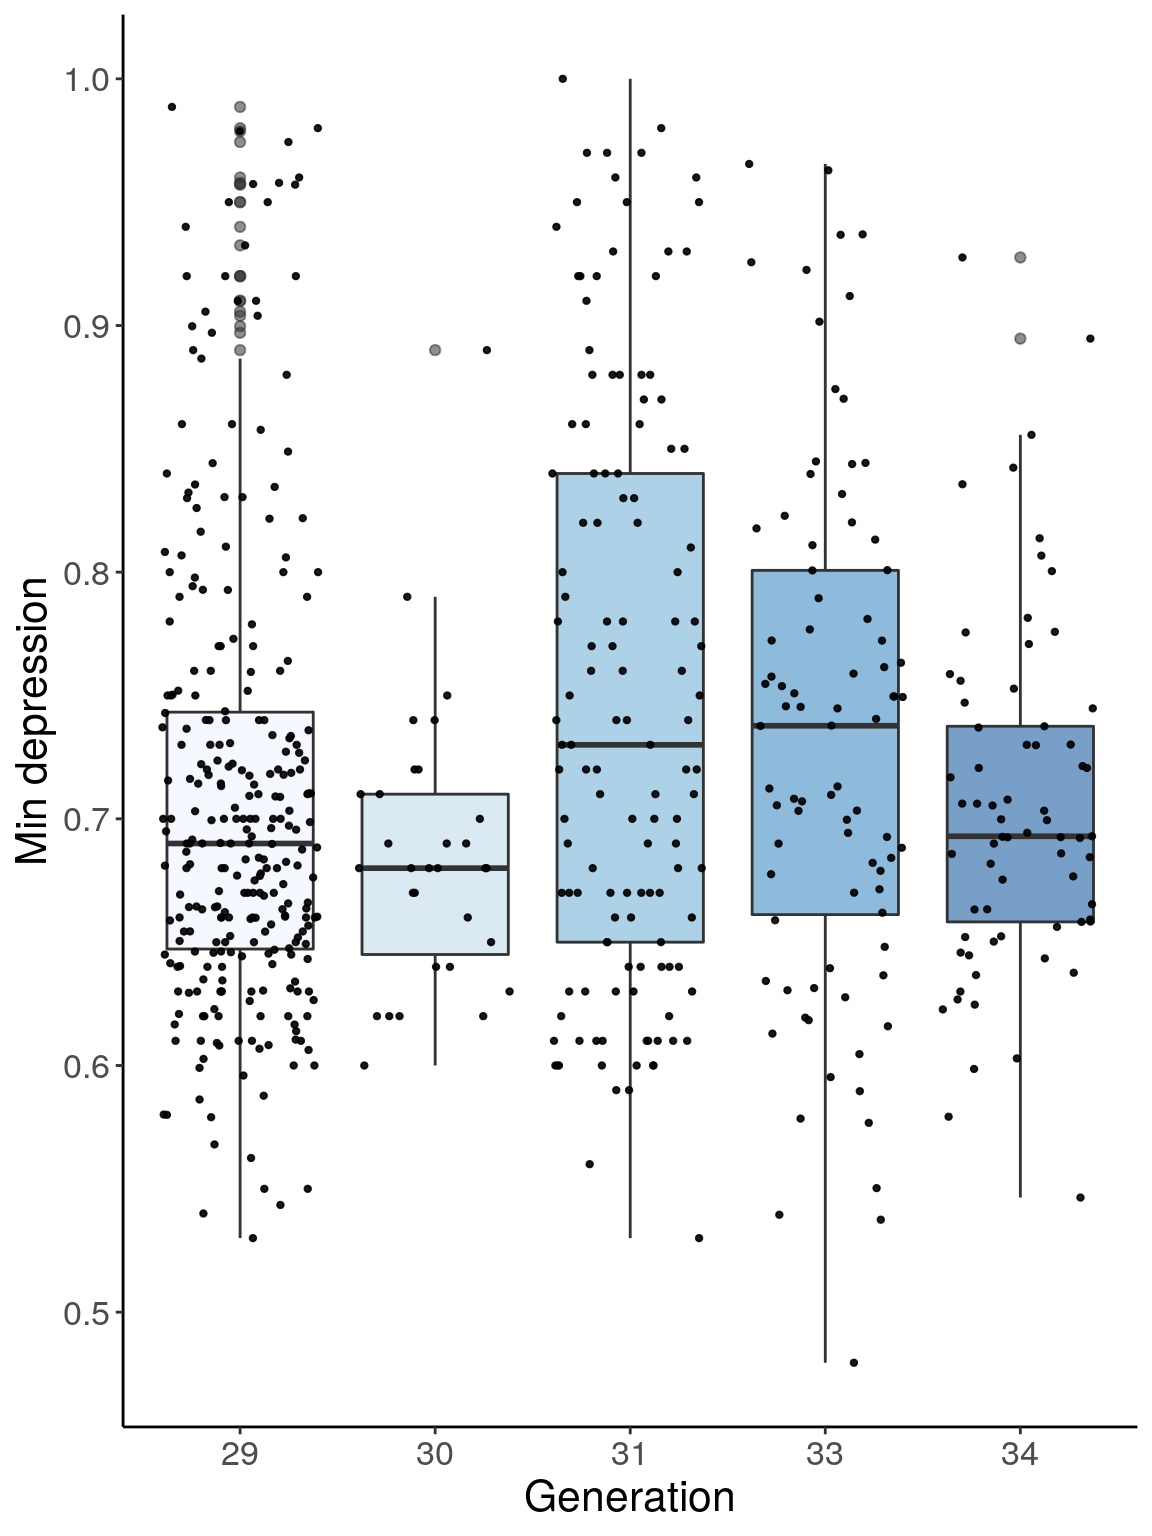
p3.1 <- ggplot(dep, aes(x=sex, y=Min.depression, group = sex, fill = sex, alpha = 0.9)) +
  geom_boxplot(show.legend = F , outlier.size = 1.5, notchwidth = 0.85) +
  geom_jitter(color="black", size=0.8, alpha=0.9) +
  scale_fill_brewer(palette="Blues") +
  ylab("Min depression") +
  xlab("sex") +
  labs(fill = "") +
  theme(legend.position = "none",
        panel.grid.major = element_blank(),
        panel.grid.minor = element_blank(),
        panel.background = element_blank(),
        axis.line = element_line(colour = "black"),
        text = element_text(size=16),
        axis.title=element_text(size=16)) +
  guides(shape = guide_legend(override.aes = list(size = 12)))
p3.1
# Warning: Removed 41 rows containing non-finite values (stat_boxplot).

# Warning: Removed 41 rows containing missing values (geom_point).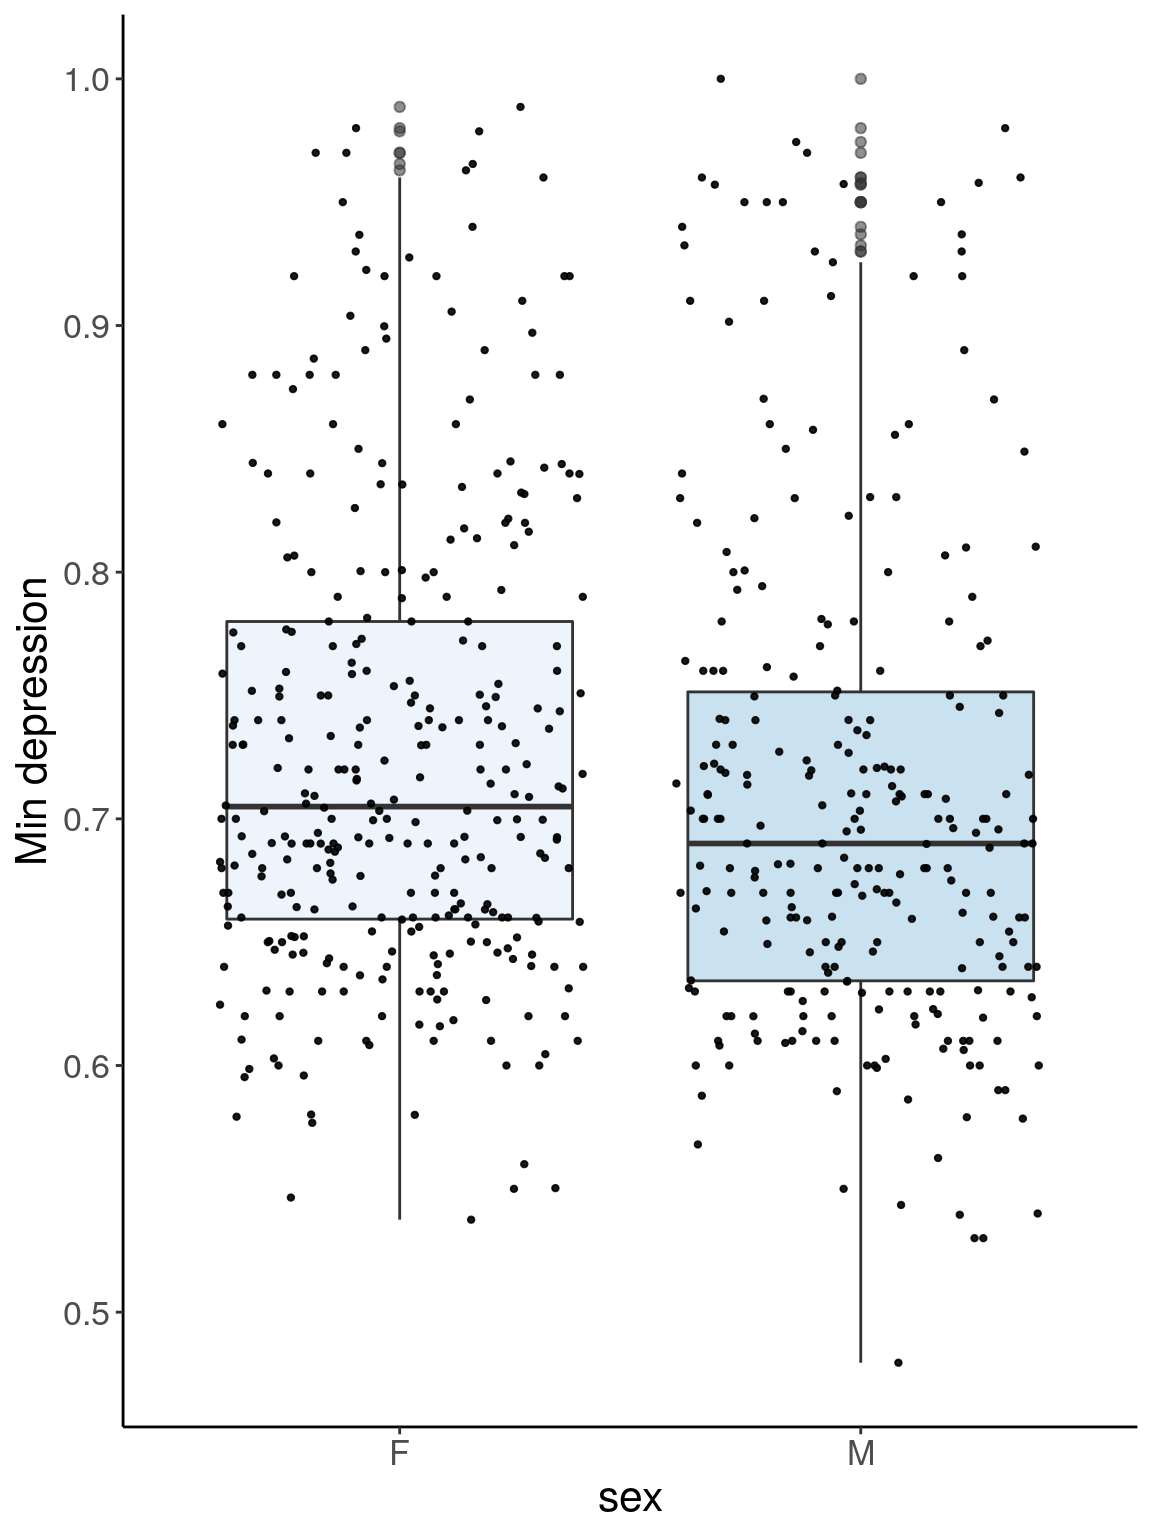
p3.2 <- ggplot(dep, aes(x=RL, y=Min.depression, group = RL, fill = RL, alpha = 0.9)) +
  geom_boxplot(show.legend = F , outlier.size = 1.5, notchwidth = 0.85) +
  geom_jitter(color="black", size=0.8, alpha=0.9) +
  scale_fill_brewer(palette="Blues") +
  ylab("Min depression") +
  xlab("RL") +
  labs(fill = "") +
  theme(legend.position = "none",
        panel.grid.major = element_blank(),
        panel.grid.minor = element_blank(),
        panel.background = element_blank(),
        axis.line = element_line(colour = "black"),
        text = element_text(size=16),
        axis.title=element_text(size=16)) +
  guides(shape = guide_legend(override.aes = list(size = 12)))
p3.2
# Warning: Removed 41 rows containing non-finite values (stat_boxplot).

# Warning: Removed 41 rows containing missing values (geom_point).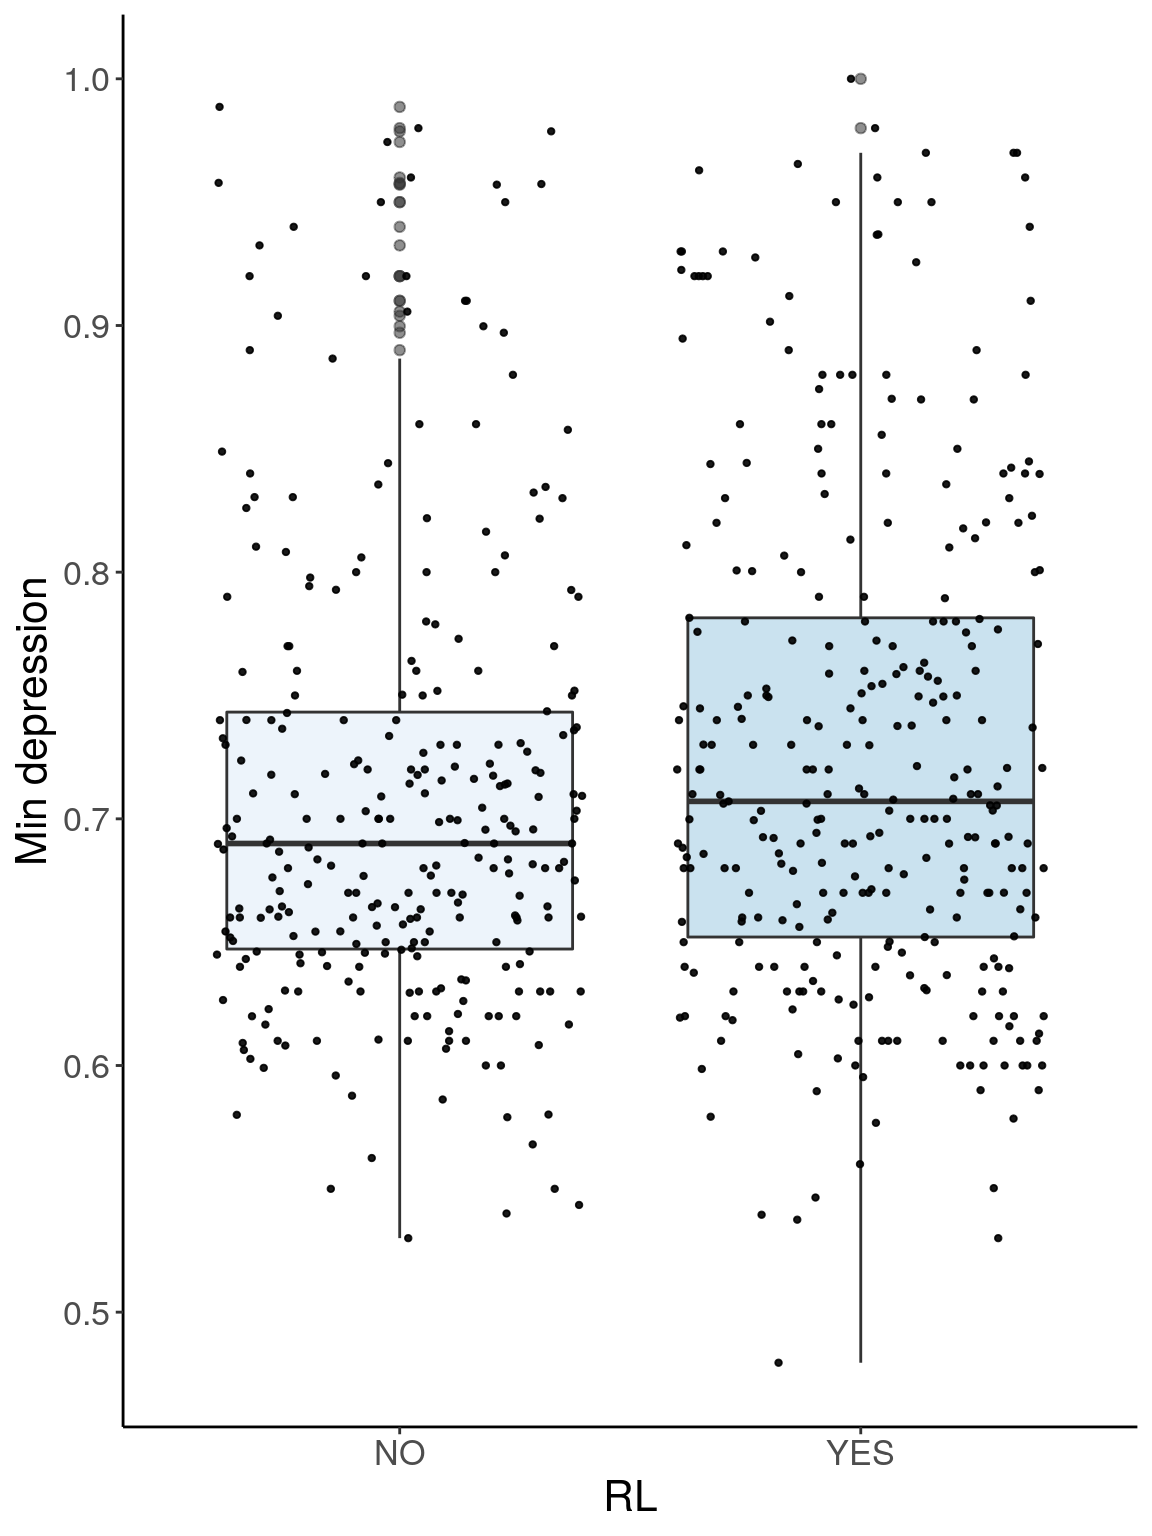
Plot qtl mapping on 69k
Plot by using its output qtl.morphine.69k.out.combined.RData
load("output/qtl.morphine.69k.out.combined.RData")
#pmap and gmap
load("data/69k_grid_pgmap.RData")
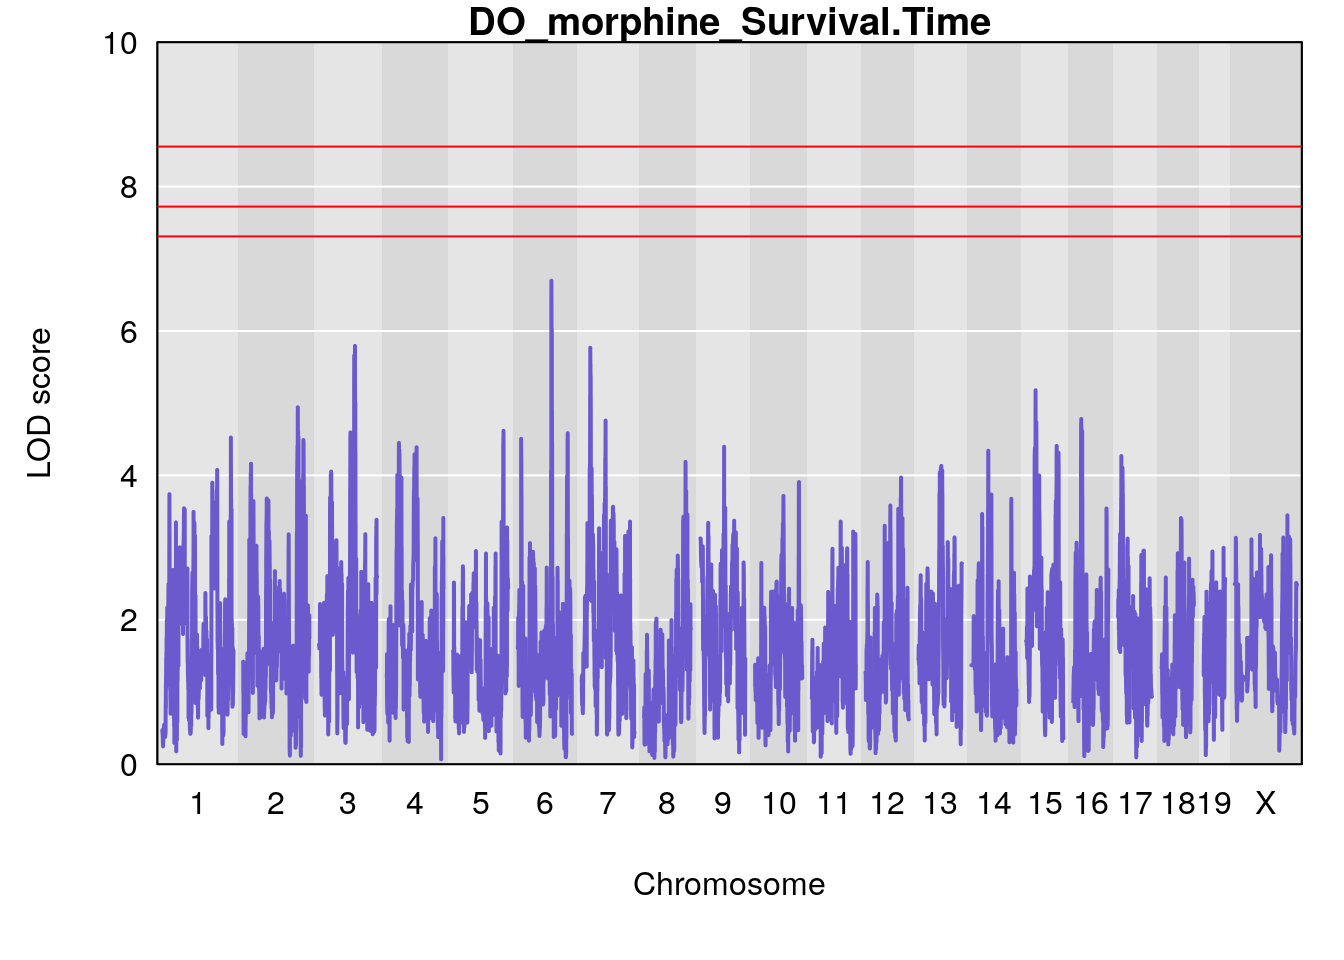
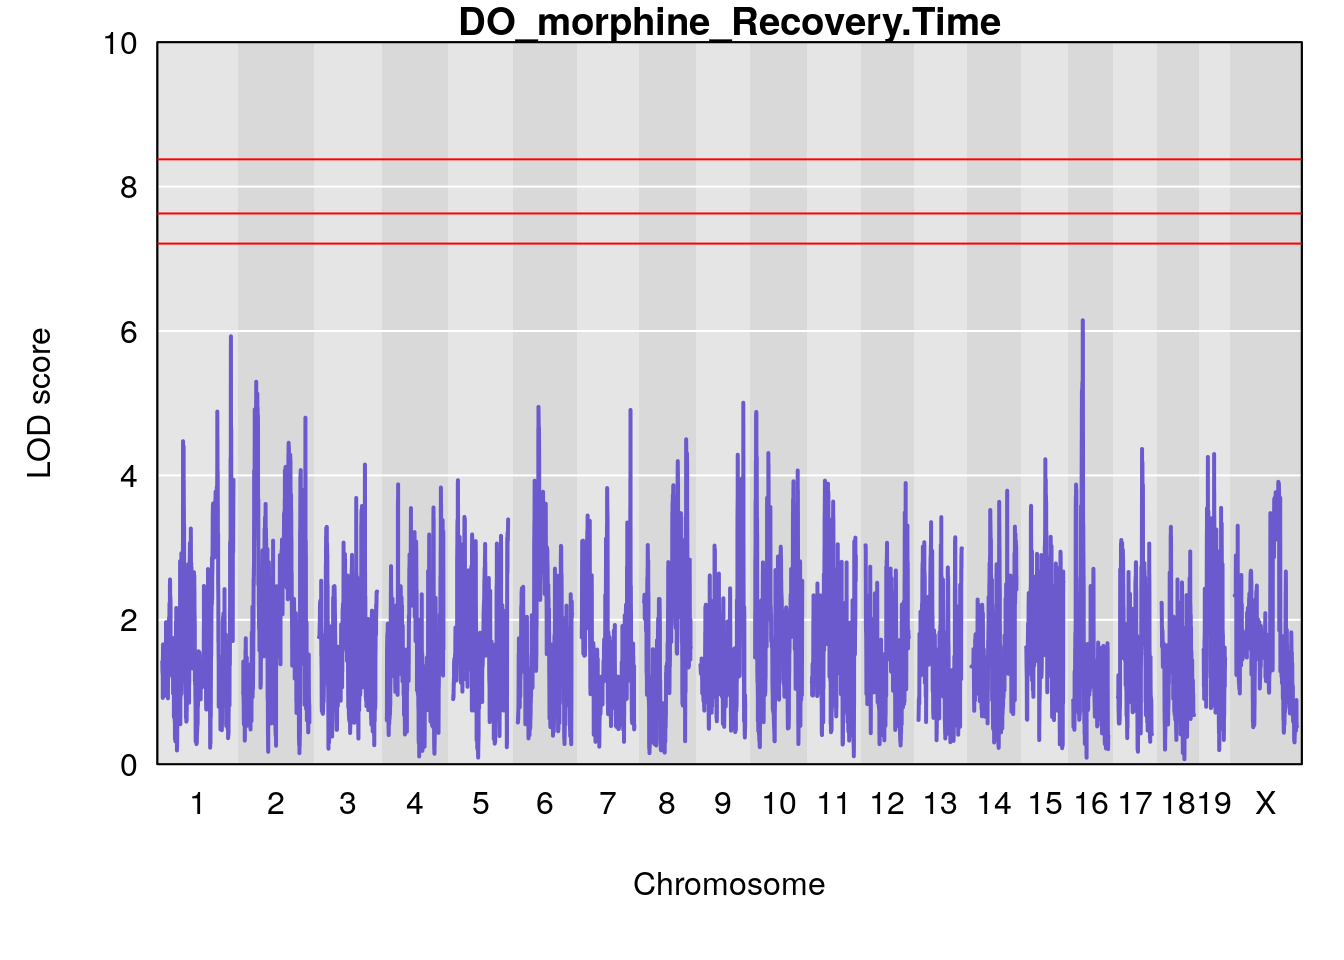
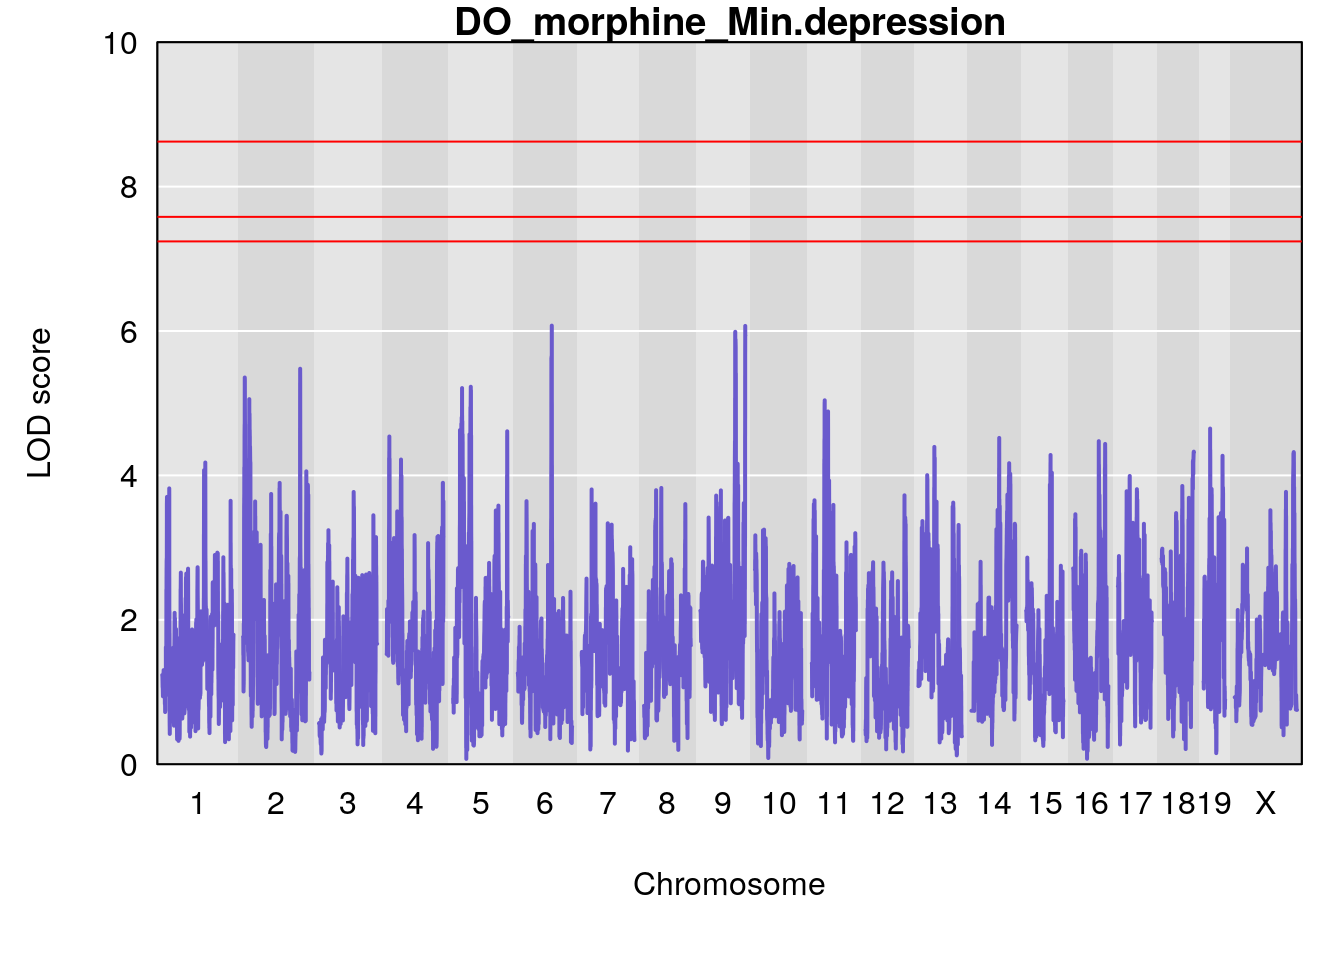
#genome-wide plot
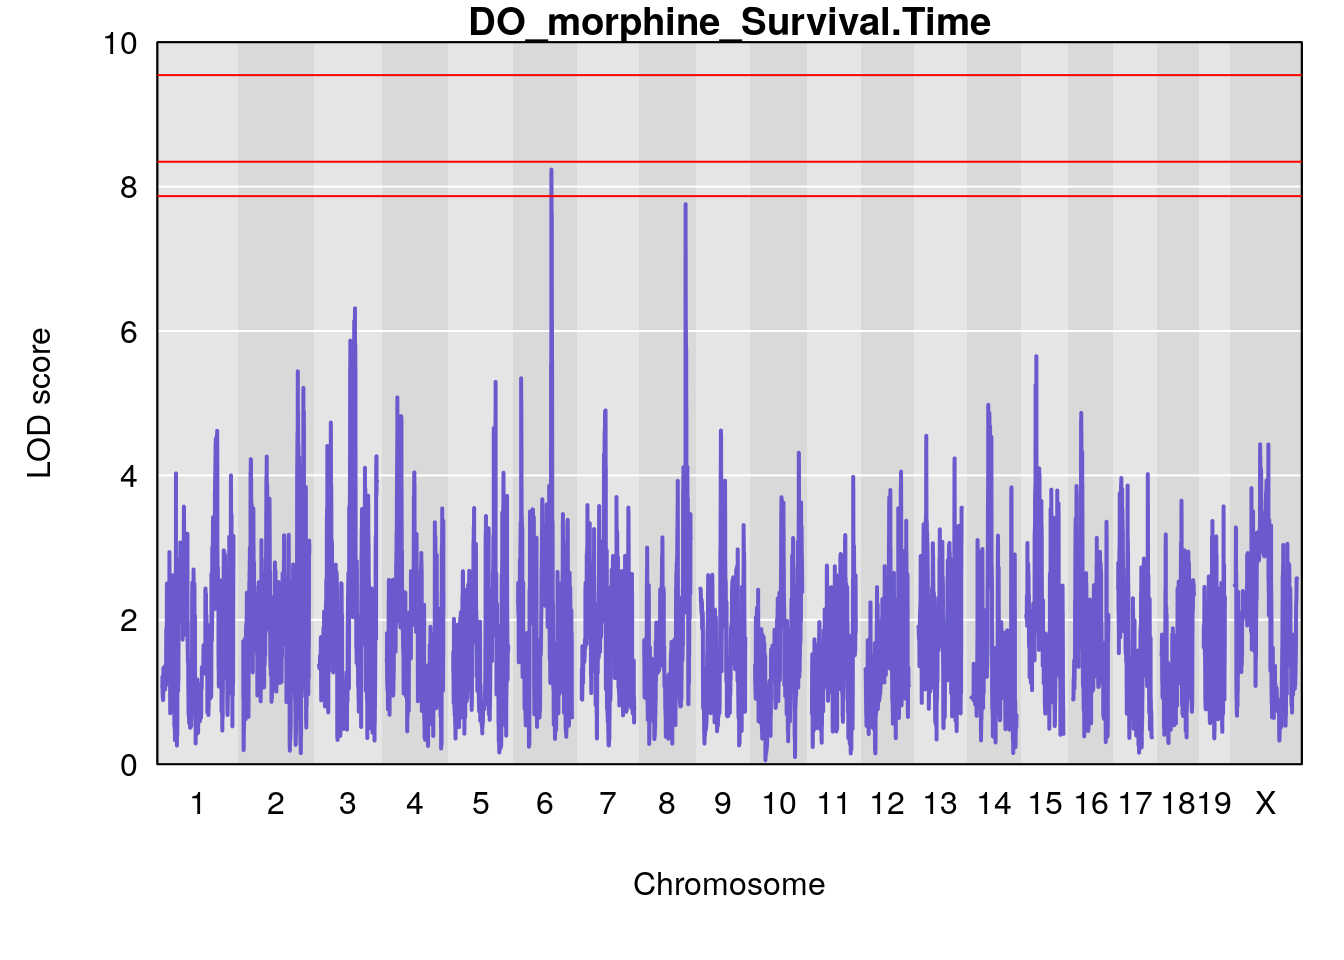
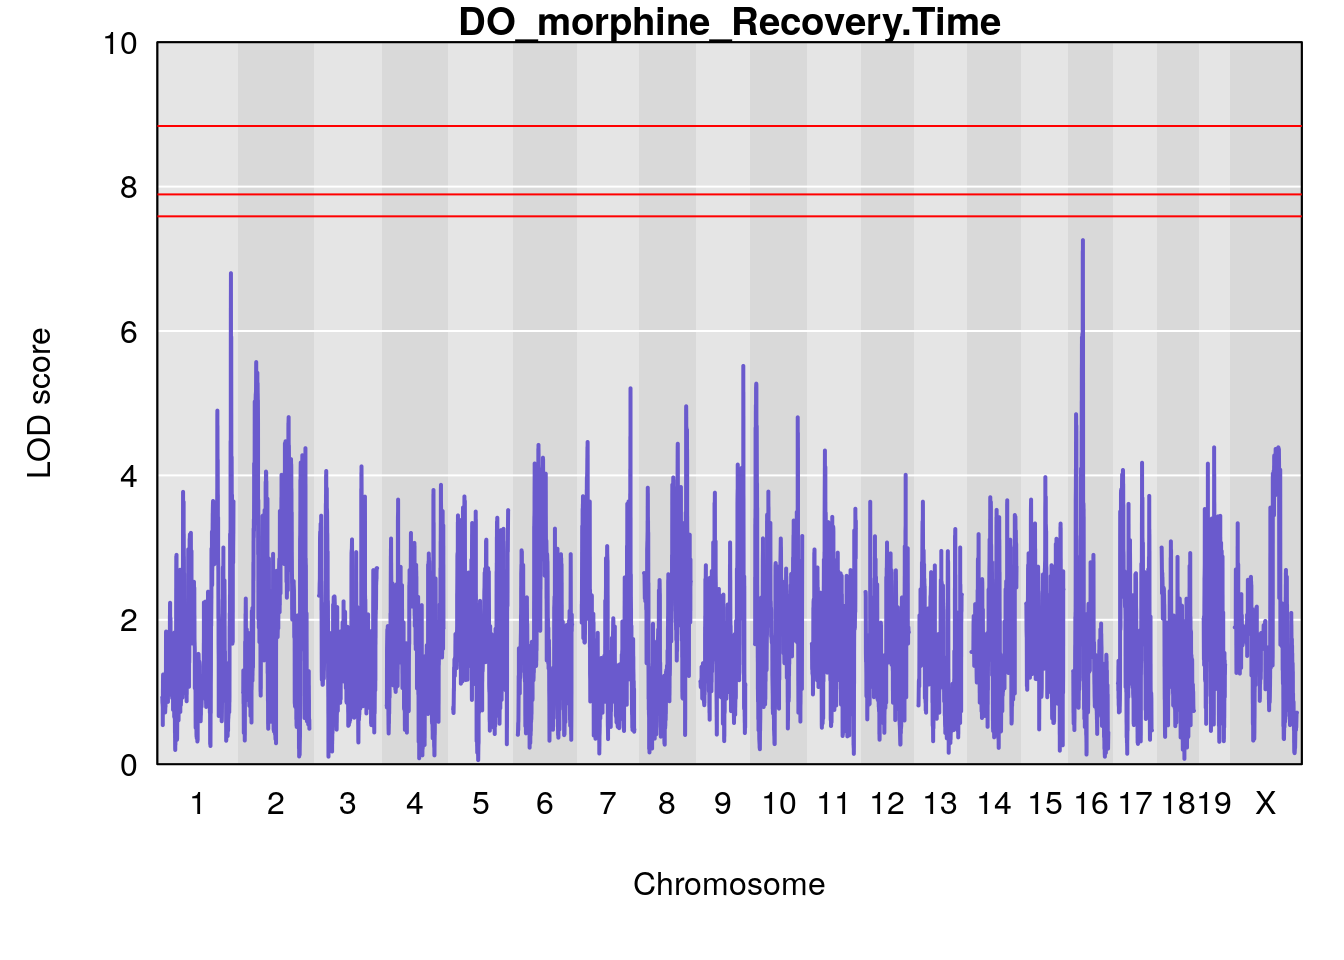
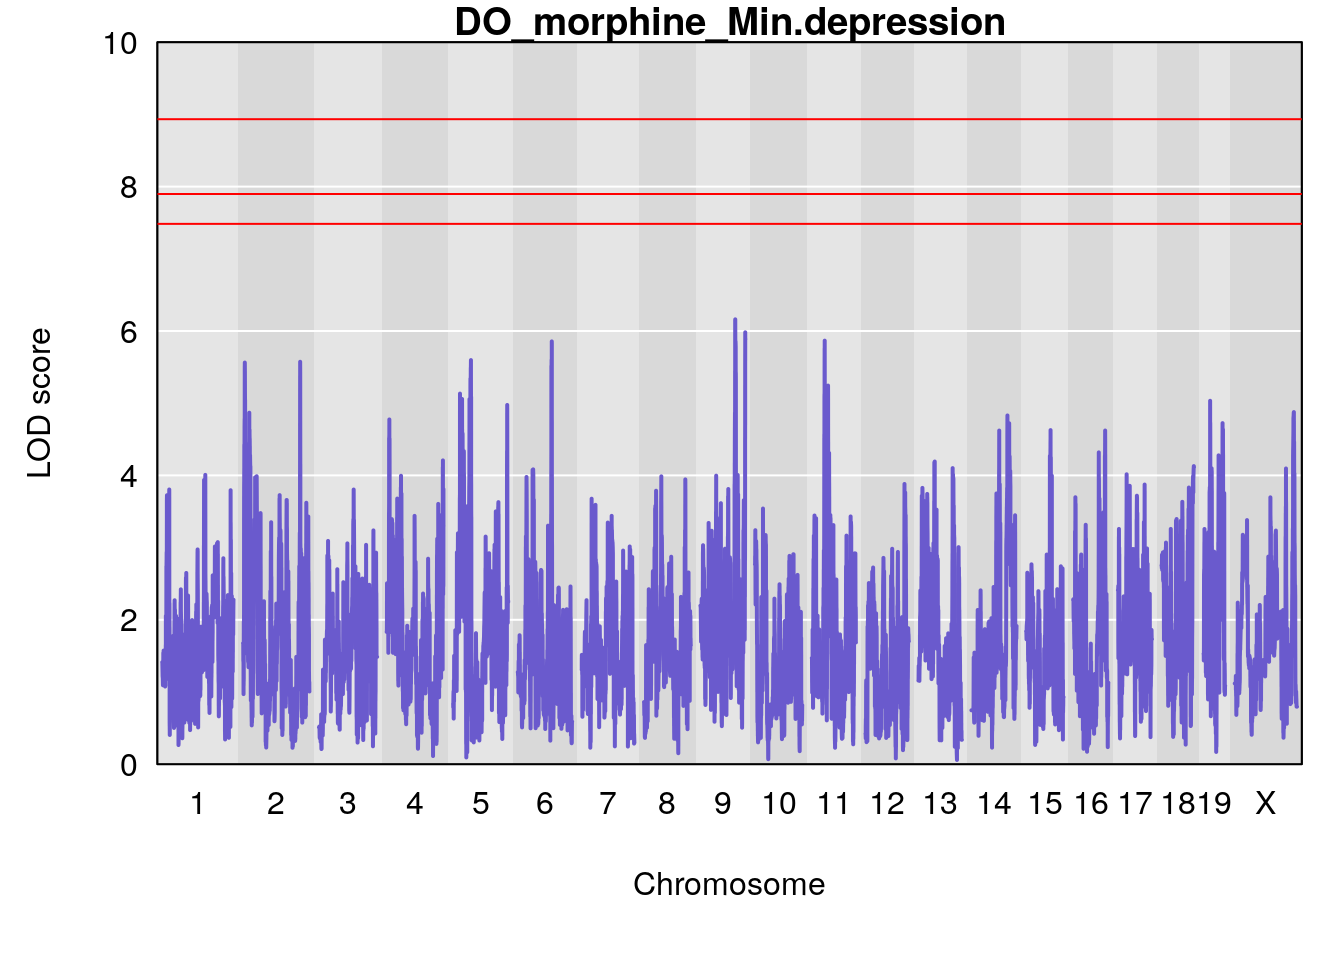
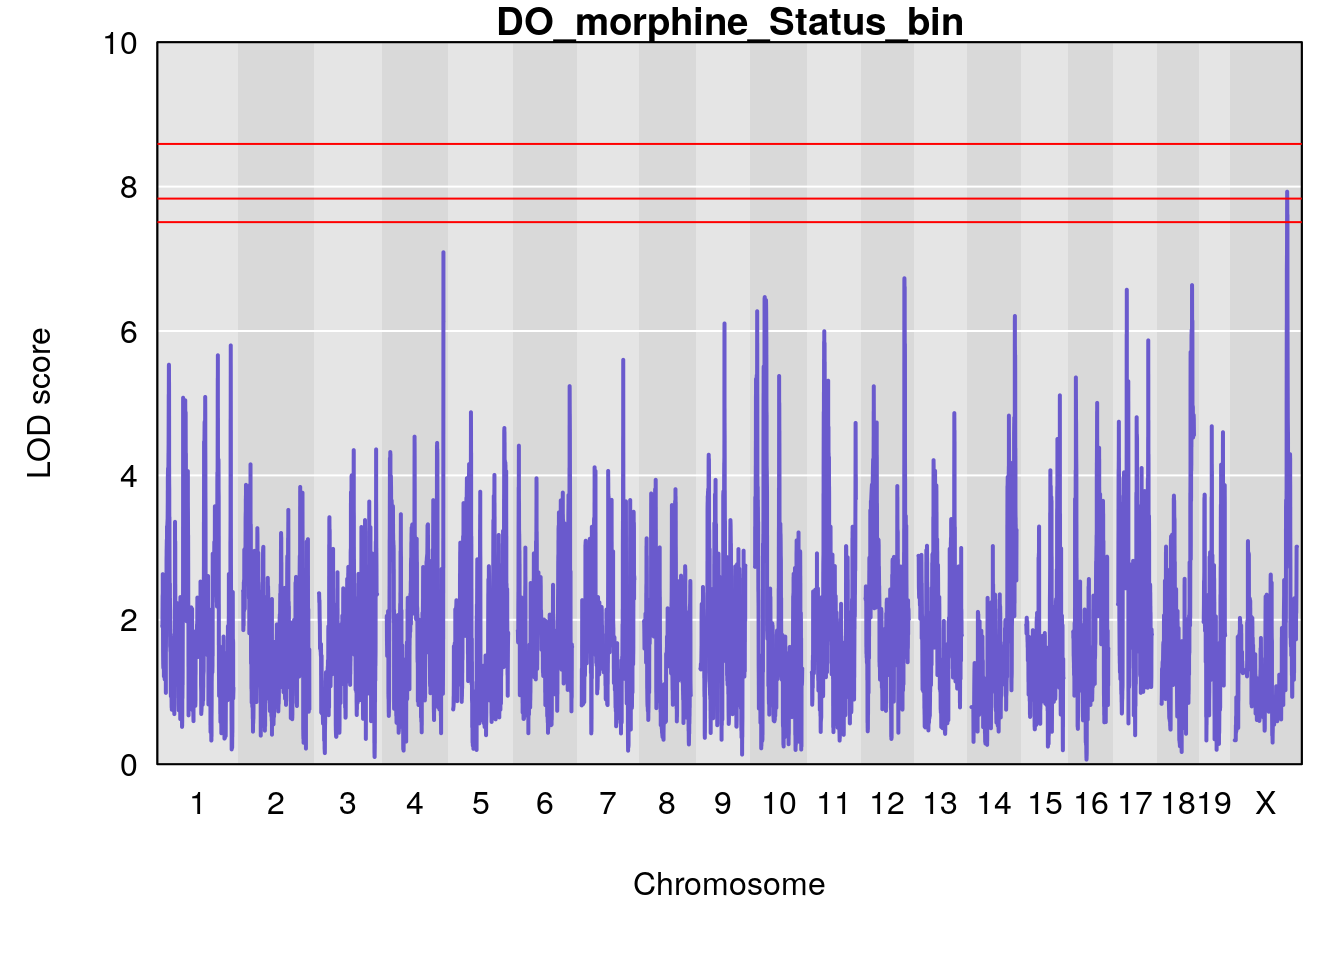
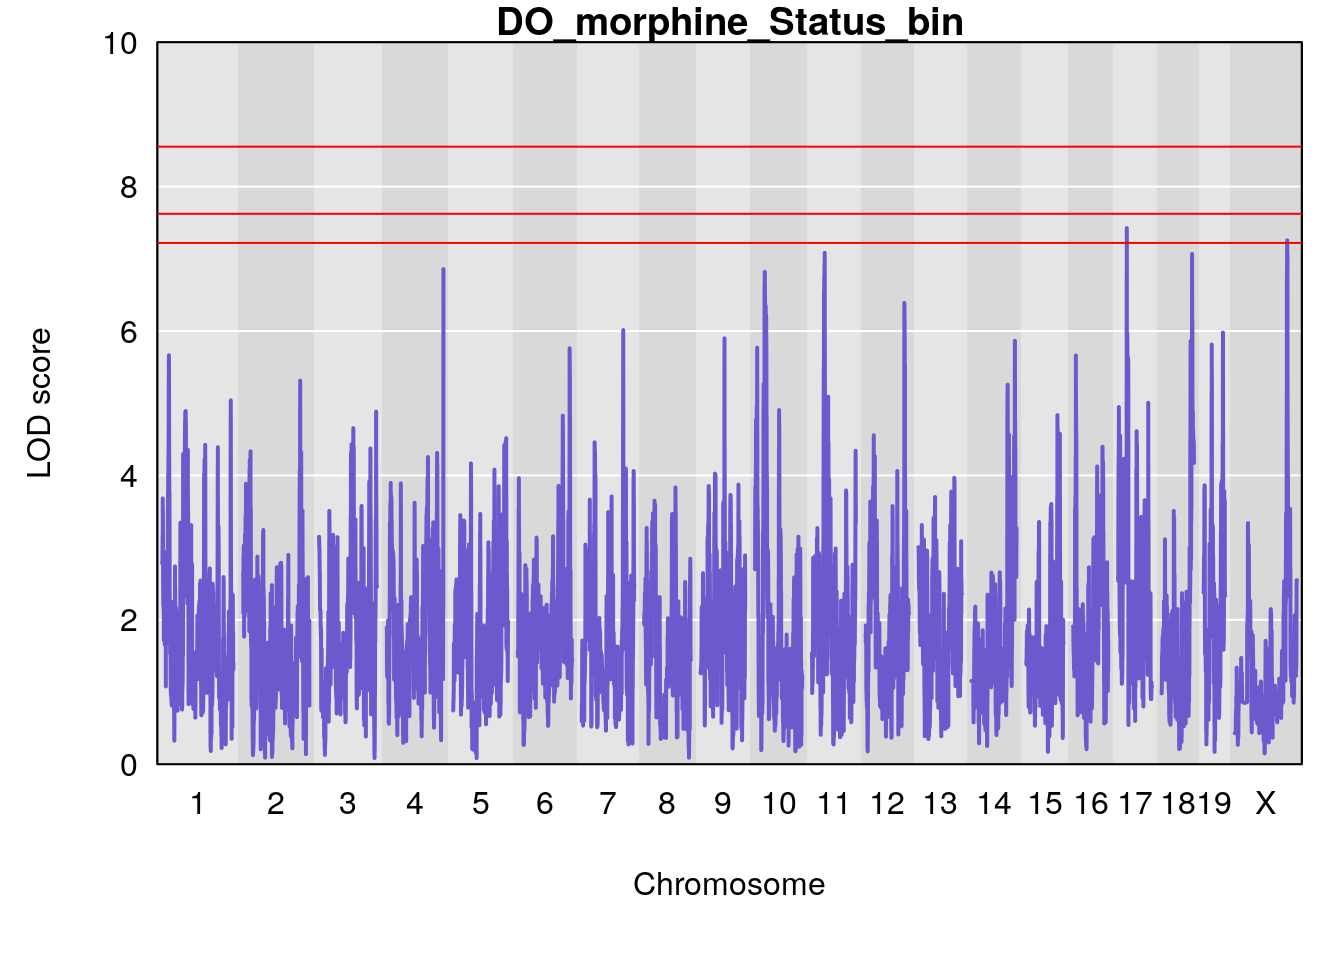
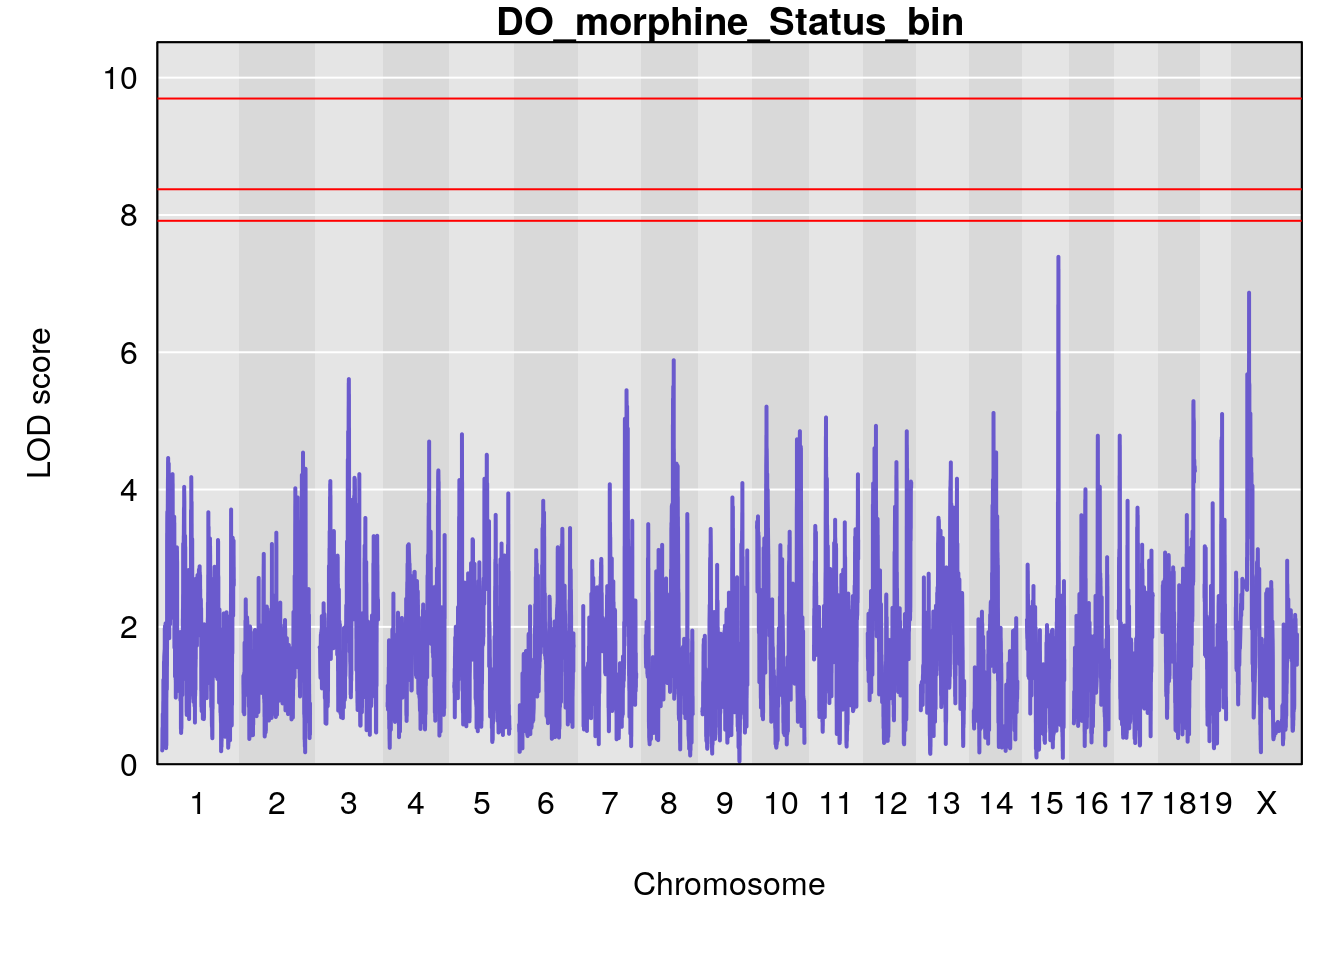
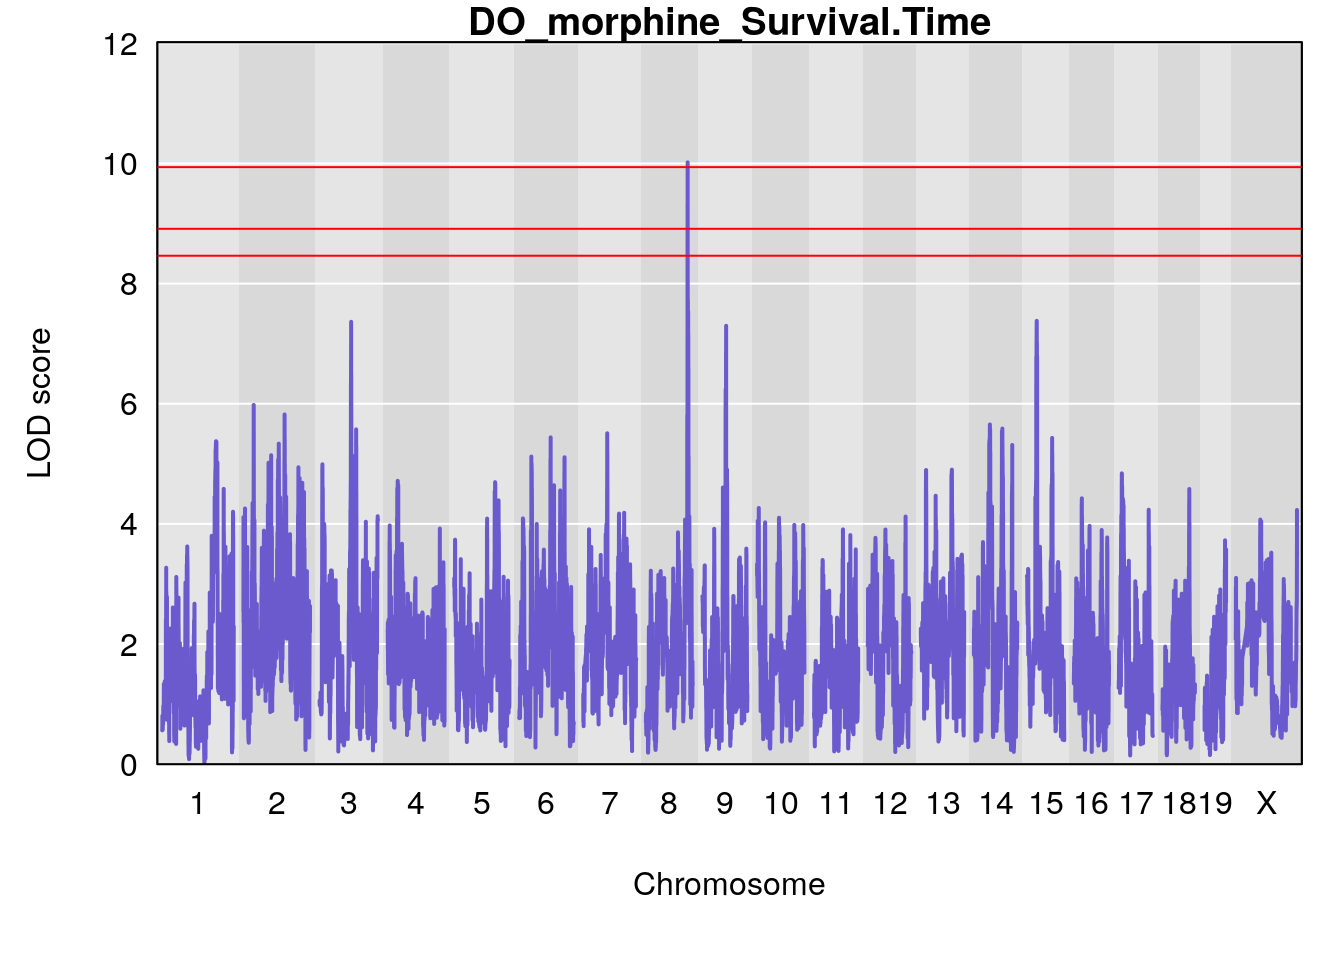
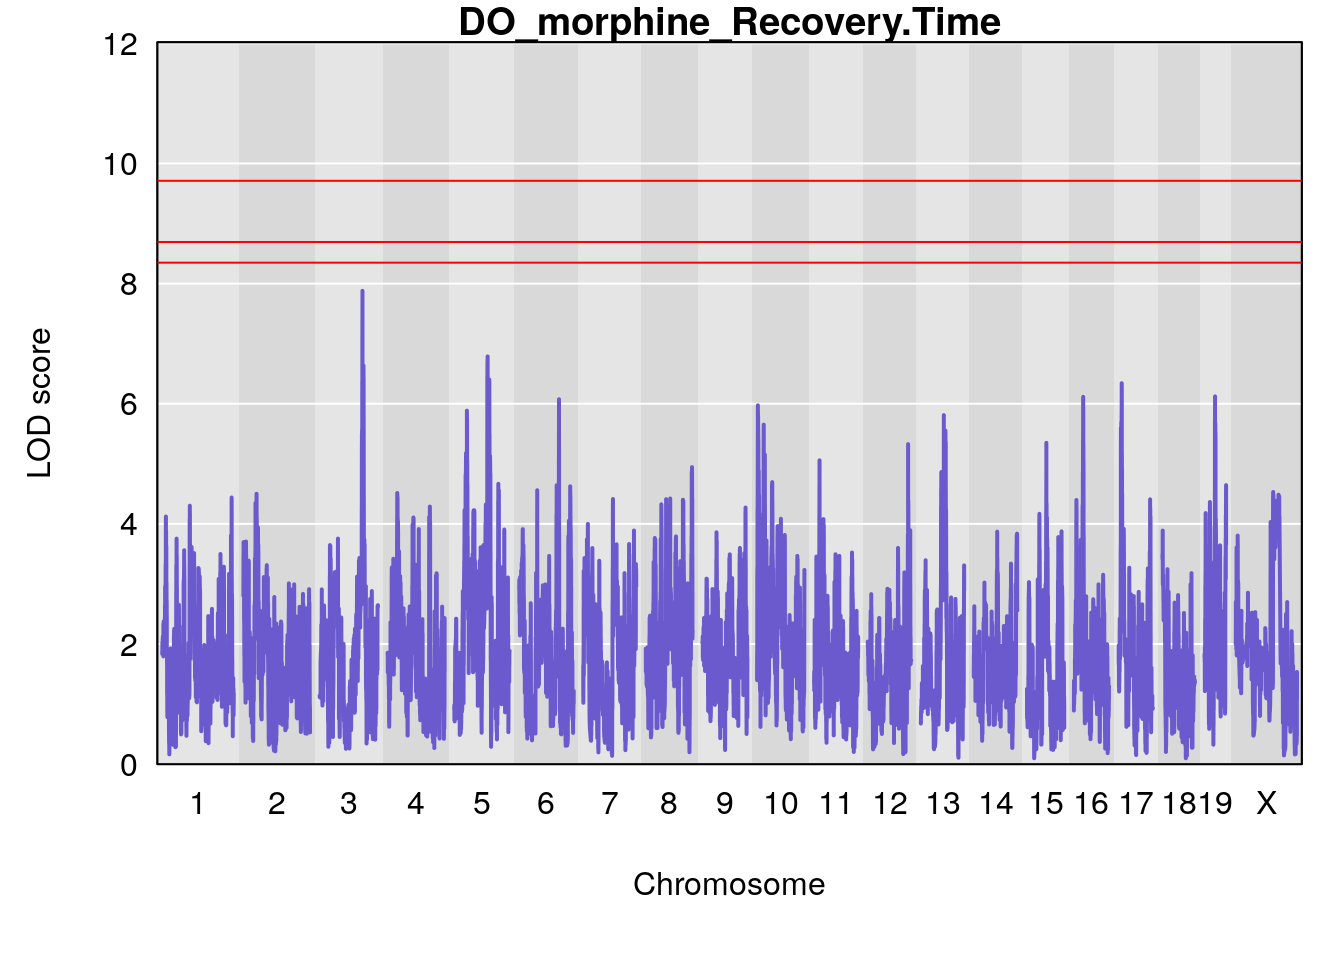
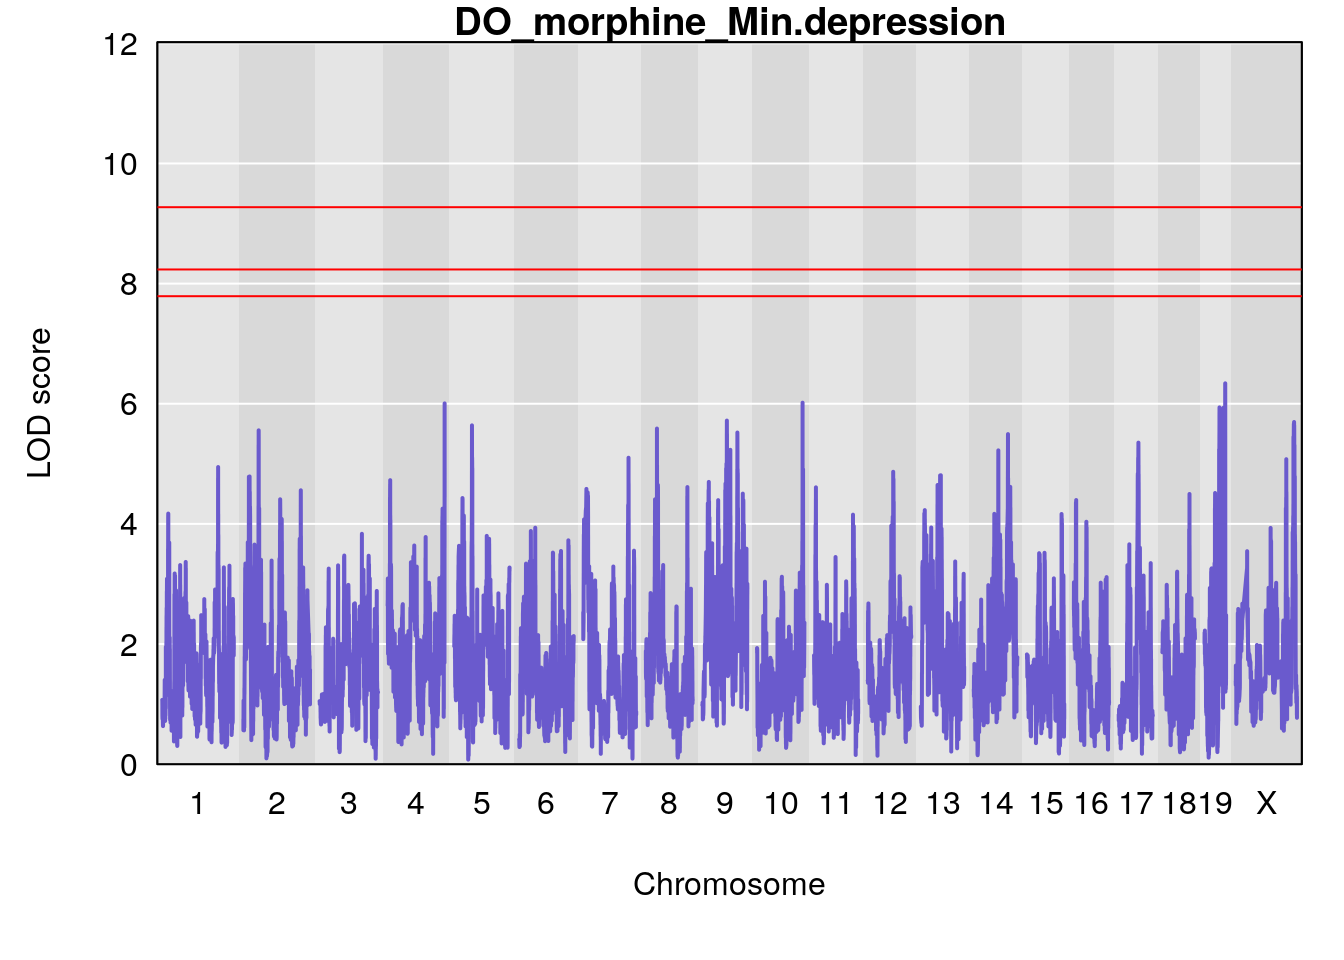
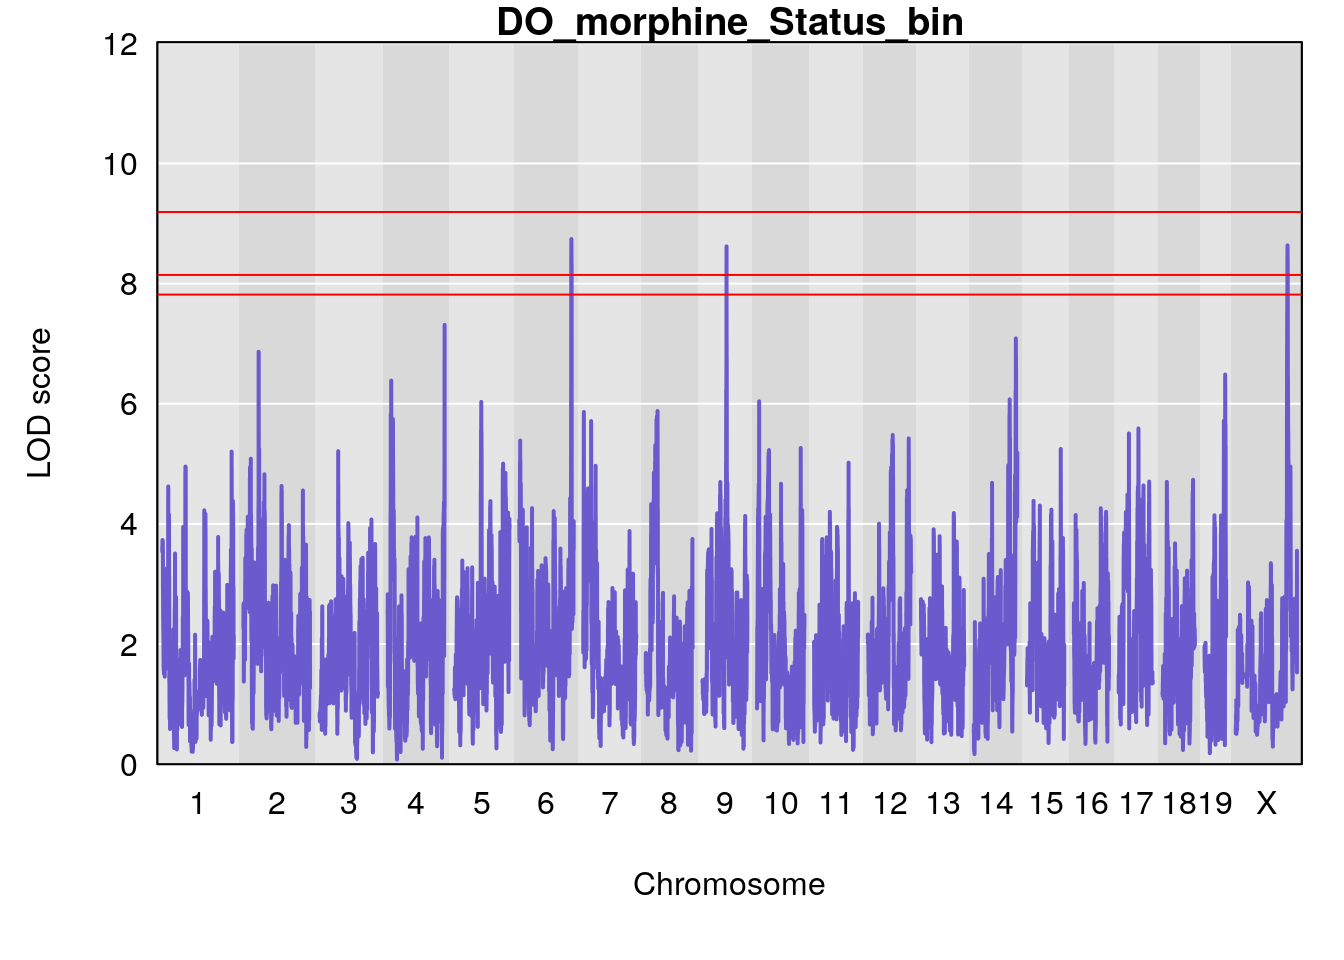
for(i in names(qtl.morphine.out)){
par(mar=c(5.1, 4.1, 1.1, 1.1))
ymx <- maxlod(qtl.morphine.out[[i]]) # overall maximum LOD score
plot(qtl.morphine.out[[i]], map=pmap, lodcolumn=1, col="slateblue", ylim=c(0, 10))
abline(h=summary(qtl.morphine.operm[[i]], alpha=c(0.10, 0.05, 0.01))[[1]], col="red")
abline(h=summary(qtl.morphine.operm[[i]], alpha=c(0.10, 0.05, 0.01))[[2]], col="red")
abline(h=summary(qtl.morphine.operm[[i]], alpha=c(0.10, 0.05, 0.01))[[3]], col="red")
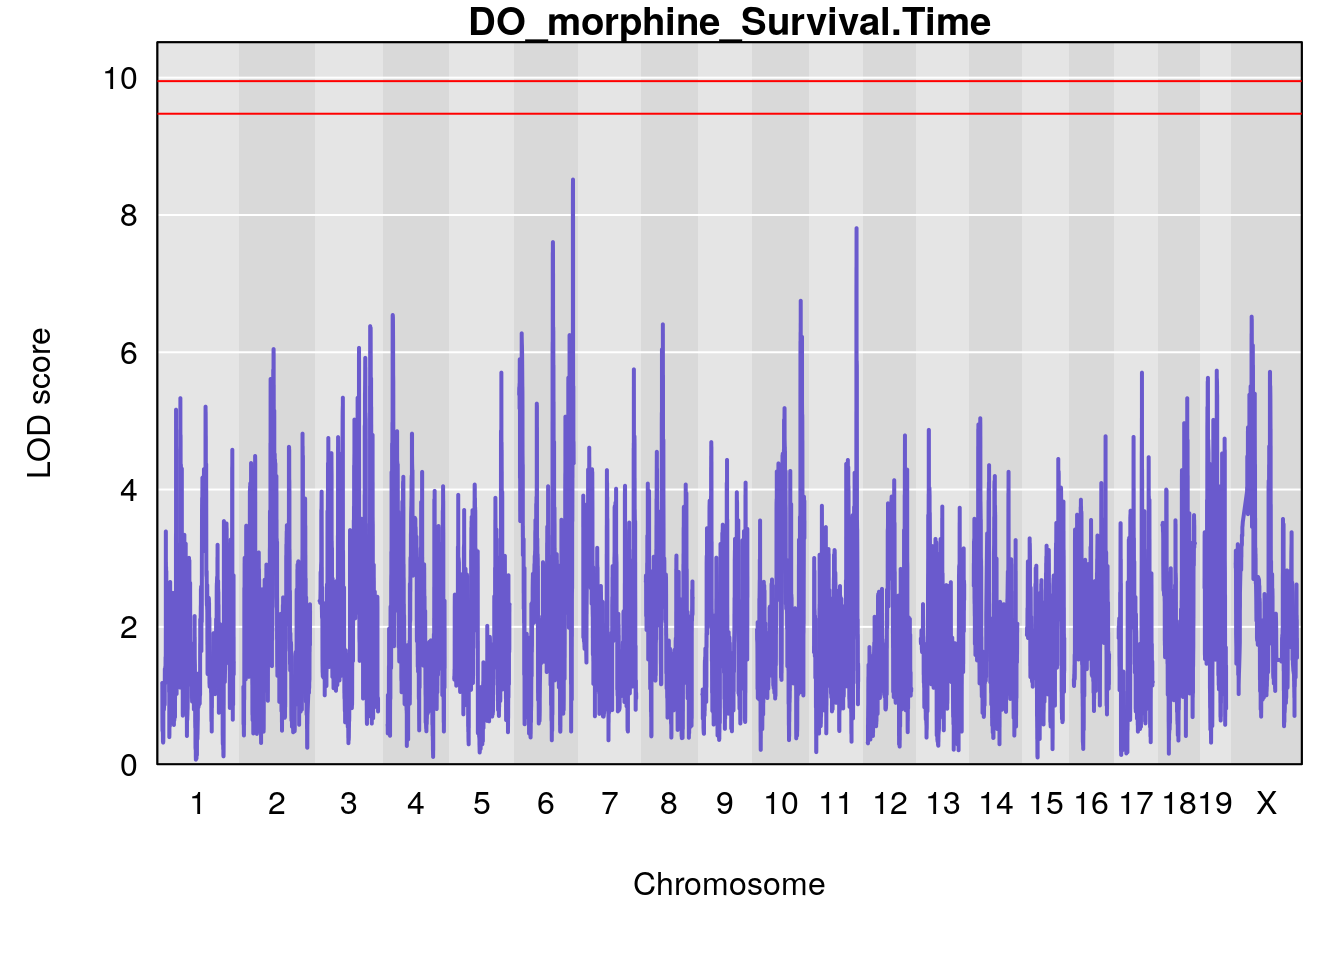
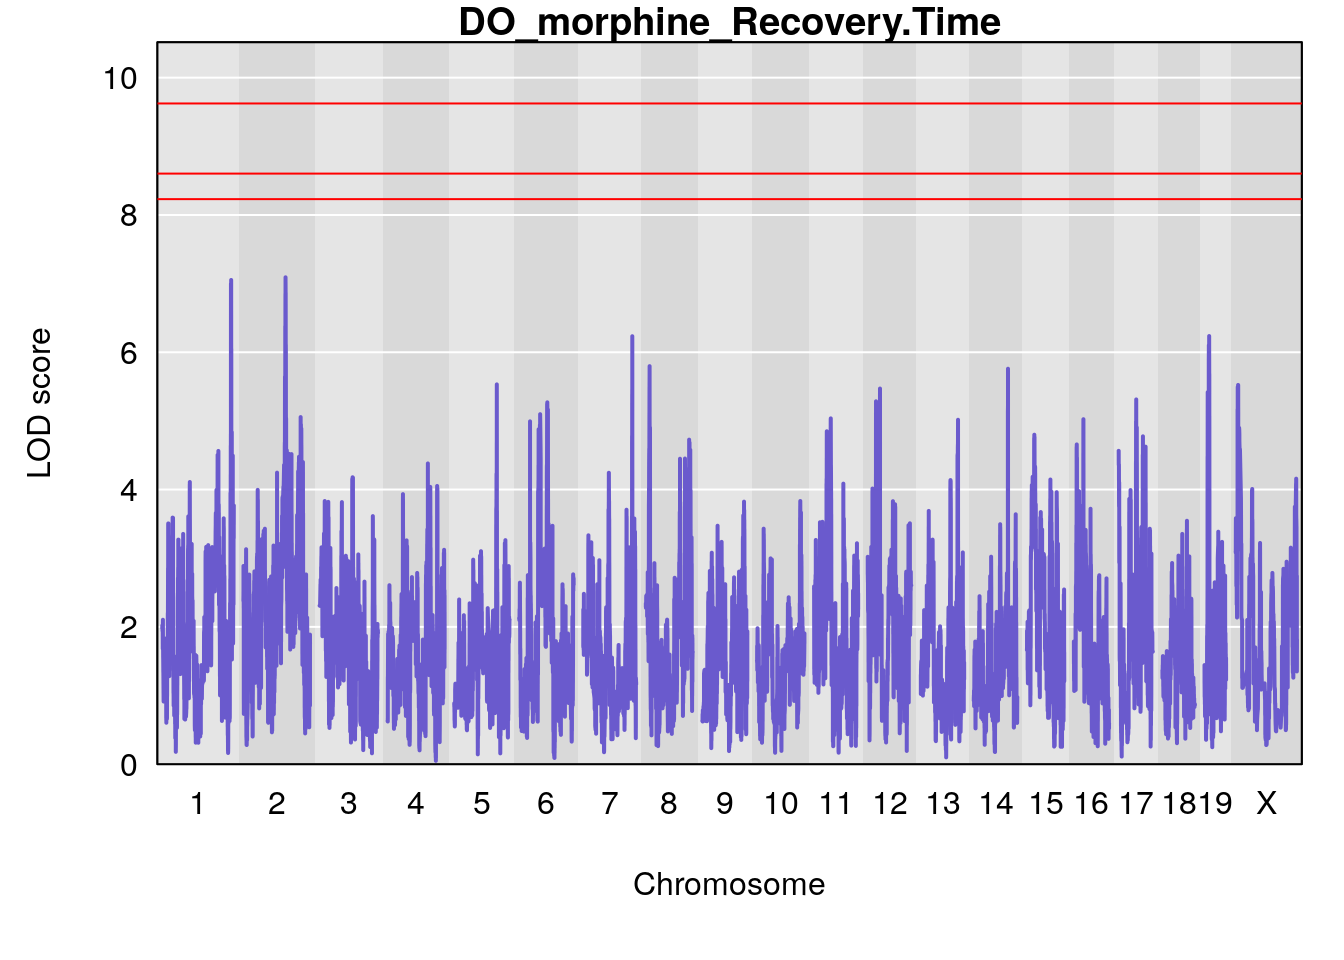
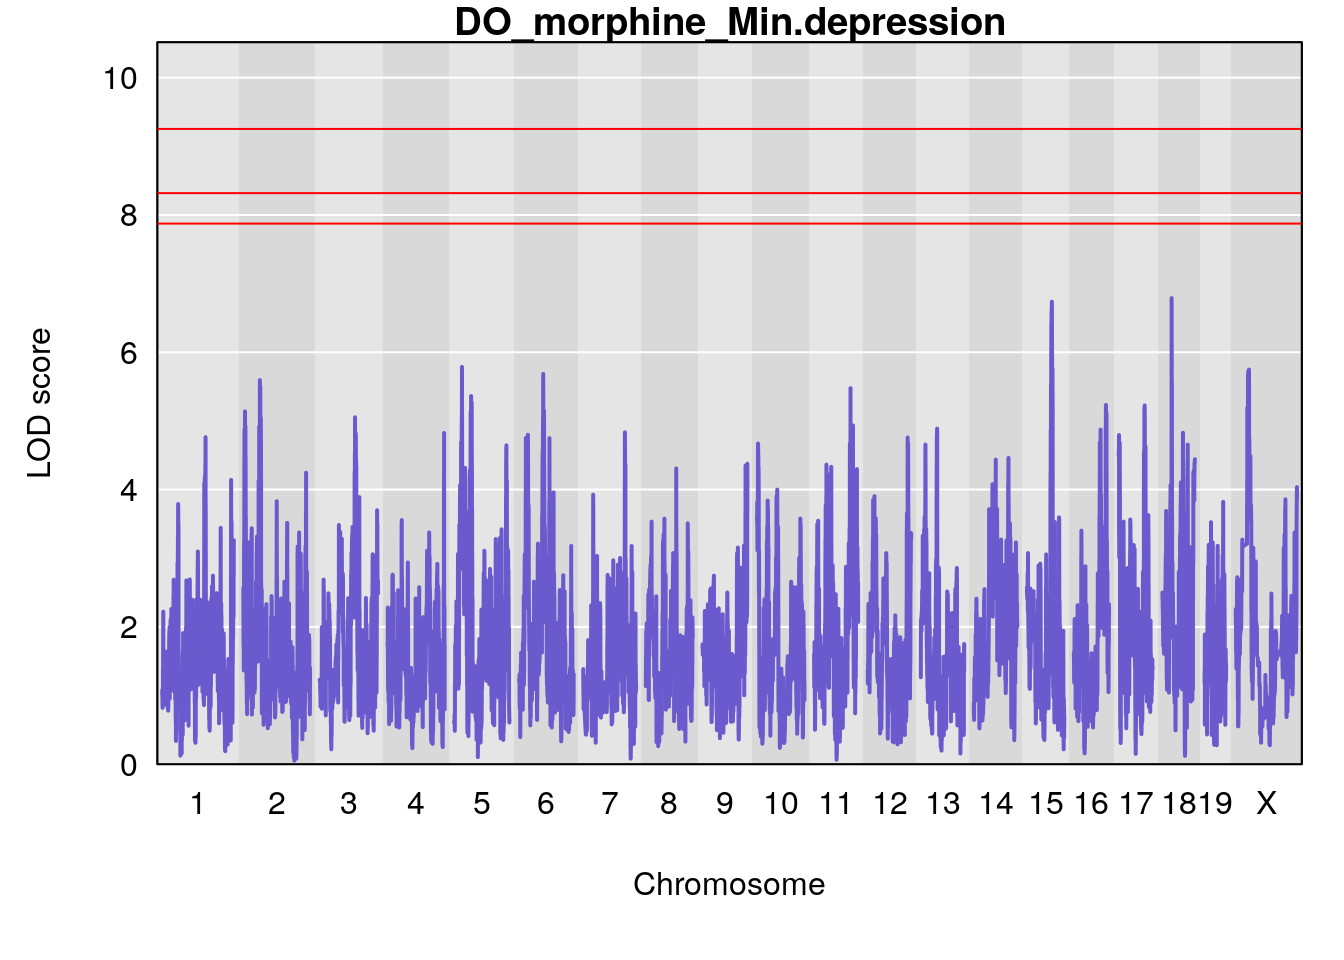
title(main = paste0("DO_morphine_",i))
}
#save genome-wide plot
for(i in names(qtl.morphine.out)){
png(file = paste0("output/DO_morphine_secondbatch_", i, ".png"), width = 16, height =8, res=300, units = "in")
par(mar=c(5.1, 4.1, 1.1, 1.1))
ymx <- maxlod(qtl.morphine.out[[i]]) # overall maximum LOD score
plot(qtl.morphine.out[[i]], map=pmap, lodcolumn=1, col="slateblue", ylim=c(0, 10))
abline(h=summary(qtl.morphine.operm[[i]], alpha=c(0.10, 0.05, 0.01))[[1]], col="red")
abline(h=summary(qtl.morphine.operm[[i]], alpha=c(0.10, 0.05, 0.01))[[2]], col="red")
abline(h=summary(qtl.morphine.operm[[i]], alpha=c(0.10, 0.05, 0.01))[[3]], col="red")
title(main = paste0("DO_morphine_",i))
dev.off()
}
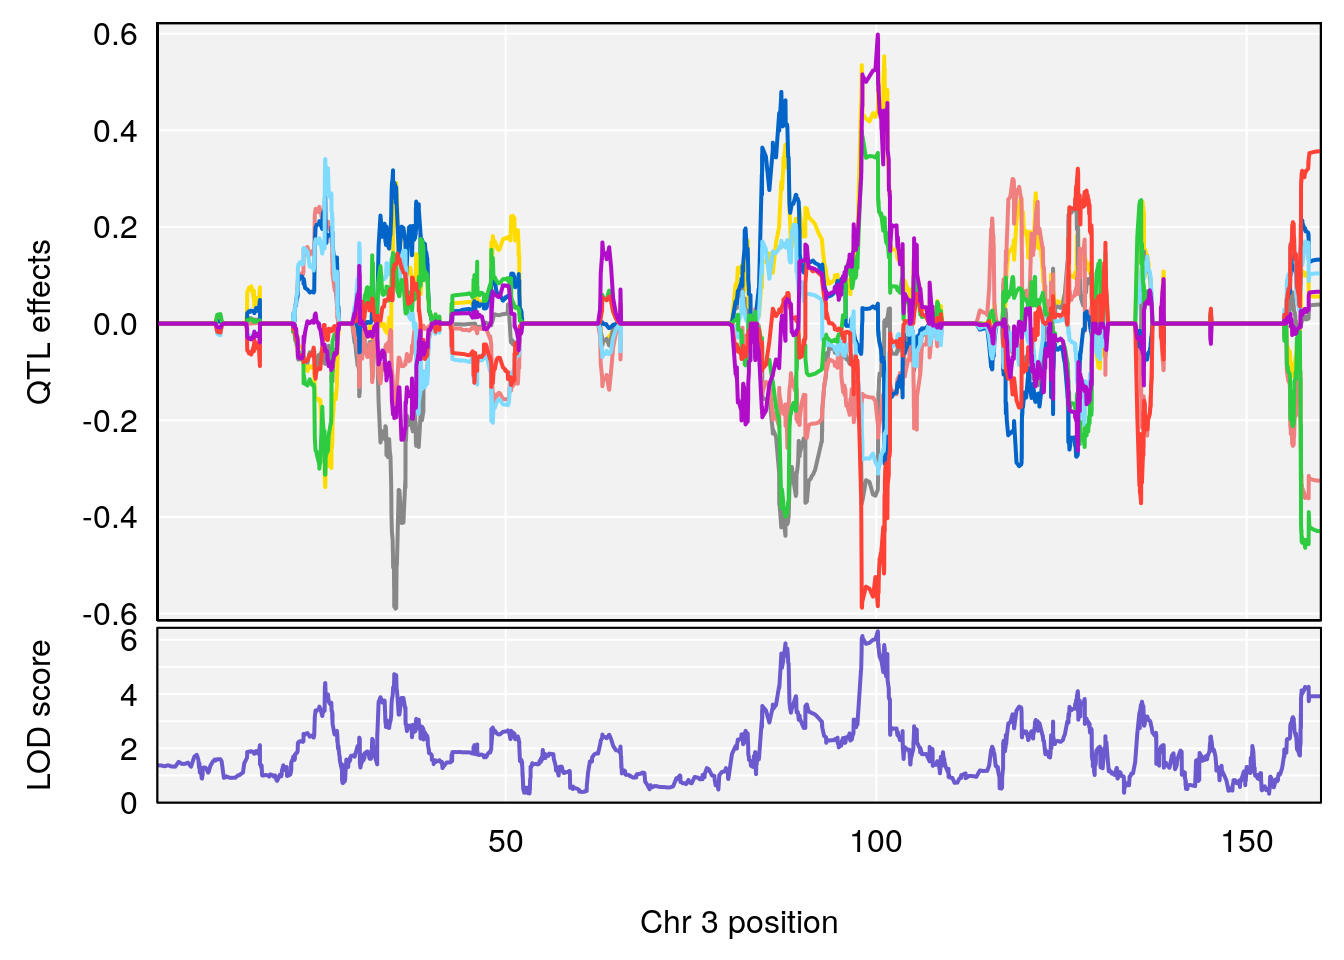
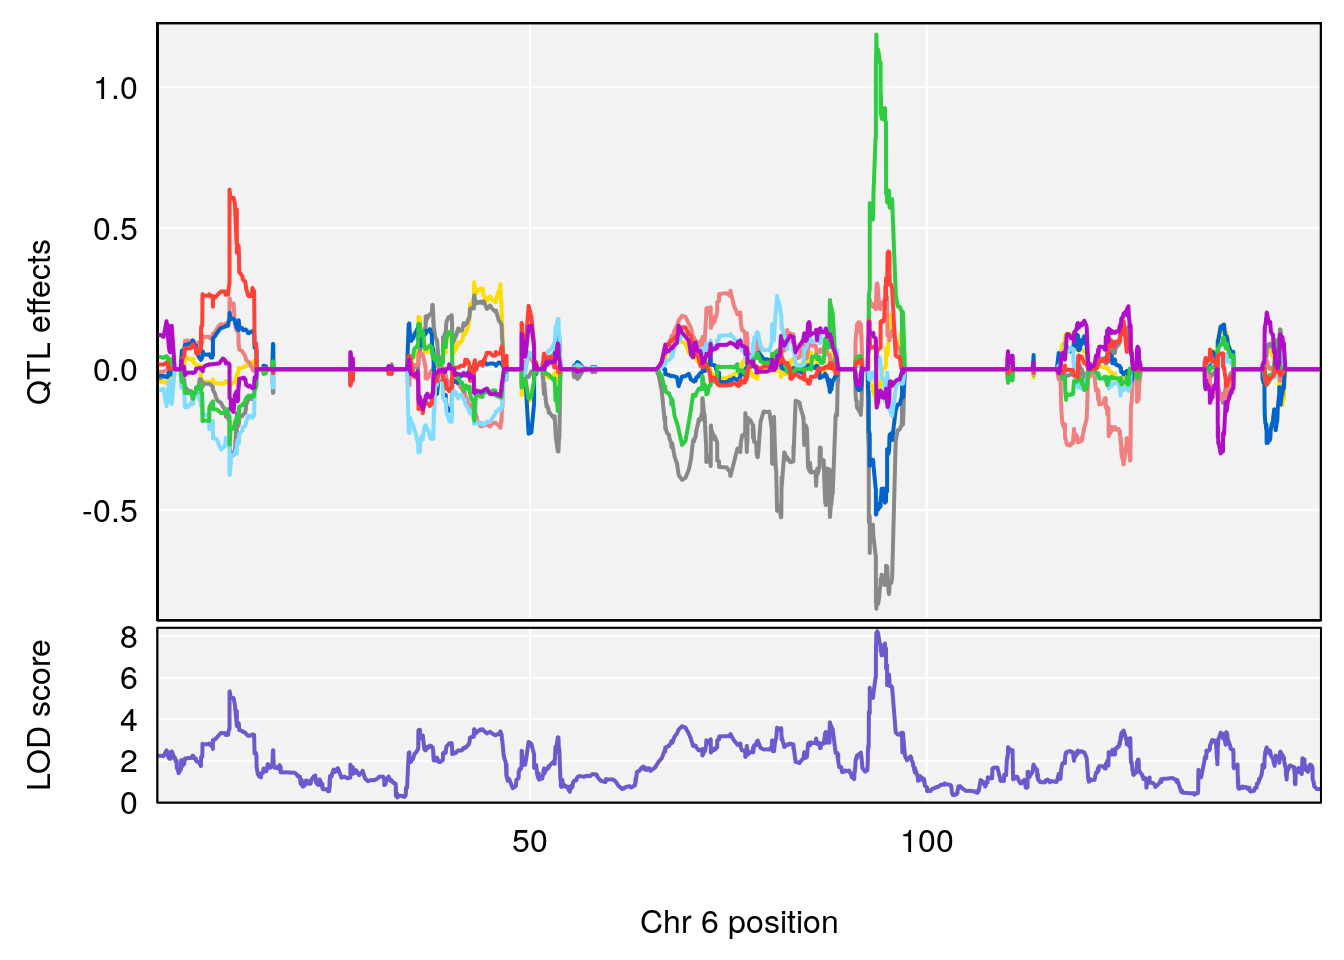
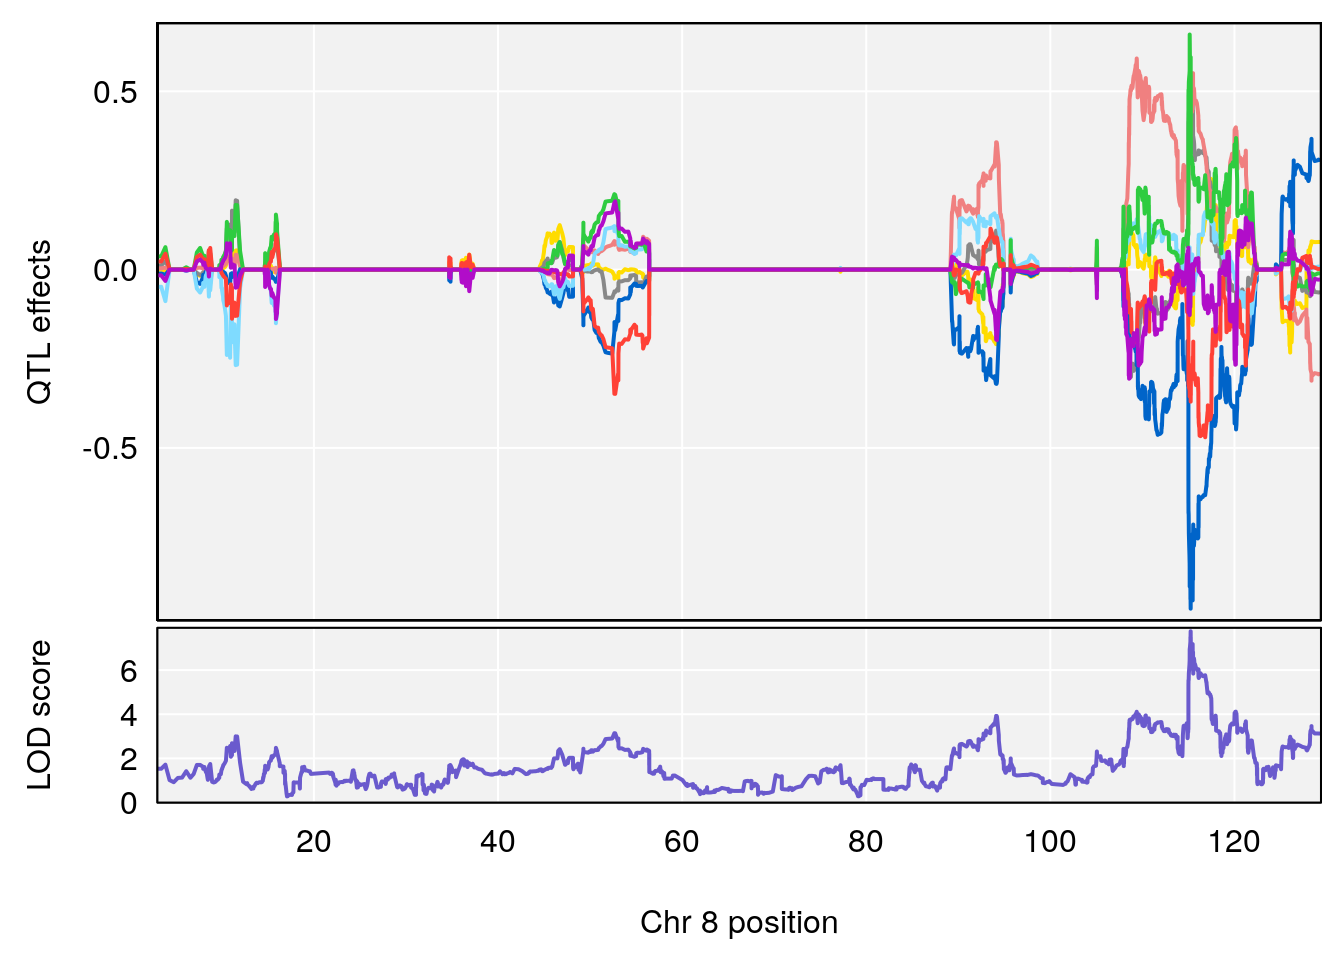
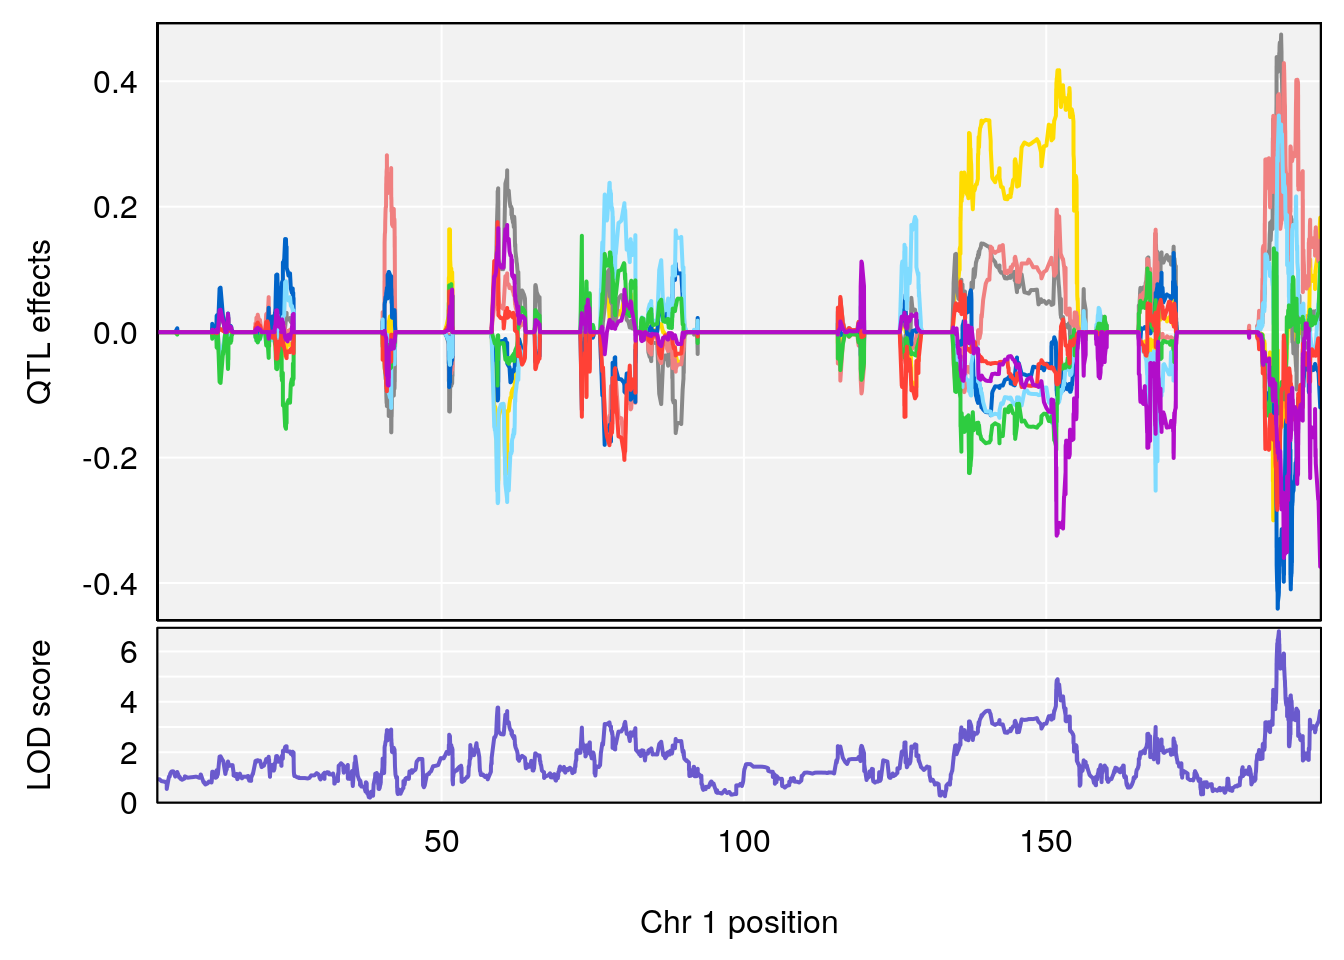
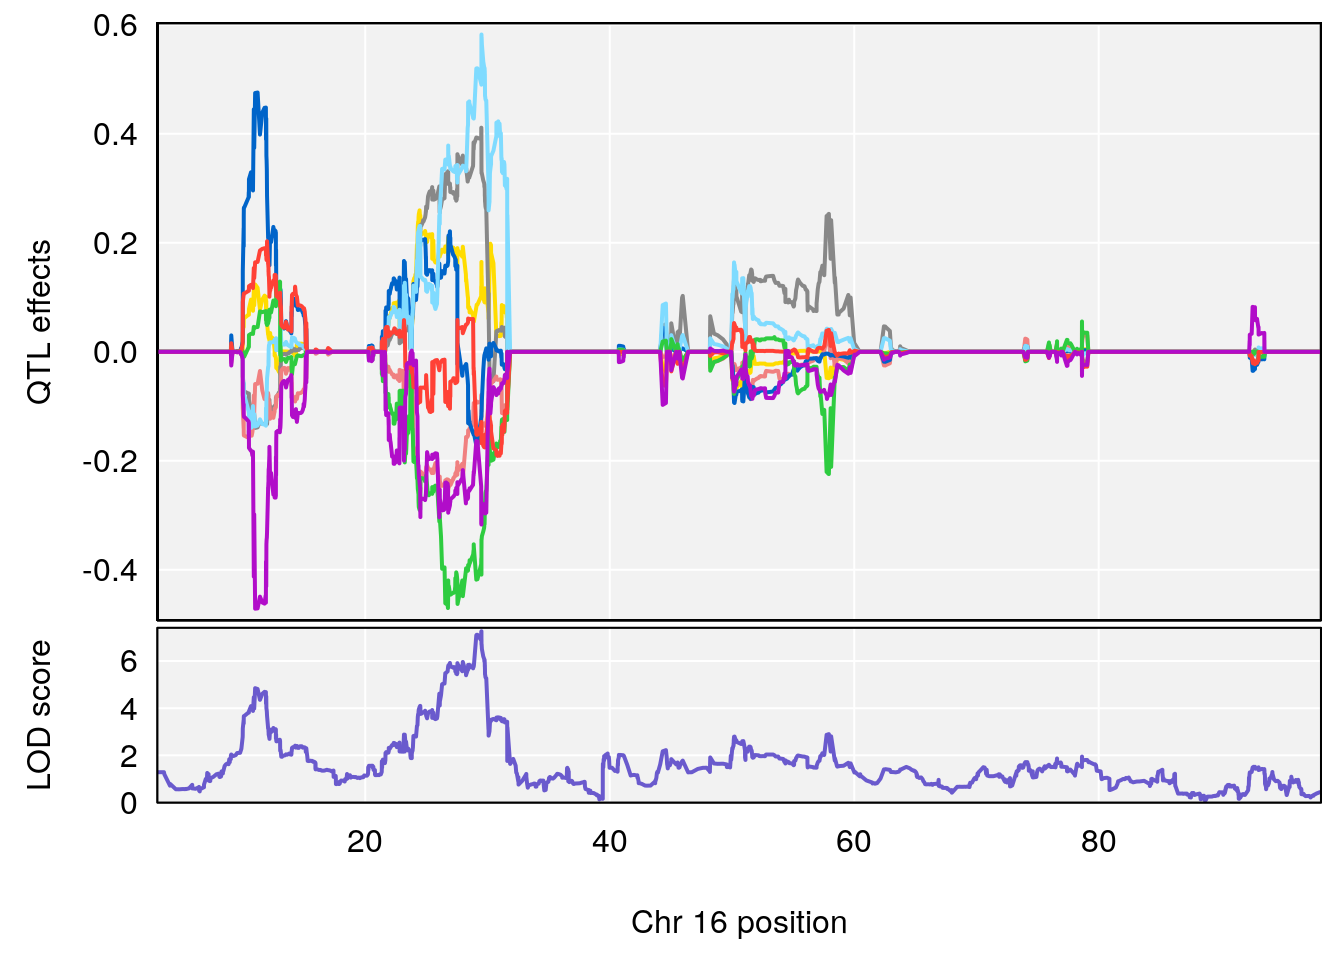
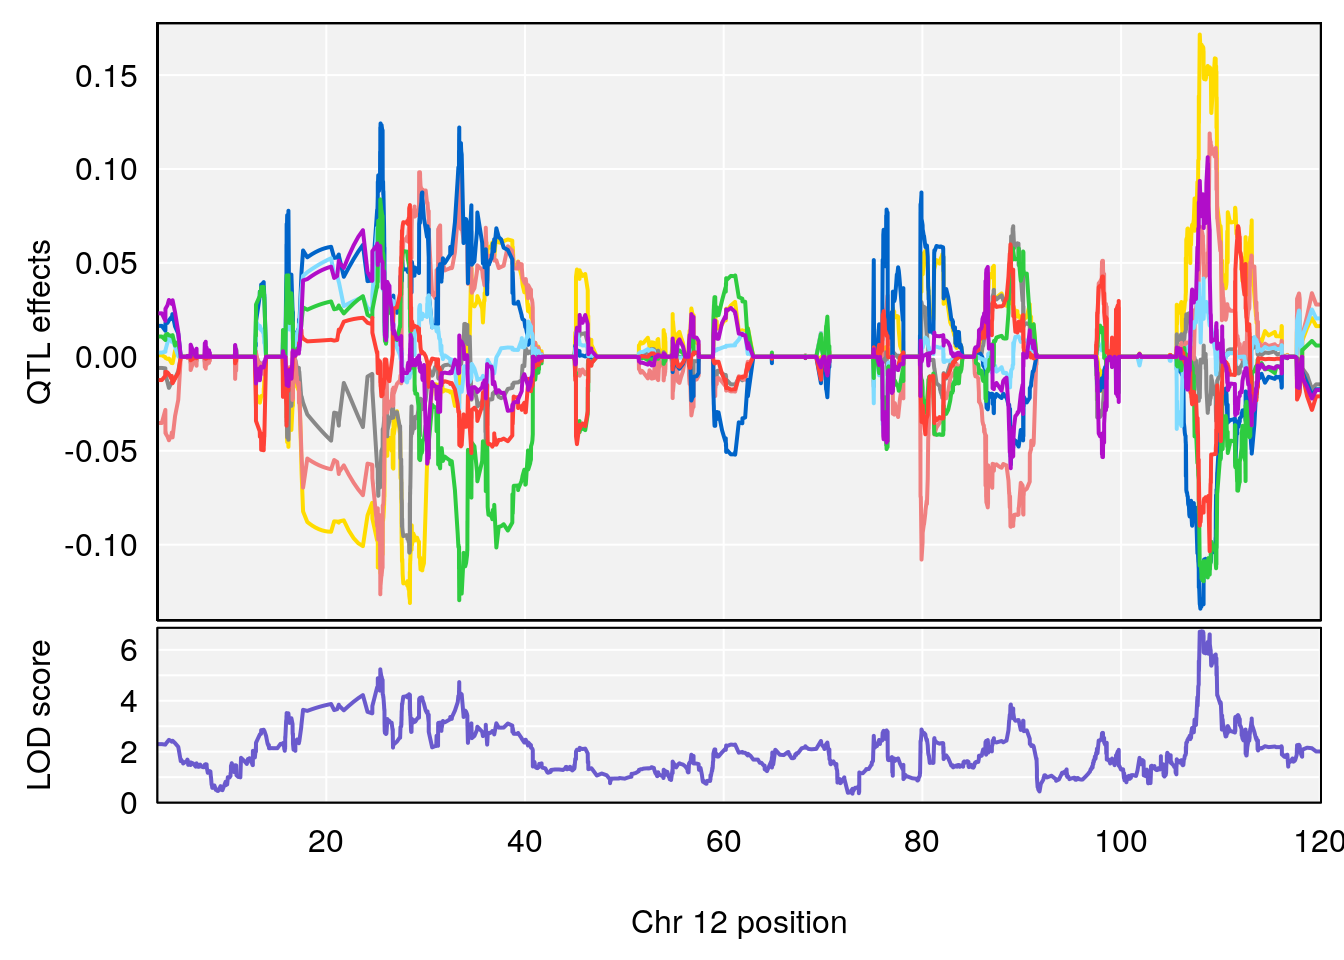
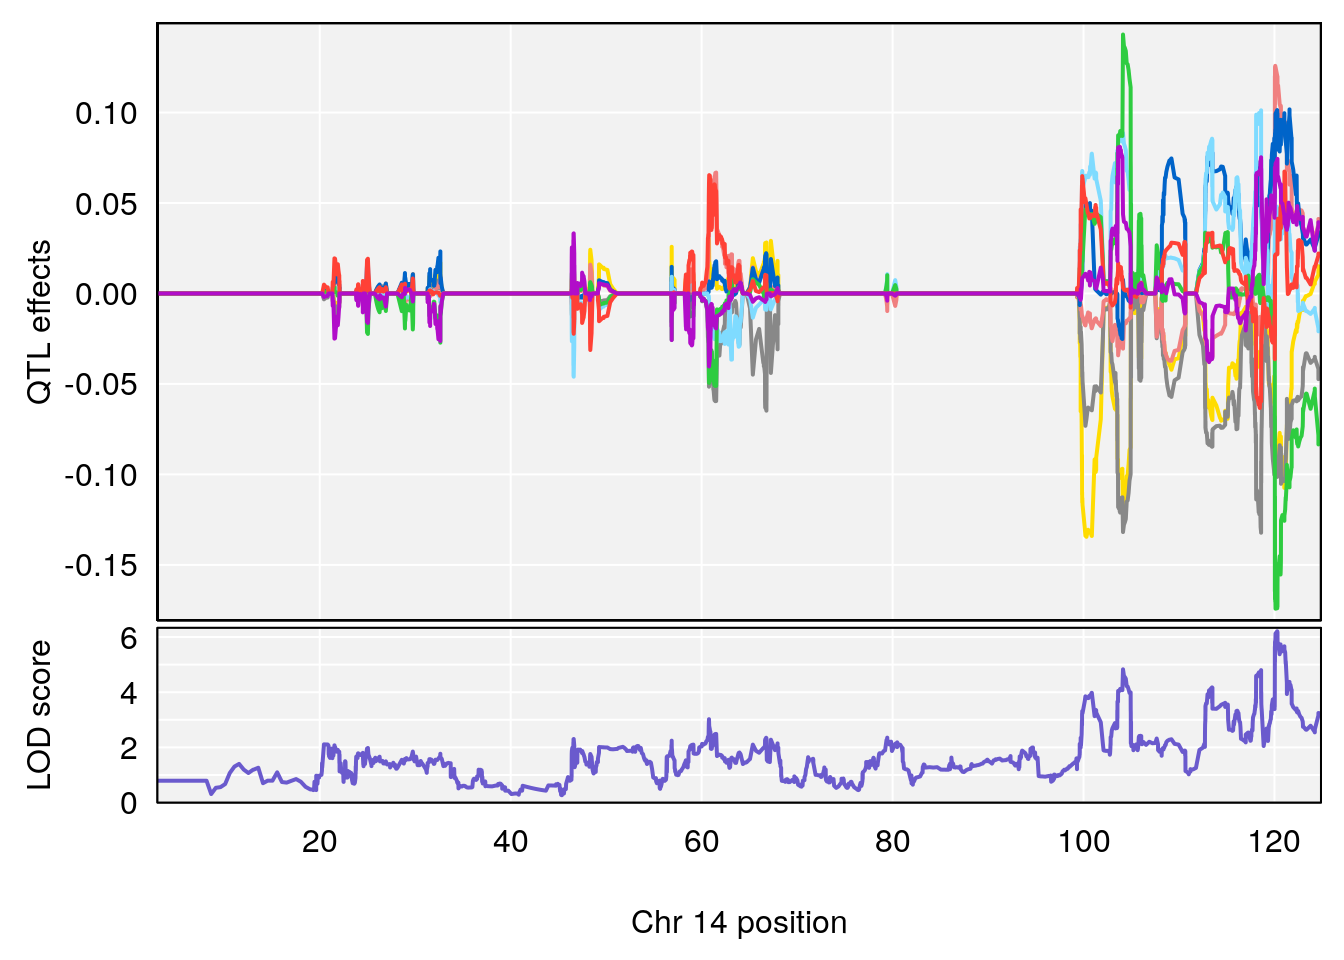
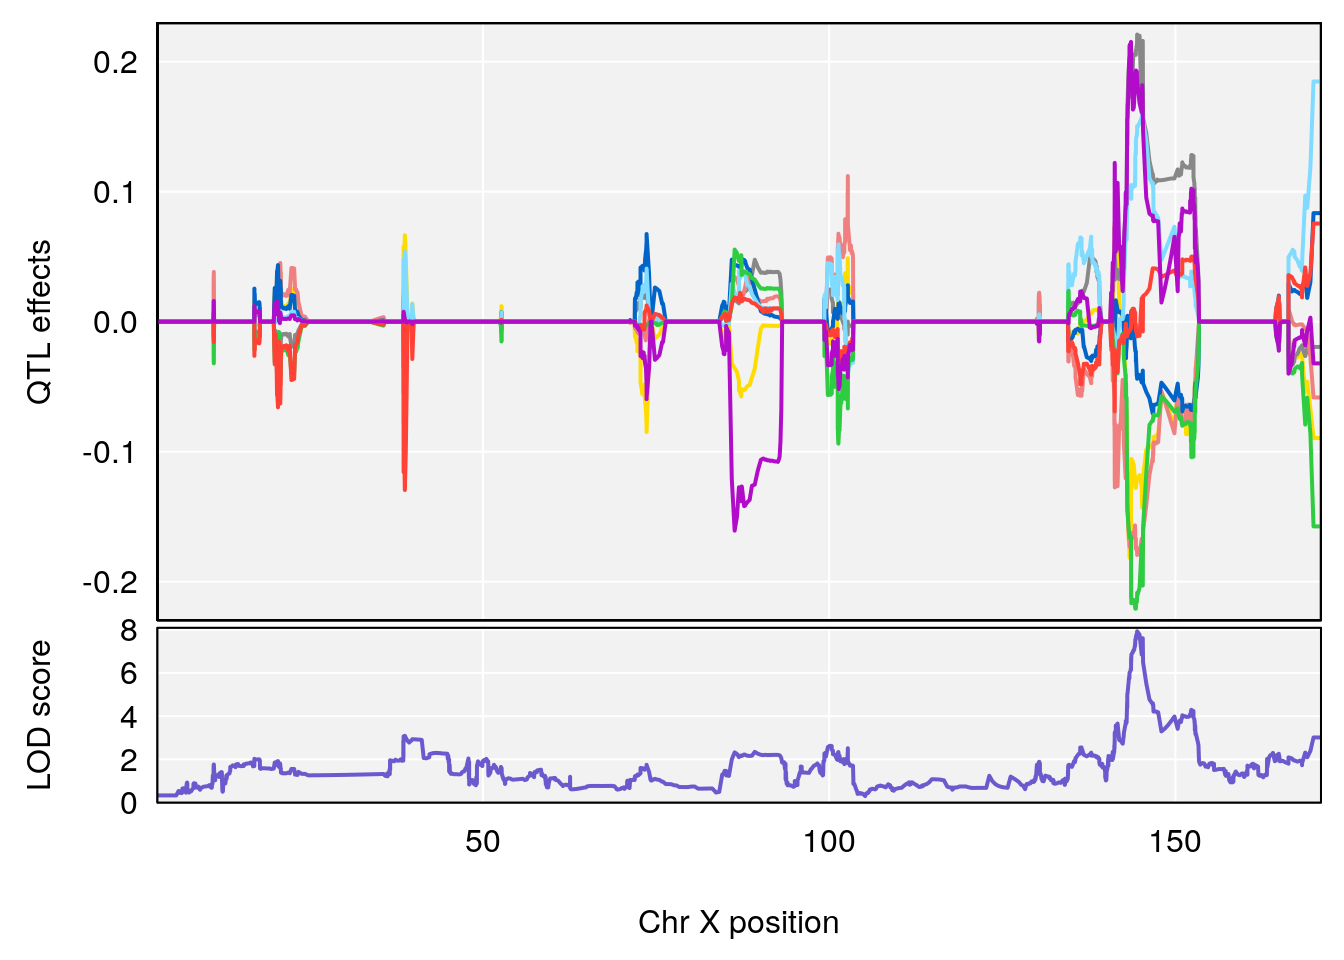
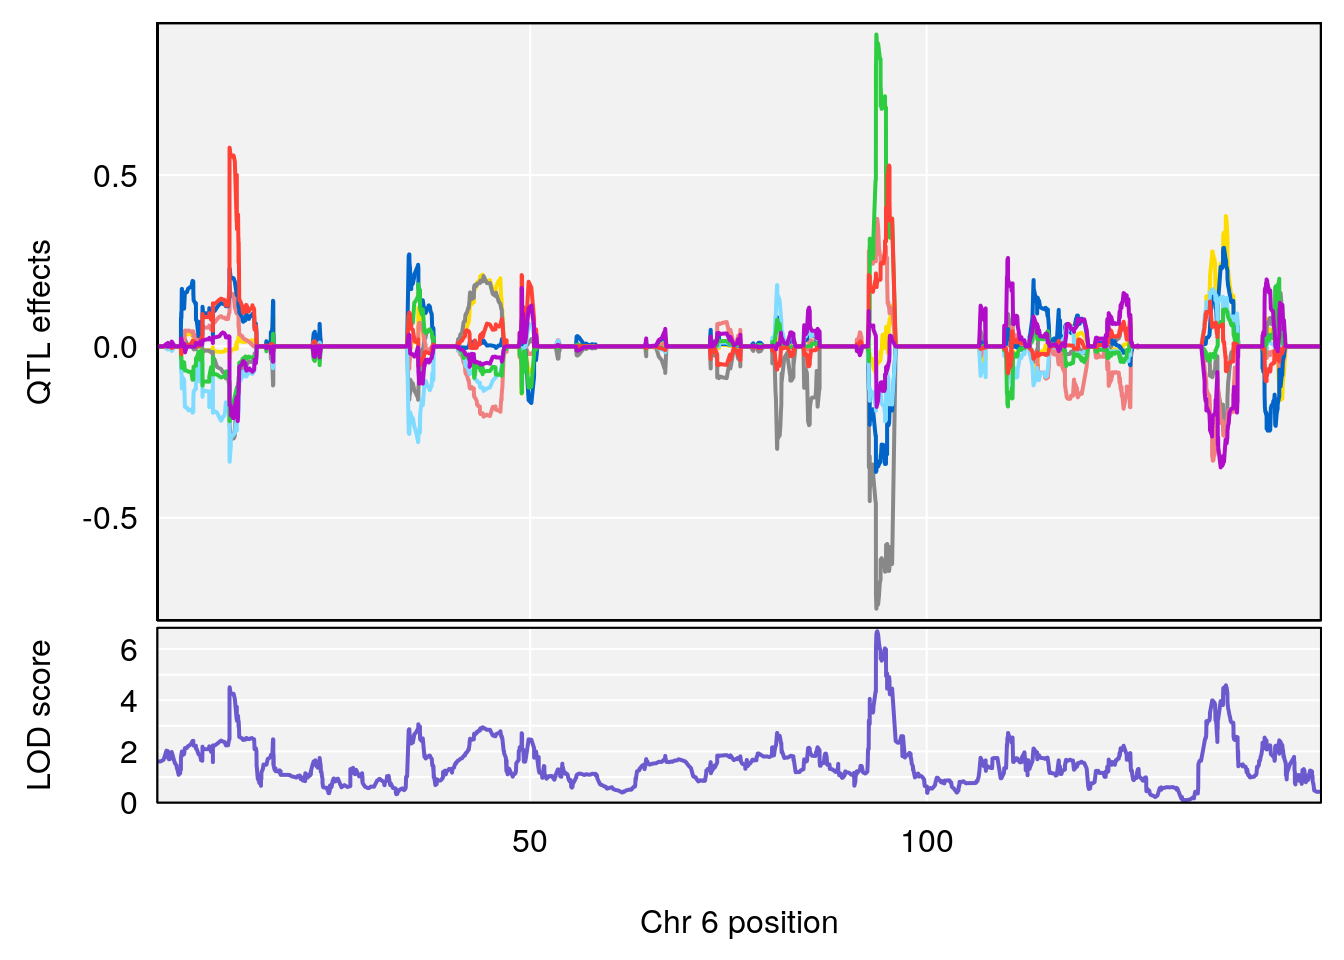
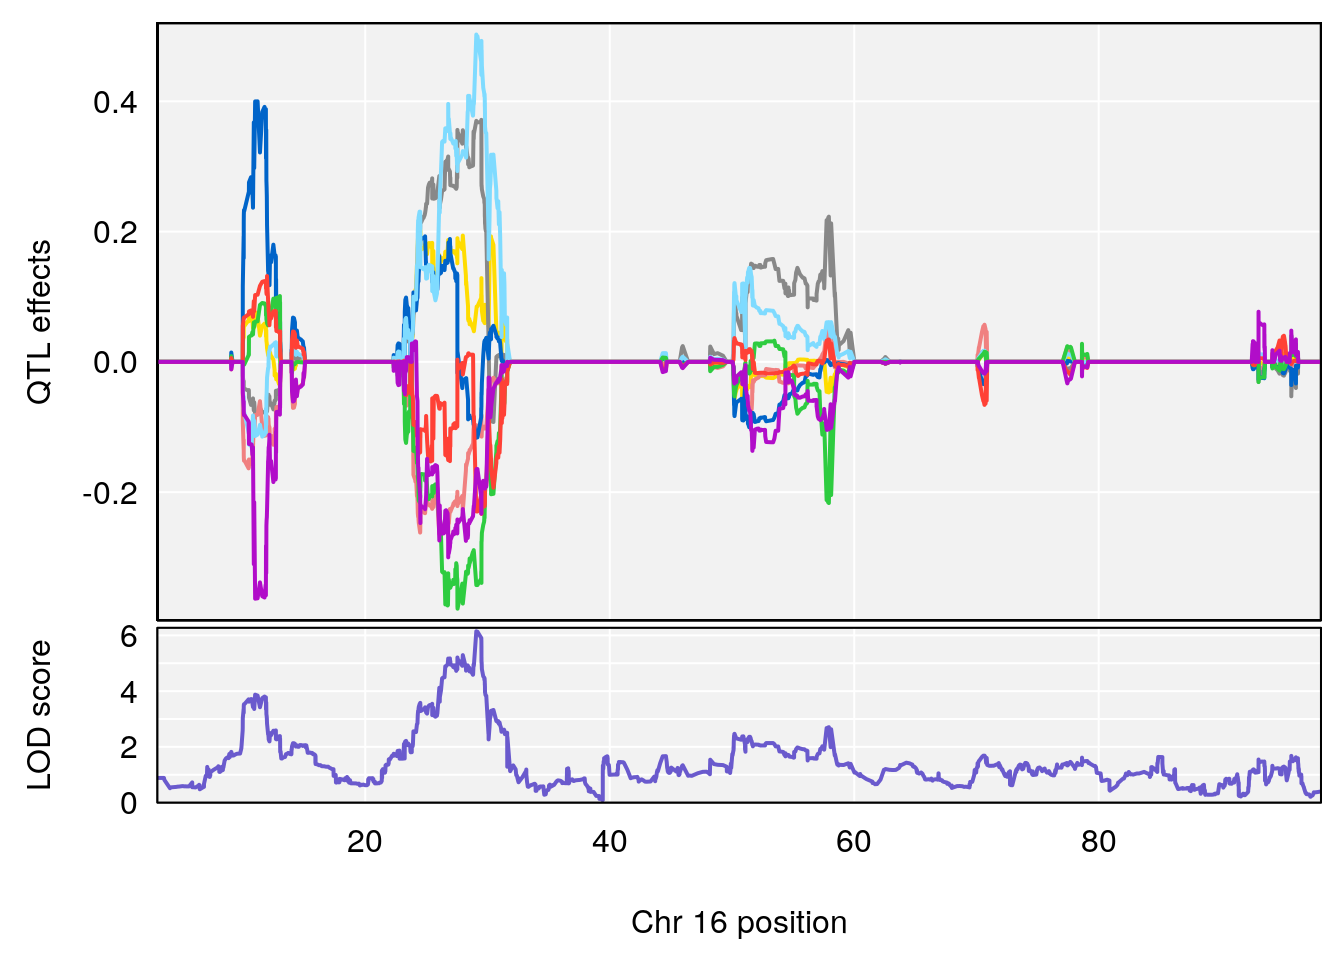
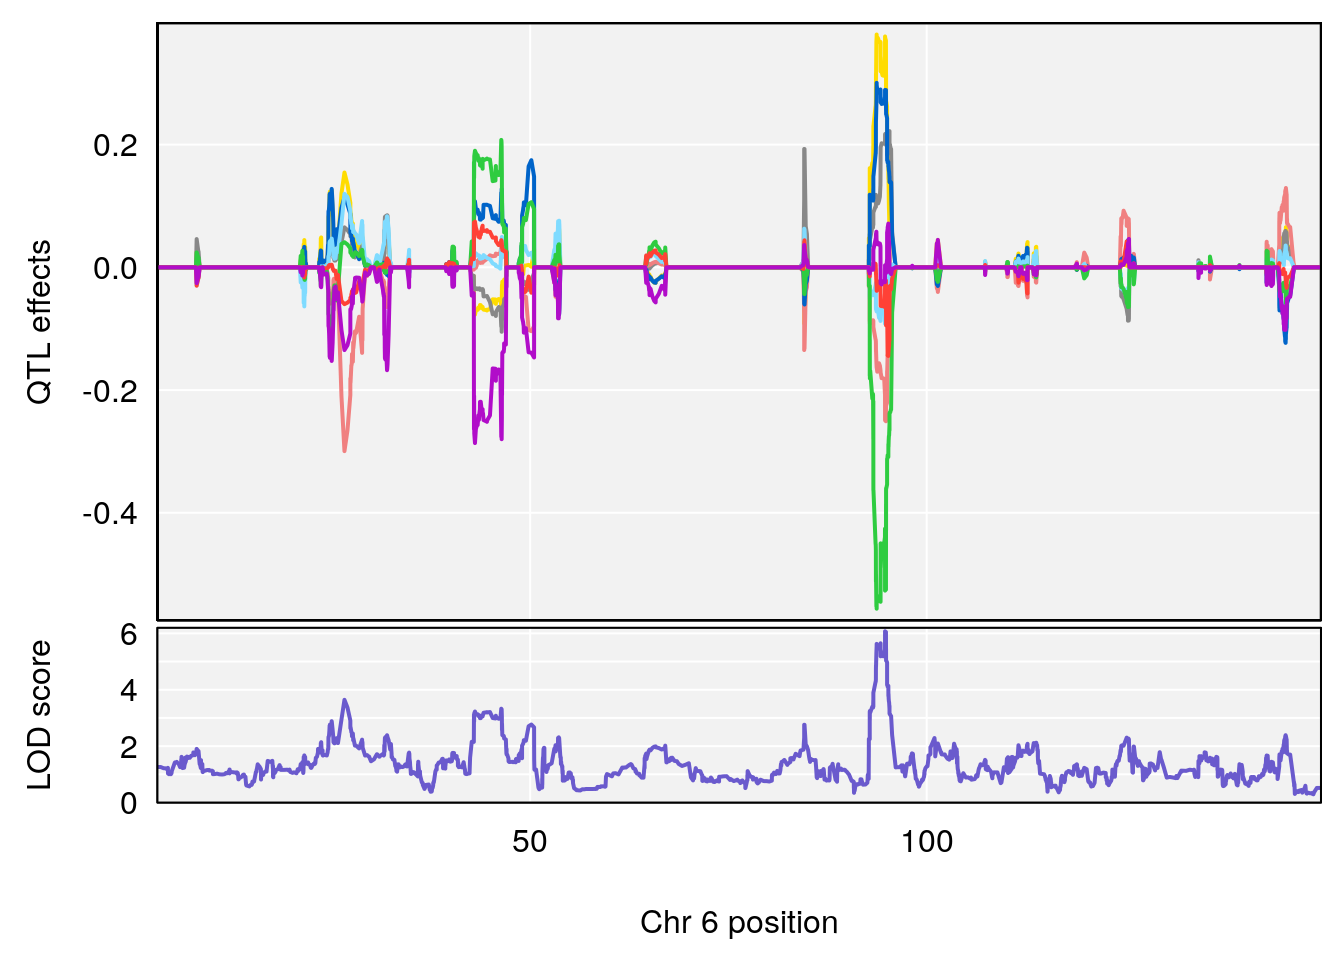
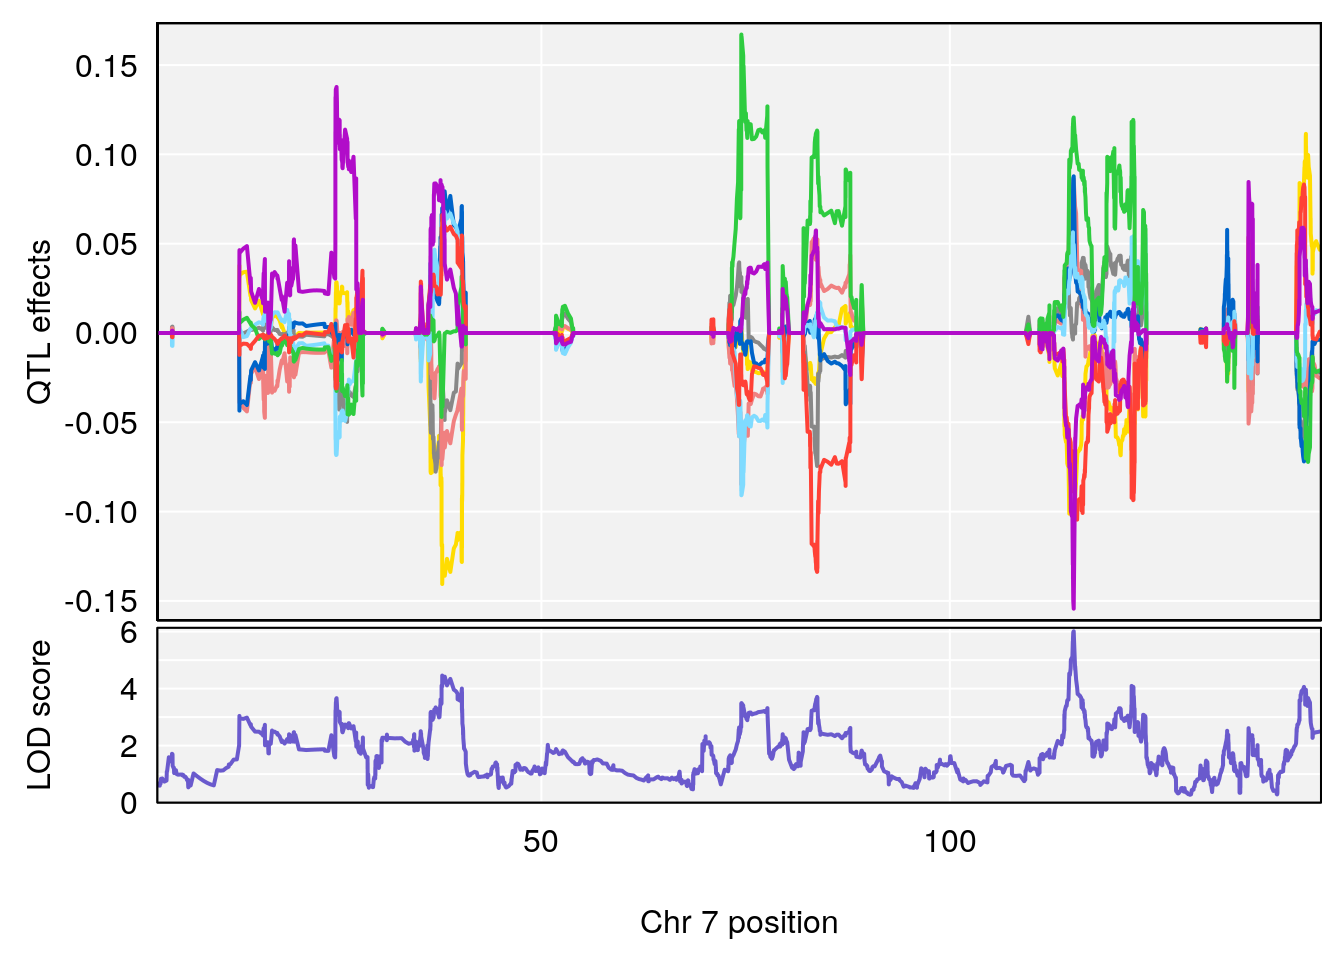
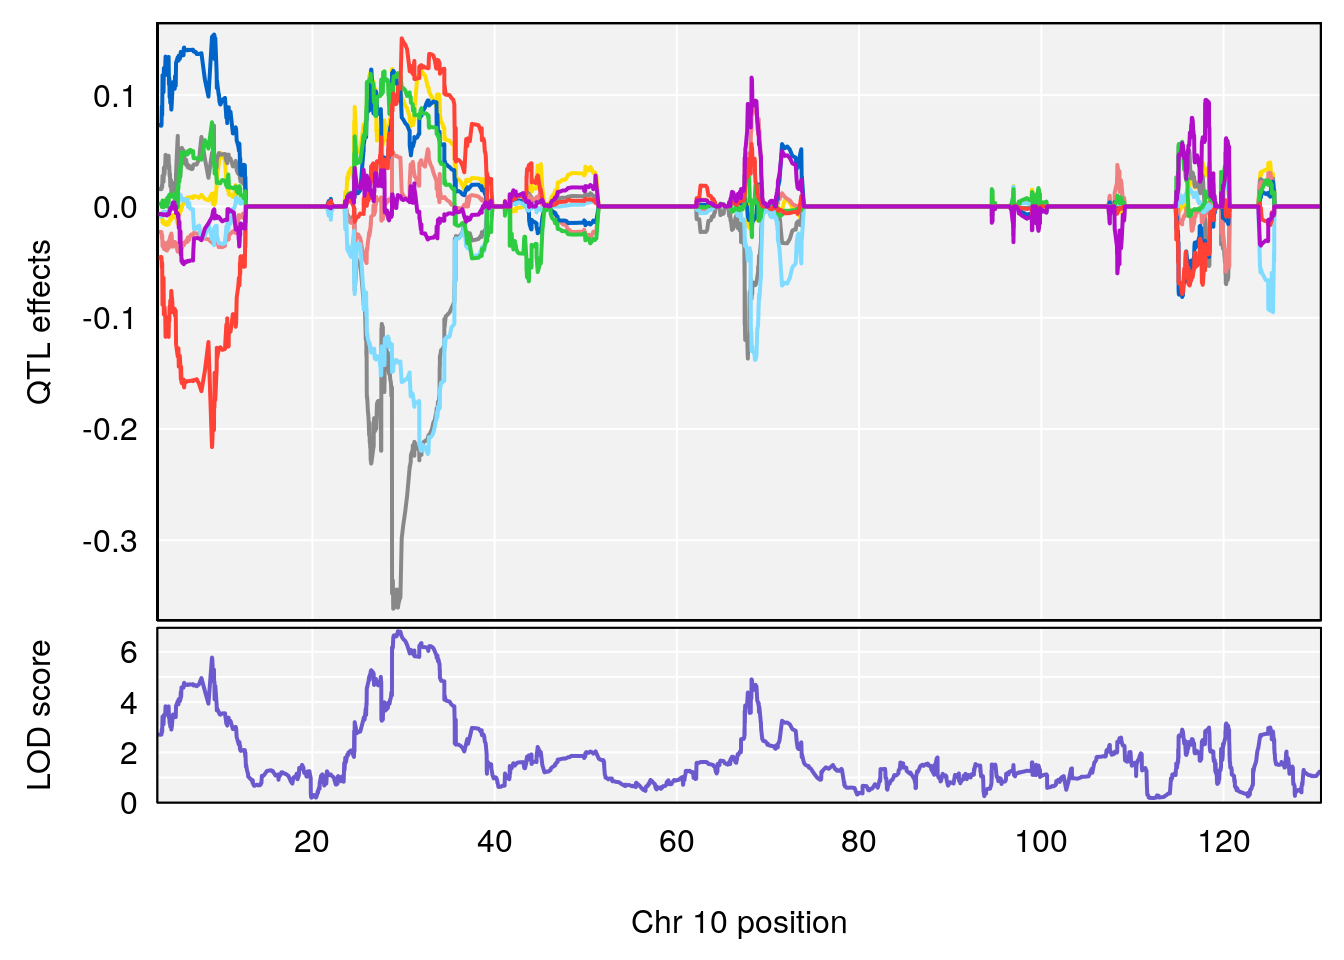
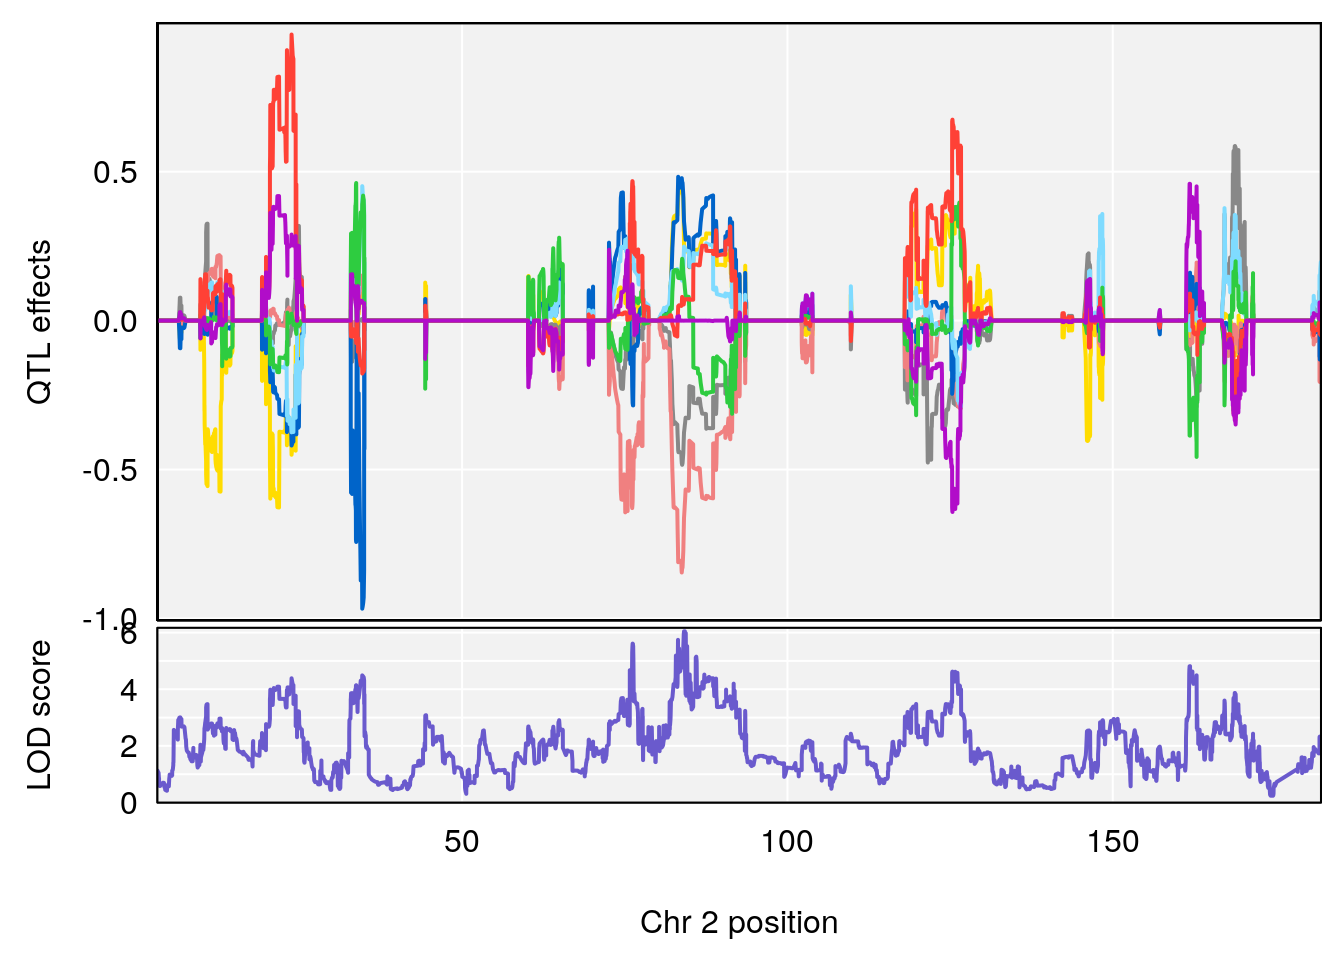
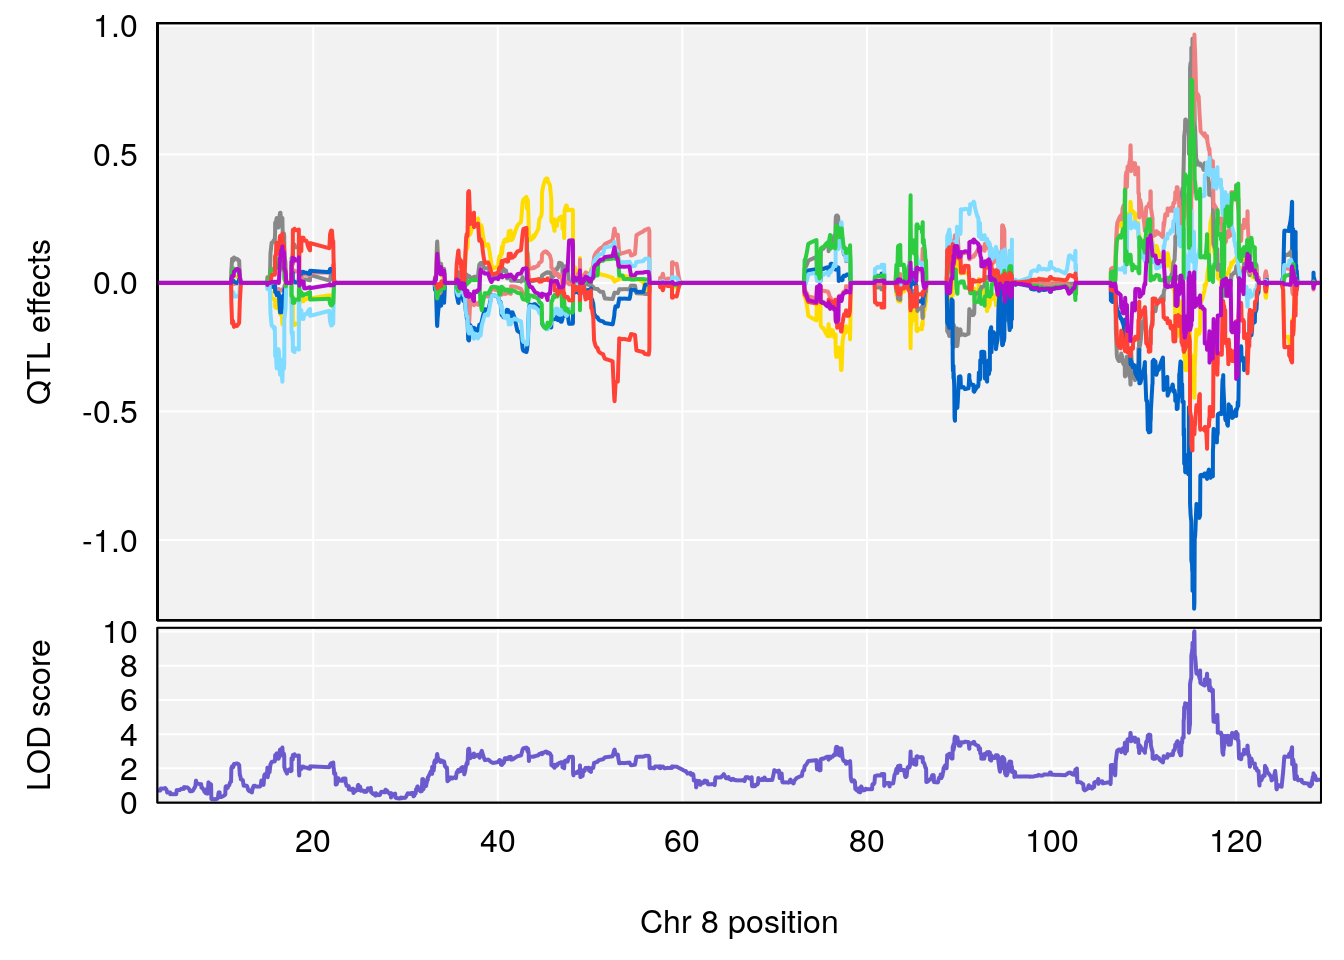
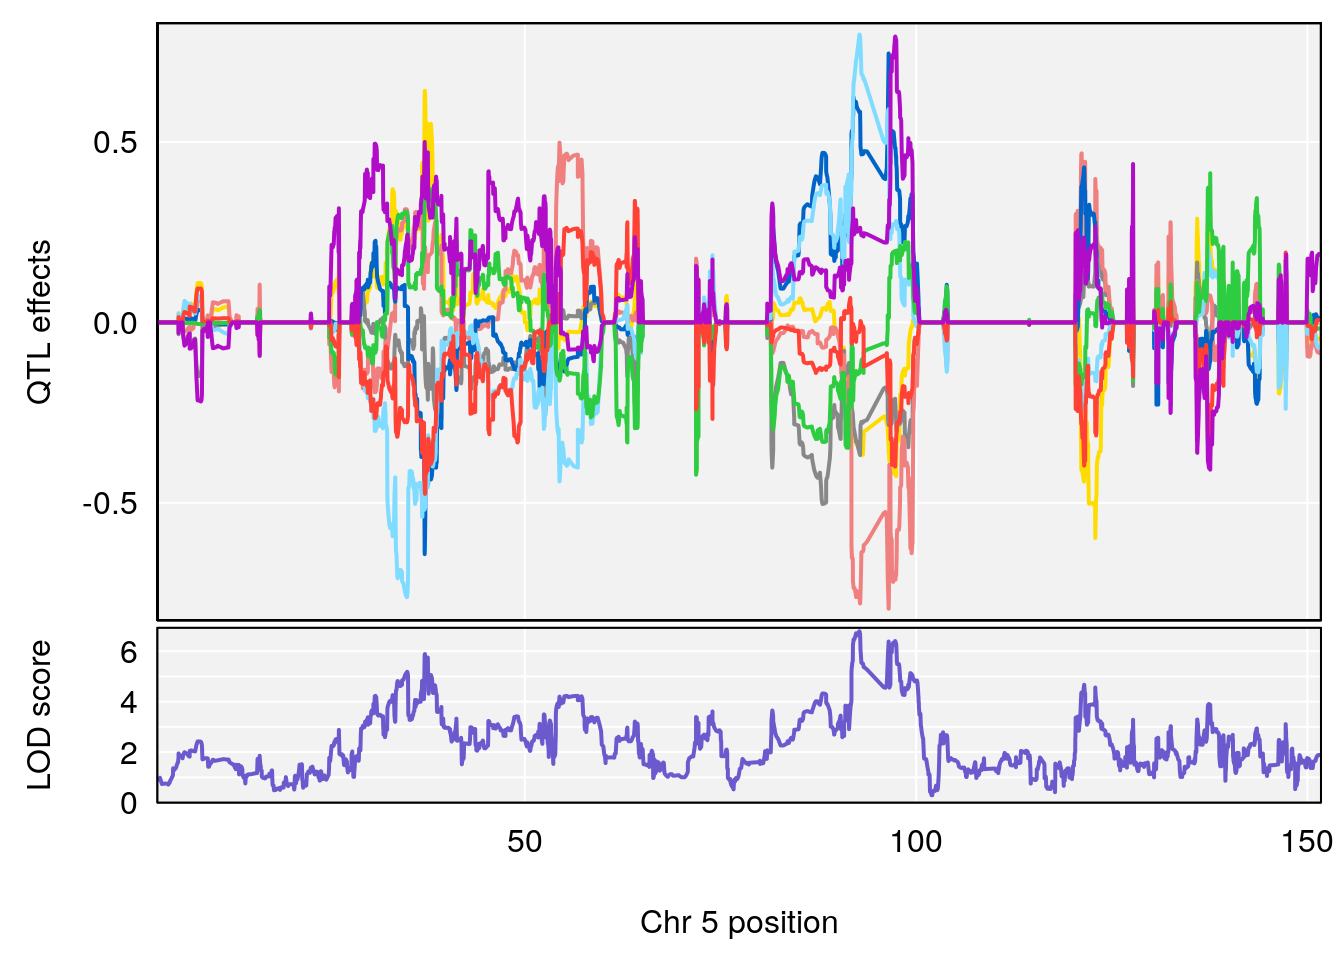
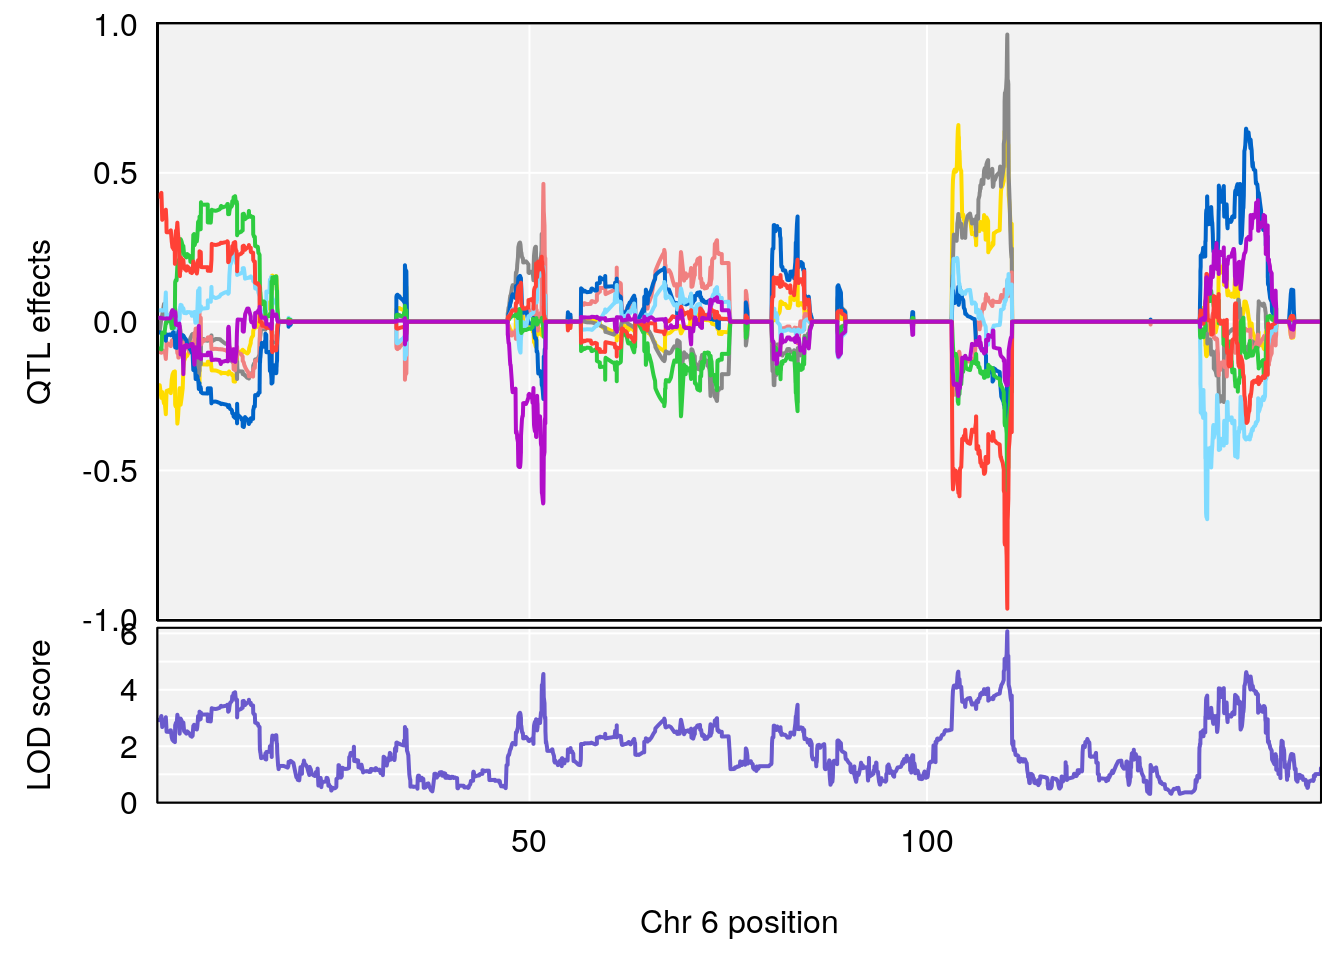
#peaks coeff plot
for(i in names(qtl.morphine.out)){
print(i)
peaks <- find_peaks(qtl.morphine.out[[i]], map=pmap, threshold=6, drop=1.5)
print(peaks)
for(p in 1:dim(peaks)[1]) {
print(p)
chr <-peaks[p,3]
#coeff plot
par(mar=c(4.1, 4.1, 0.6, 0.6))
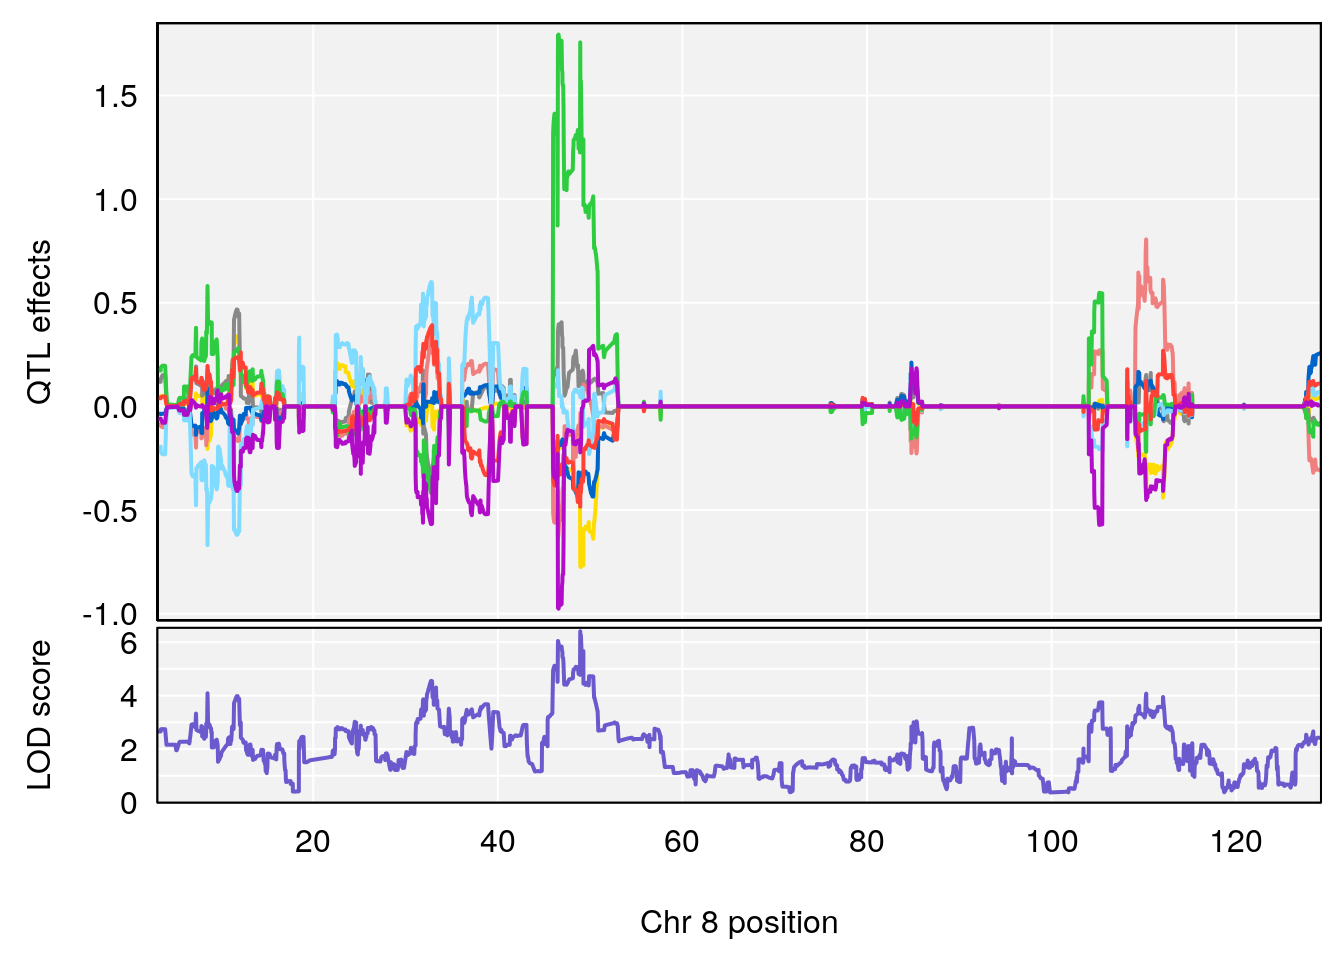
plot_coefCC(coef_c1[[i]][[p]], pmap[chr], scan1_output=qtl.morphine.out[[i]], bgcolor="gray95", legend=NULL)
plot_coefCC(coef_c2[[i]][[p]], pmap[chr], scan1_output=qtl.morphine.out[[i]], bgcolor="gray95", legend=NULL)
}
}
# [1] "Survival.Time"
# lodindex lodcolumn chr pos lod ci_lo ci_hi
# 1 1 pheno1 3 100.22014 6.314064 86.91920 101.53654
# 2 1 pheno1 6 93.76935 8.235696 93.60032 94.88262
# 3 1 pheno1 8 115.24260 7.756984 115.11279 115.81949
# [1] 1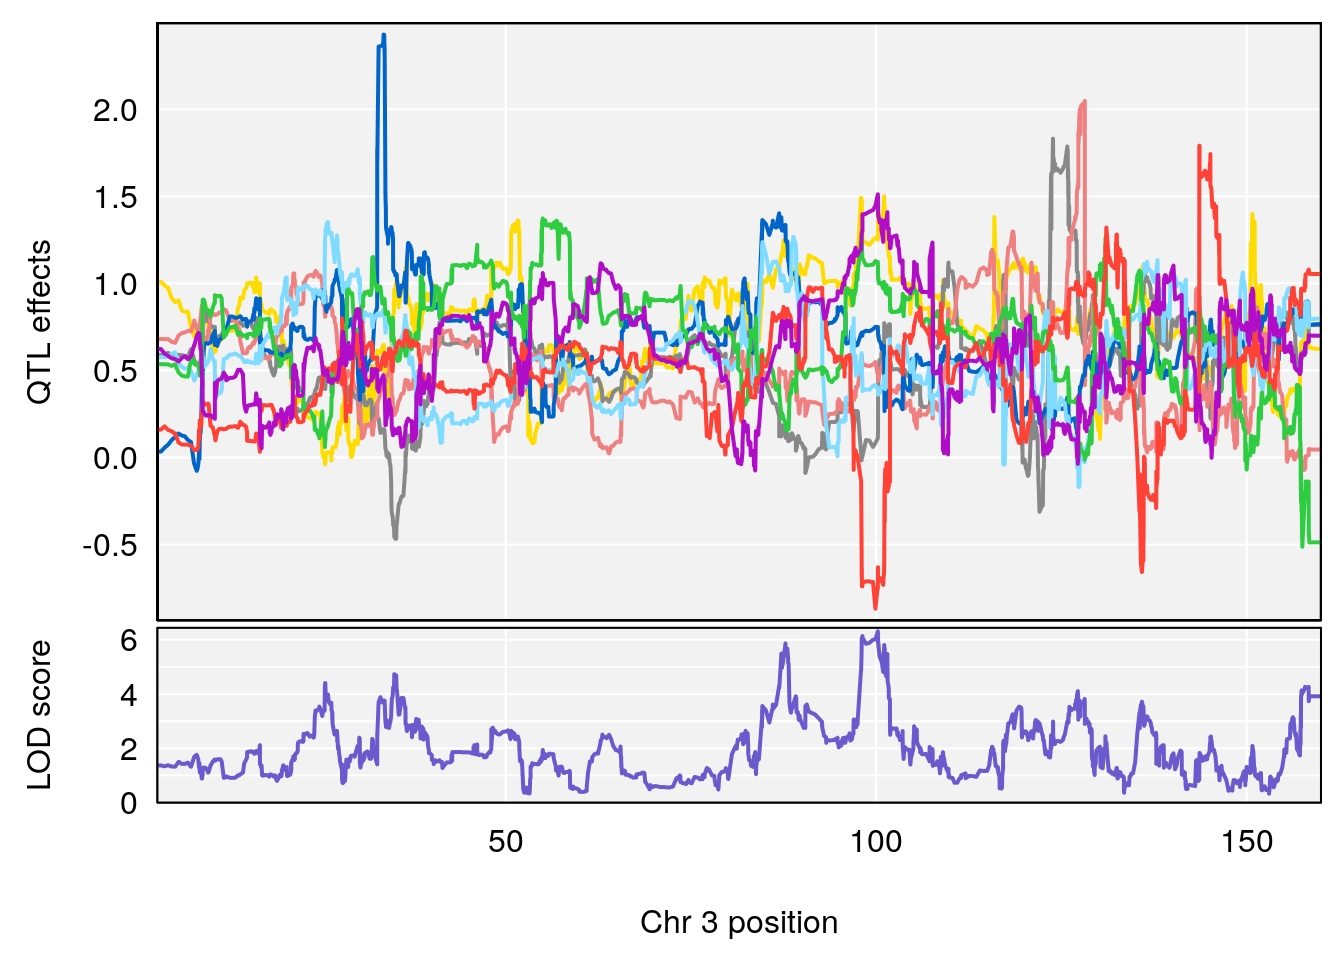
# [1] 2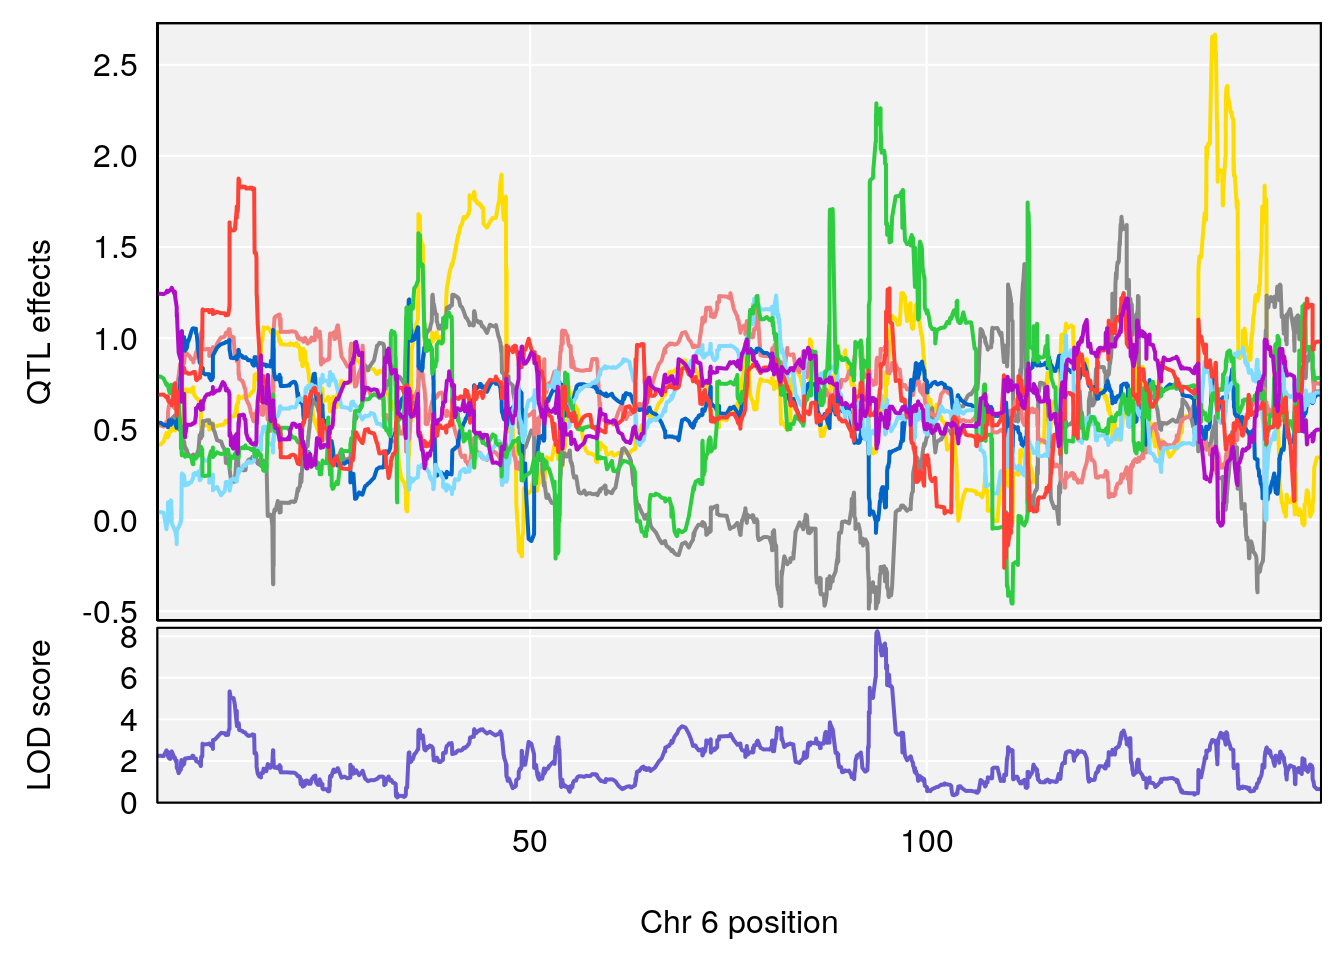
# [1] 3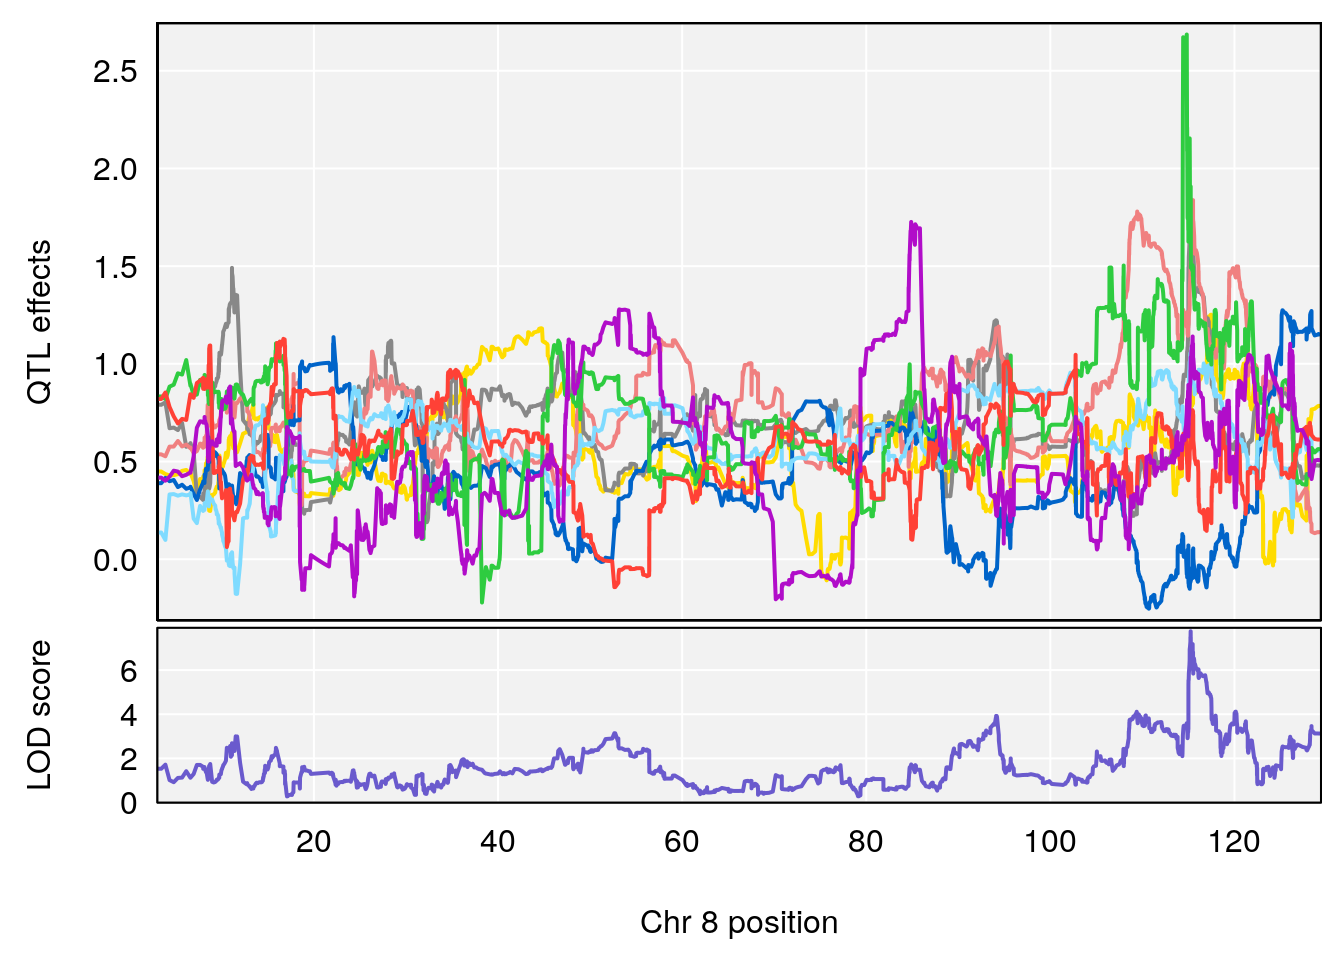
# [1] "Recovery.Time"
#   lodindex lodcolumn chr       pos      lod     ci_lo     ci_hi
# 1        1    pheno1   1 188.47009 6.800872 188.08317 189.42004
# 2        1    pheno1  16  29.50467 7.258734  26.76501  29.78912
# [1] 1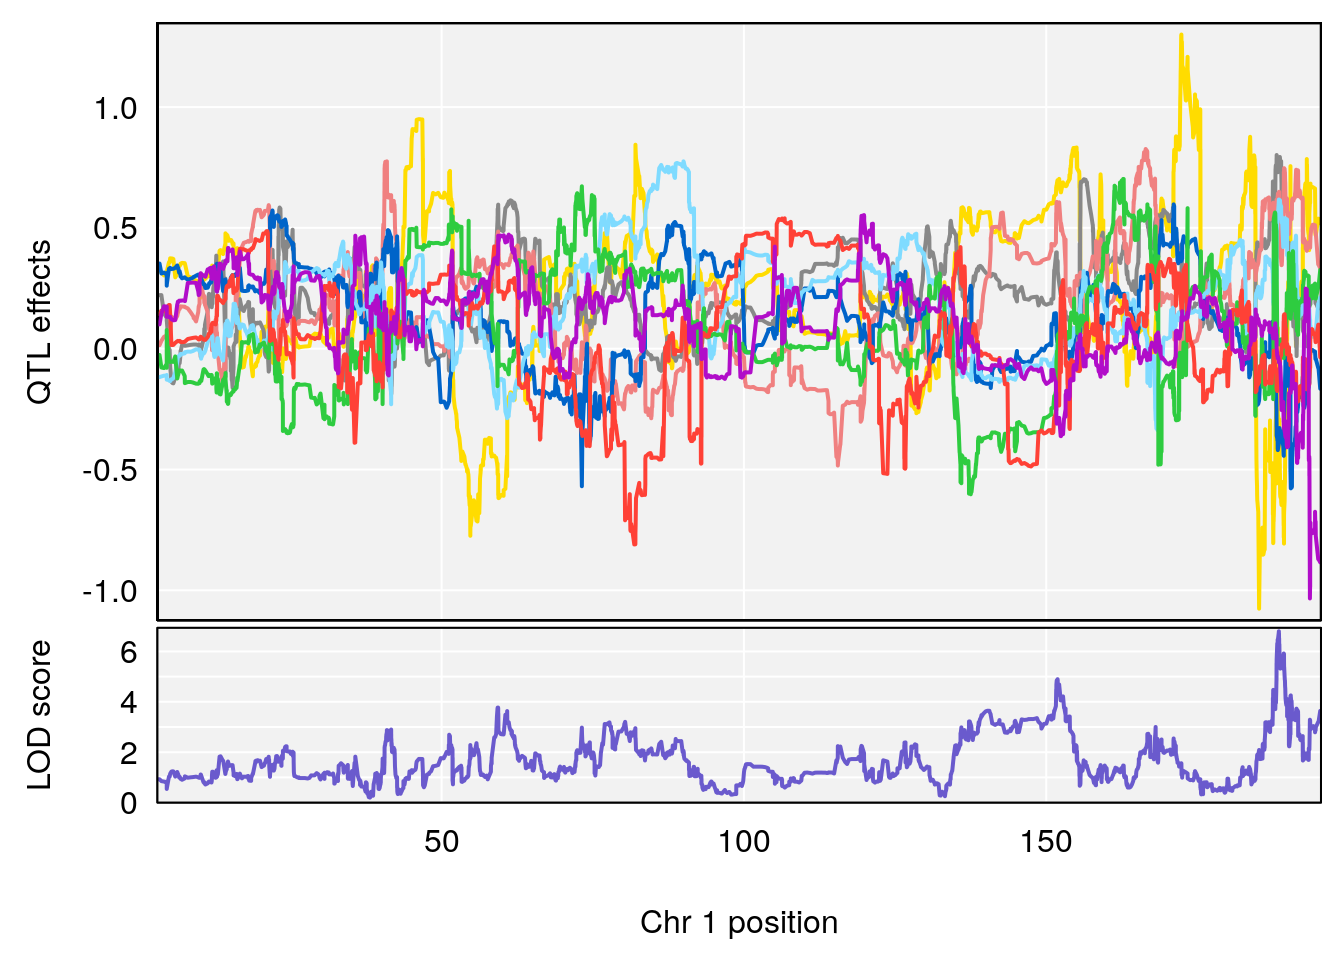
# [1] 2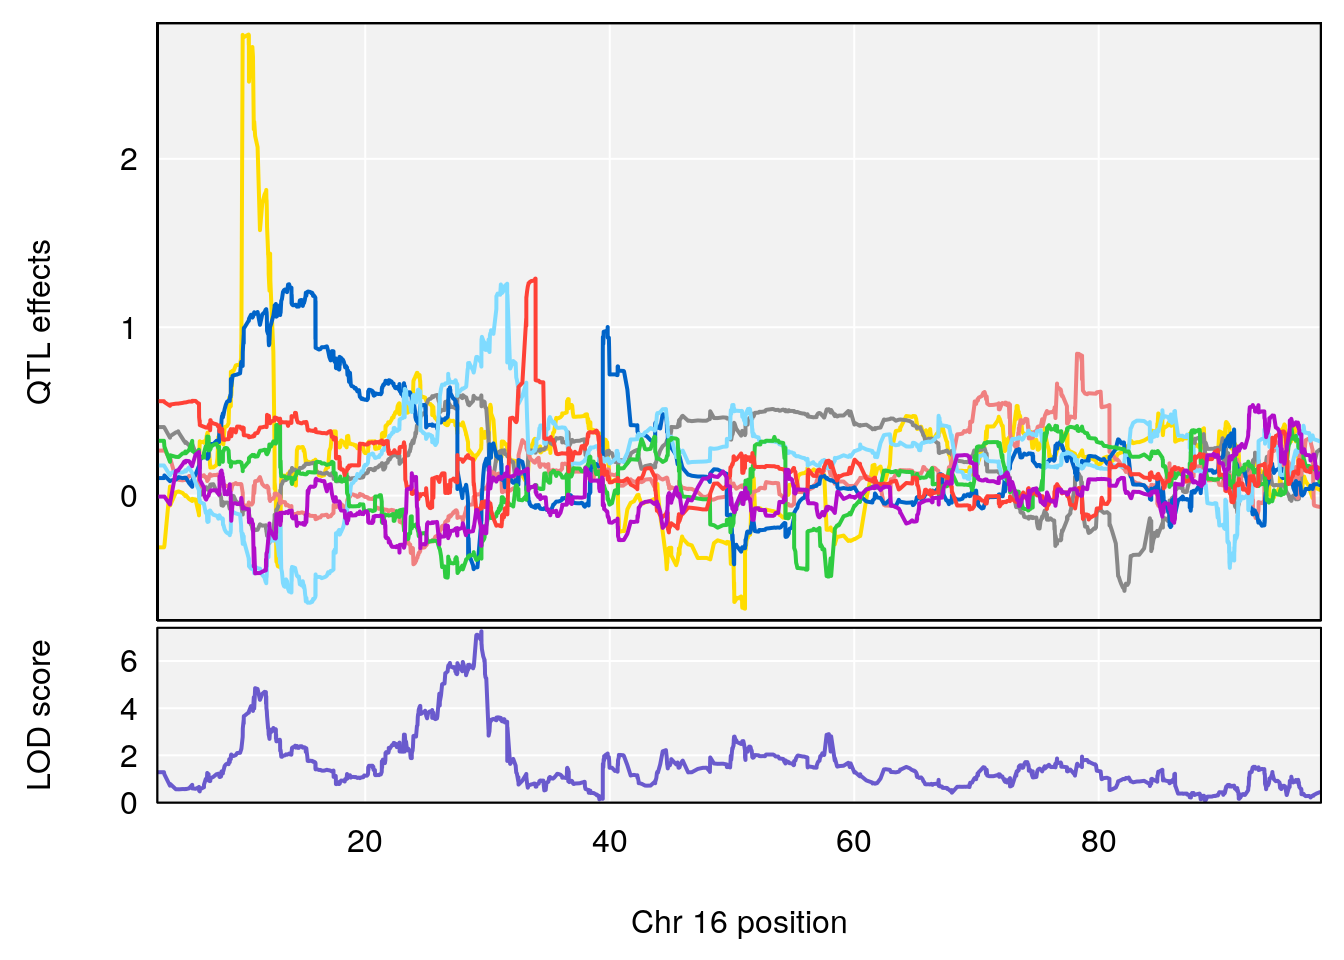
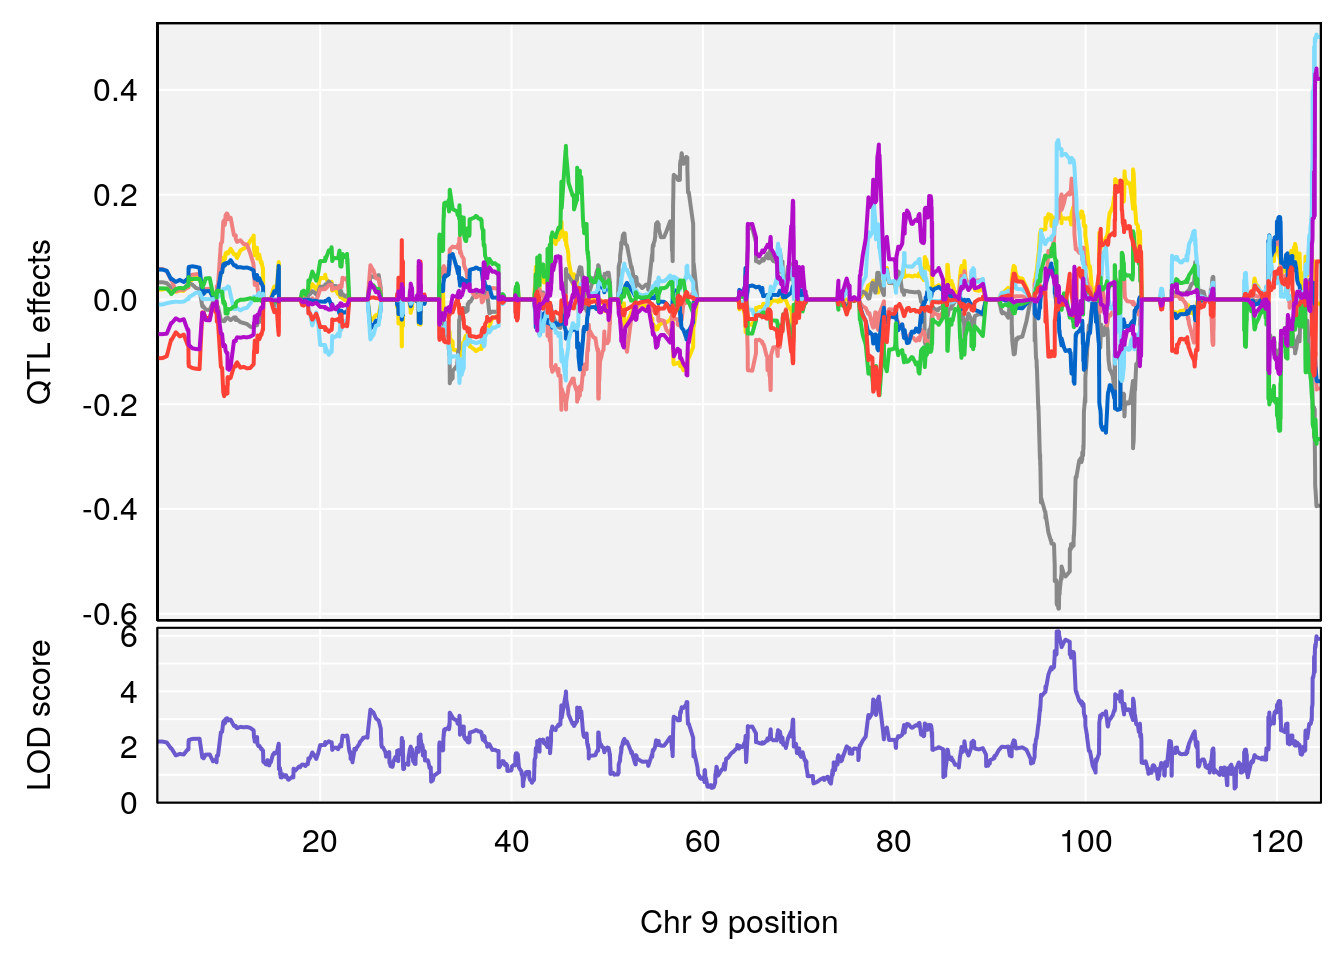
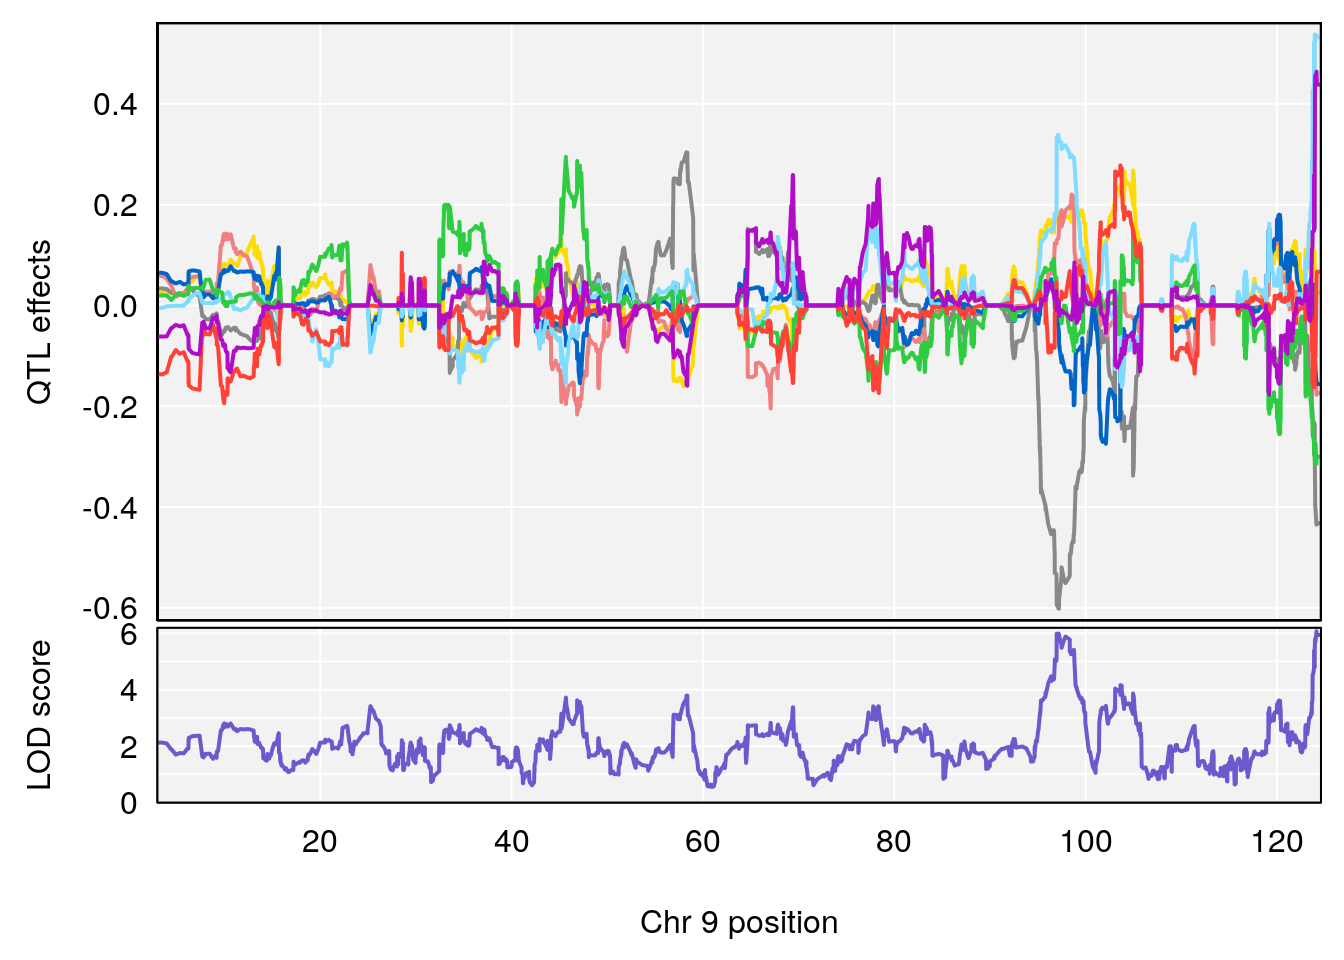
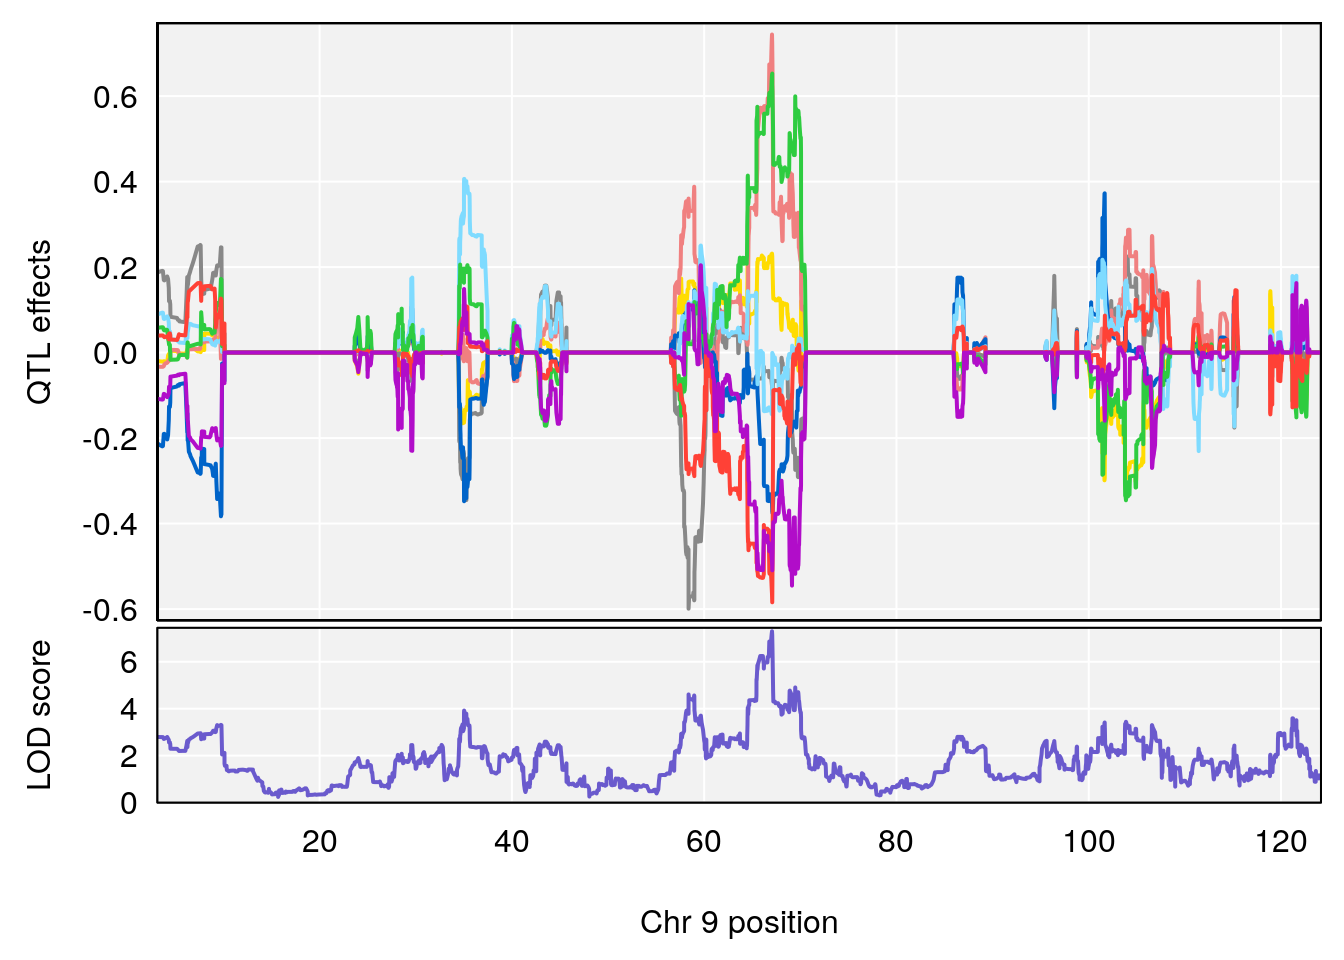
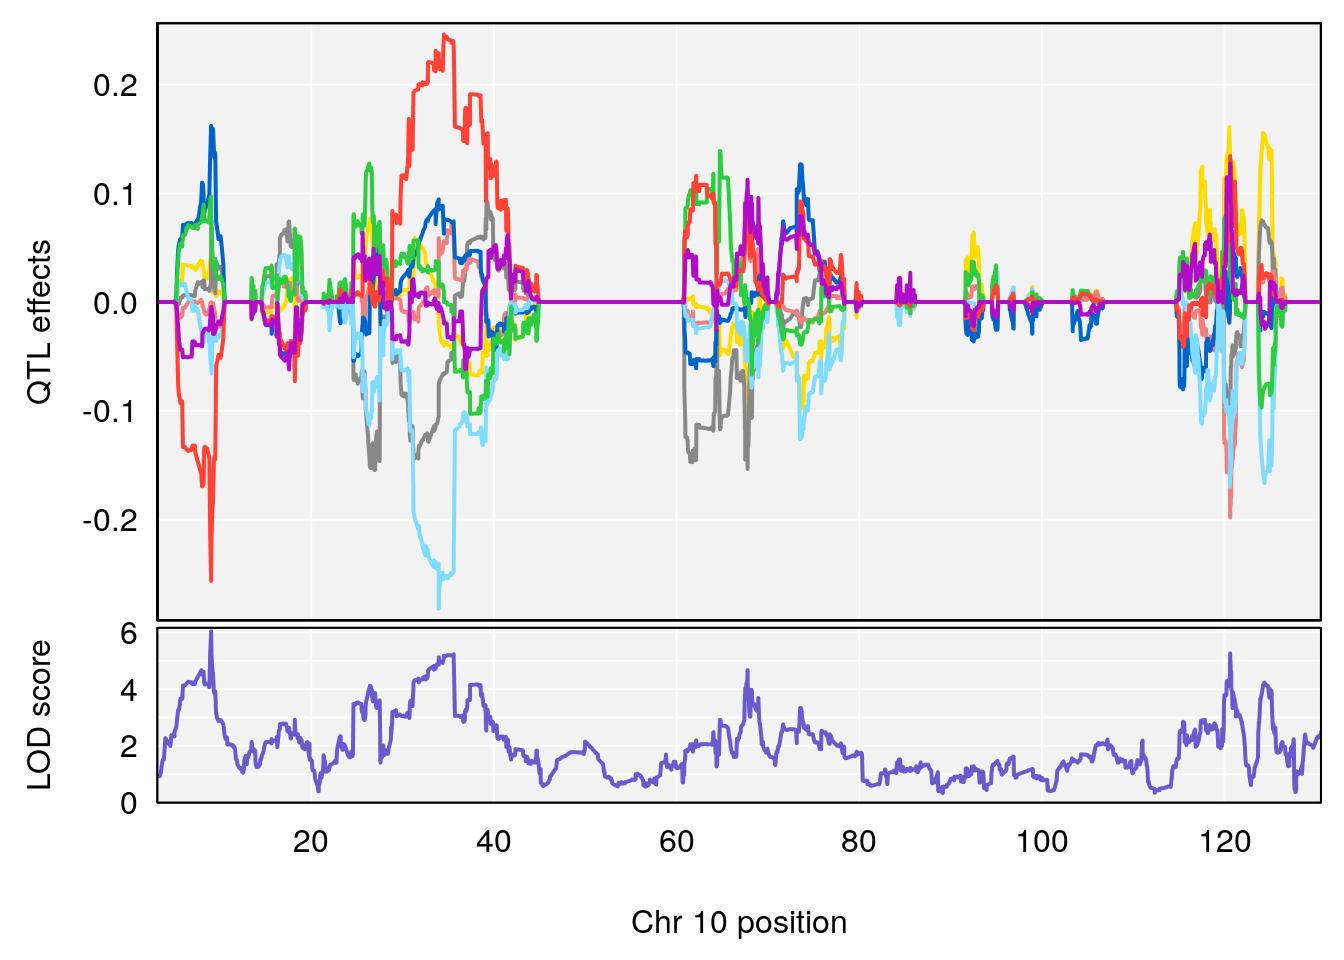
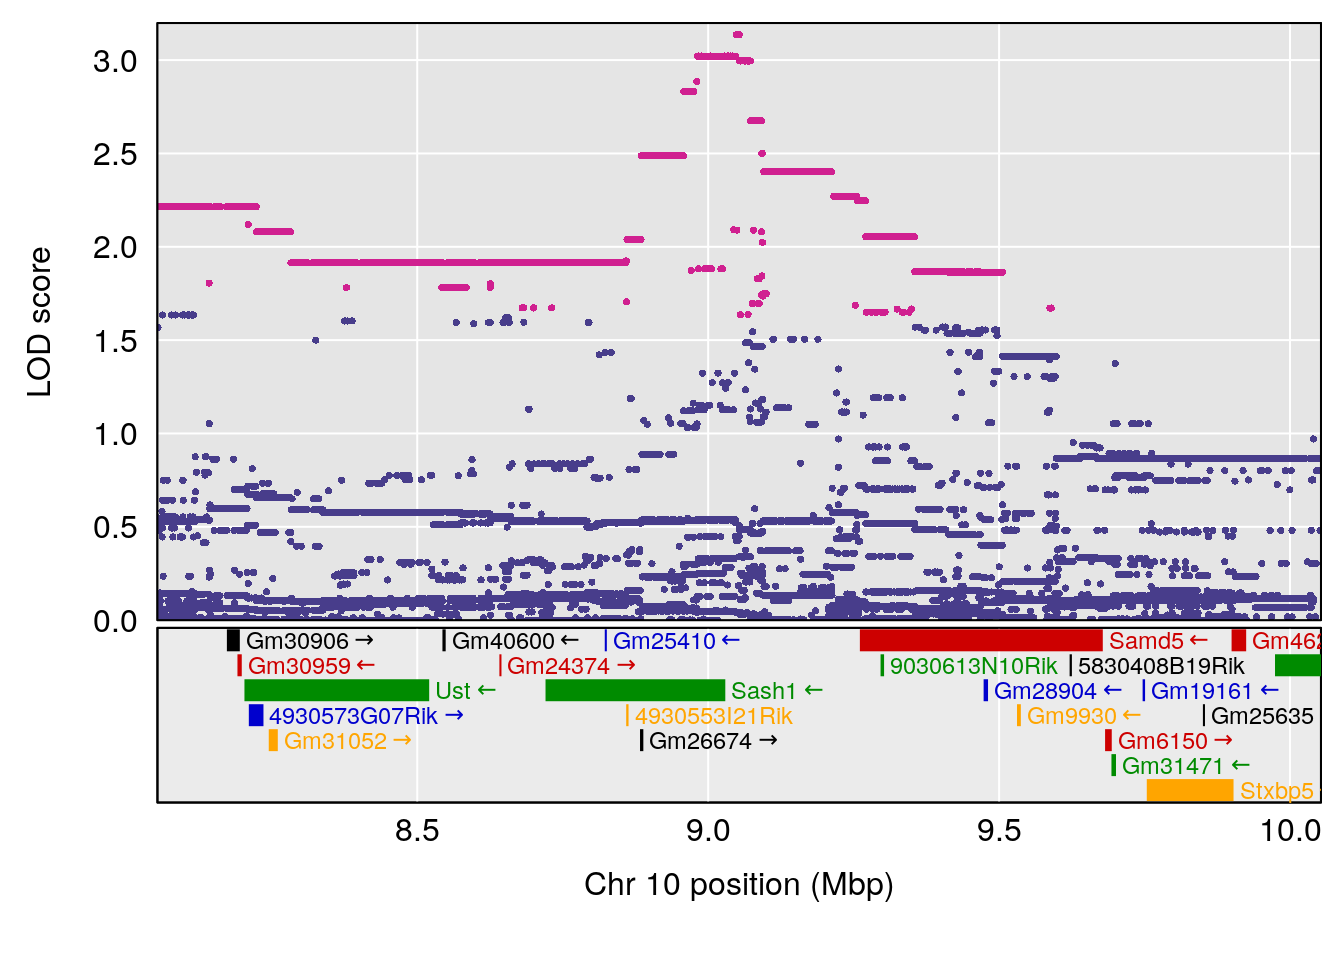
# [1] "Min.depression"
#   lodindex lodcolumn chr      pos      lod    ci_lo    ci_hi
# 1        1    pheno1   9 97.15519 6.161653 96.10171 124.5827
# [1] 1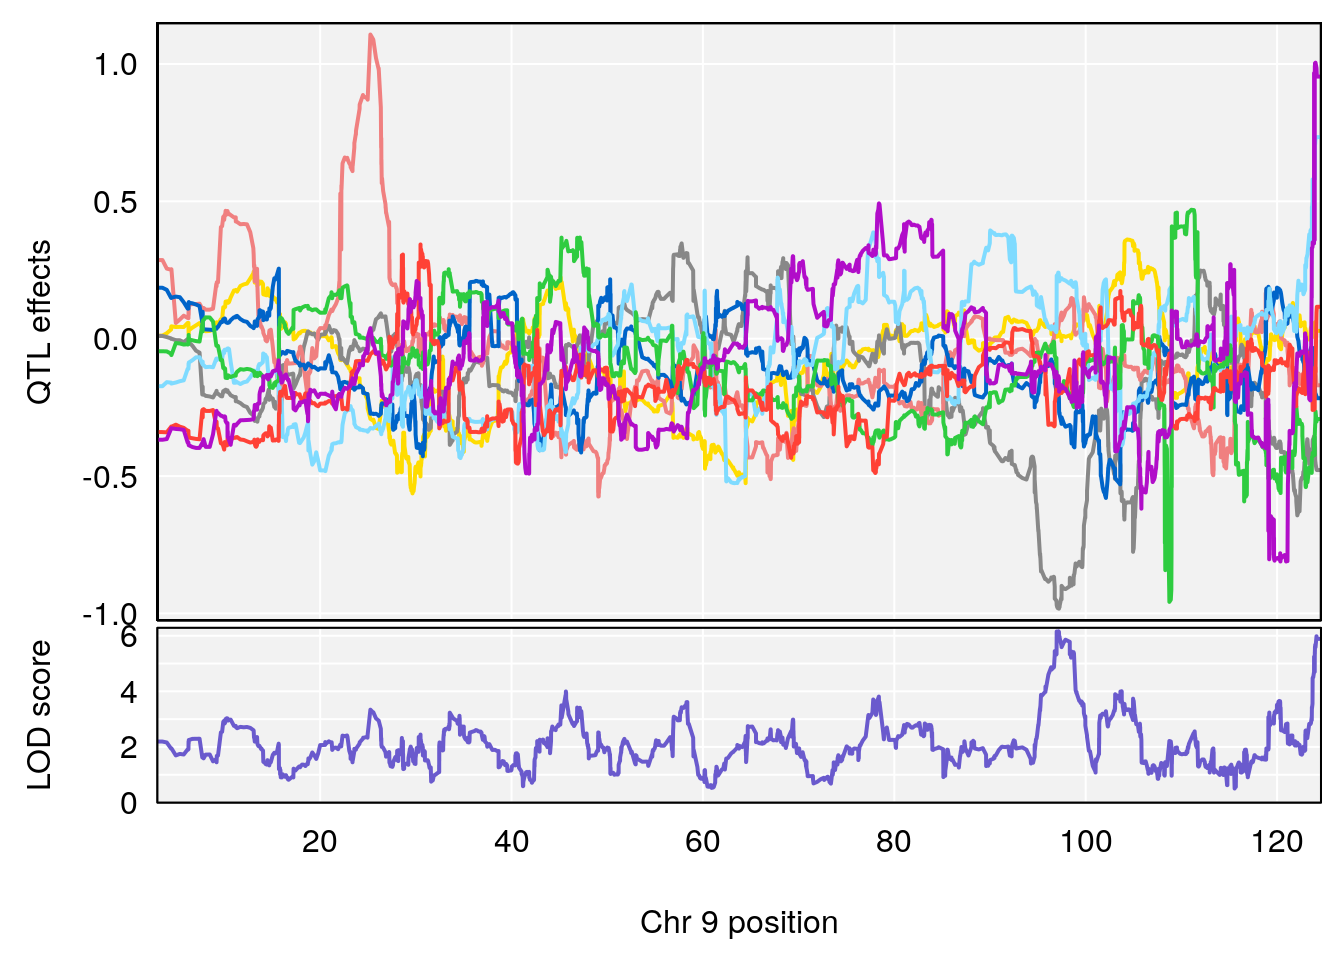
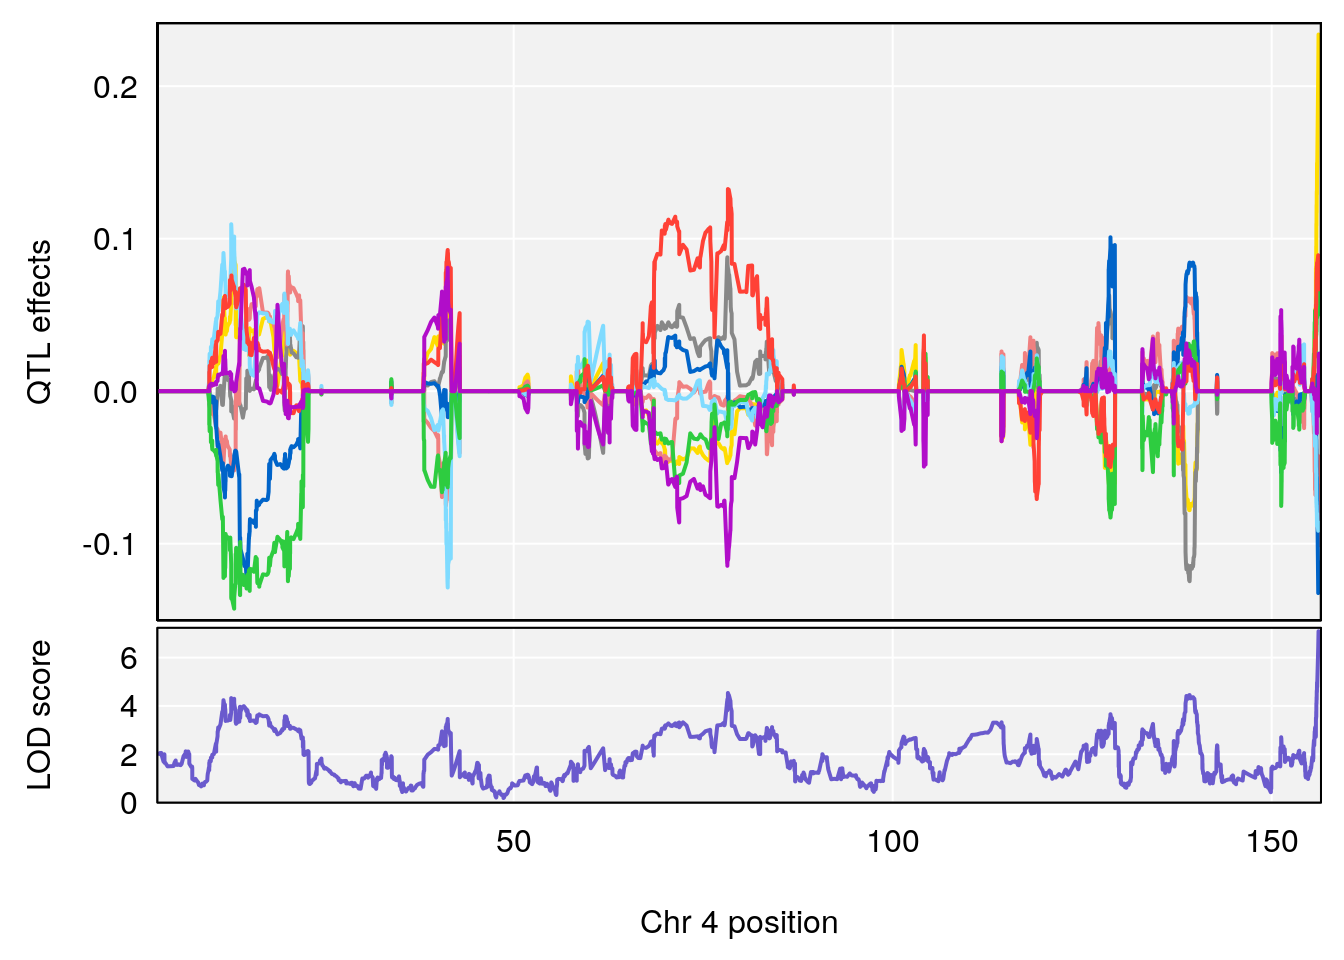
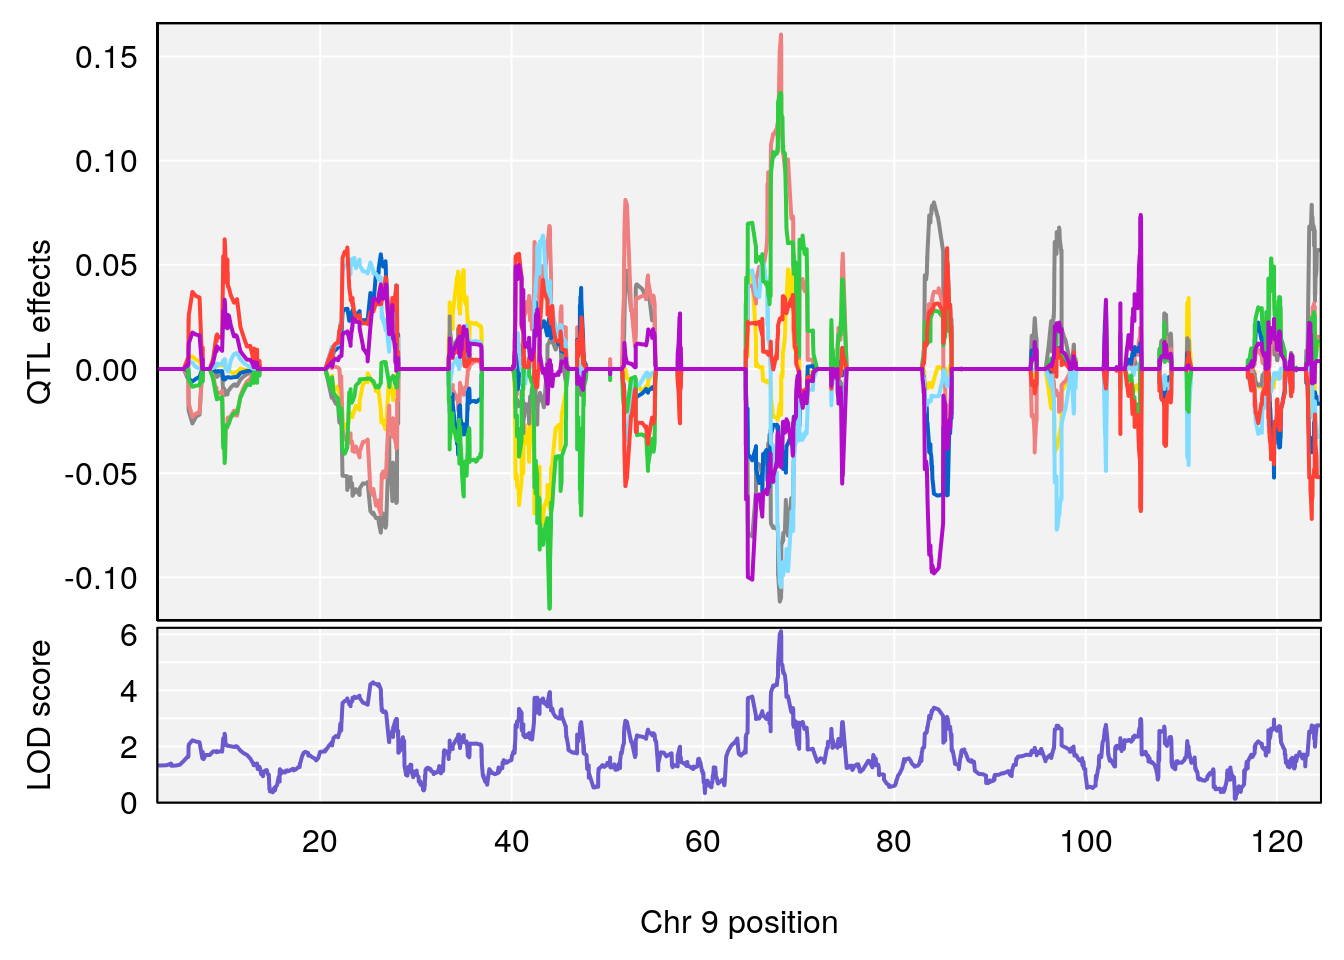
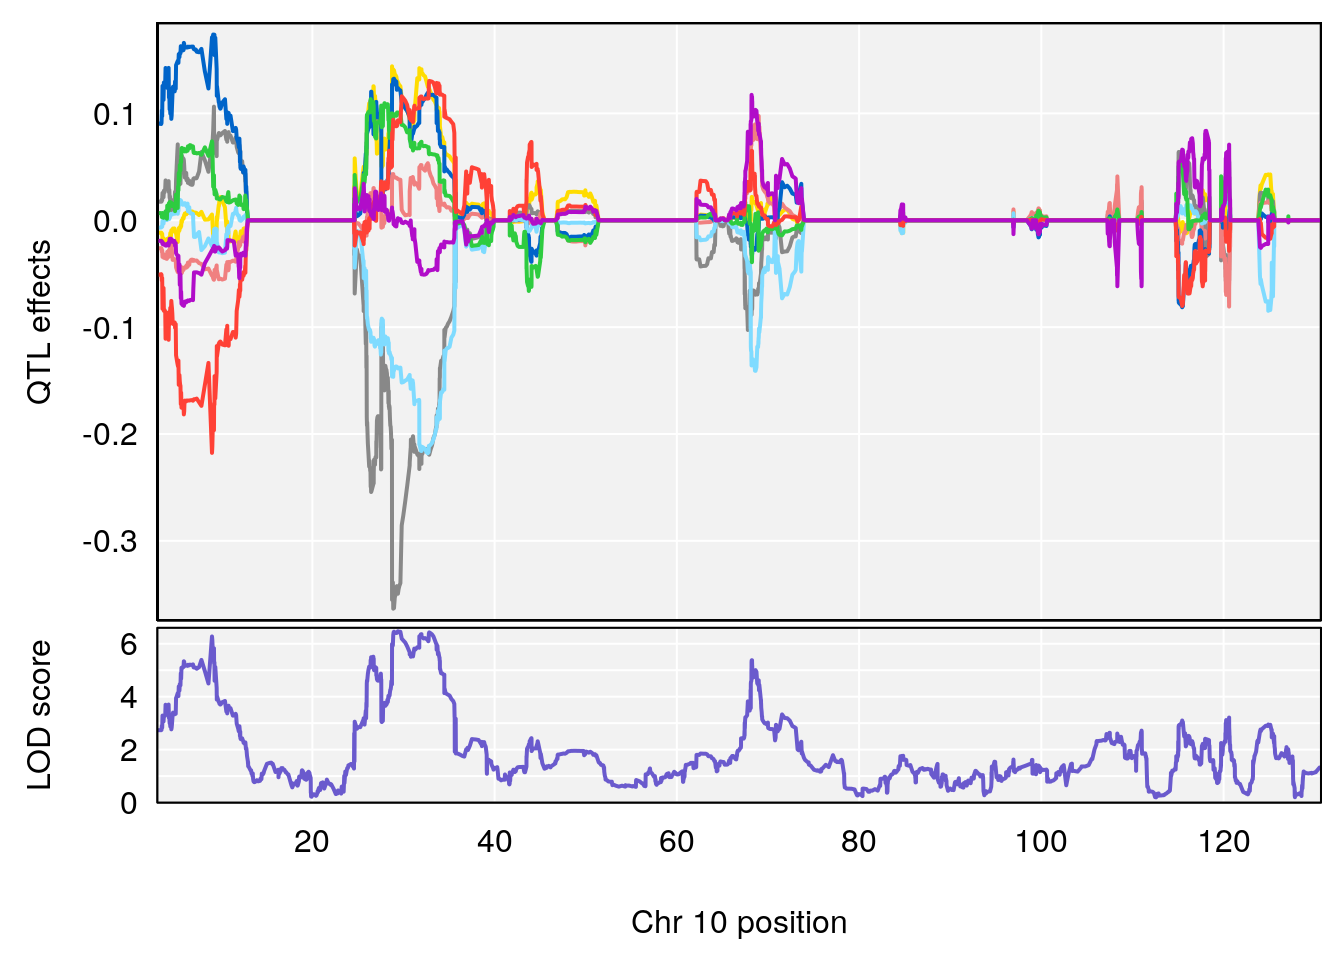
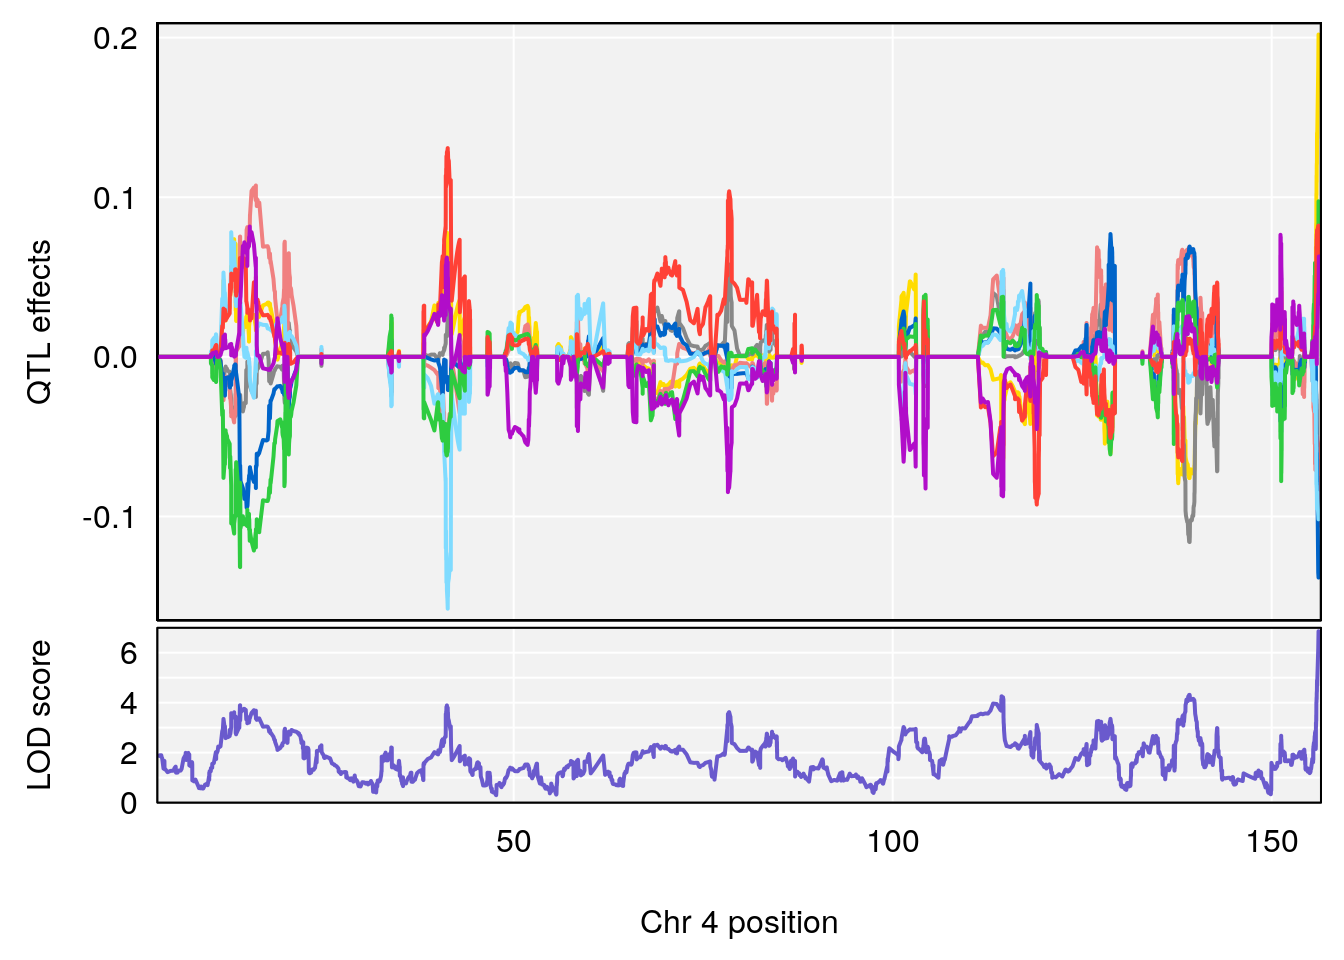
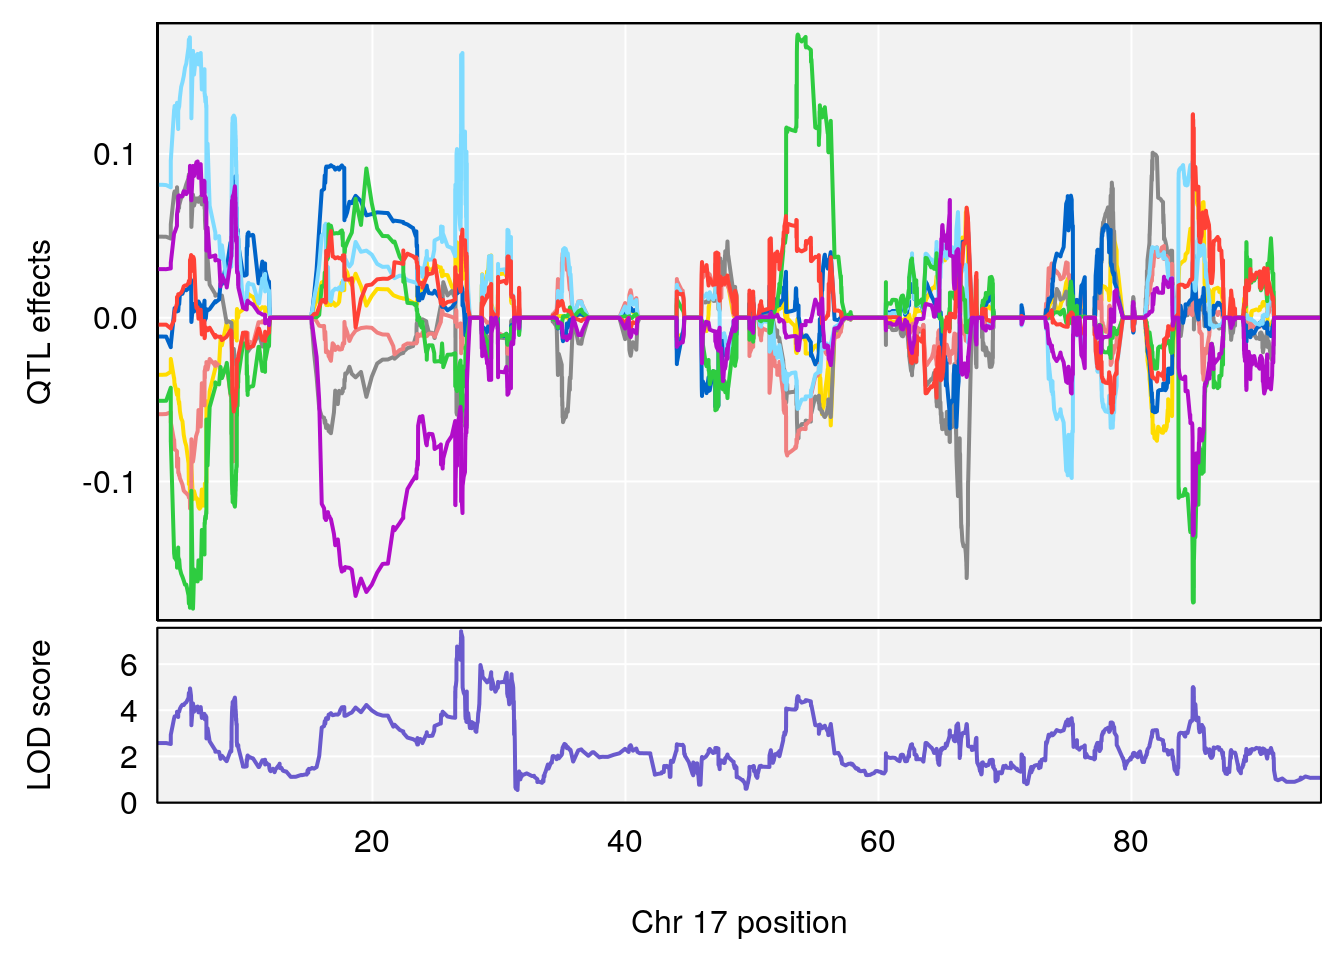
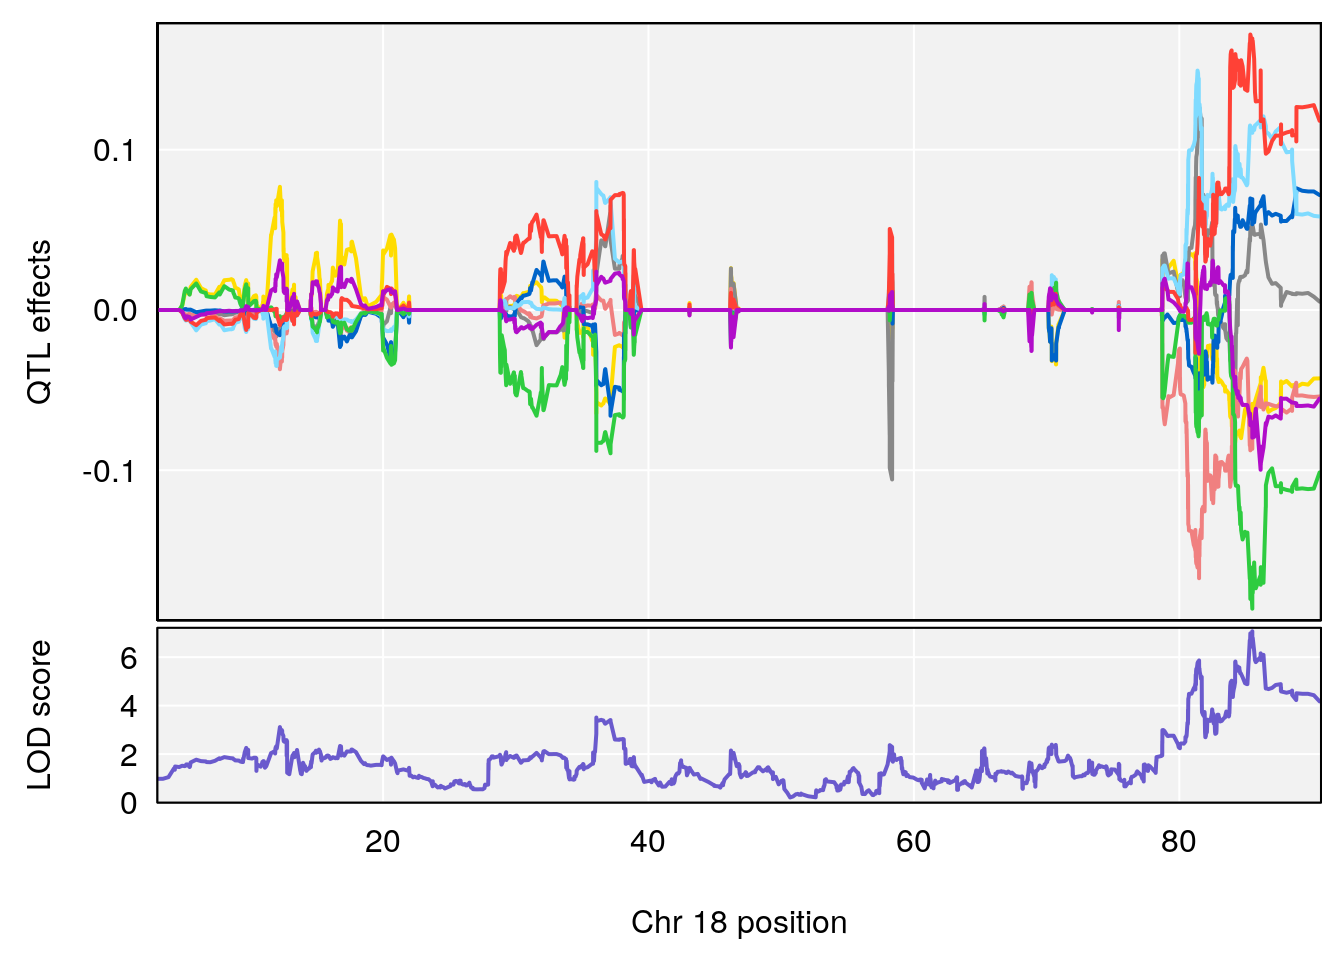
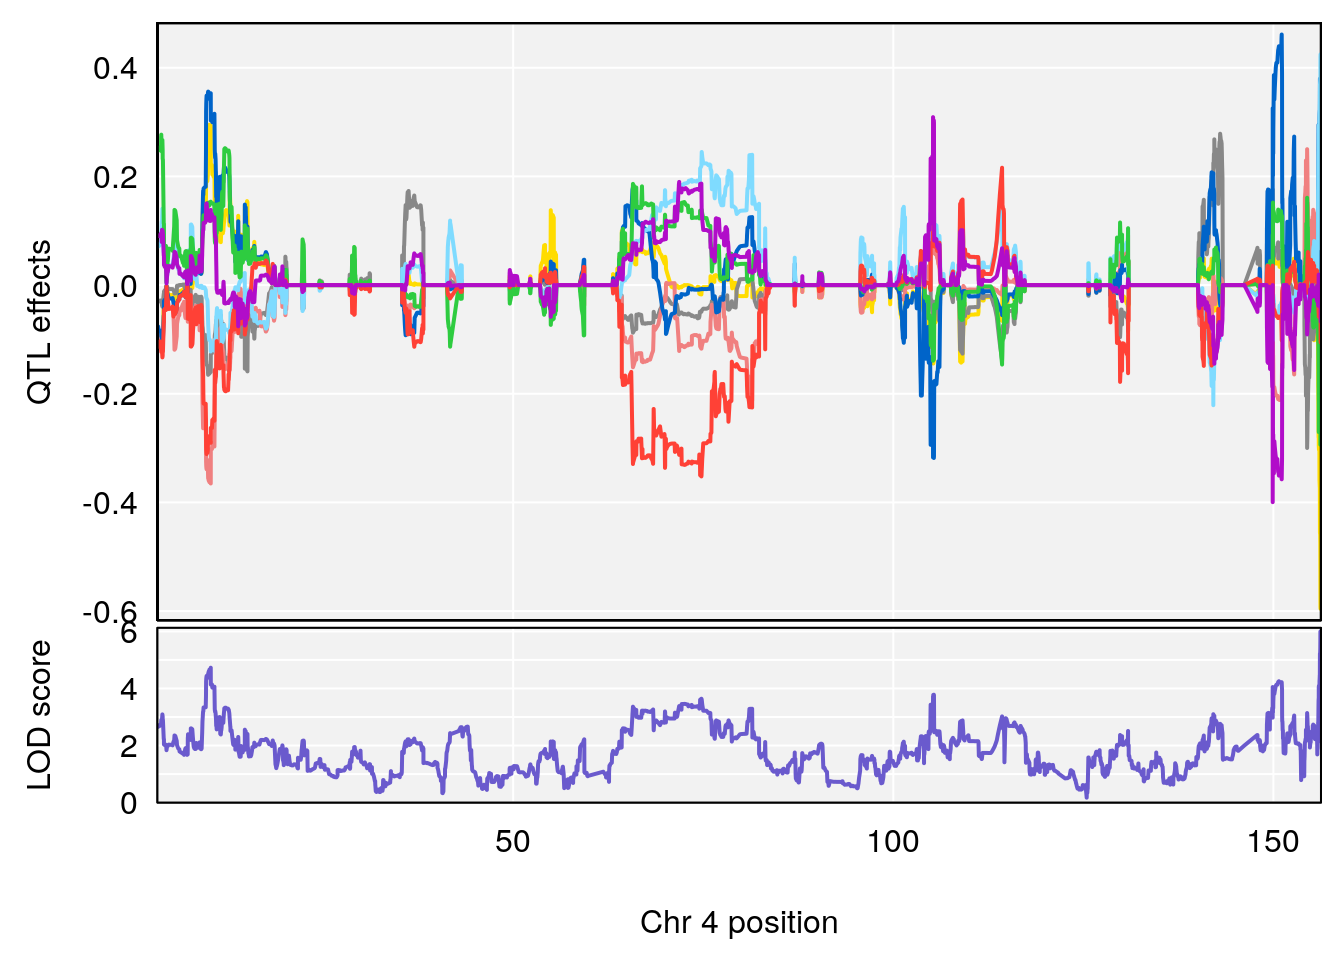
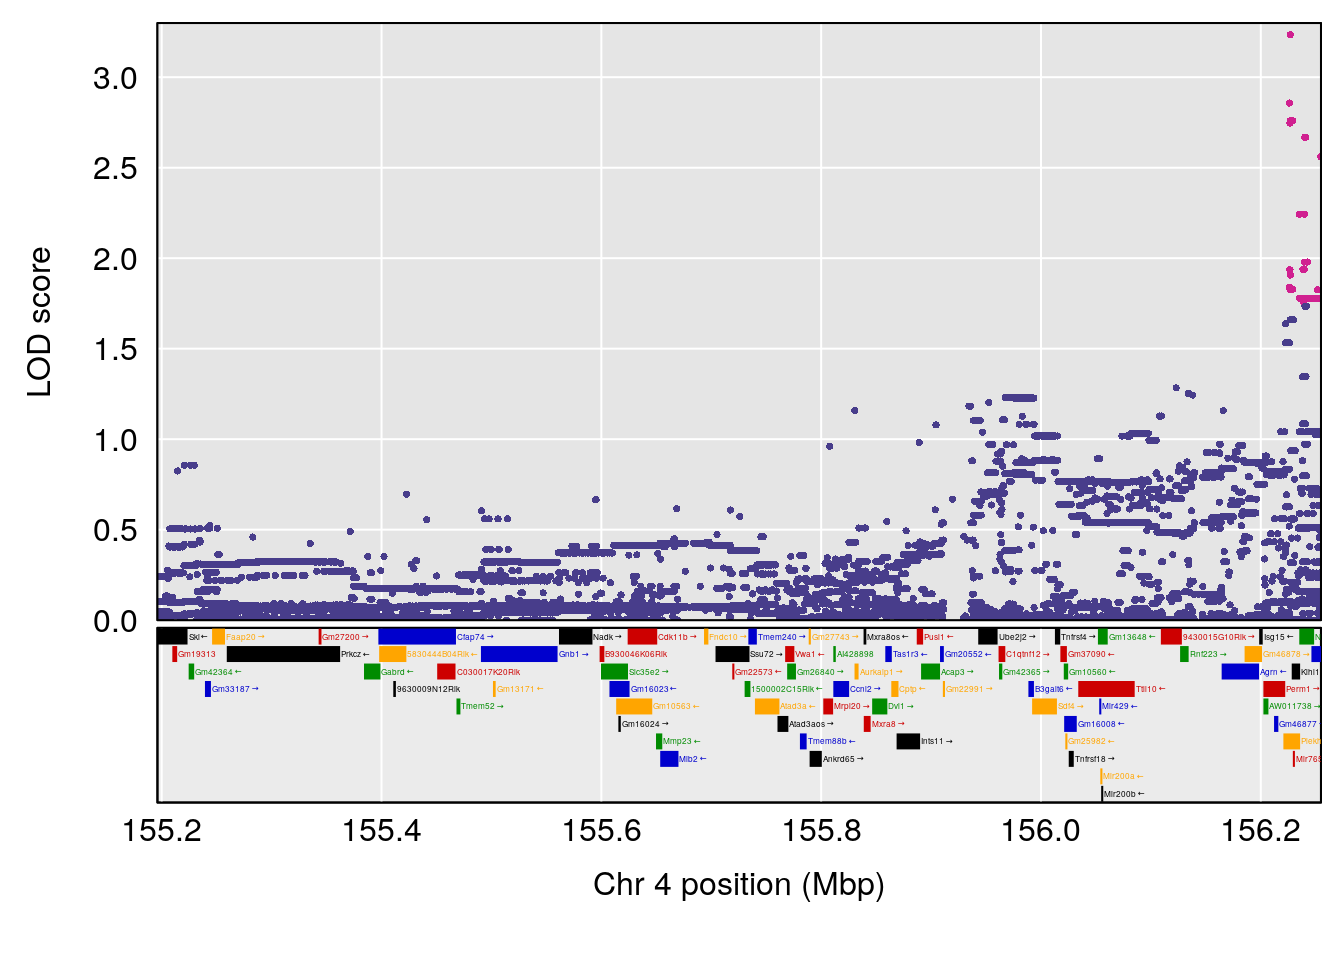
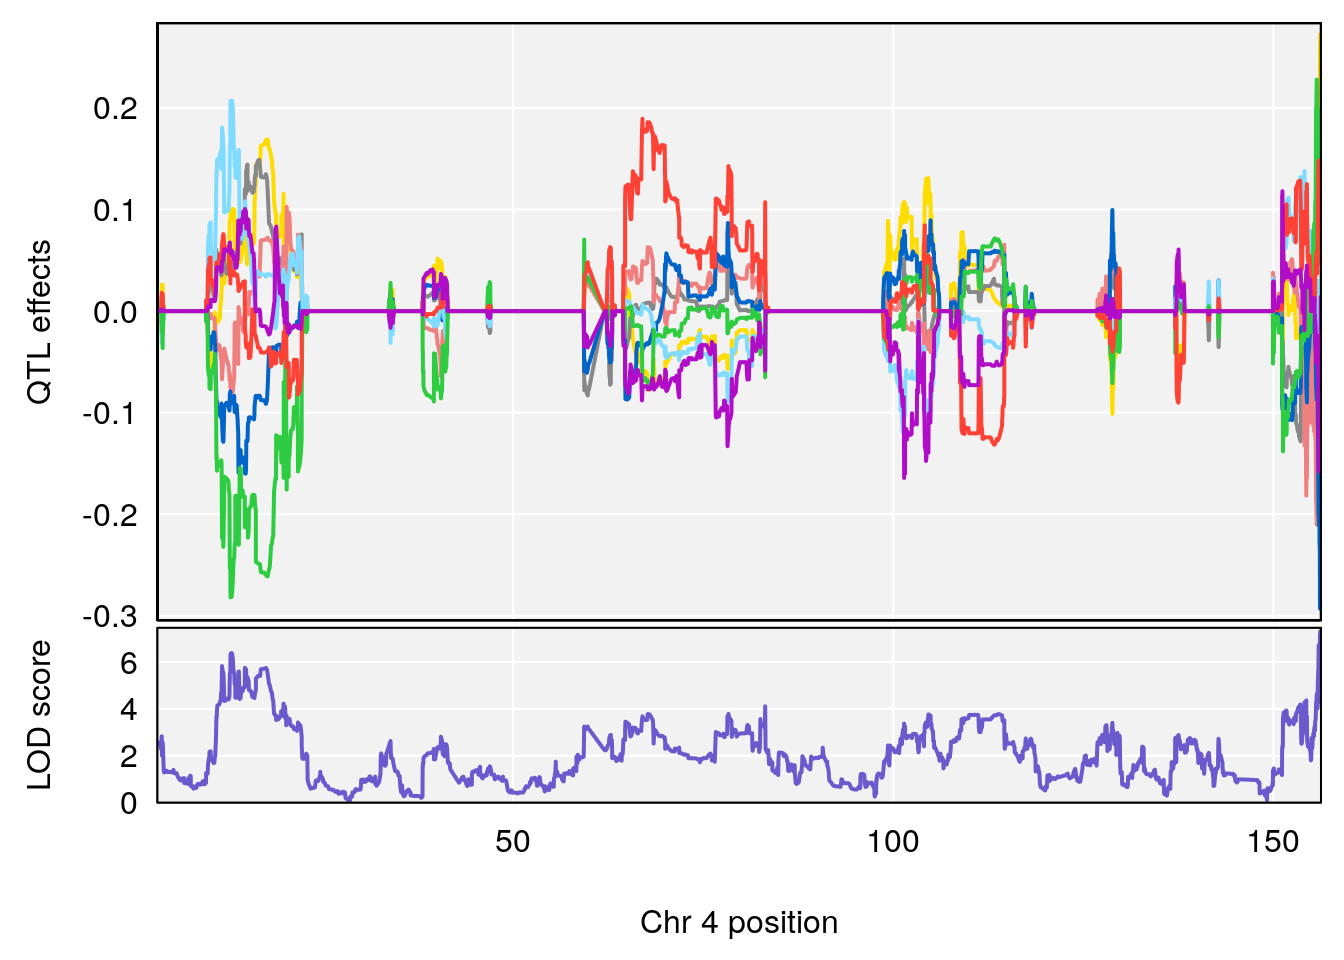
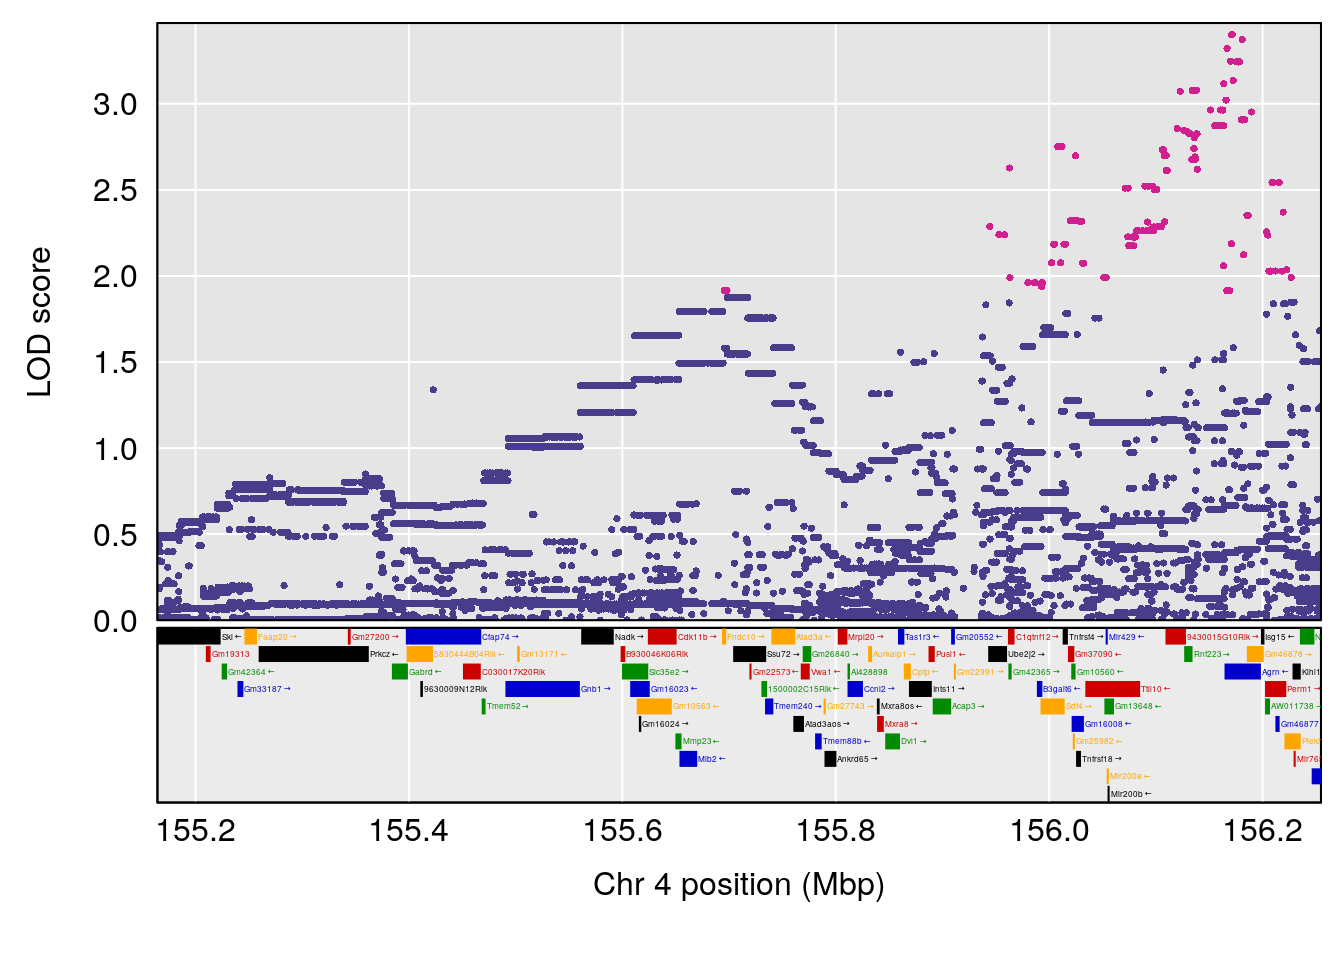
# [1] "Status_bin"
# lodindex lodcolumn chr pos lod ci_lo ci_hi
# 1 1 pheno1 4 156.17629 7.090528 156.009474 156.49607
# 2 1 pheno1 9 68.16325 6.104652 67.850302 68.56932
# 3 1 pheno1 10 29.38717 6.470057 5.600518 68.73517
# 4 1 pheno1 12 108.10231 6.730559 25.430755 109.67503
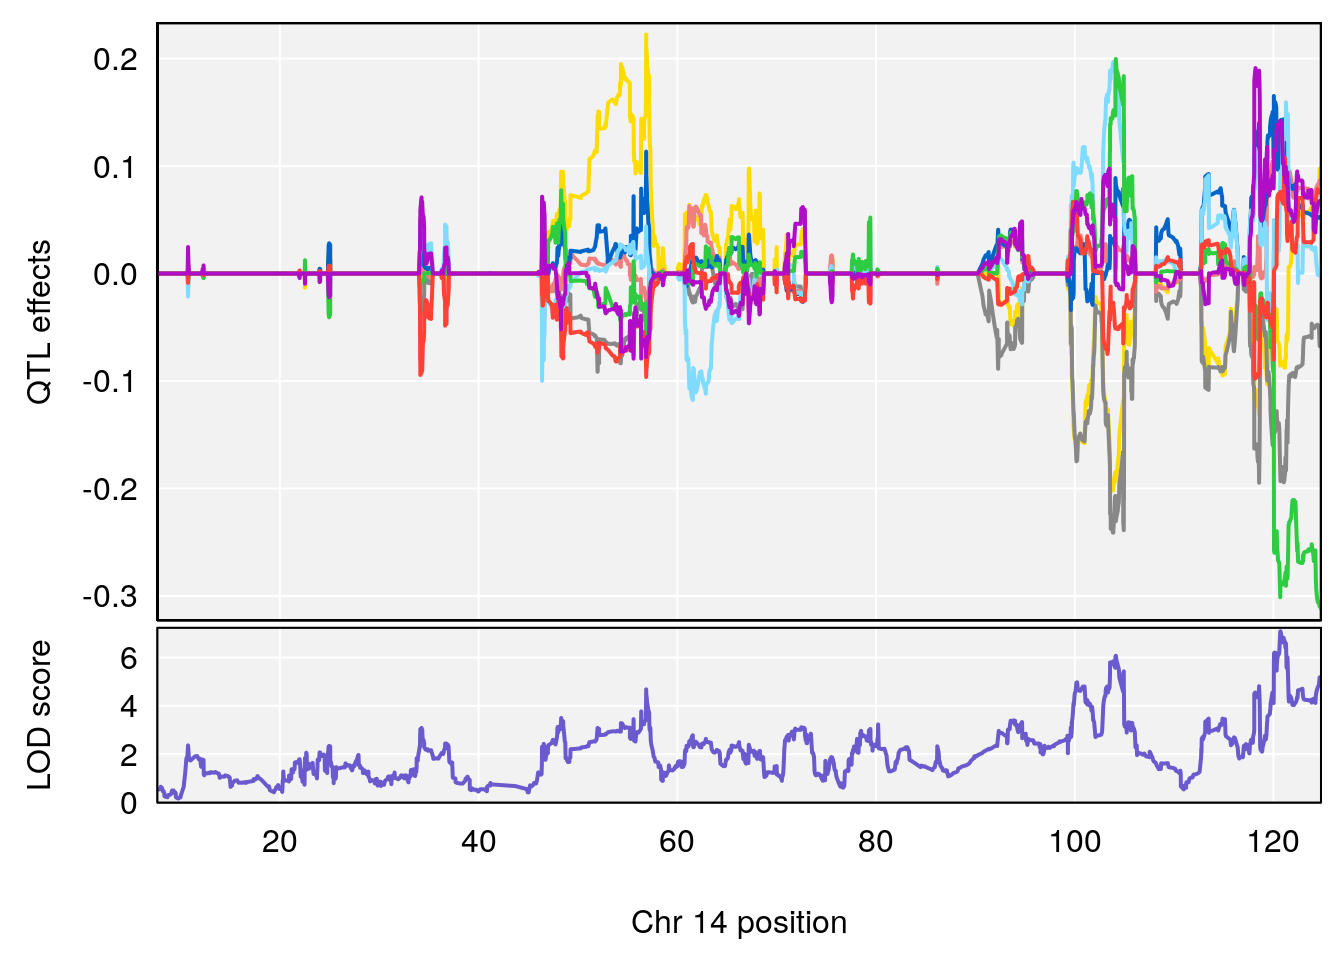
# 5 1 pheno1 14 120.28595 6.208071 104.068913 121.29650
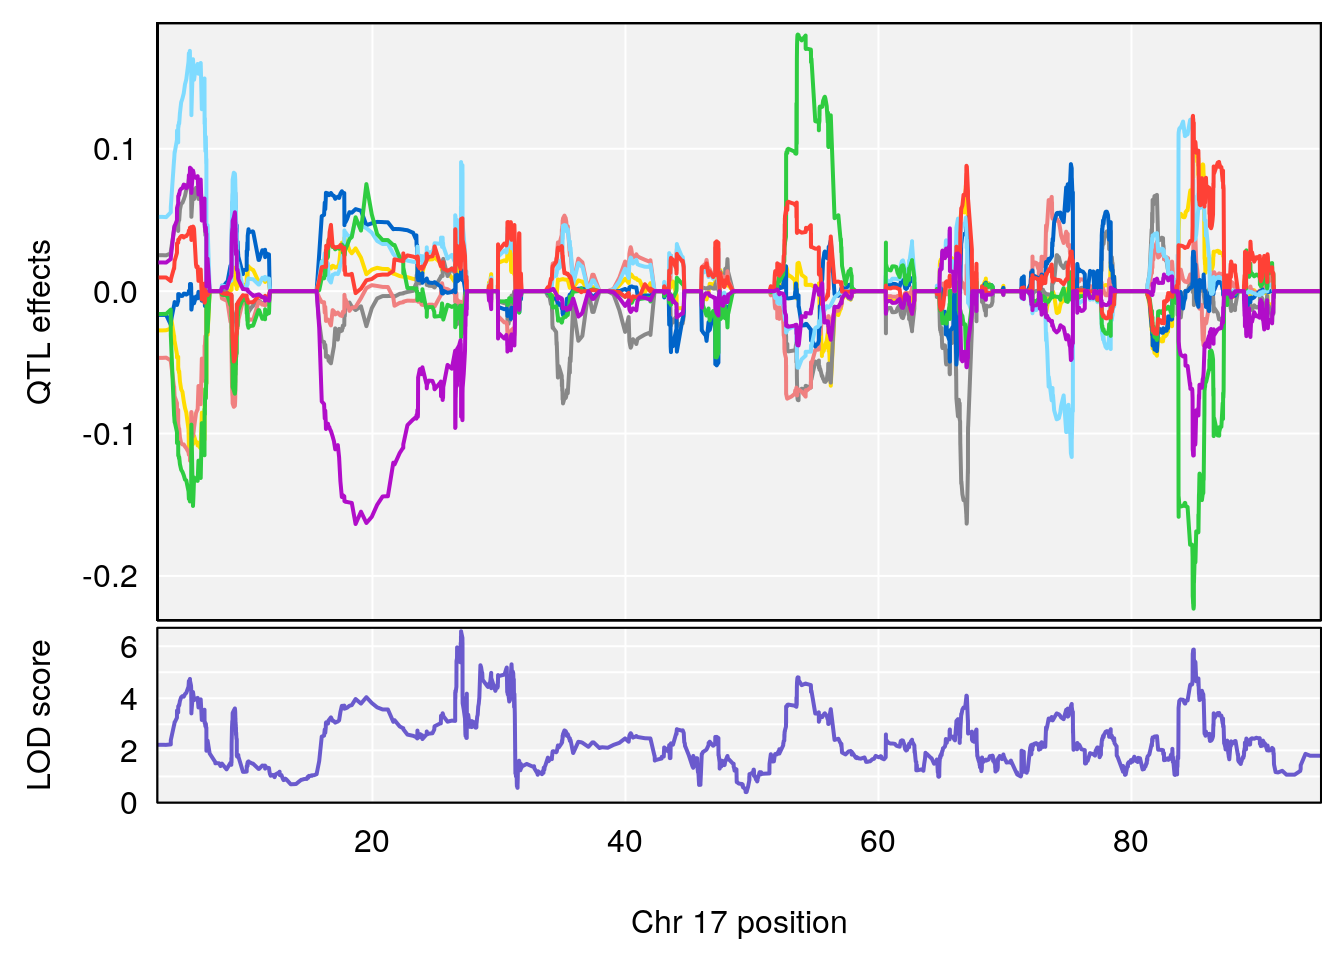
# 6 1 pheno1 17 27.00602 6.571641 26.634222 85.12396
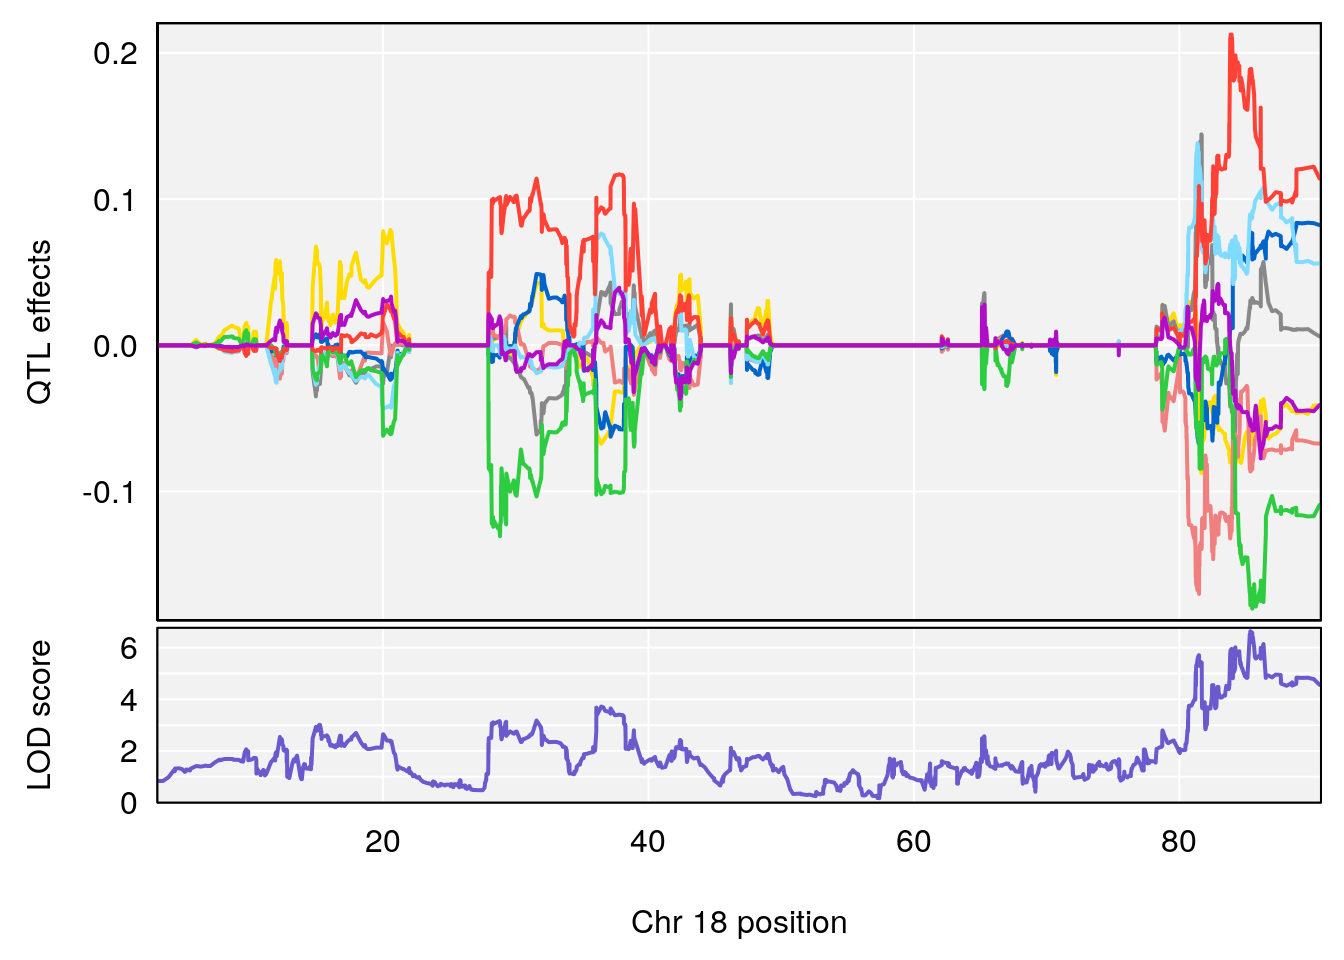
# 7 1 pheno1 18 85.35144 6.635902 81.255418 86.51269
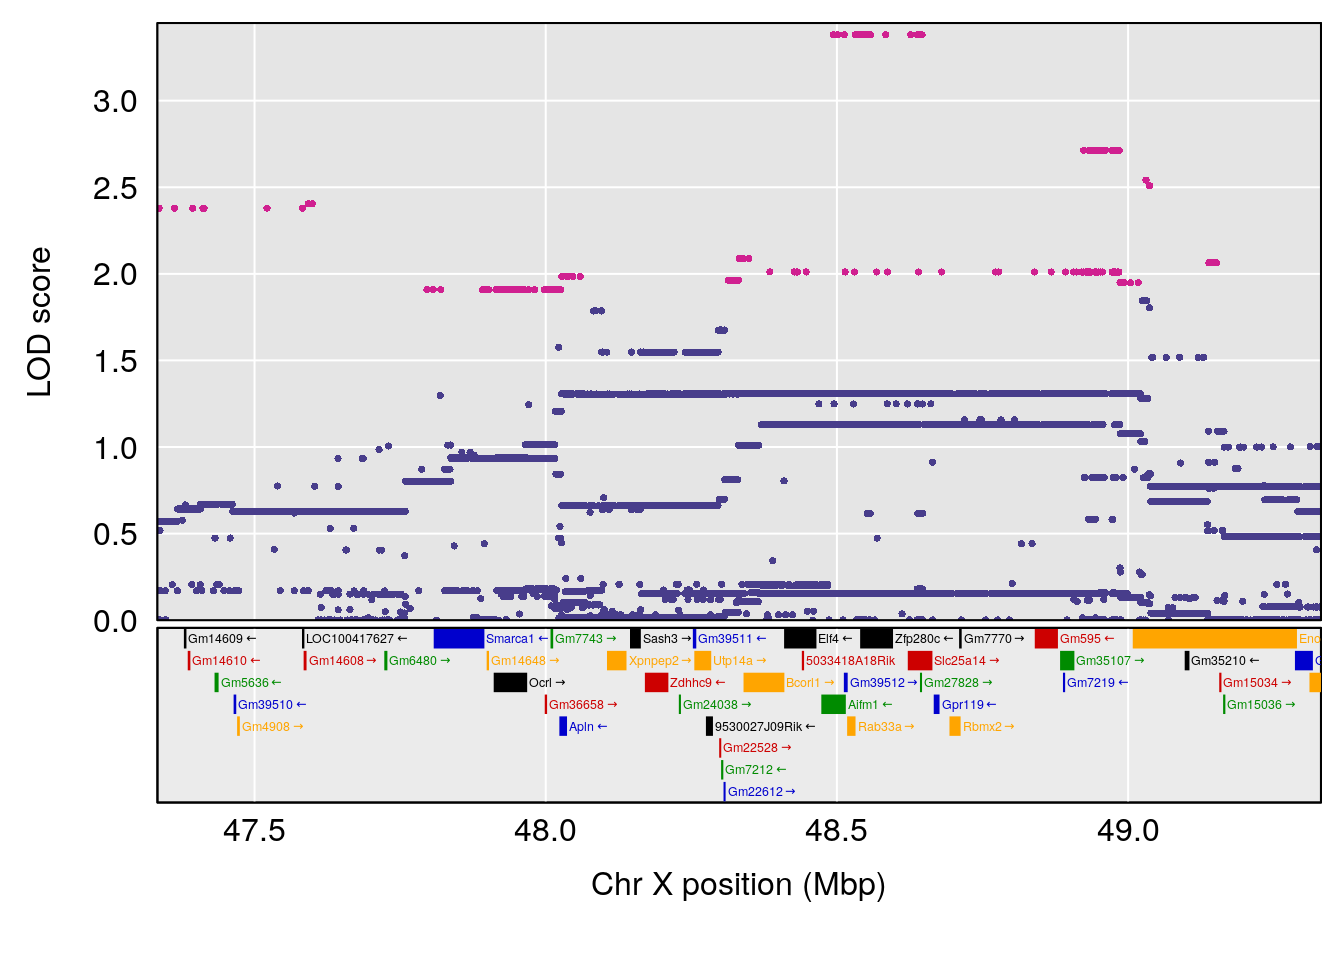
# 8 1 pheno1 X 144.48572 7.929565 143.604522 145.79861
# [1] 1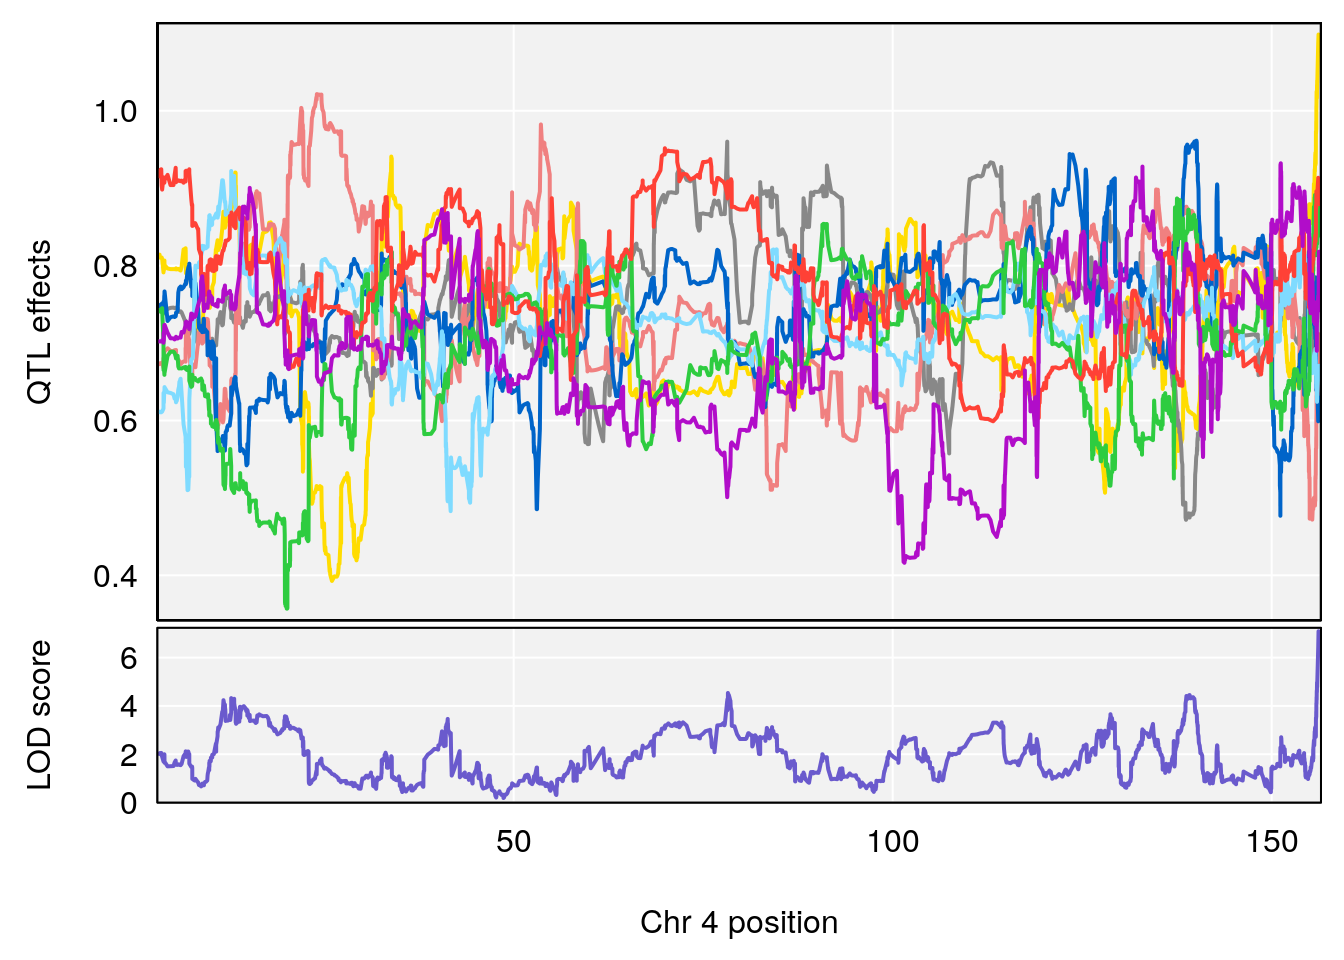
# [1] 2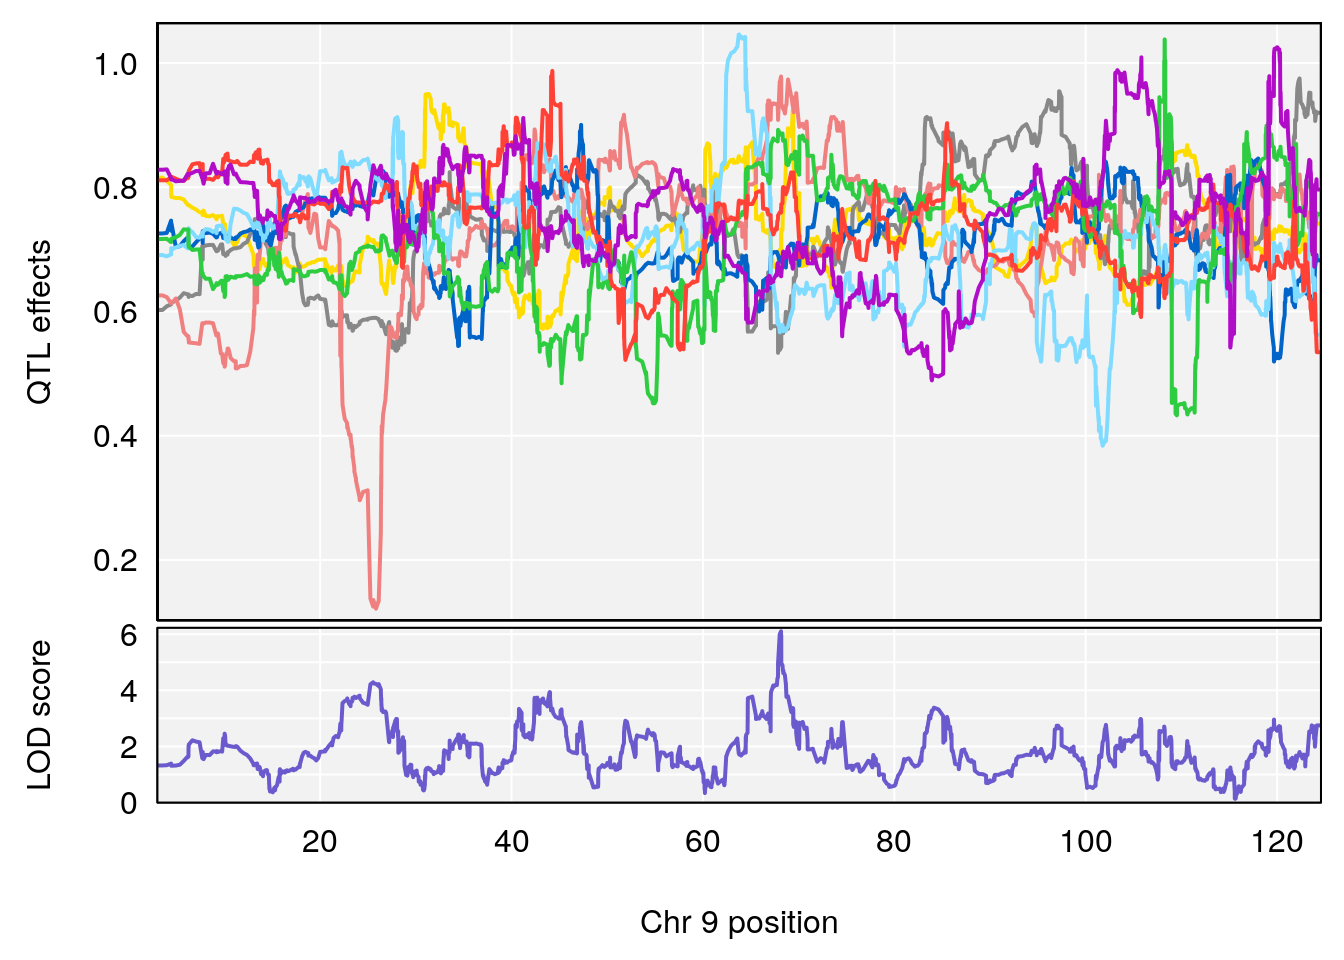
# [1] 3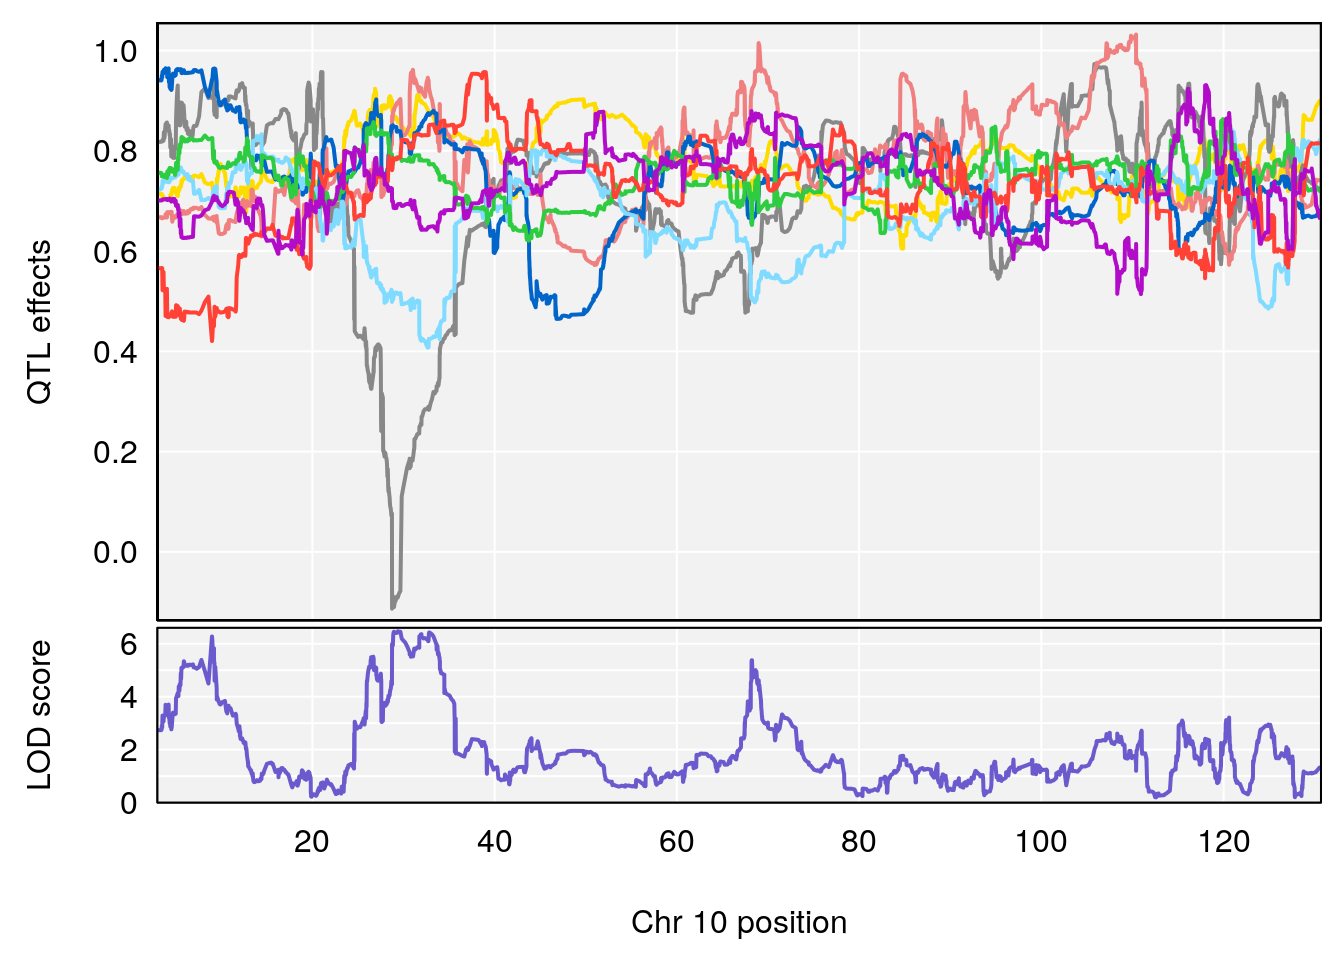
# [1] 4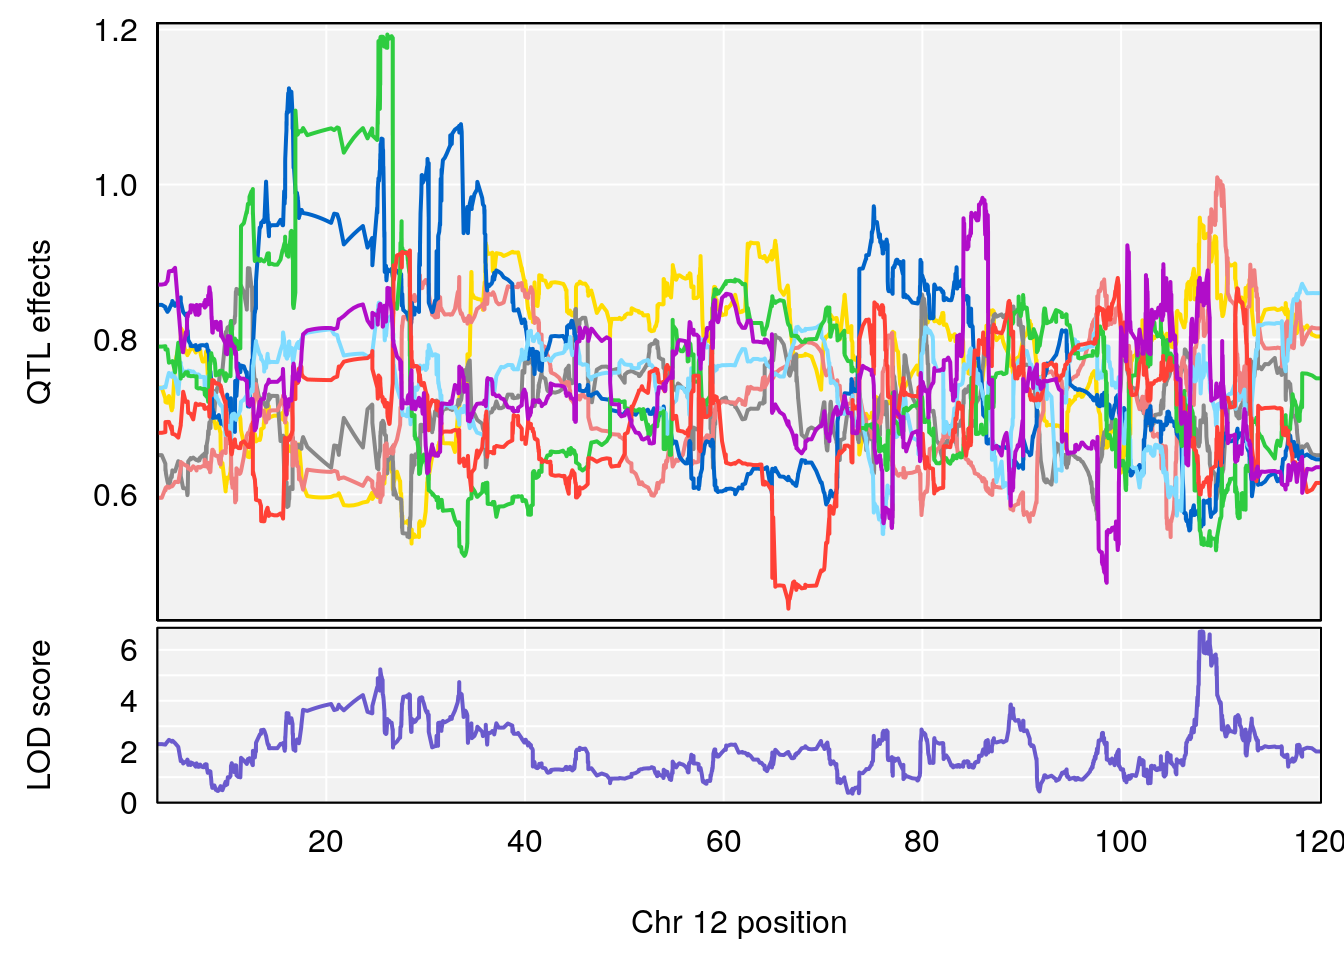
# [1] 5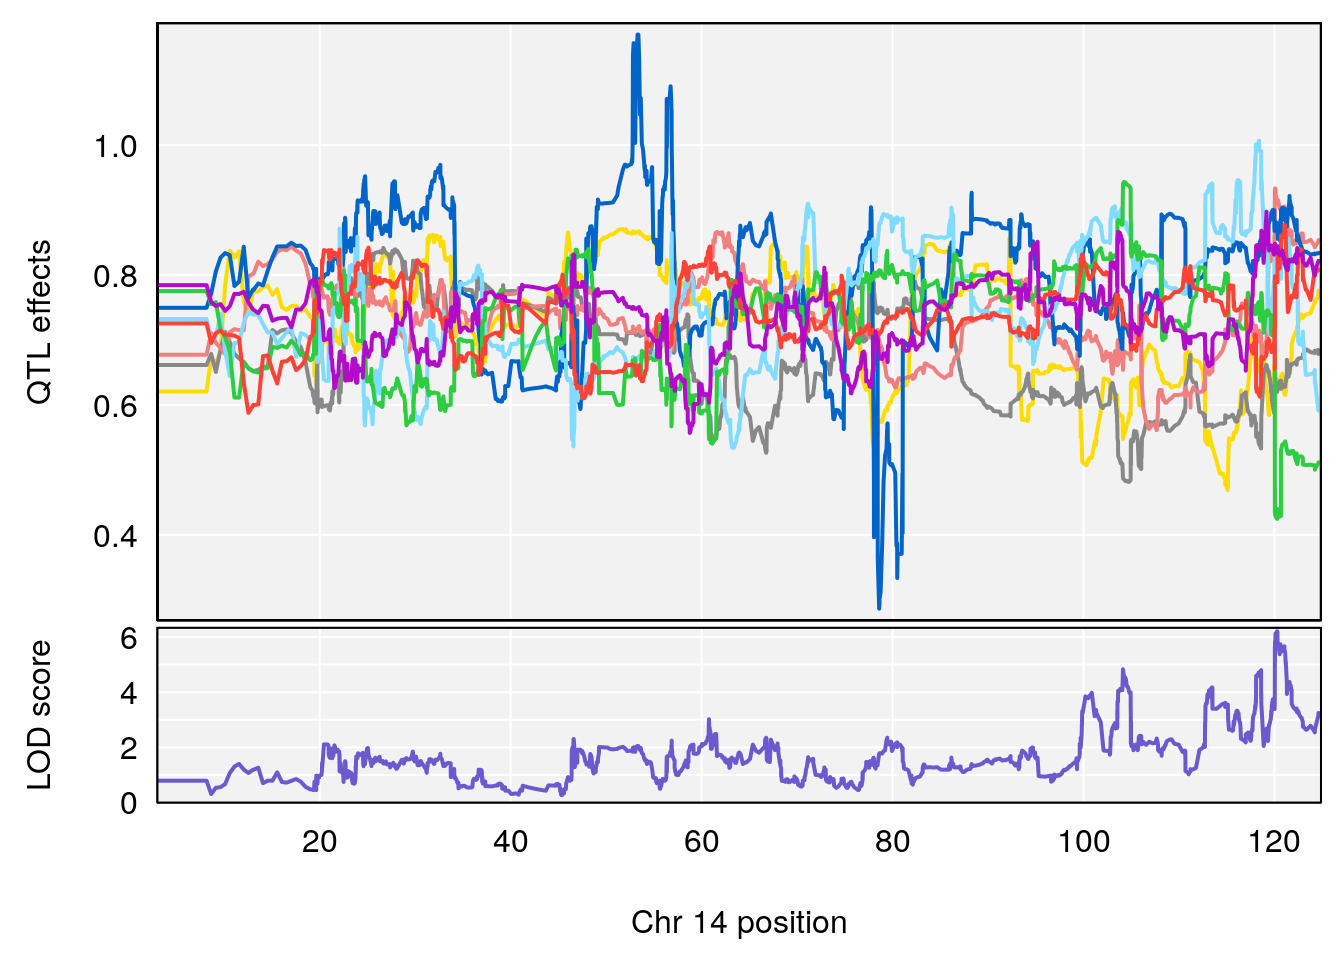
# [1] 6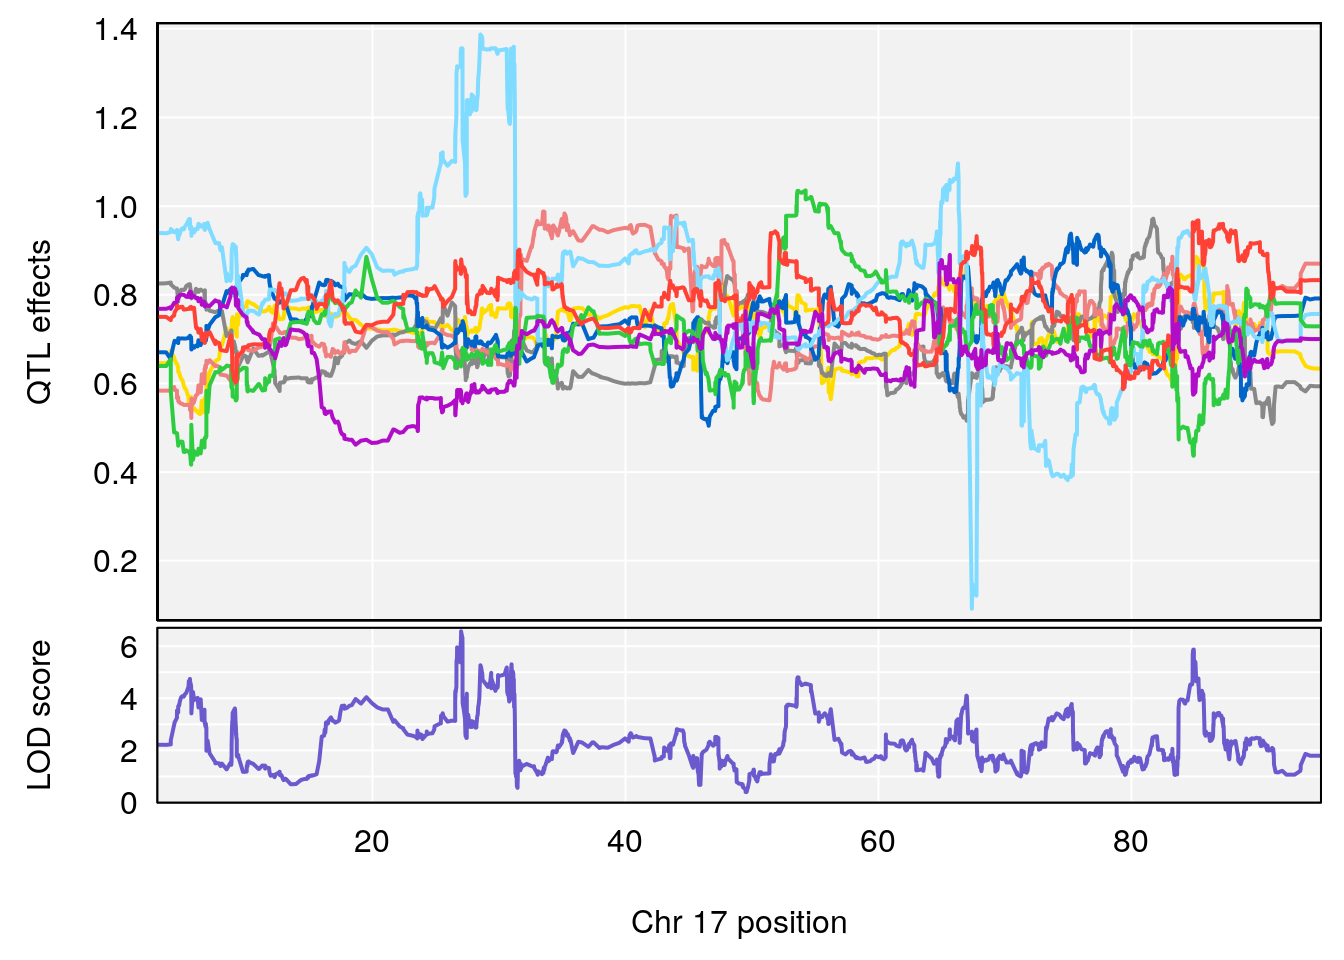
# [1] 7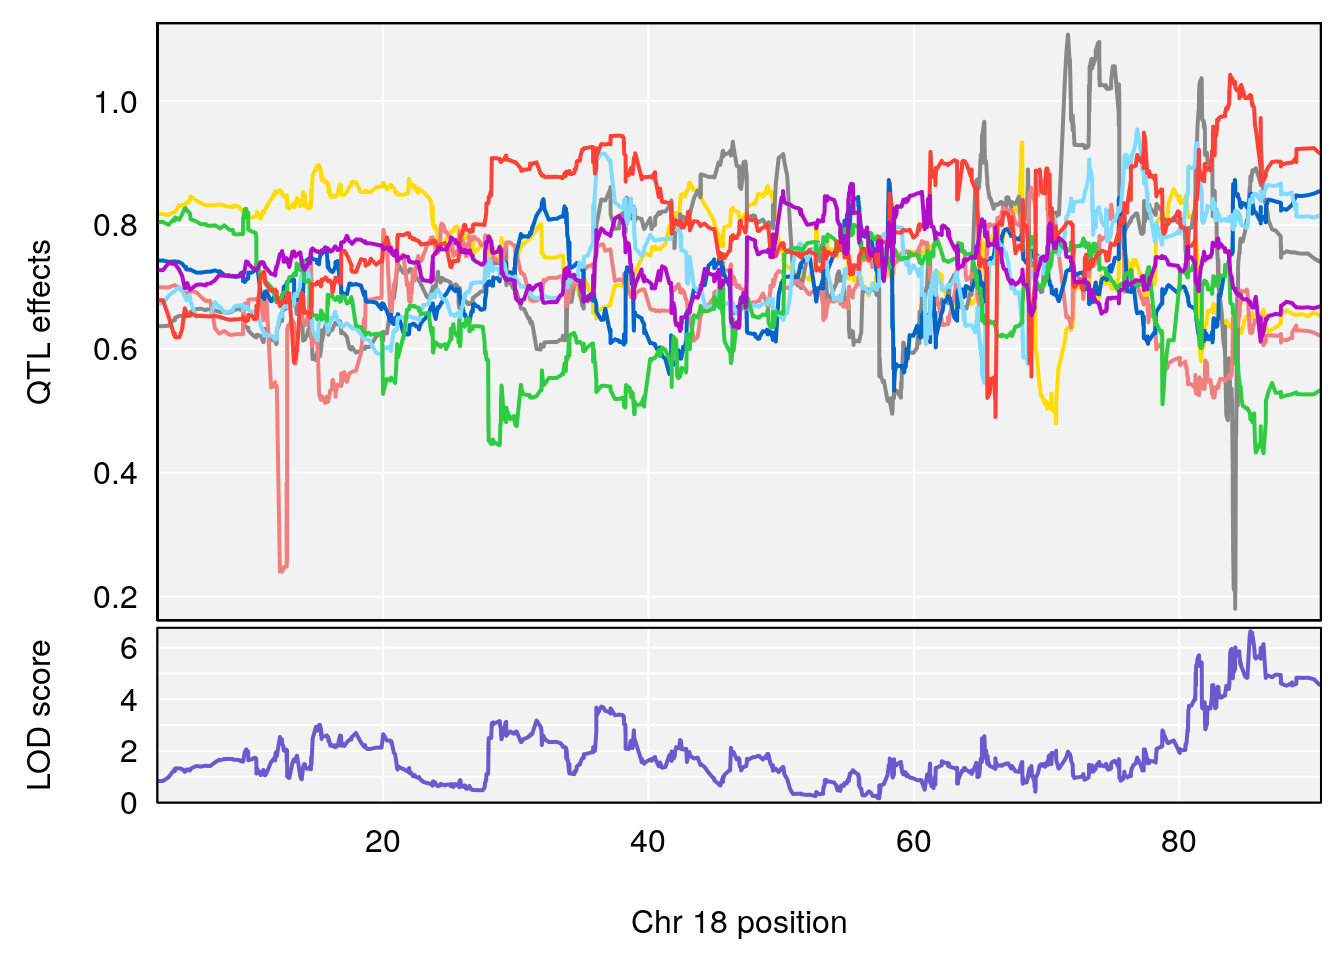
# [1] 8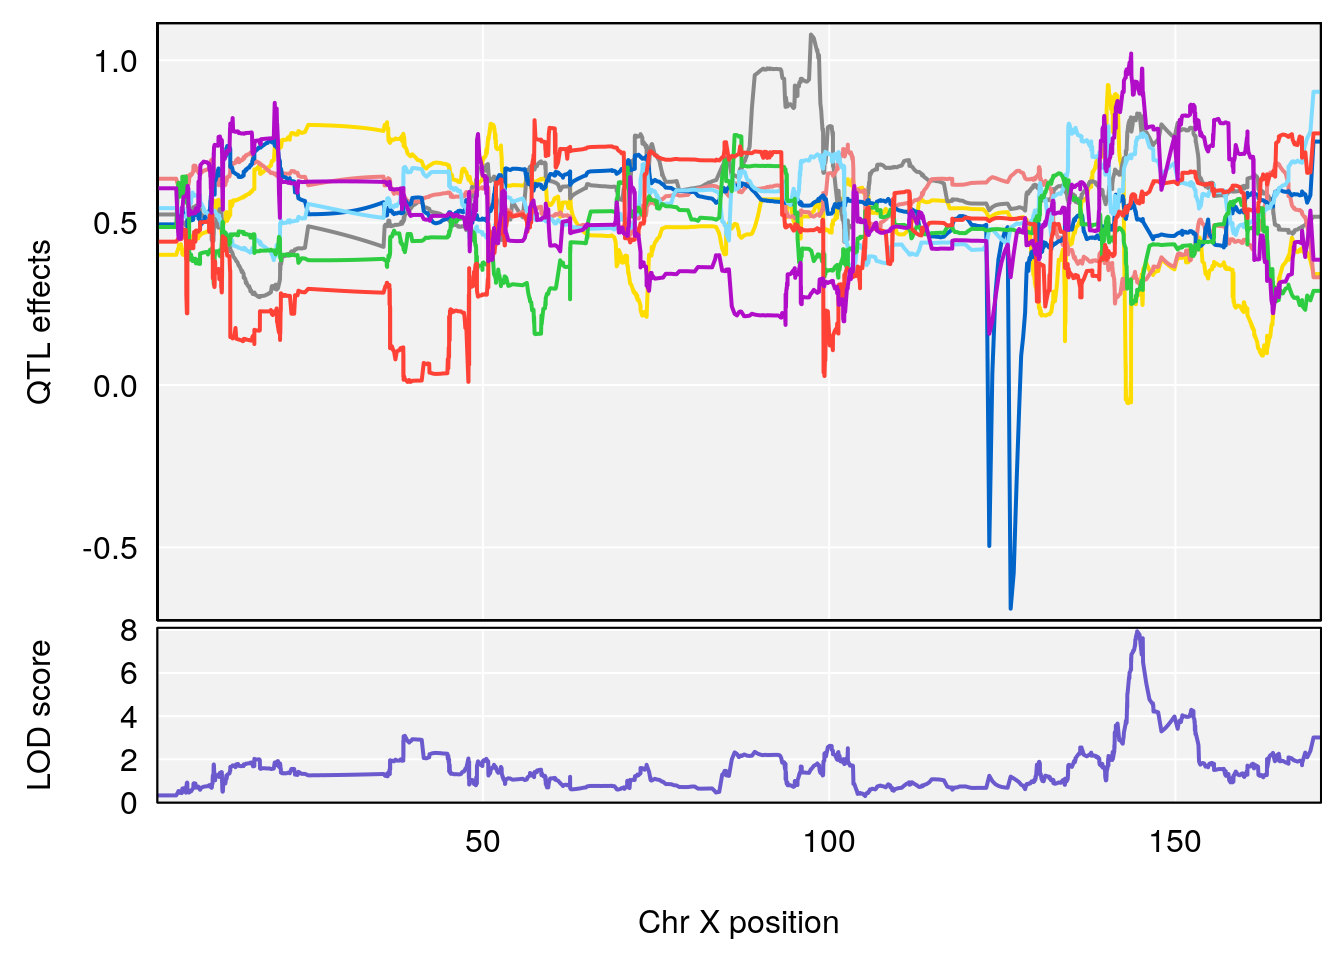
#save peaks coeff plot
for(i in names(qtl.morphine.out)){
print(i)
peaks <- find_peaks(qtl.morphine.out[[i]], map=pmap, threshold=6, drop=1.5)
fname <- paste("output/DO_morphine_secondbatch_",i,"_coefplot.pdf",sep="")
pdf(file = fname, width = 16, height =8)
for(p in 1:dim(peaks)[1]) {
print(p)
chr <-peaks[p,3]
#coeff plot
par(mar=c(4.1, 4.1, 0.6, 0.6))
plot_coefCC(coef_c1[[i]][[p]], pmap[chr], scan1_output=qtl.morphine.out[[i]], bgcolor="gray95", legend=NULL)
}
dev.off()
}
# [1] "Survival.Time"
# [1] 1
# [1] 2
# [1] 3
# [1] "Recovery.Time"
# [1] 1
# [1] 2
# [1] "Min.depression"
# [1] 1
# [1] "Status_bin"
# [1] 1
# [1] 2
# [1] 3
# [1] 4
# [1] 5
# [1] 6
# [1] 7
# [1] 8
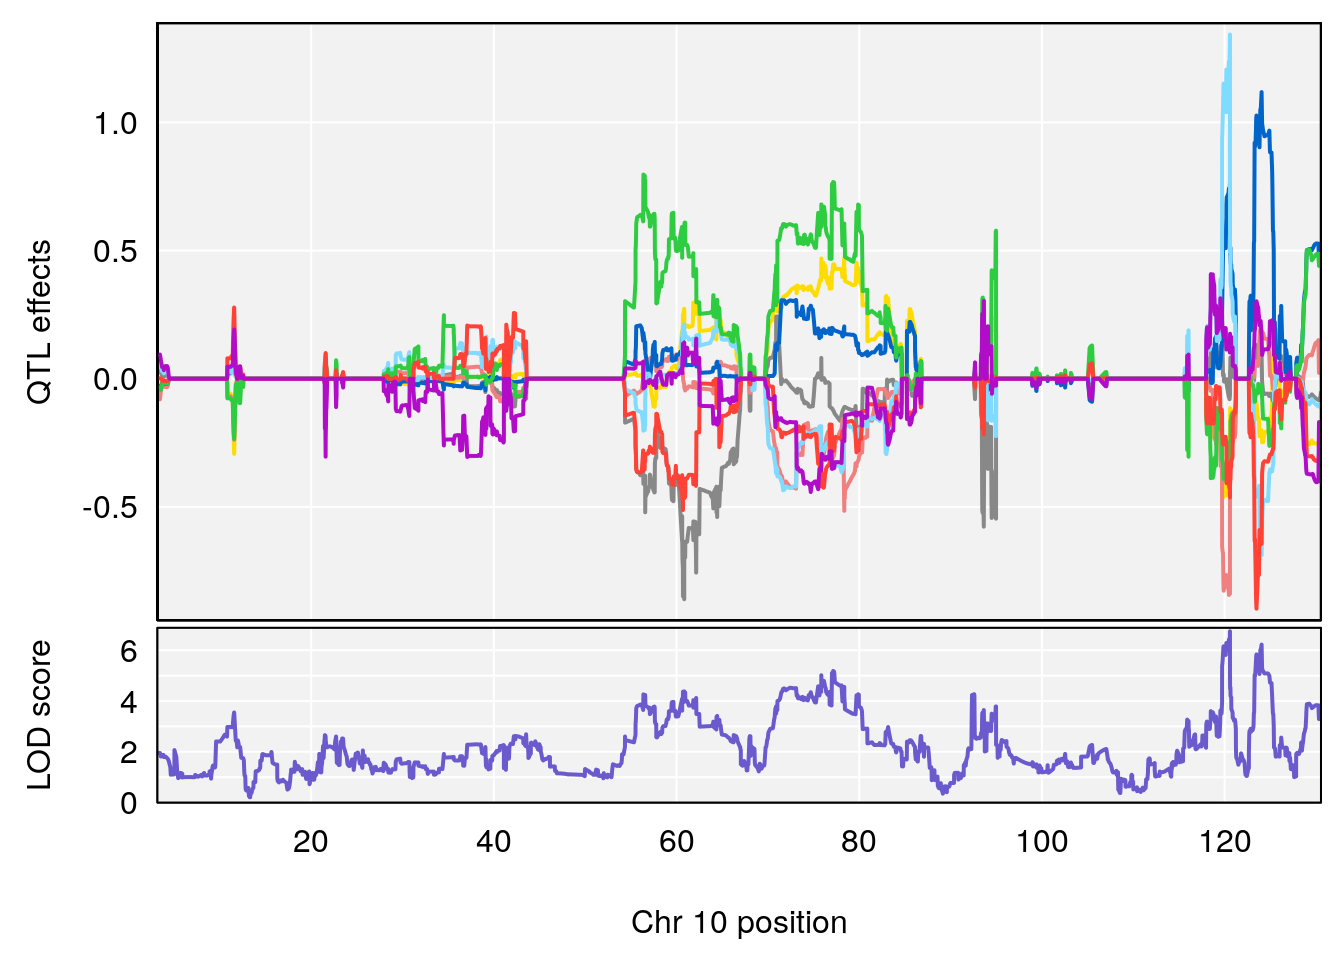
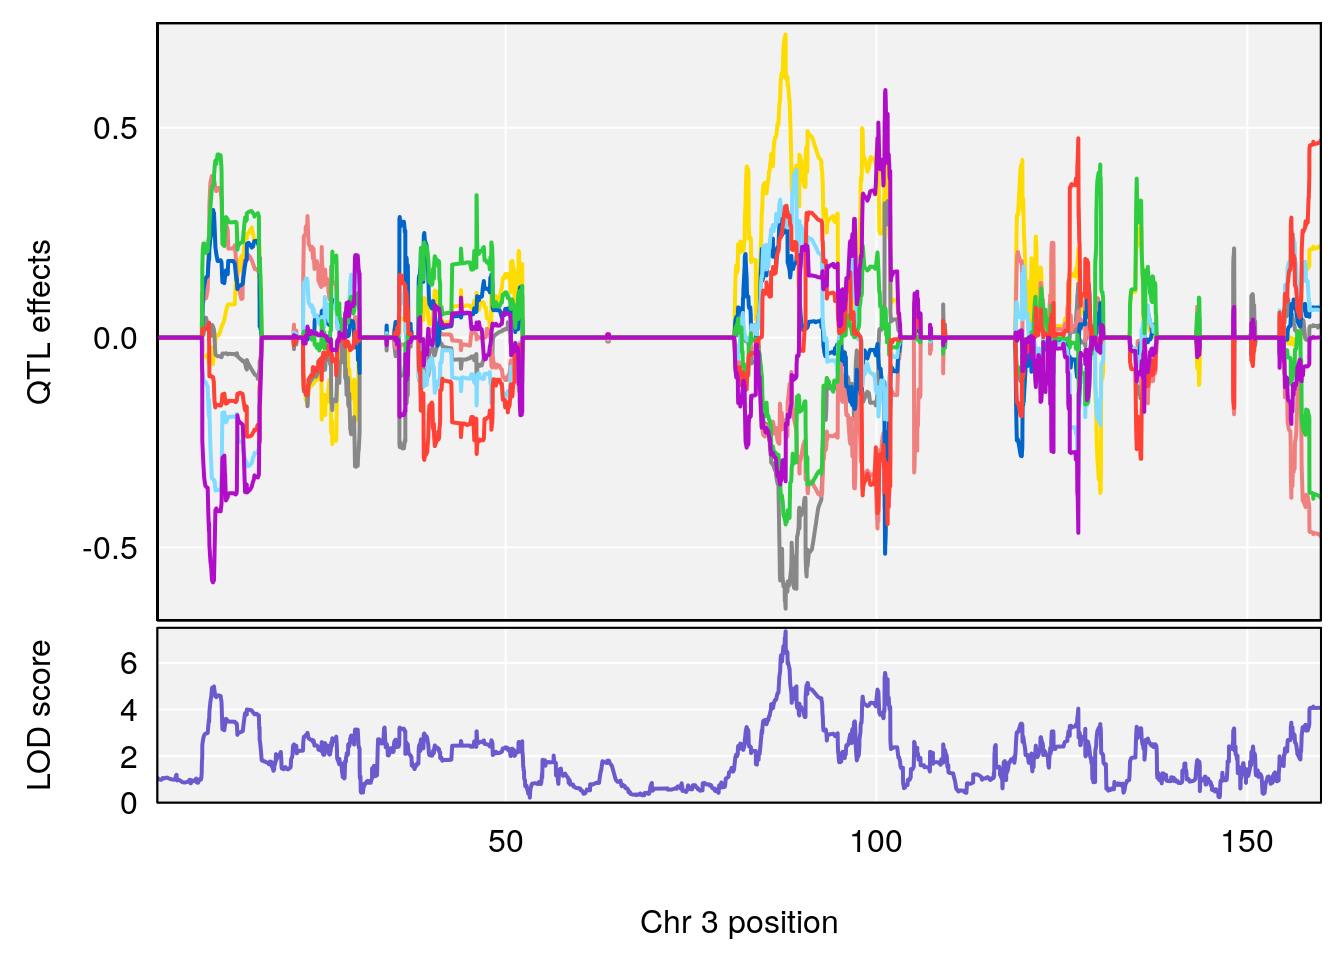
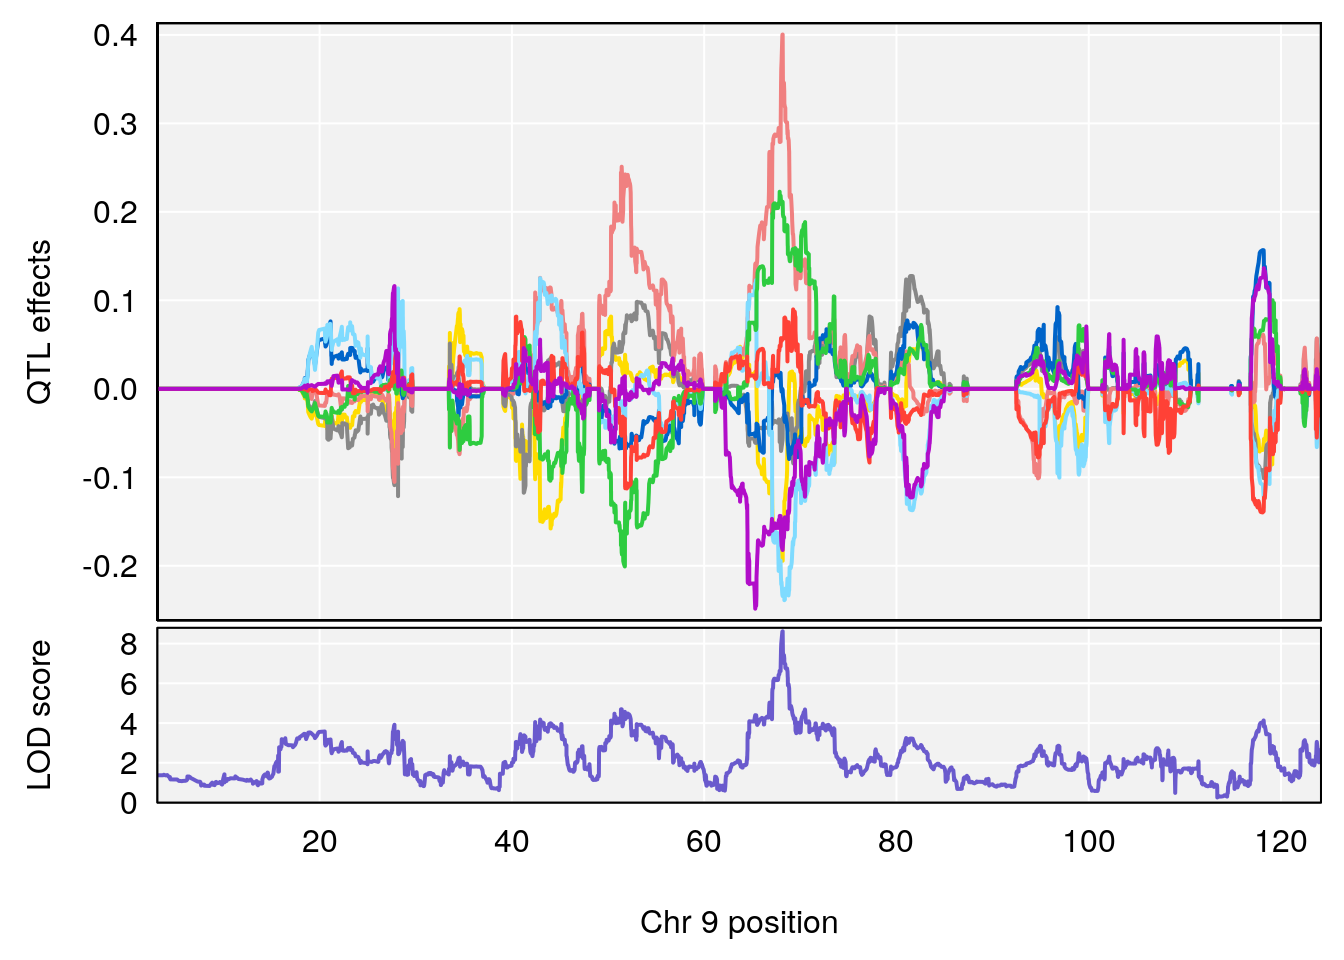
#save peaks coeff blup plot
for(i in names(qtl.morphine.out)){
print(i)
peaks <- find_peaks(qtl.morphine.out[[i]], map=pmap, threshold=6, drop=1.5)
fname <- paste("output/DO_morphine_secondbatch_",i,"_coefplot_blup.pdf",sep="")
pdf(file = fname, width = 16, height =8)
for(p in 1:dim(peaks)[1]) {
print(p)
chr <-peaks[p,3]
#coeff plot
par(mar=c(4.1, 4.1, 0.6, 0.6))
plot_coefCC(coef_c2[[i]][[p]], pmap[chr], scan1_output=qtl.morphine.out[[i]], bgcolor="gray95", legend=NULL)
}
dev.off()
}
# [1] "Survival.Time"
# [1] 1
# [1] 2
# [1] 3
# [1] "Recovery.Time"
# [1] 1
# [1] 2
# [1] "Min.depression"
# [1] 1
# [1] "Status_bin"
# [1] 1
# [1] 2
# [1] 3
# [1] 4
# [1] 5
# [1] 6
# [1] 7
# [1] 8Plot qtl mapping on 69K_m2
Plot by using its output qtl.morphine.69k.out.combined_m2.RData
load("output/qtl.morphine.69k.out.combined_m2.RData")
#pmap and gmap
load("data/69k_grid_pgmap.RData")

#genome-wide plot
for(i in names(qtl.morphine.out)){
  par(mar=c(5.1, 4.1, 1.1, 1.1))
  ymx <- maxlod(qtl.morphine.out[[i]]) # overall maximum LOD score
  plot(qtl.morphine.out[[i]], map=pmap, lodcolumn=1, col="slateblue", ylim=c(0, 10))
  abline(h=summary(qtl.morphine.operm[[i]], alpha=c(0.10, 0.05, 0.01))[[1]], col="red")
  abline(h=summary(qtl.morphine.operm[[i]], alpha=c(0.10, 0.05, 0.01))[[2]], col="red")
  abline(h=summary(qtl.morphine.operm[[i]], alpha=c(0.10, 0.05, 0.01))[[3]], col="red")
  title(main = paste0("DO_morphine_",i))
}
#save genome-wide plot
for(i in names(qtl.morphine.out)){
  png(file = paste0("output/DO_morphine_combined_69k_m2_", i, ".png"), width = 16, height =8, res=300, units = "in")
  par(mar=c(5.1, 4.1, 1.1, 1.1))
  ymx <- maxlod(qtl.morphine.out[[i]]) # overall maximum LOD score
  plot(qtl.morphine.out[[i]], map=pmap, lodcolumn=1, col="slateblue", ylim=c(0, 10))
  abline(h=summary(qtl.morphine.operm[[i]], alpha=c(0.10, 0.05, 0.01))[[1]], col="red")
  abline(h=summary(qtl.morphine.operm[[i]], alpha=c(0.10, 0.05, 0.01))[[2]], col="red")
  abline(h=summary(qtl.morphine.operm[[i]], alpha=c(0.10, 0.05, 0.01))[[3]], col="red")
  title(main = paste0("DO_morphine_",i))
  dev.off()
}

#peaks coeff plot
for(i in names(qtl.morphine.out)){
  print(i)
  peaks <- find_peaks(qtl.morphine.out[[i]], map=pmap, threshold=6, drop=1.5)
  print(peaks)
  for(p in 1:dim(peaks)[1]) {
    print(p)
    chr <-peaks[p,3]
    #coeff plot
    par(mar=c(4.1, 4.1, 0.6, 0.6))
    plot_coefCC(coef_c1[[i]][[p]], pmap[chr], scan1_output=qtl.morphine.out[[i]], bgcolor="gray95", legend=NULL)
    plot_coefCC(coef_c2[[i]][[p]], pmap[chr], scan1_output=qtl.morphine.out[[i]], bgcolor="gray95", legend=NULL)
  }
}
# [1] "Survival.Time"
#   lodindex lodcolumn chr      pos      lod    ci_lo    ci_hi
# 1        1    pheno1   6 93.76935 6.696094 93.60032 94.88262
# [1] 1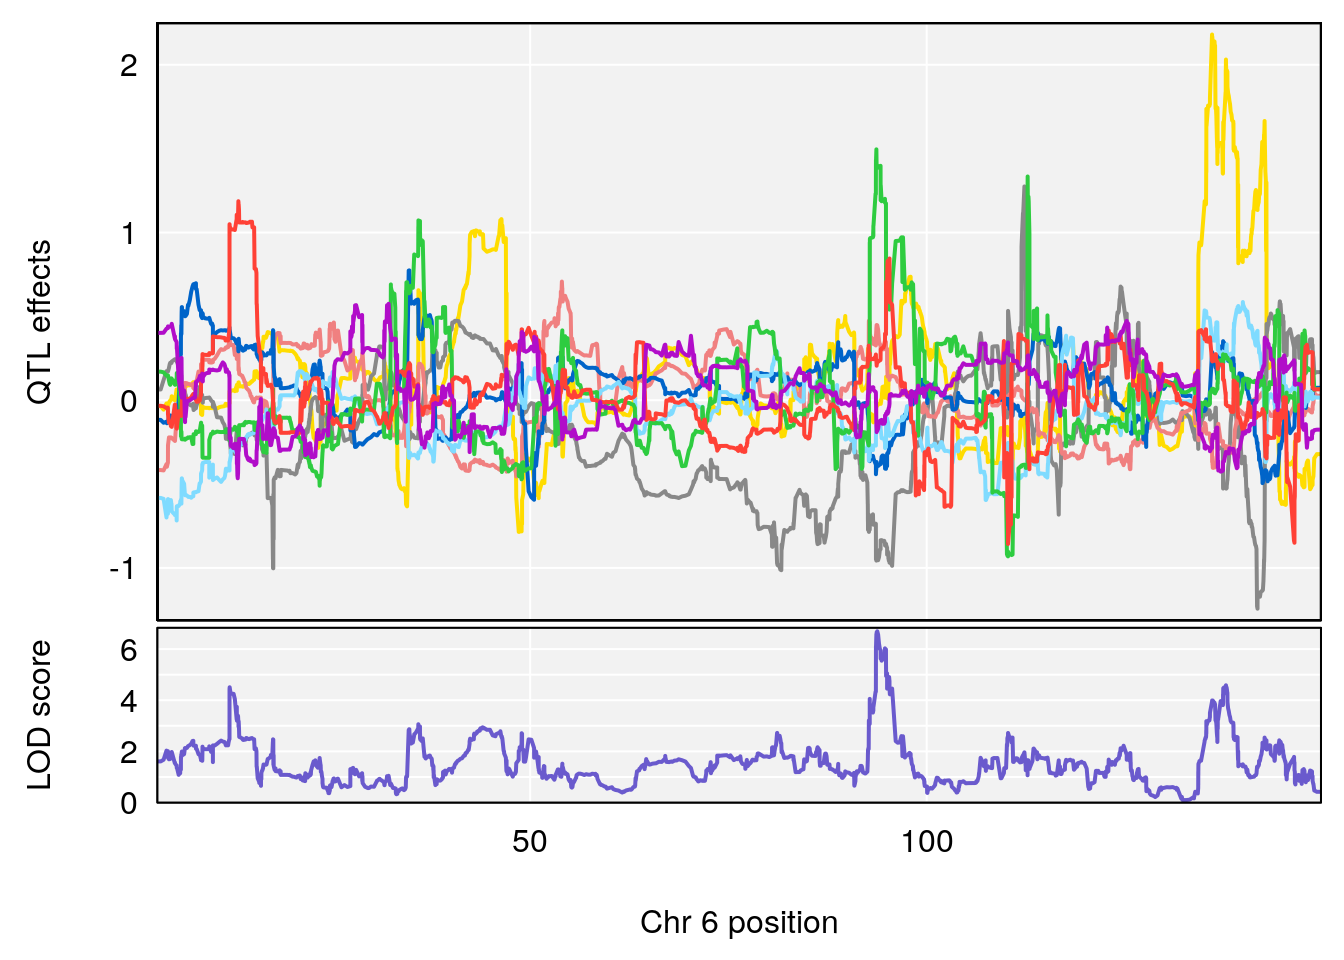
# [1] "Recovery.Time"
#   lodindex lodcolumn chr      pos      lod    ci_lo    ci_hi
# 1        1    pheno1  16 29.08447 6.148843 26.48461 29.65254
# [1] 1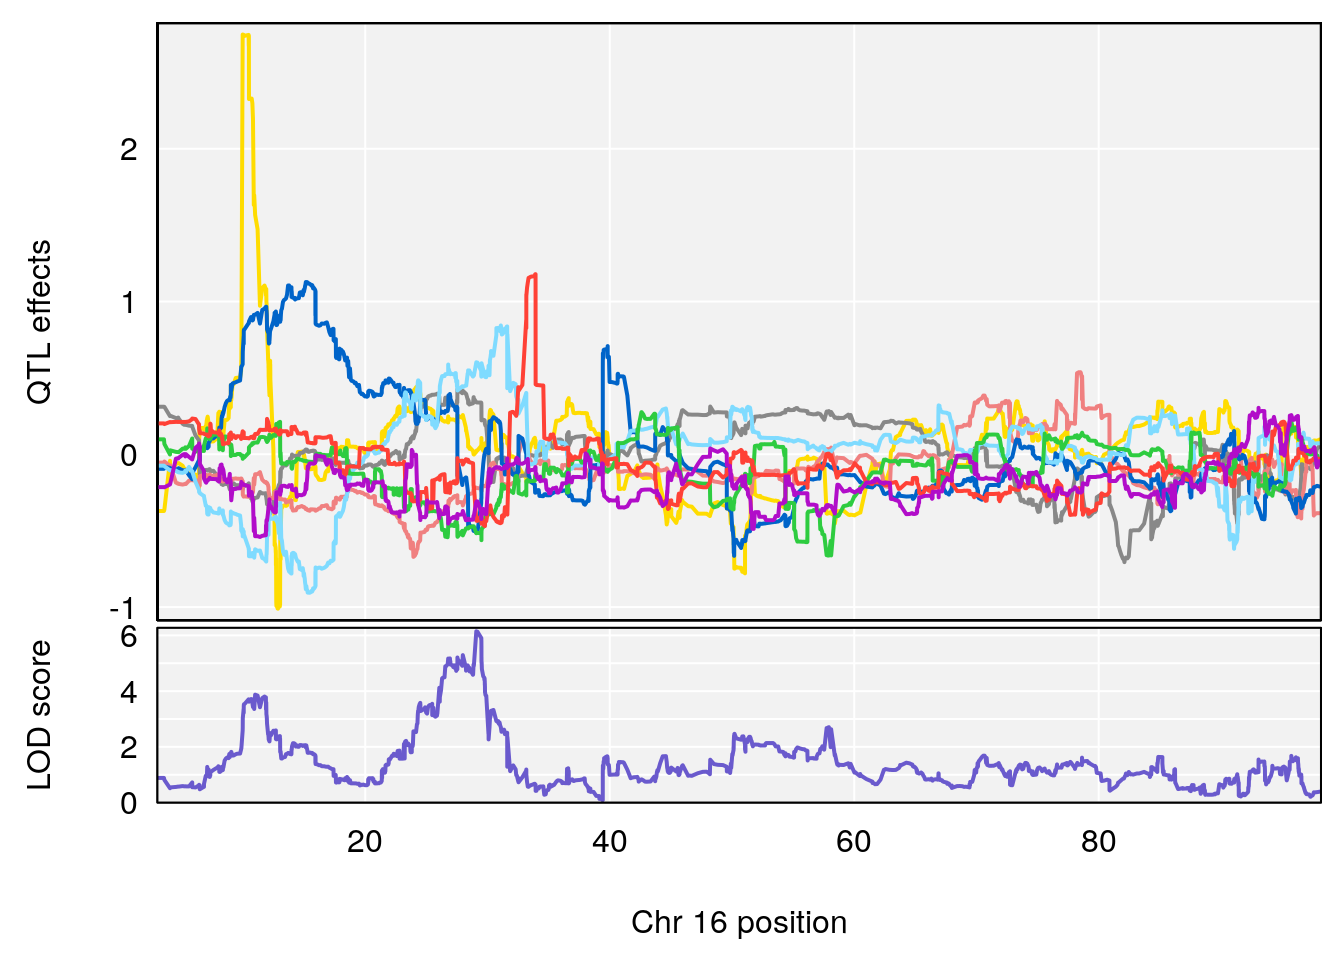
# [1] "Min.depression"
#   lodindex lodcolumn chr       pos      lod    ci_lo     ci_hi
# 1        1    pheno1   6  94.75287 6.074533 93.60032  95.01174
# 2        1    pheno1   9 124.11695 6.070446 96.69146 124.58265
# [1] 1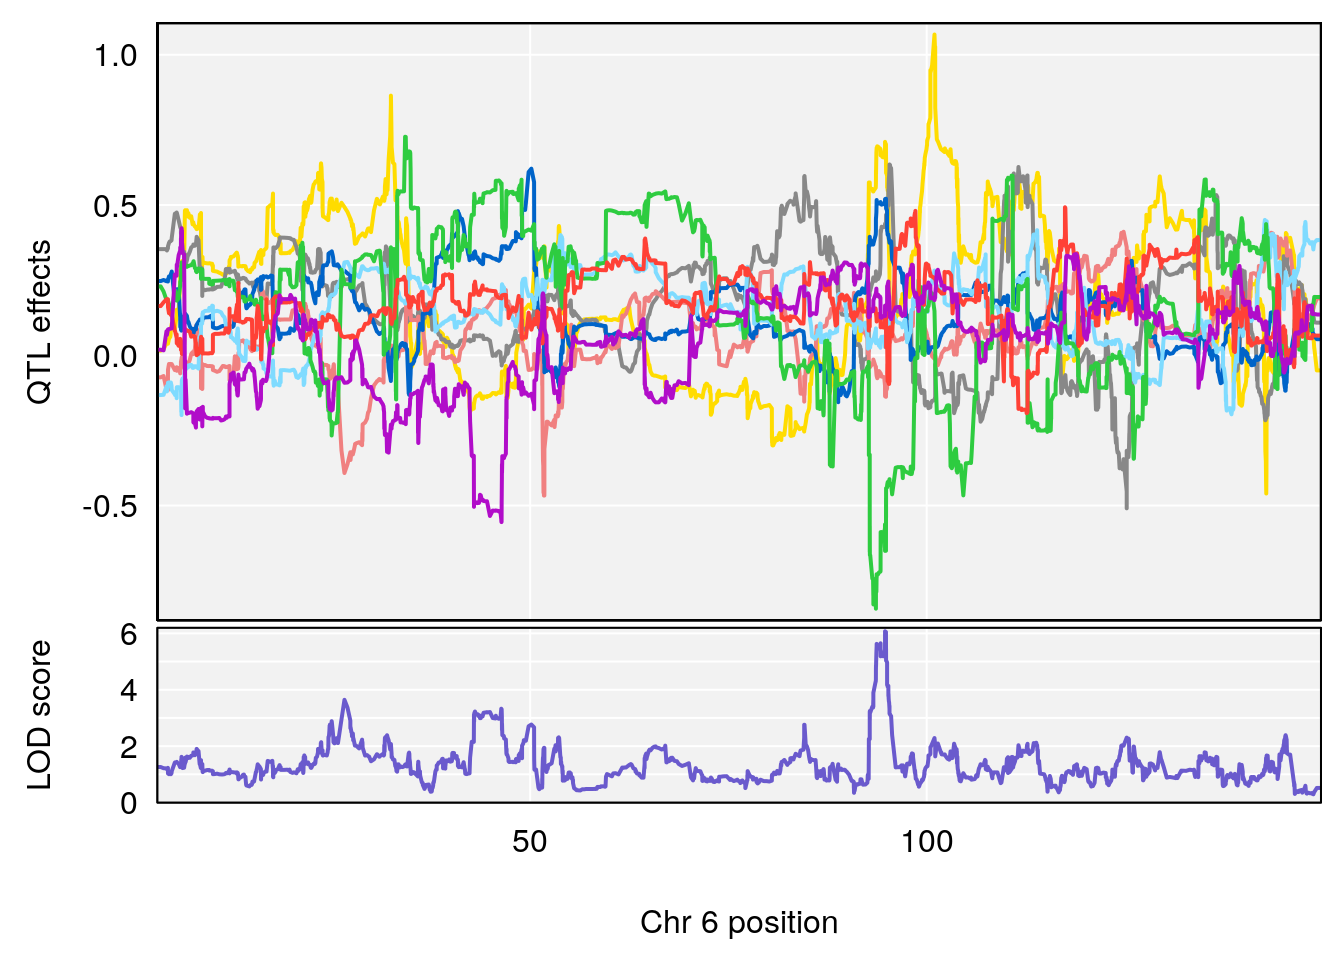
# [1] 2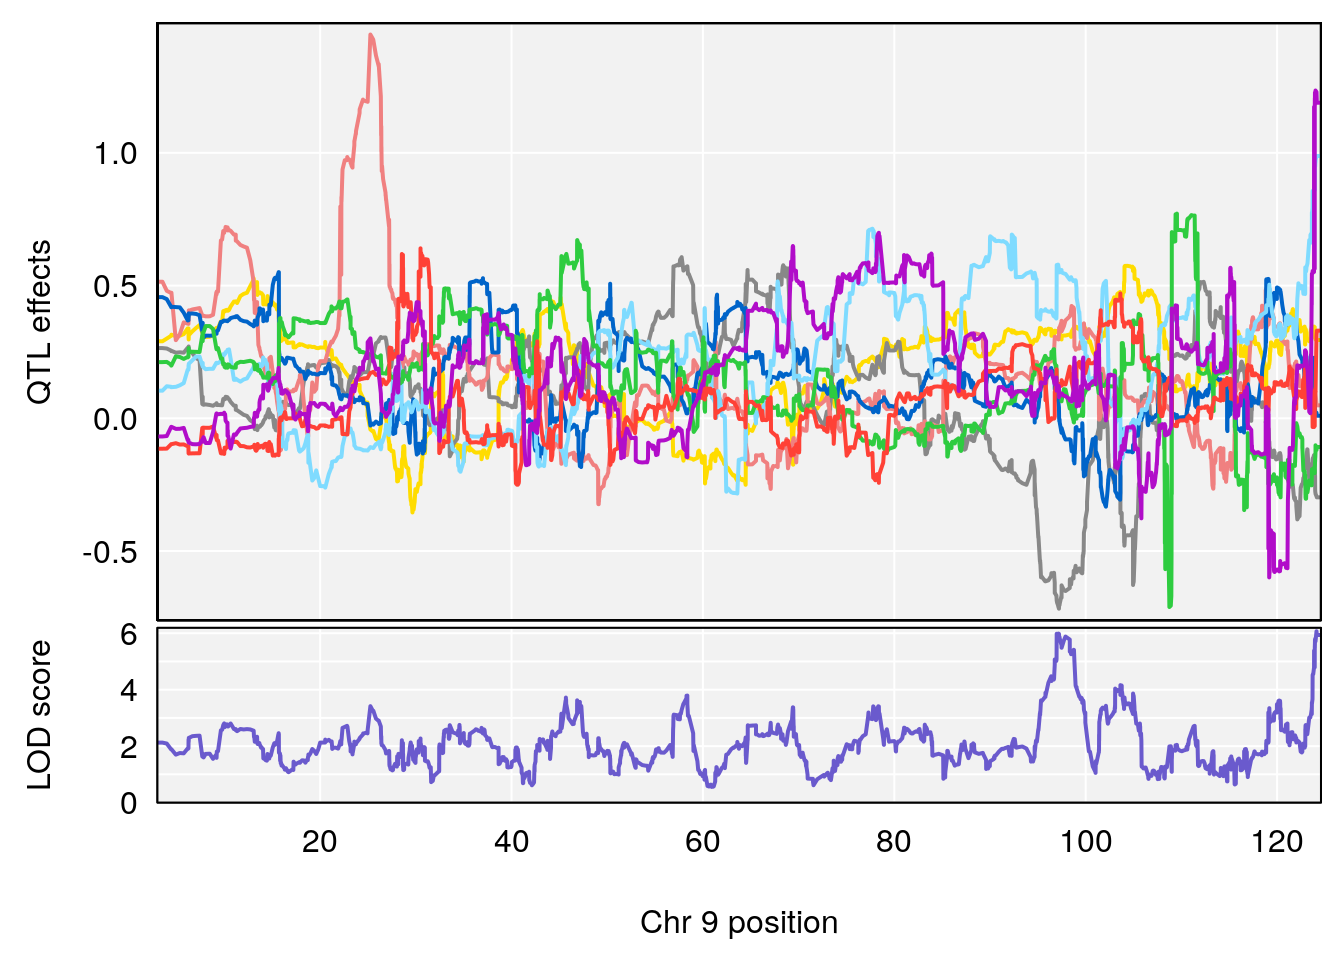
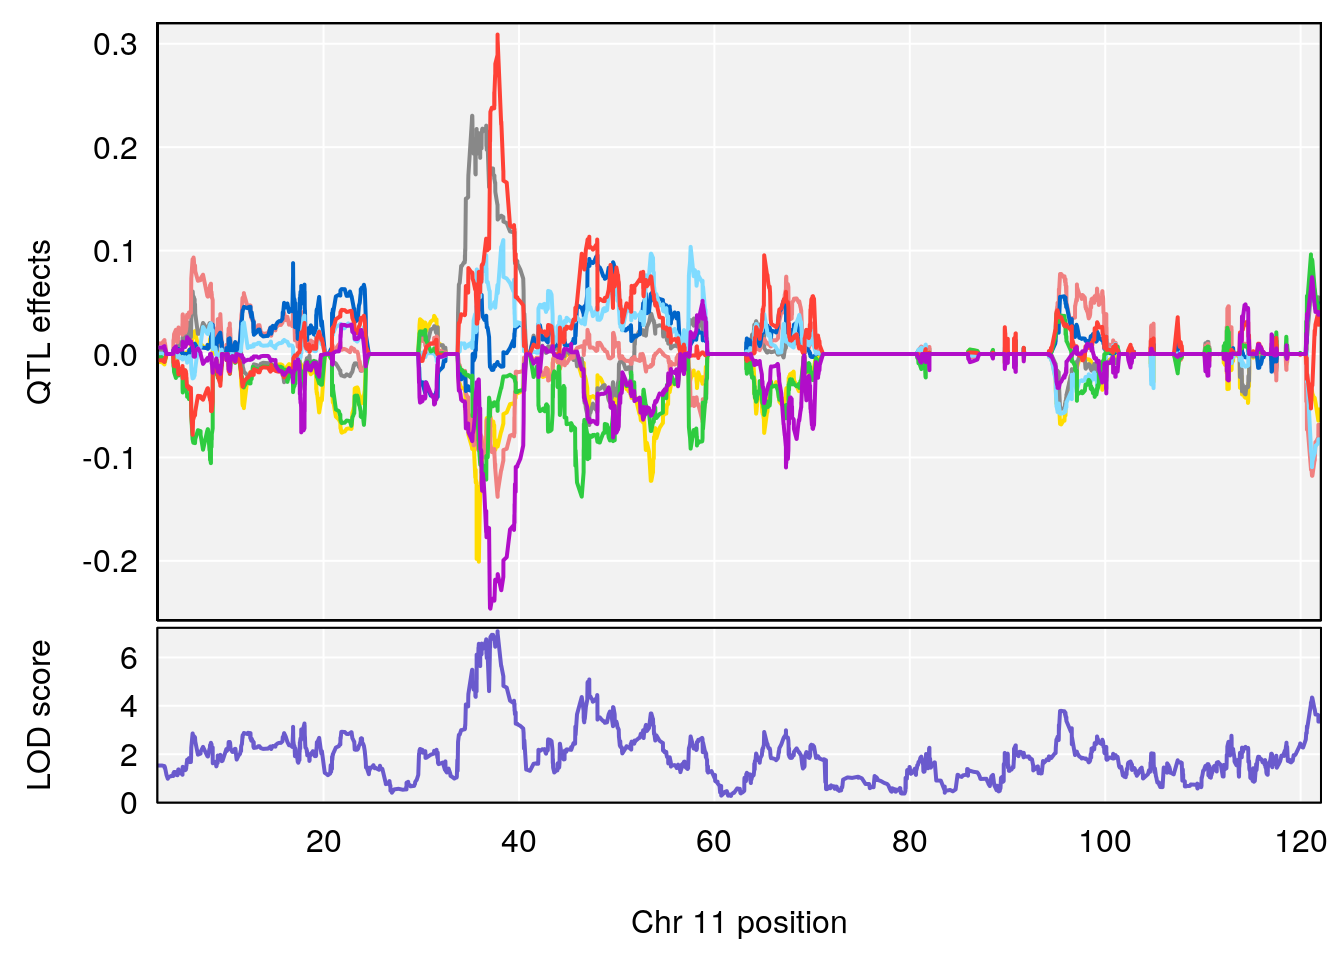
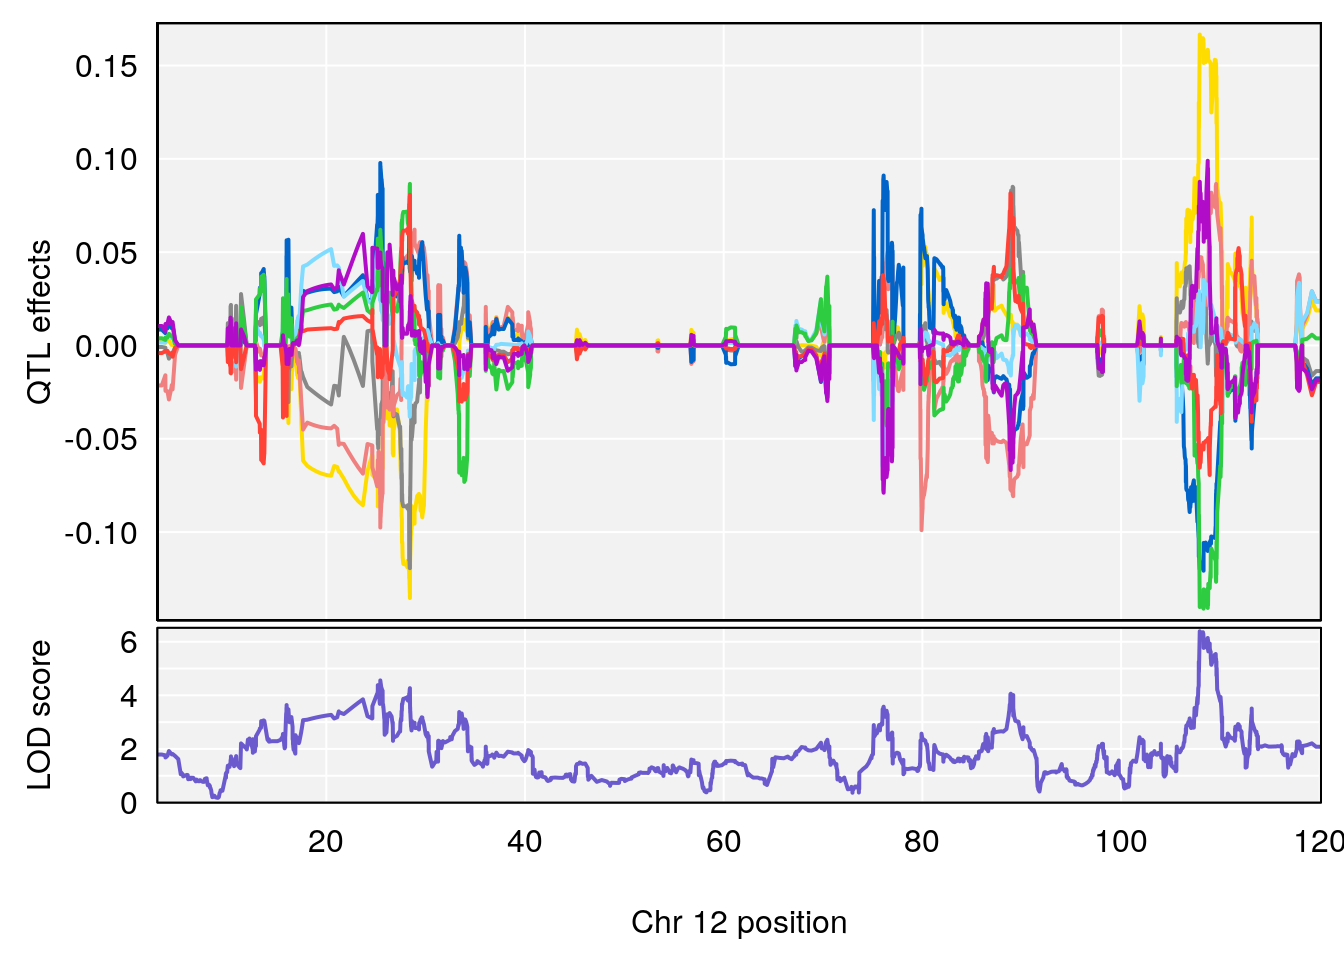
# [1] "Status_bin"
#   lodindex lodcolumn chr       pos      lod      ci_lo     ci_hi
# 1        1    pheno1   4 156.17629 6.857142 156.009474 156.49607
# 2        1    pheno1   7 115.16657 6.012871 114.526442 115.46115
# 3        1    pheno1  10  29.38717 6.819337   8.597626  33.97126
# 4        1    pheno1  11  37.81053 7.082165  35.662586  38.39621
# 5        1    pheno1  12 107.91869 6.389835 107.816680 109.67503
# 6        1    pheno1  17  27.00602 7.424161  26.634222  28.58929
# 7        1    pheno1  18  85.49980 7.067088  81.327205  86.51269
# 8        1    pheno1   X 144.48572 7.256846 143.604522 145.79861
# [1] 1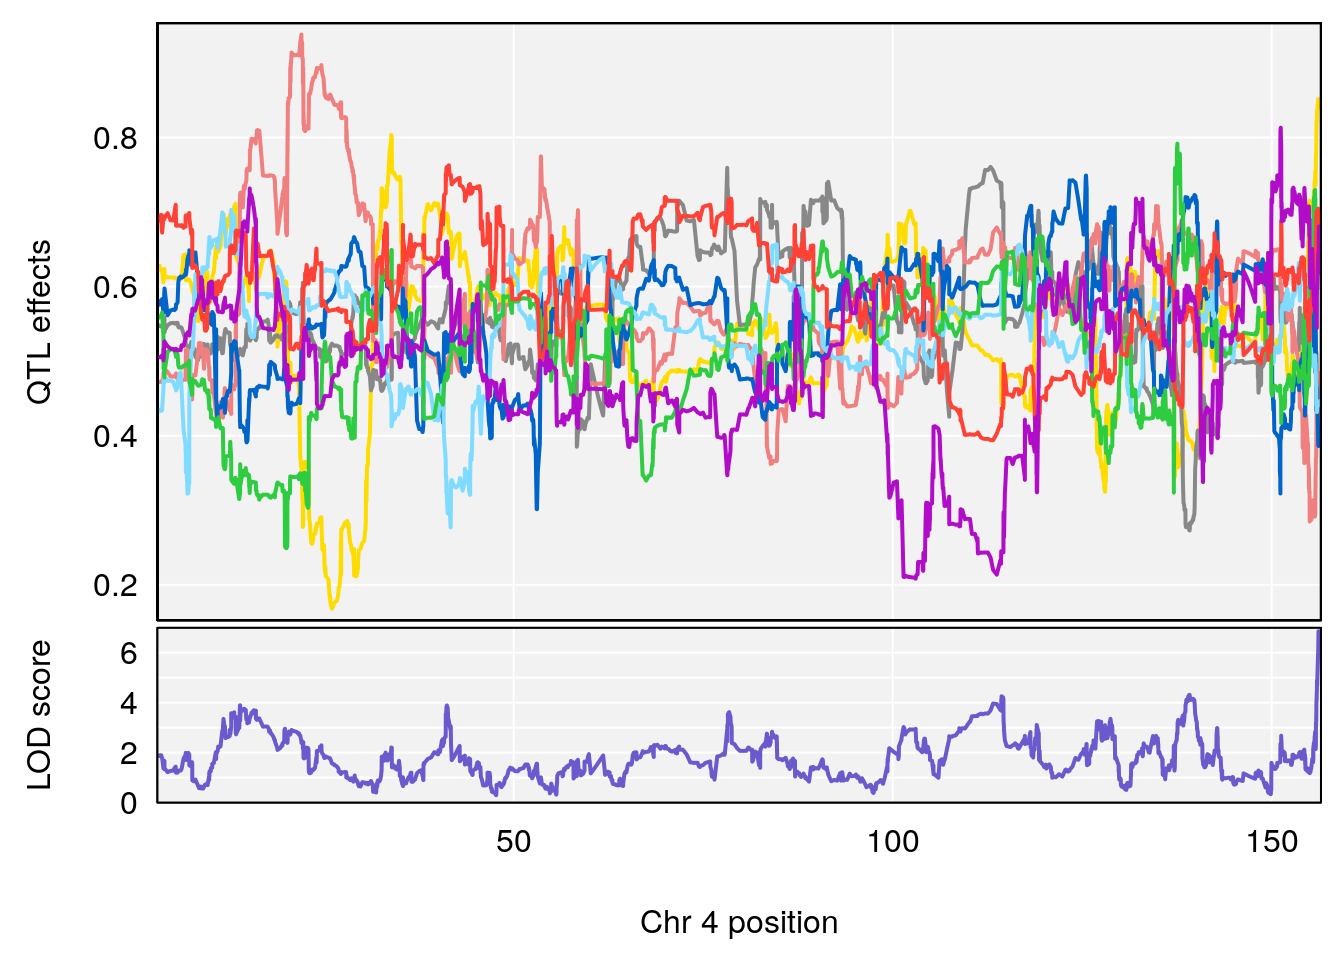
# [1] 2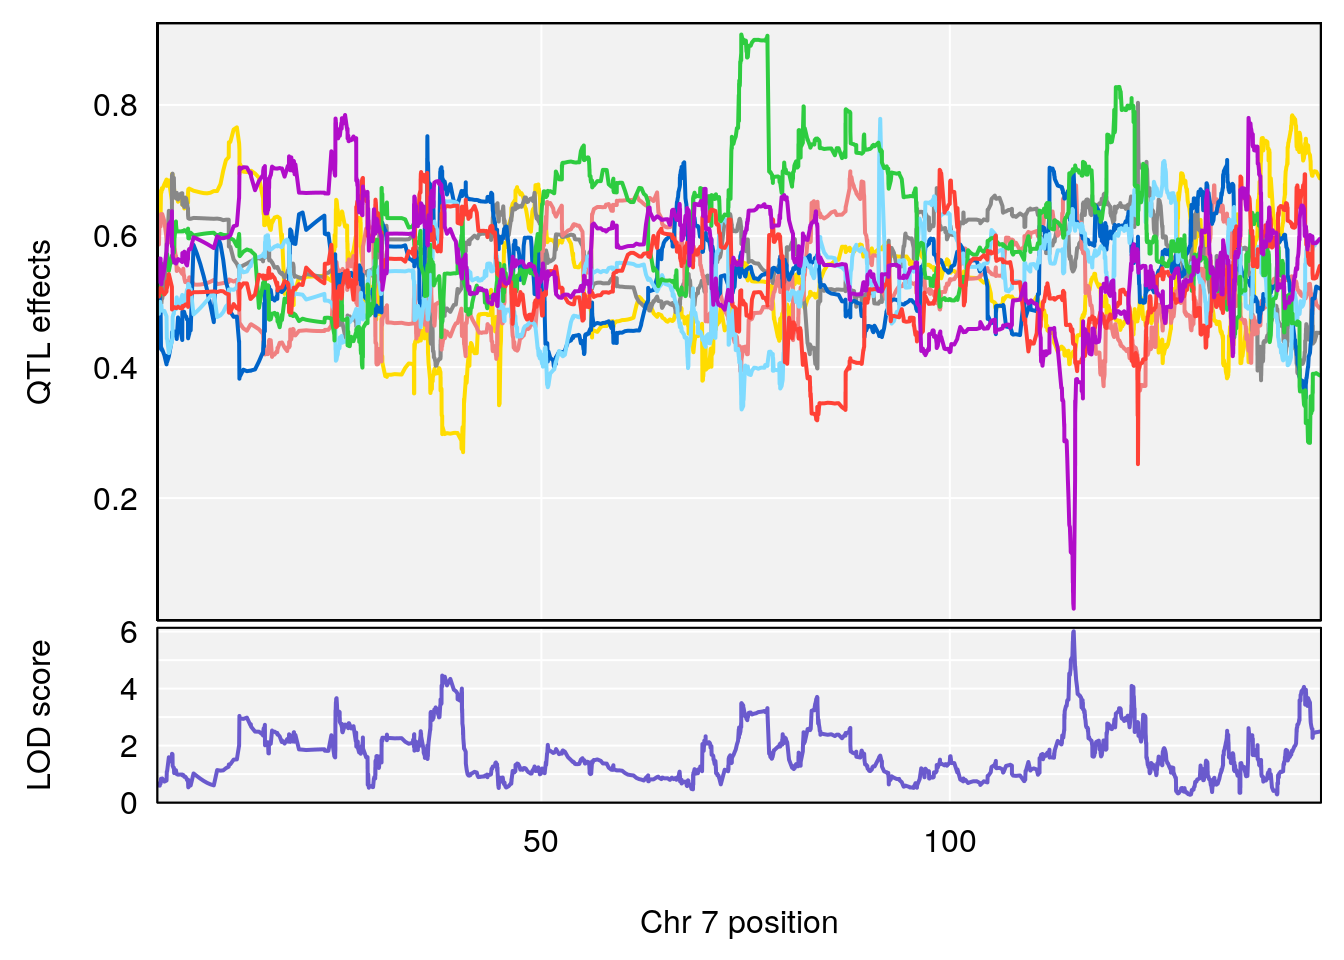
# [1] 3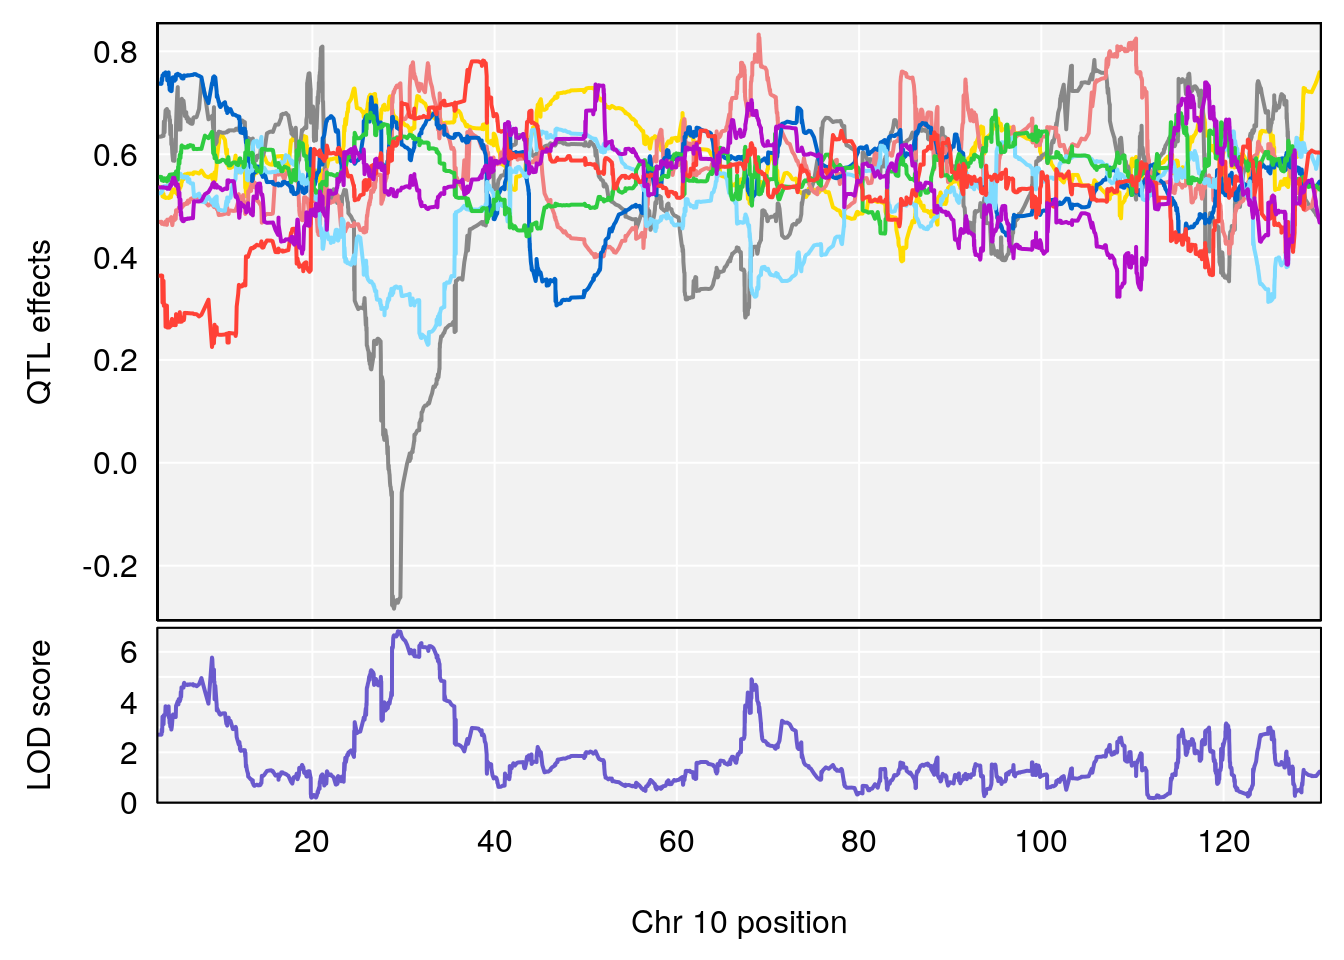
# [1] 4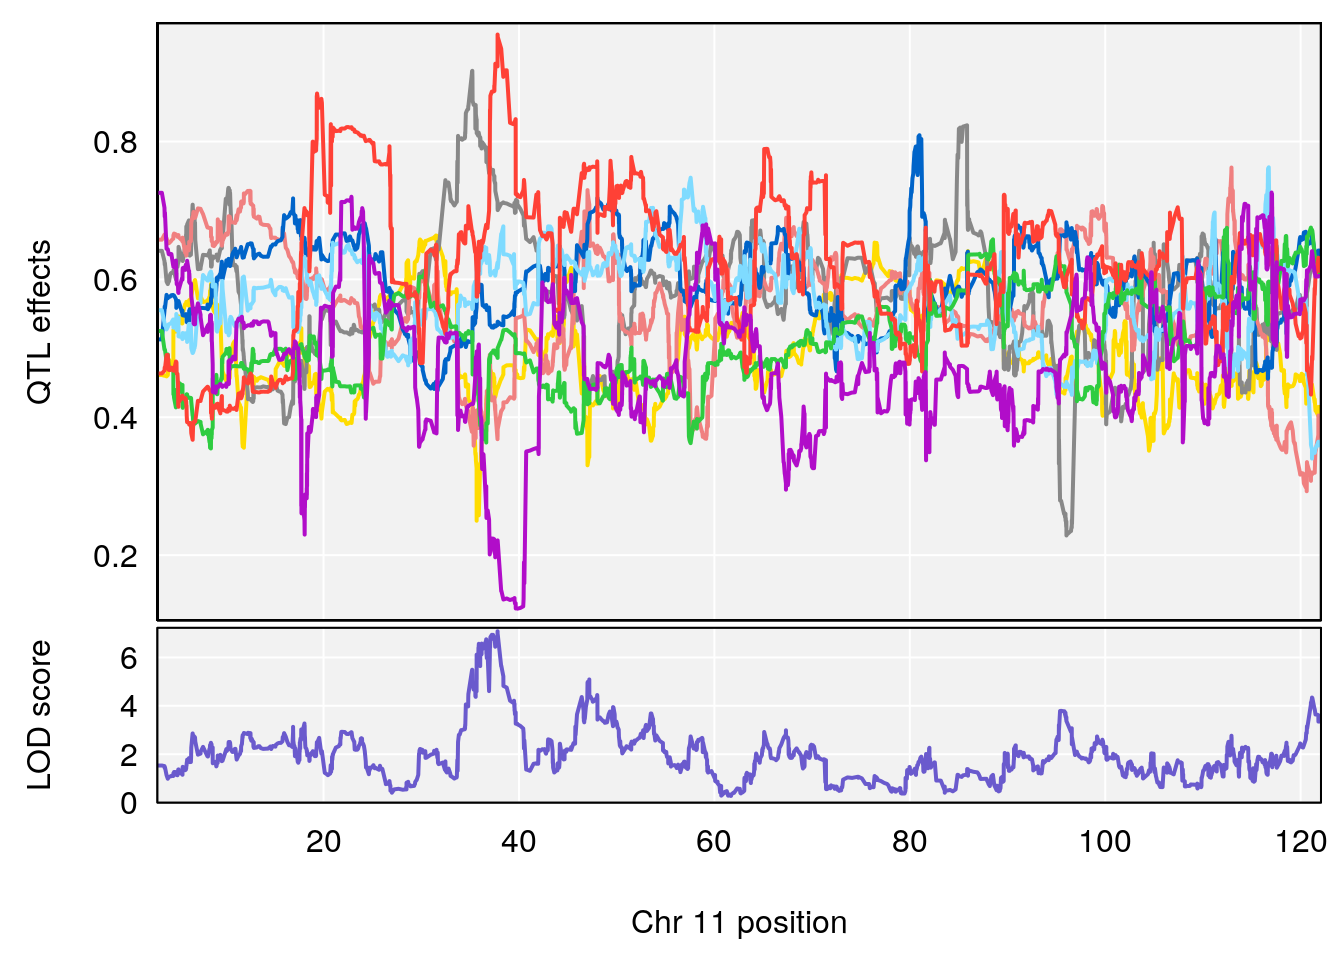
# [1] 5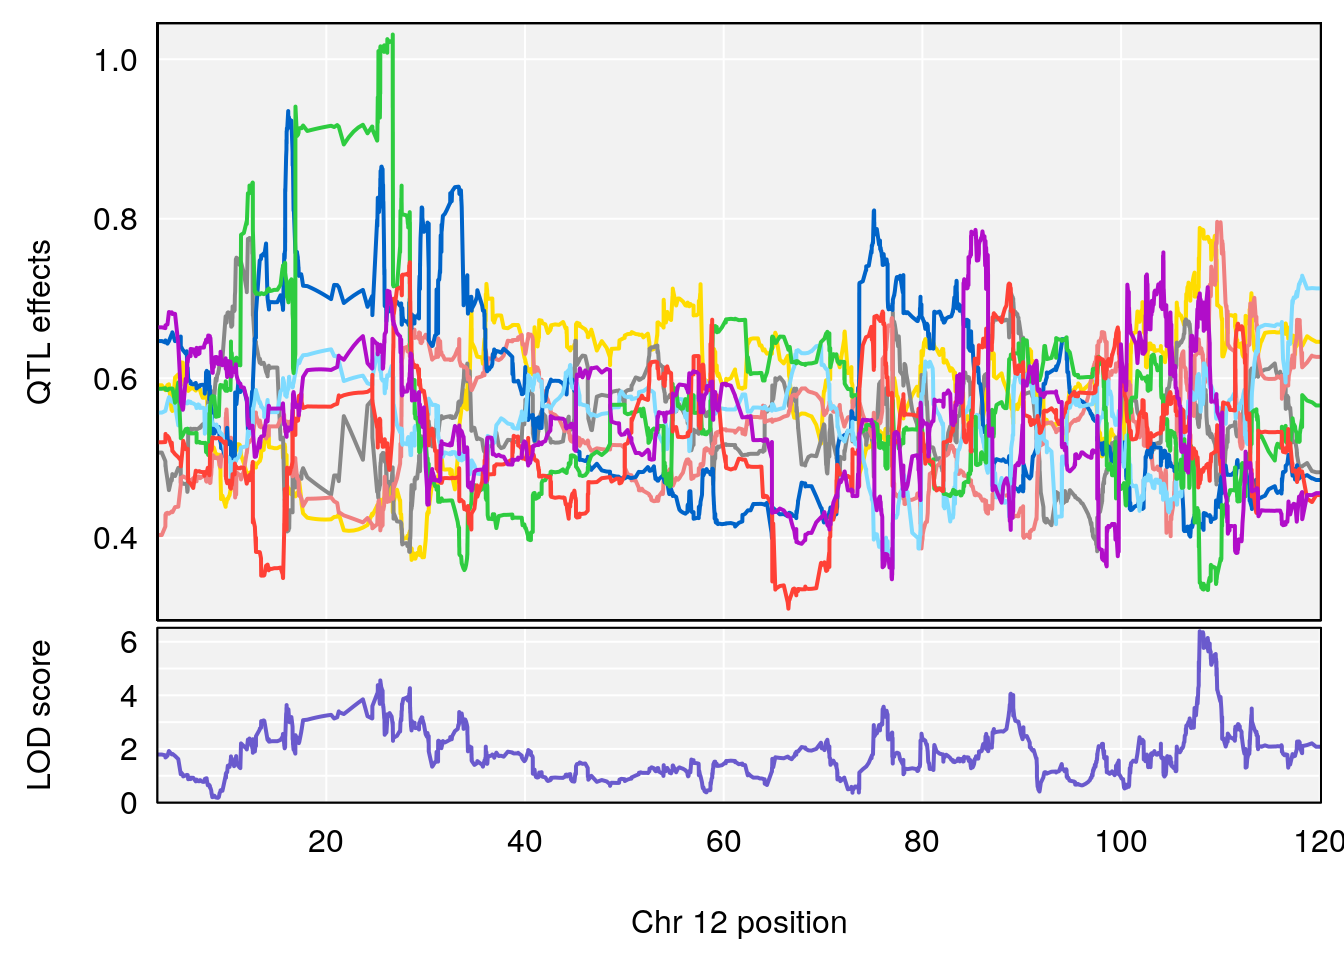
# [1] 6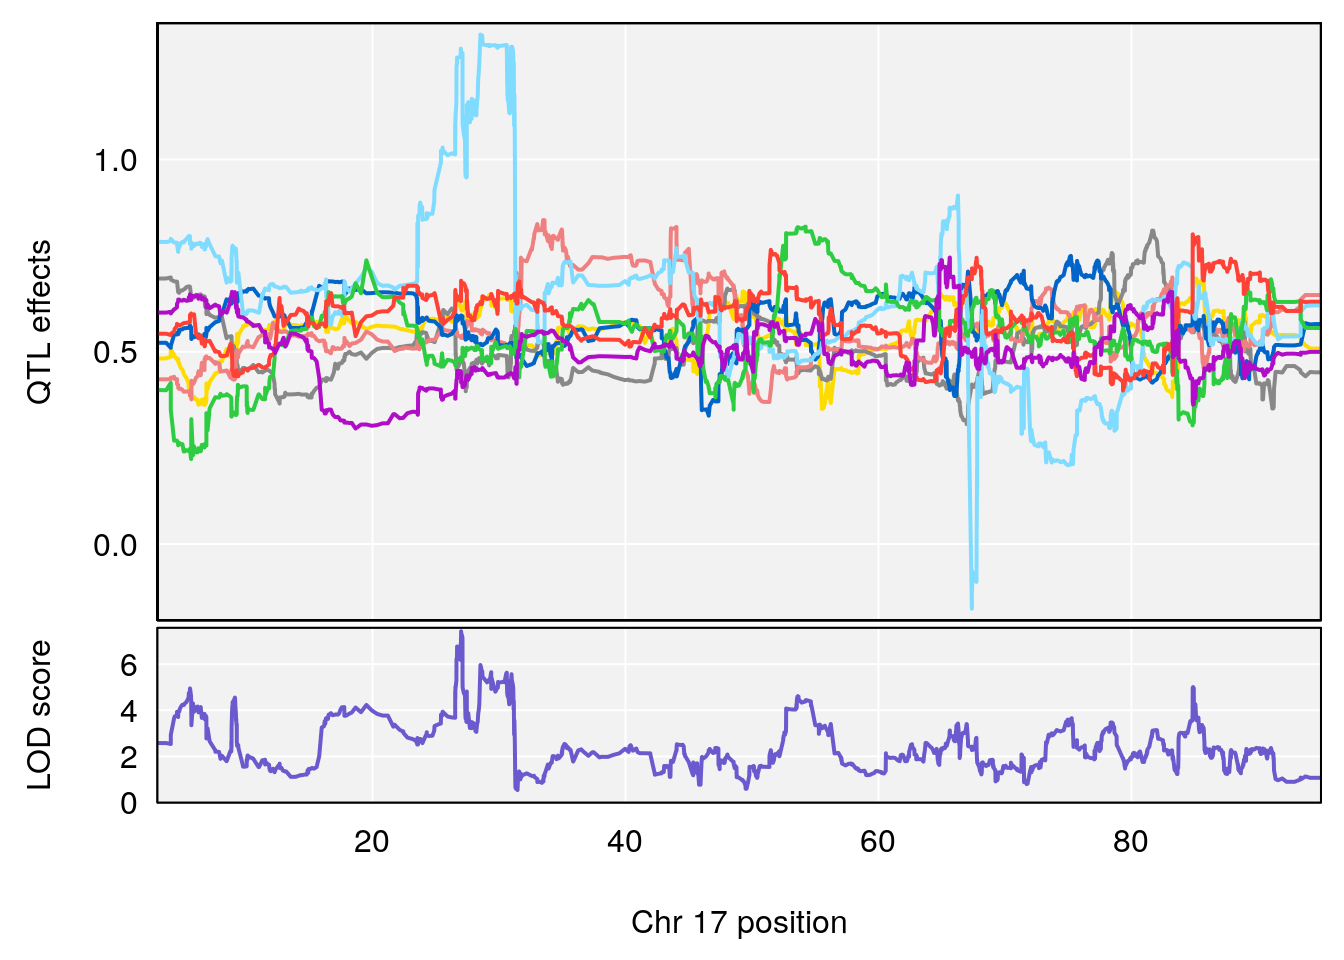
# [1] 7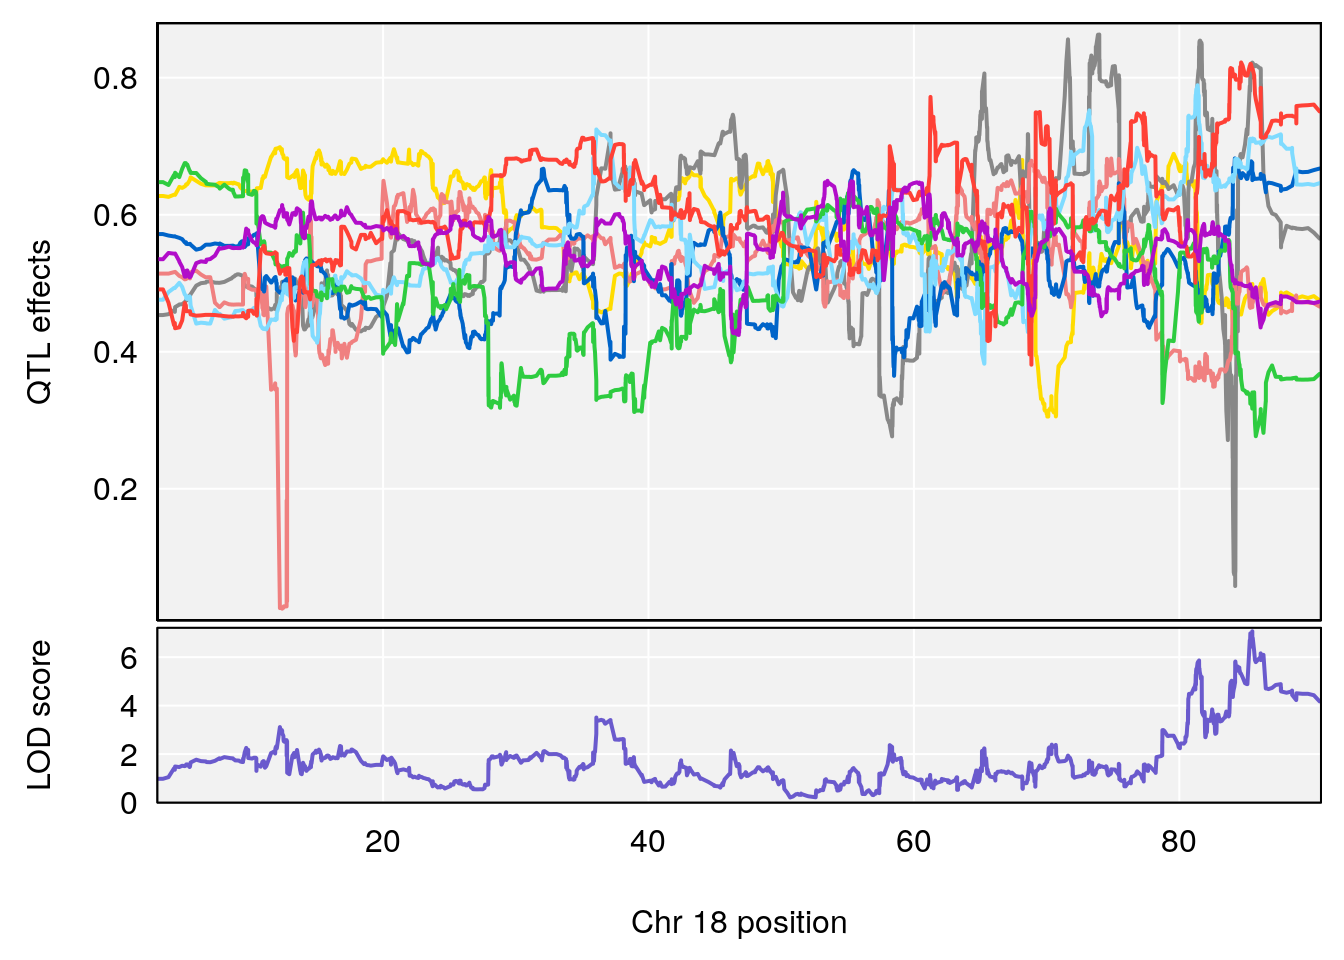
# [1] 8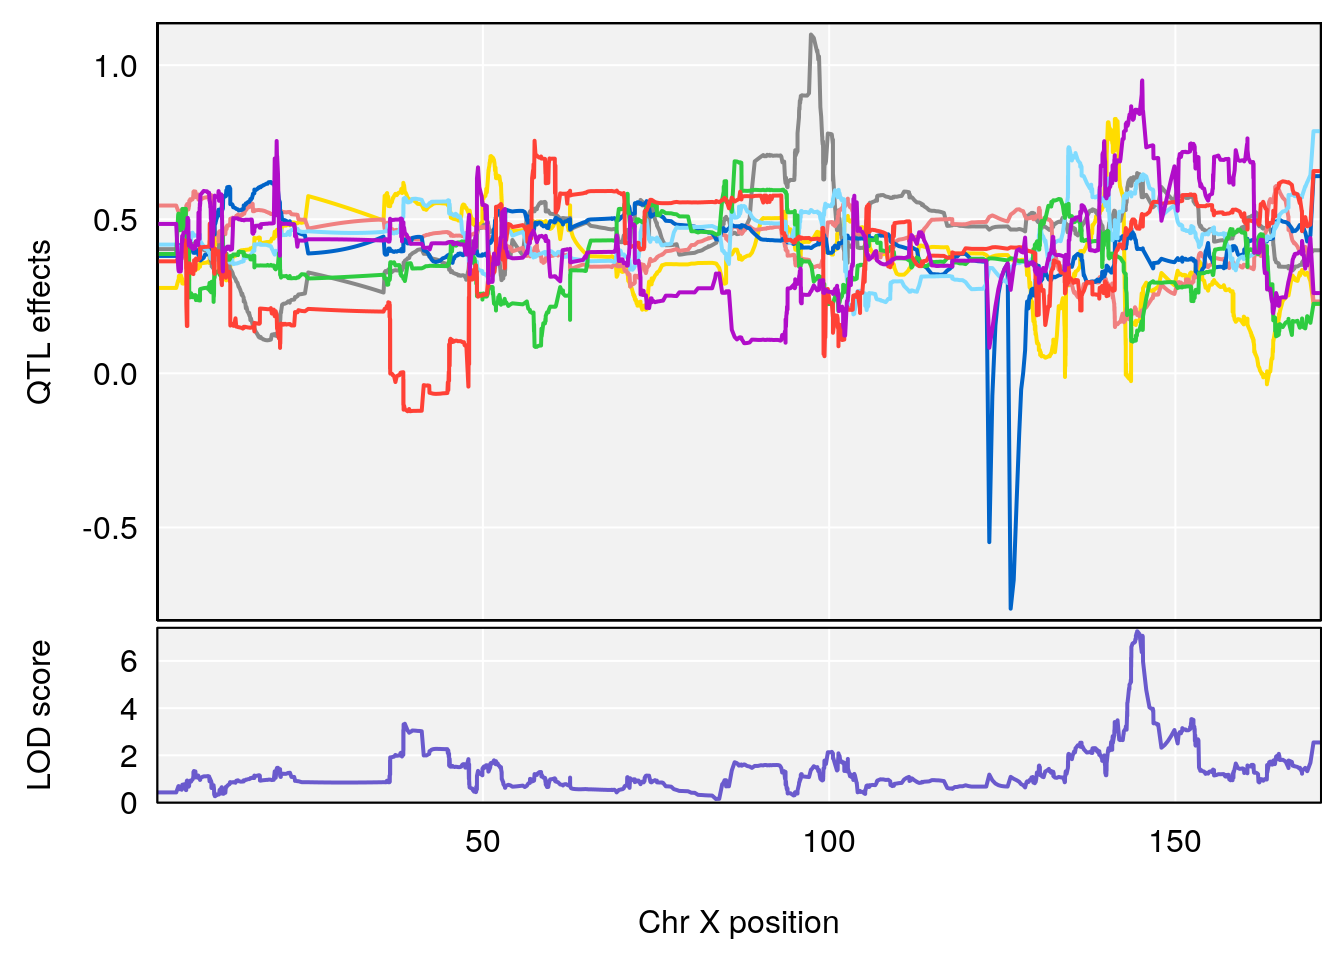
#save peaks coeff plot
for(i in names(qtl.morphine.out)){
  print(i)
  peaks <- find_peaks(qtl.morphine.out[[i]], map=pmap, threshold=6, drop=1.5)
  fname <- paste("output/DO_morphine_combined_69k_m2_",i,"_coefplot.pdf",sep="")
  pdf(file = fname, width = 16, height =8)
  for(p in 1:dim(peaks)[1]) {
    print(p)
    chr <-peaks[p,3]
    #coeff plot
    par(mar=c(4.1, 4.1, 0.6, 0.6))
    plot_coefCC(coef_c1[[i]][[p]], pmap[chr], scan1_output=qtl.morphine.out[[i]], bgcolor="gray95", legend=NULL)
  }
  dev.off()
}
# [1] "Survival.Time"
# [1] 1
# [1] "Recovery.Time"
# [1] 1
# [1] "Min.depression"
# [1] 1
# [1] 2
# [1] "Status_bin"
# [1] 1
# [1] 2
# [1] 3
# [1] 4
# [1] 5
# [1] 6
# [1] 7
# [1] 8

#save peaks coeff blup plot
for(i in names(qtl.morphine.out)){
  print(i)
  peaks <- find_peaks(qtl.morphine.out[[i]], map=pmap, threshold=6, drop=1.5)
  fname <- paste("output/DO_morphine_combined_69k_m2_",i,"_coefplot_blup.pdf",sep="")
  pdf(file = fname, width = 16, height =8)
  for(p in 1:dim(peaks)[1]) {
    print(p)
    chr <-peaks[p,3]
    #coeff plot
    par(mar=c(4.1, 4.1, 0.6, 0.6))
    plot_coefCC(coef_c2[[i]][[p]], pmap[chr], scan1_output=qtl.morphine.out[[i]], bgcolor="gray95", legend=NULL)
  }
  dev.off()
}
# [1] "Survival.Time"
# [1] 1
# [1] "Recovery.Time"
# [1] 1
# [1] "Min.depression"
# [1] 1
# [1] 2
# [1] "Status_bin"
# [1] 1
# [1] 2
# [1] 3
# [1] 4
# [1] 5
# [1] 6
# [1] 7
# [1] 8
Plot qtl mapping on array male
load("output/qtl.morphine.out.combined_gm.male.RData")
#pmap and gmap
chr.names <- c("1","2","3","4","5","6","7","8","9","10","11","12","13","14","15","16","17","18","19", "X")
gmap <- list()
pmap <- list()
for (chr in chr.names){
  gmap[[chr]] <-  combined_gm$gmap[[chr]]
  pmap[[chr]] <-  combined_gm$pmap[[chr]]
}
attr(gmap, "is_x_chr") <- structure(c(rep(FALSE,19),TRUE), names=1:20)
attr(pmap, "is_x_chr") <- structure(c(rep(FALSE,19),TRUE), names=1:20)

#genome-wide plot
for(i in names(qtl.morphine.out)){
  par(mar=c(5.1, 4.1, 1.1, 1.1))
  ymx <- maxlod(qtl.morphine.out[[i]]) # overall maximum LOD score
  plot(qtl.morphine.out[[i]], map=pmap, lodcolumn=1, col="slateblue", ylim=c(0, max(sapply(qtl.morphine.out, maxlod)) +2))
  abline(h=summary(qtl.morphine.operm[[i]], alpha=c(0.10, 0.05, 0.01))[[1]], col="red")
  abline(h=summary(qtl.morphine.operm[[i]], alpha=c(0.10, 0.05, 0.01))[[2]], col="red")
  abline(h=summary(qtl.morphine.operm[[i]], alpha=c(0.10, 0.05, 0.01))[[3]], col="red")
  title(main = paste0("DO_morphine_",i))
}
| Version | Author | Date |
|---|---|---|
| 8fe8543 | xhyuo | 2023-02-20 |
| Version | Author | Date |
|---|---|---|
| 8fe8543 | xhyuo | 2023-02-20 |
| Version | Author | Date |
|---|---|---|
| 8fe8543 | xhyuo | 2023-02-20 |
| Version | Author | Date |
|---|---|---|
| 8fe8543 | xhyuo | 2023-02-20 |
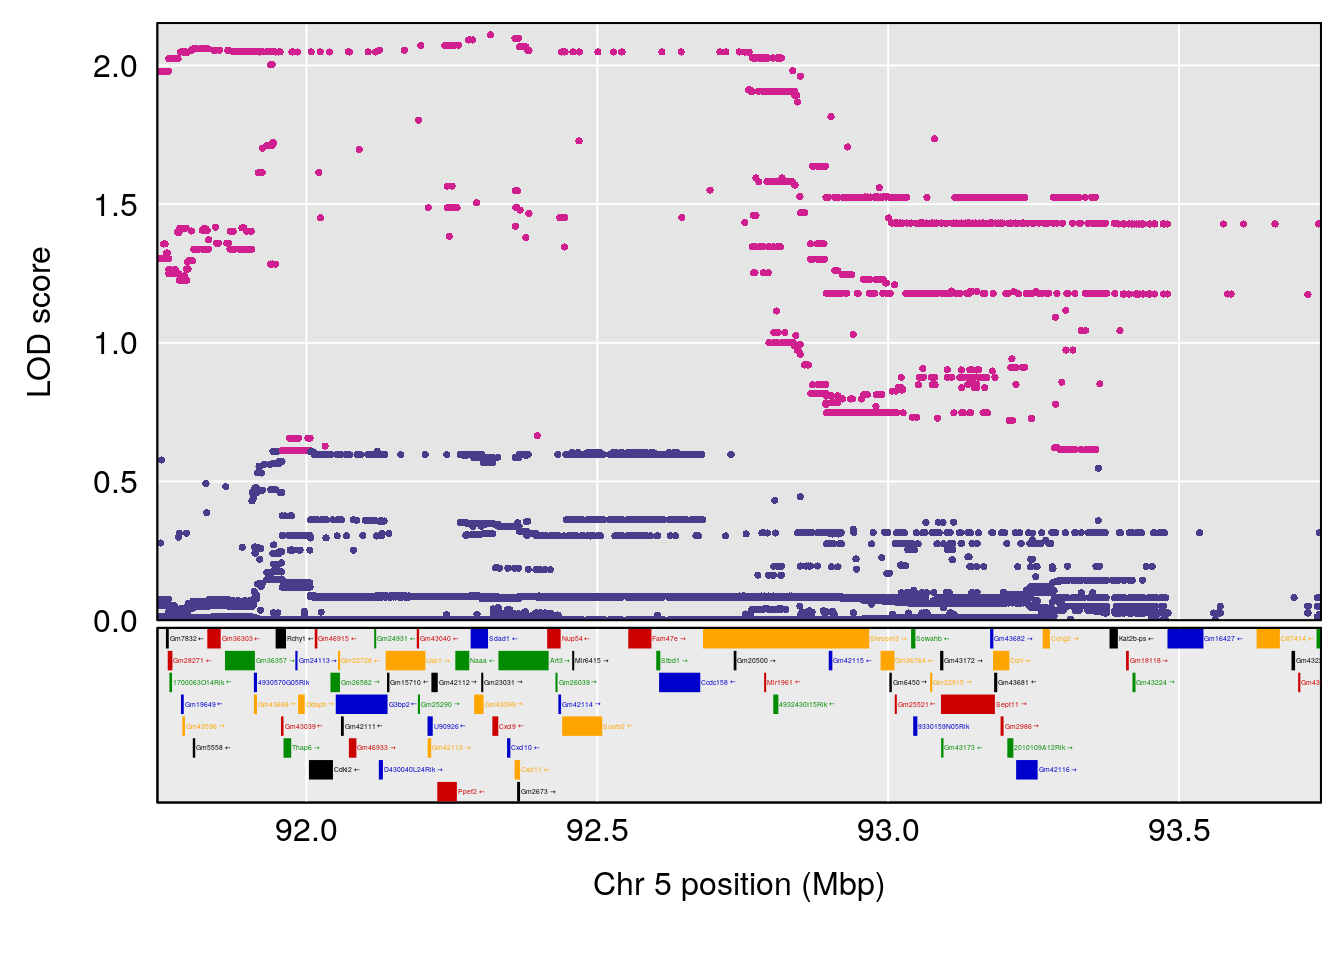
#peaks coeff plot
for(i in names(qtl.morphine.out)){
print(i)
peaks <- find_peaks(qtl.morphine.out[[i]], map=pmap, threshold=6, drop=1.5)
print(peaks)
for(p in 1:dim(peaks)[1]) {
print(p)
chr <-peaks[p,3]
#coeff plot
par(mar=c(4.1, 4.1, 0.6, 0.6))
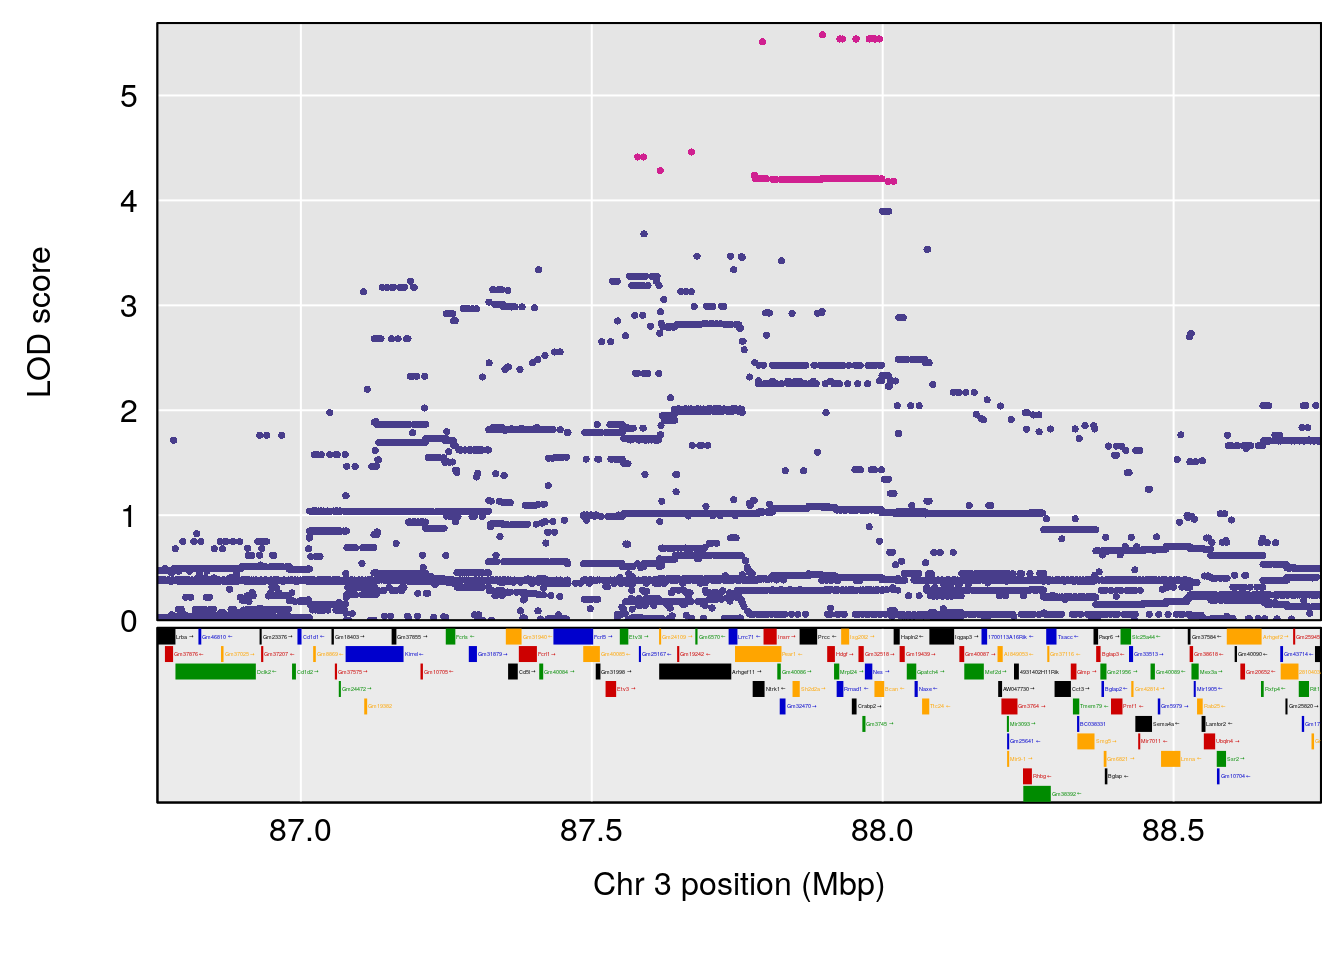
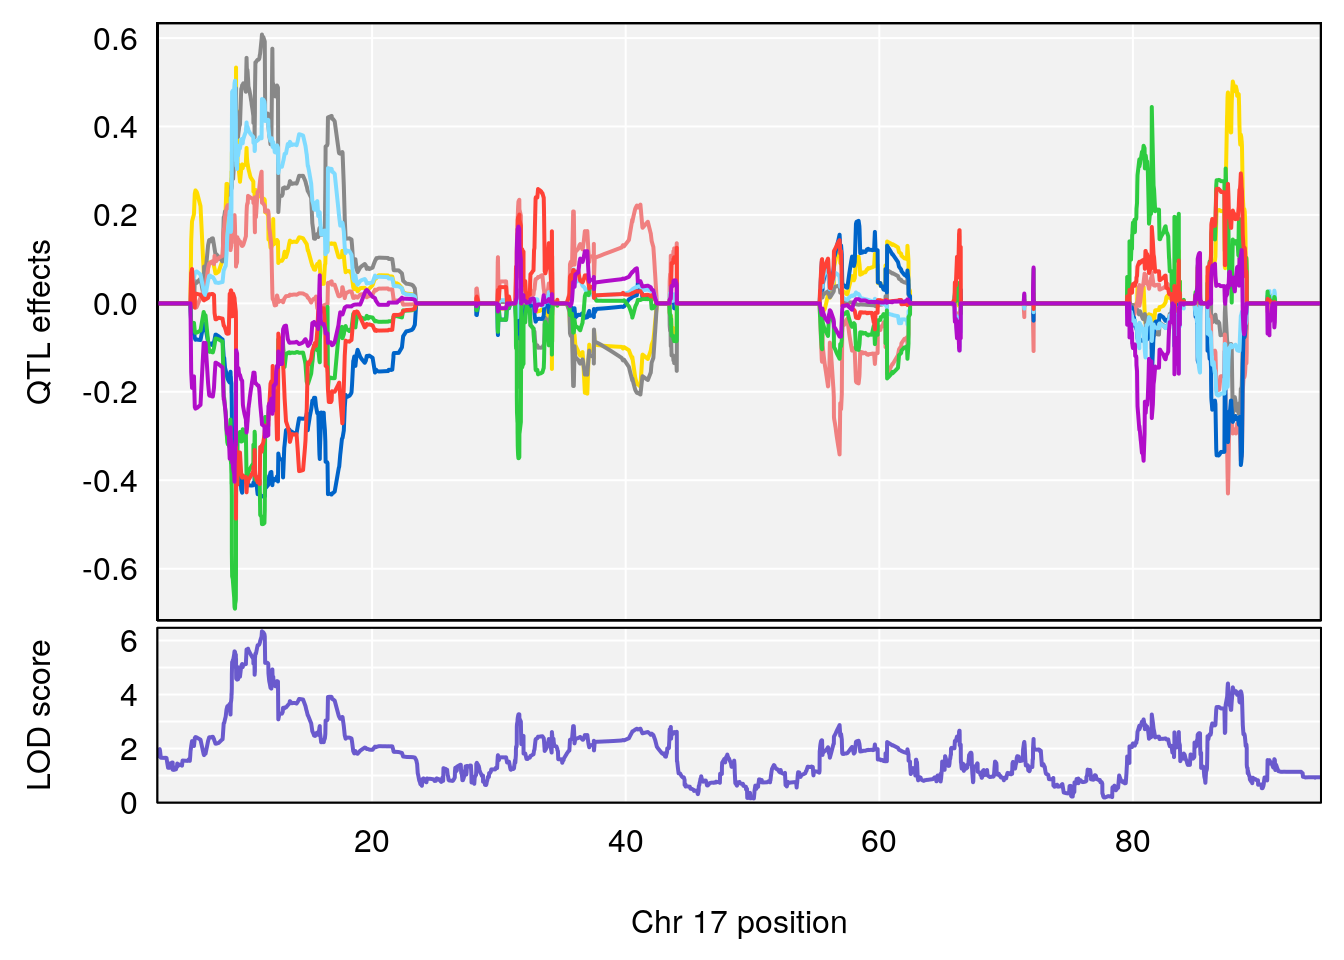
plot_coefCC(coef_c1[[i]][[p]], pmap[chr], scan1_output=qtl.morphine.out[[i]], bgcolor="gray95", legend=NULL)
plot_coefCC(coef_c2[[i]][[p]], pmap[chr], scan1_output=qtl.morphine.out[[i]], bgcolor="gray95", legend=NULL)
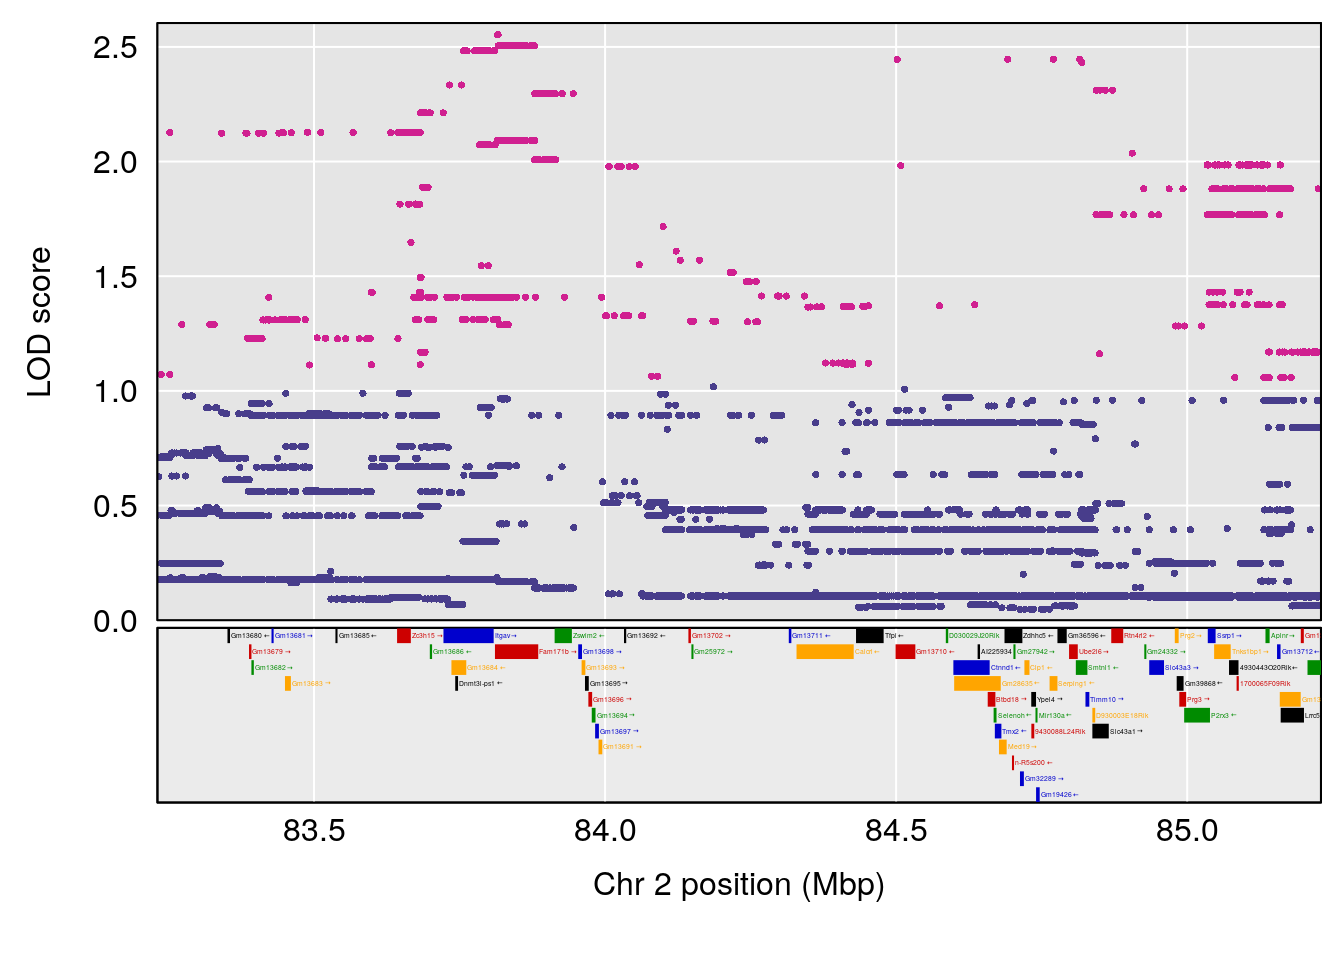
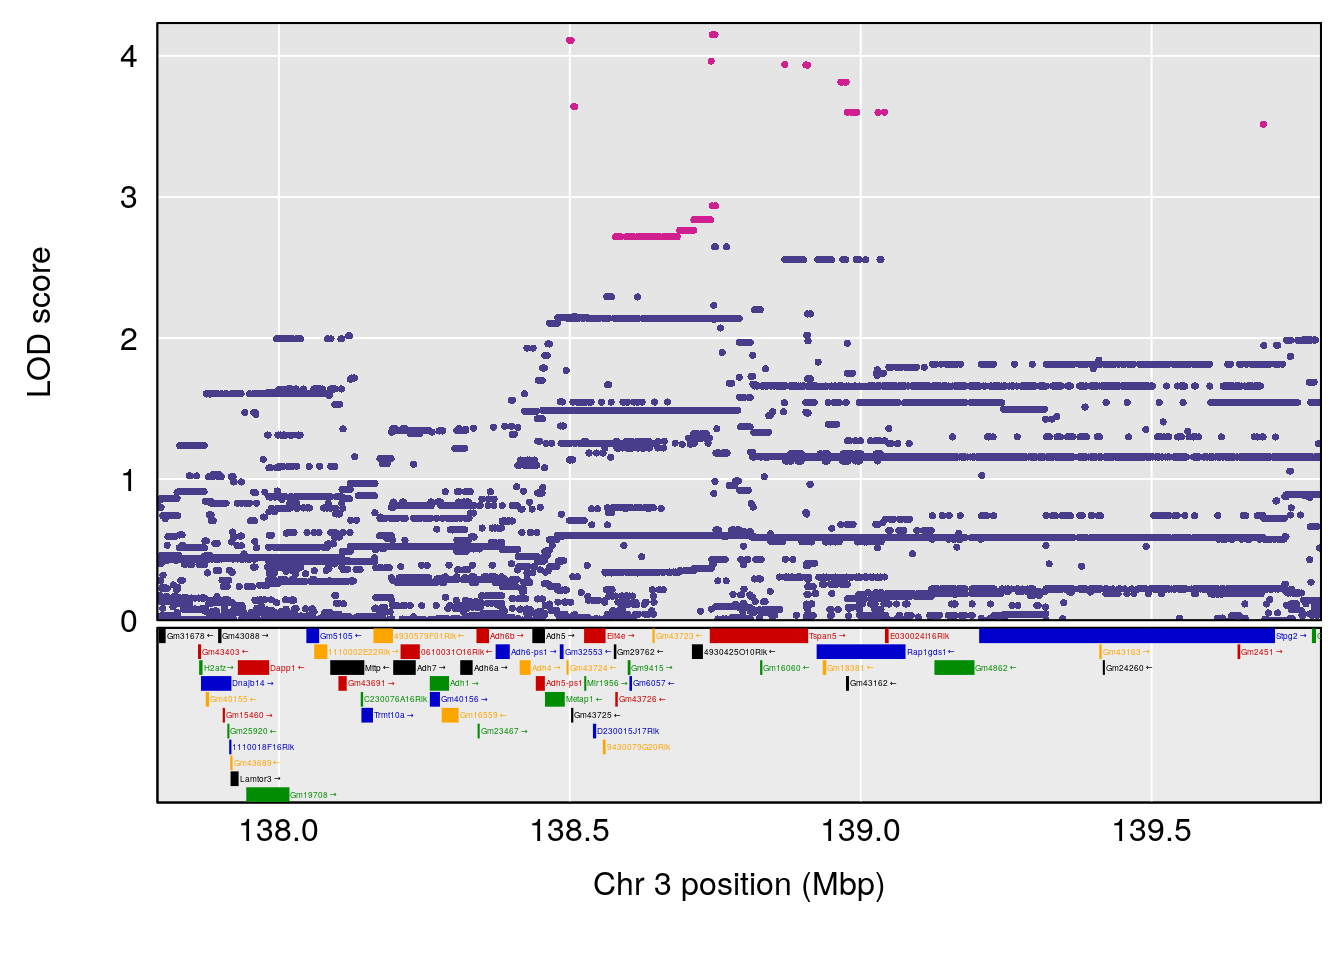
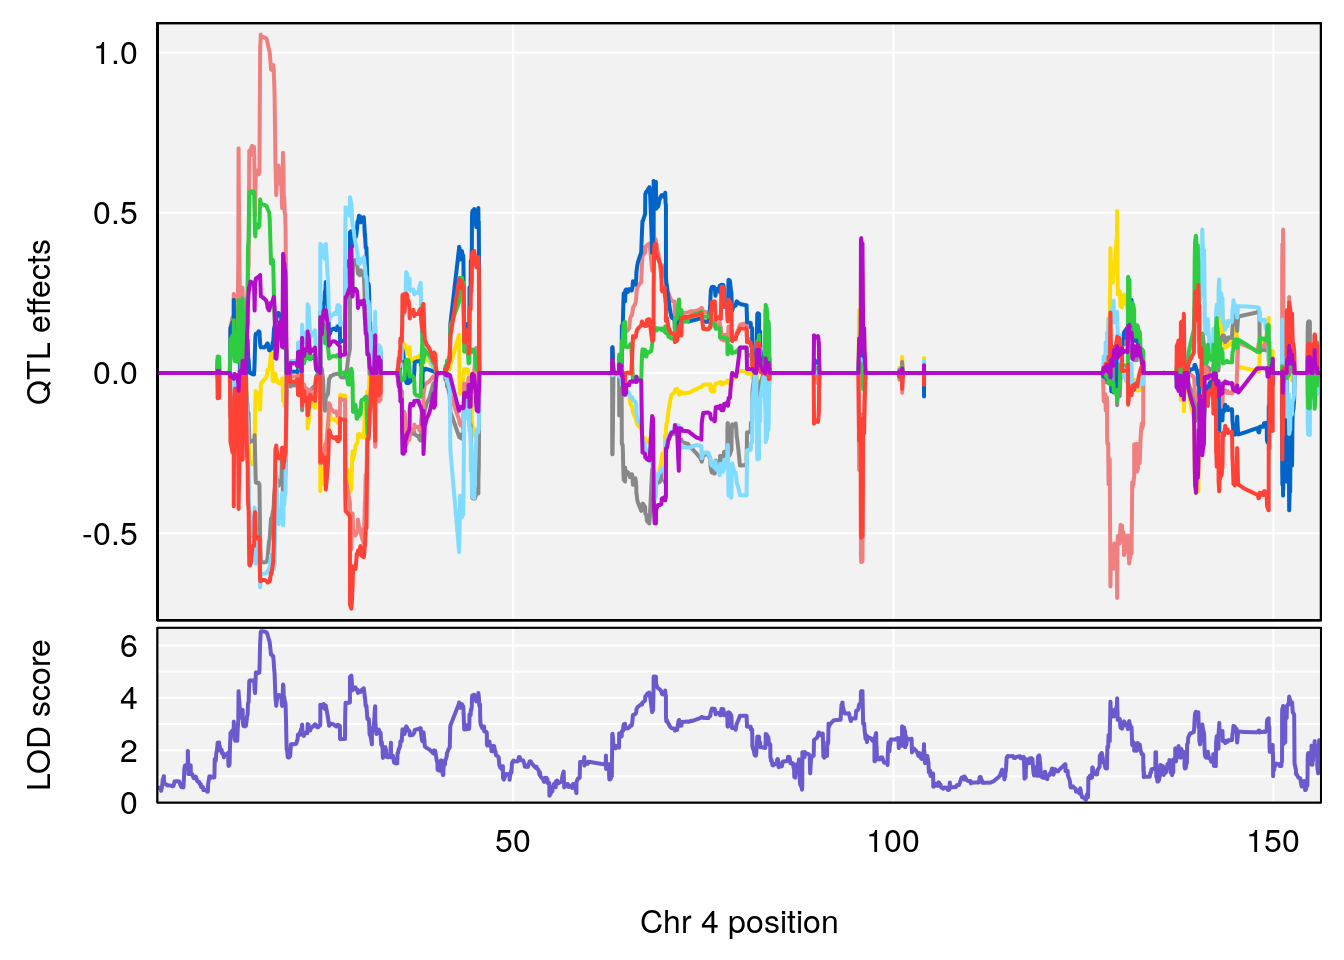
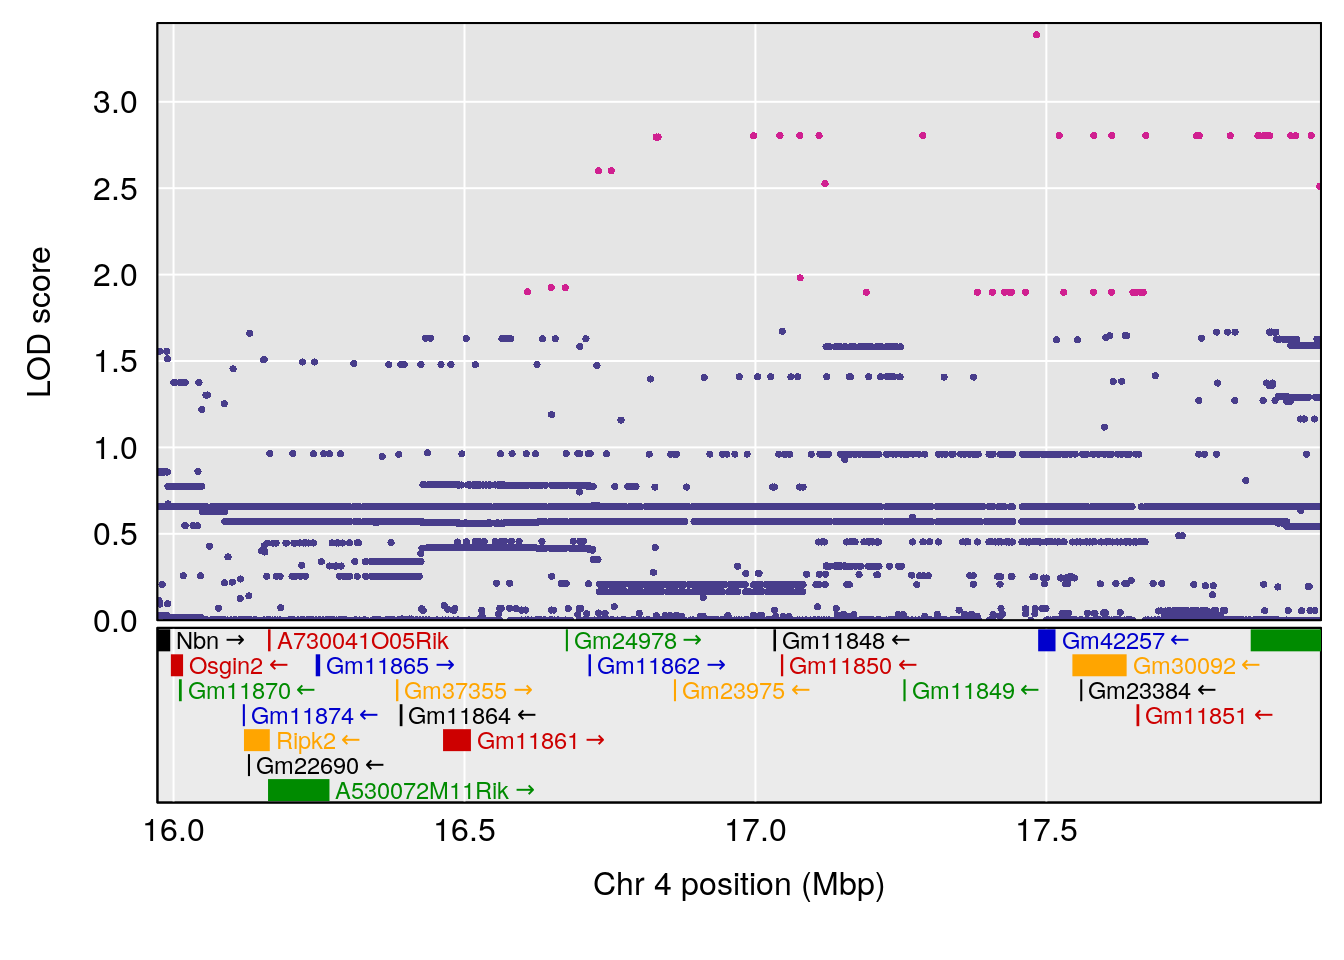
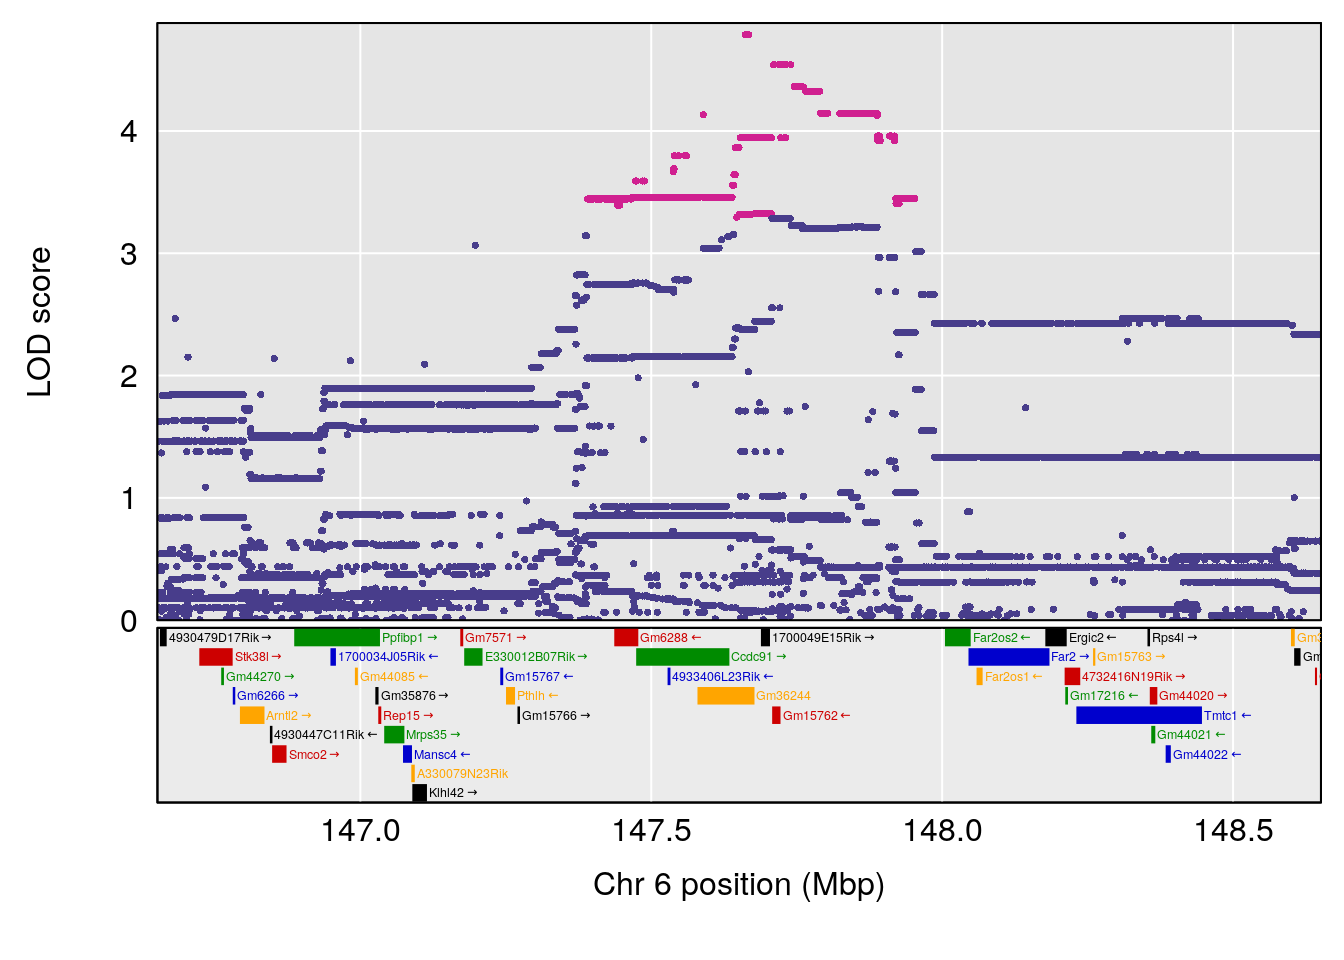
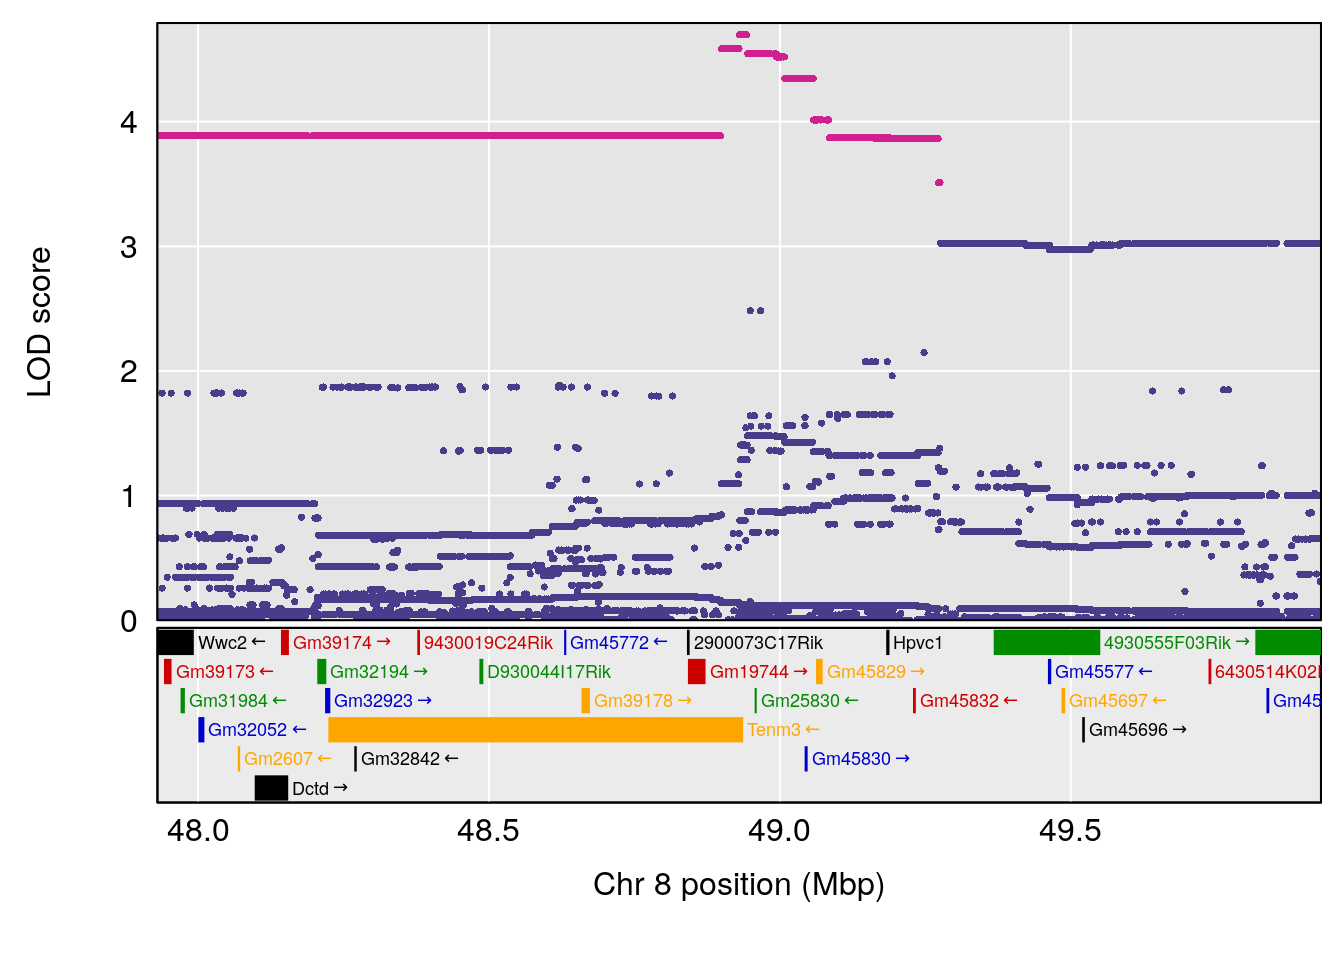
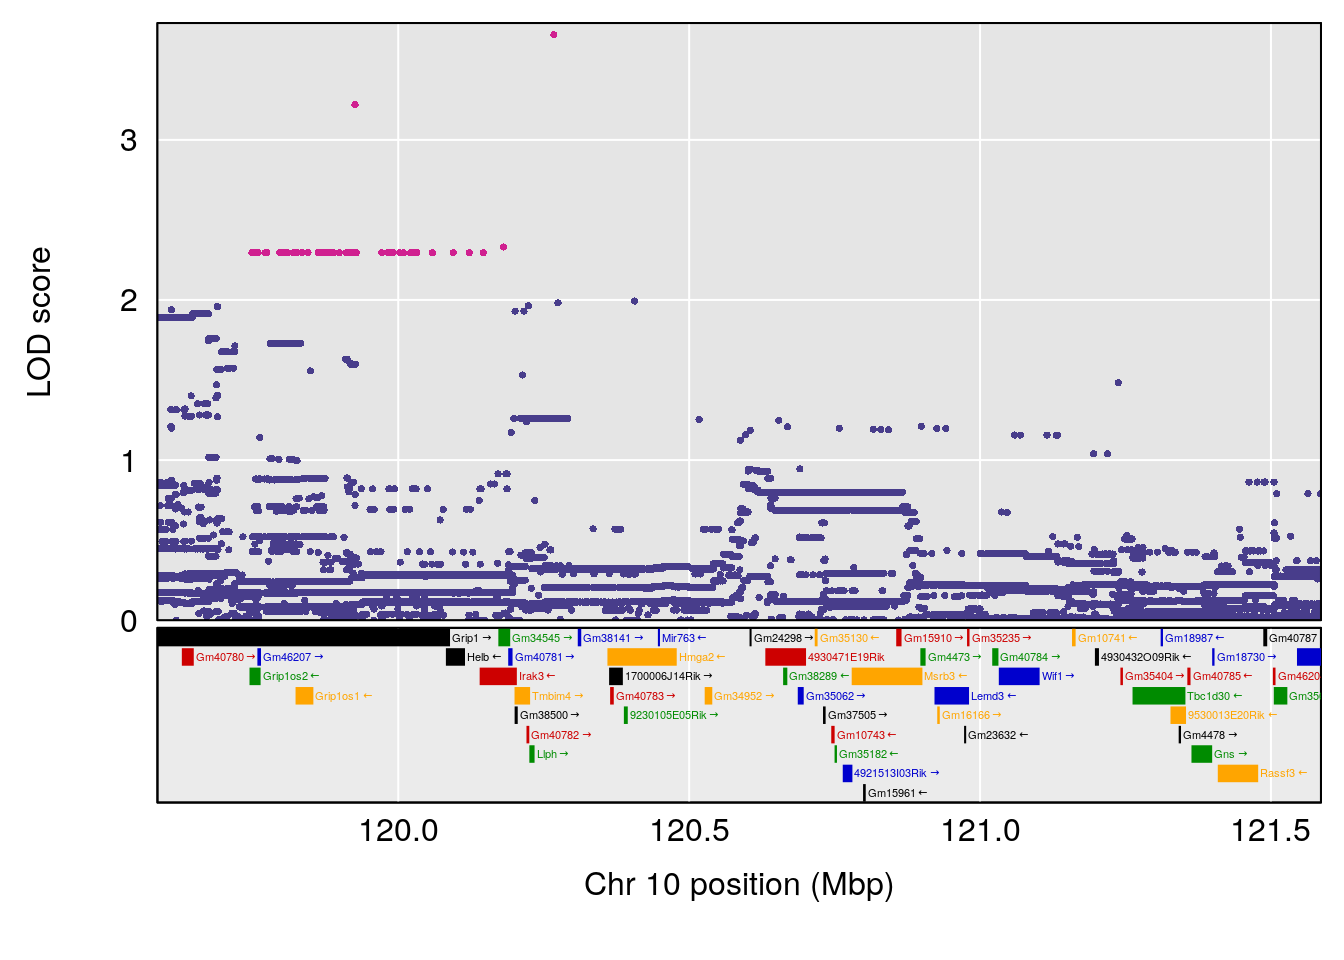
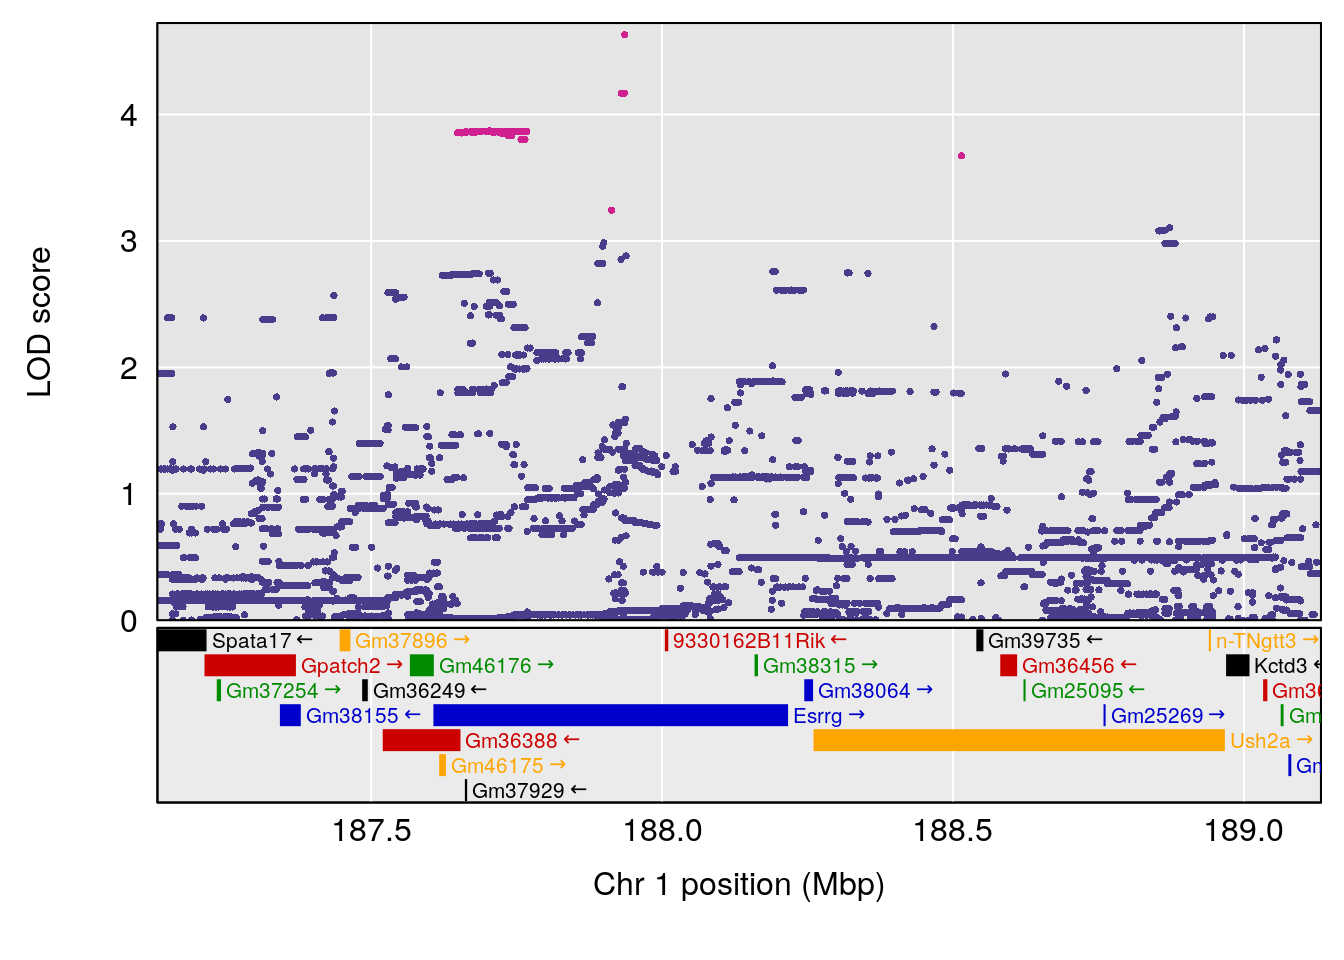
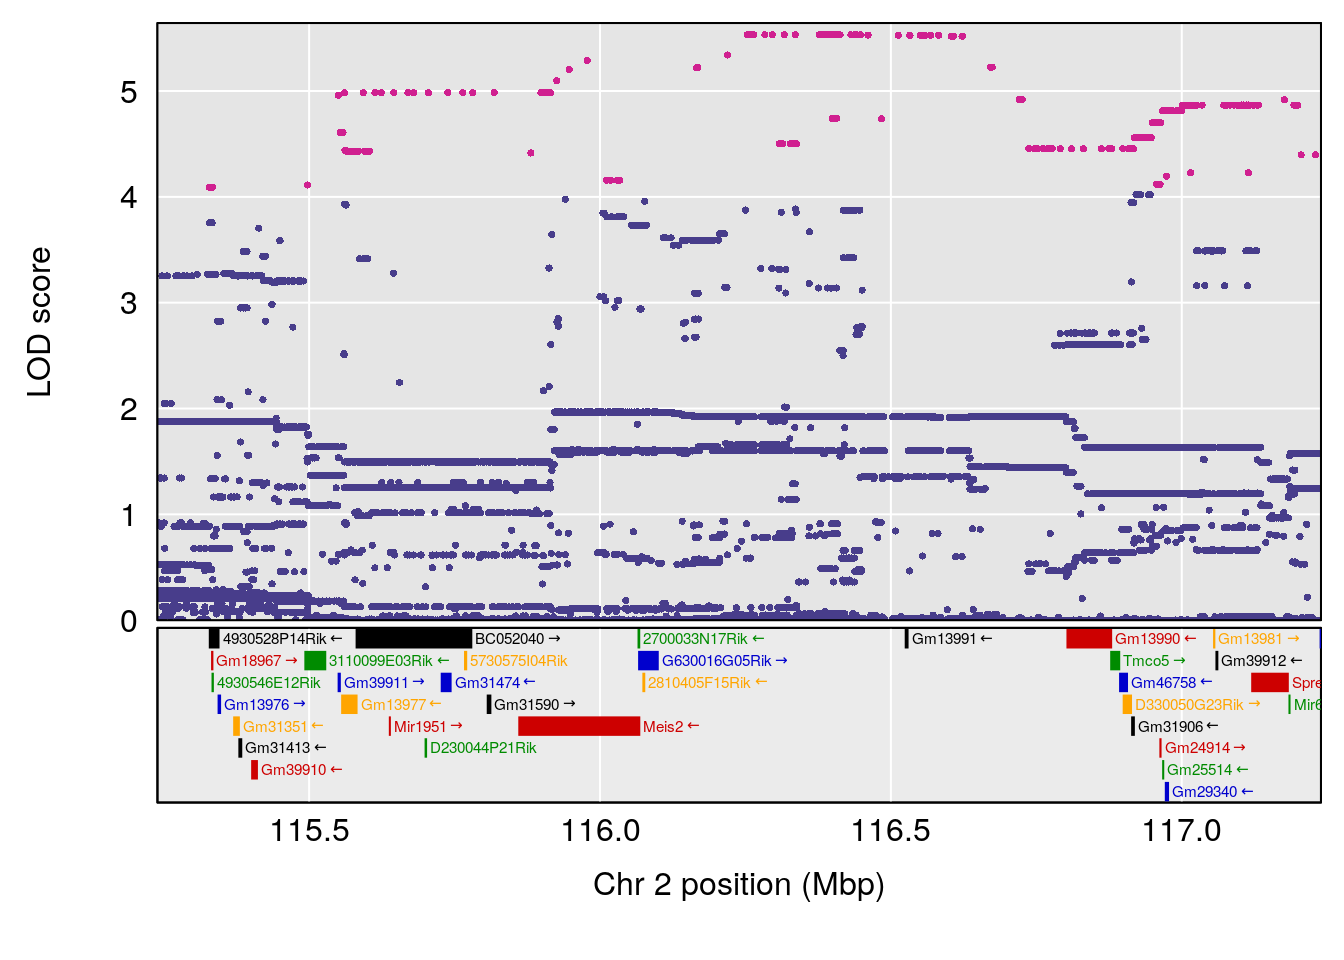
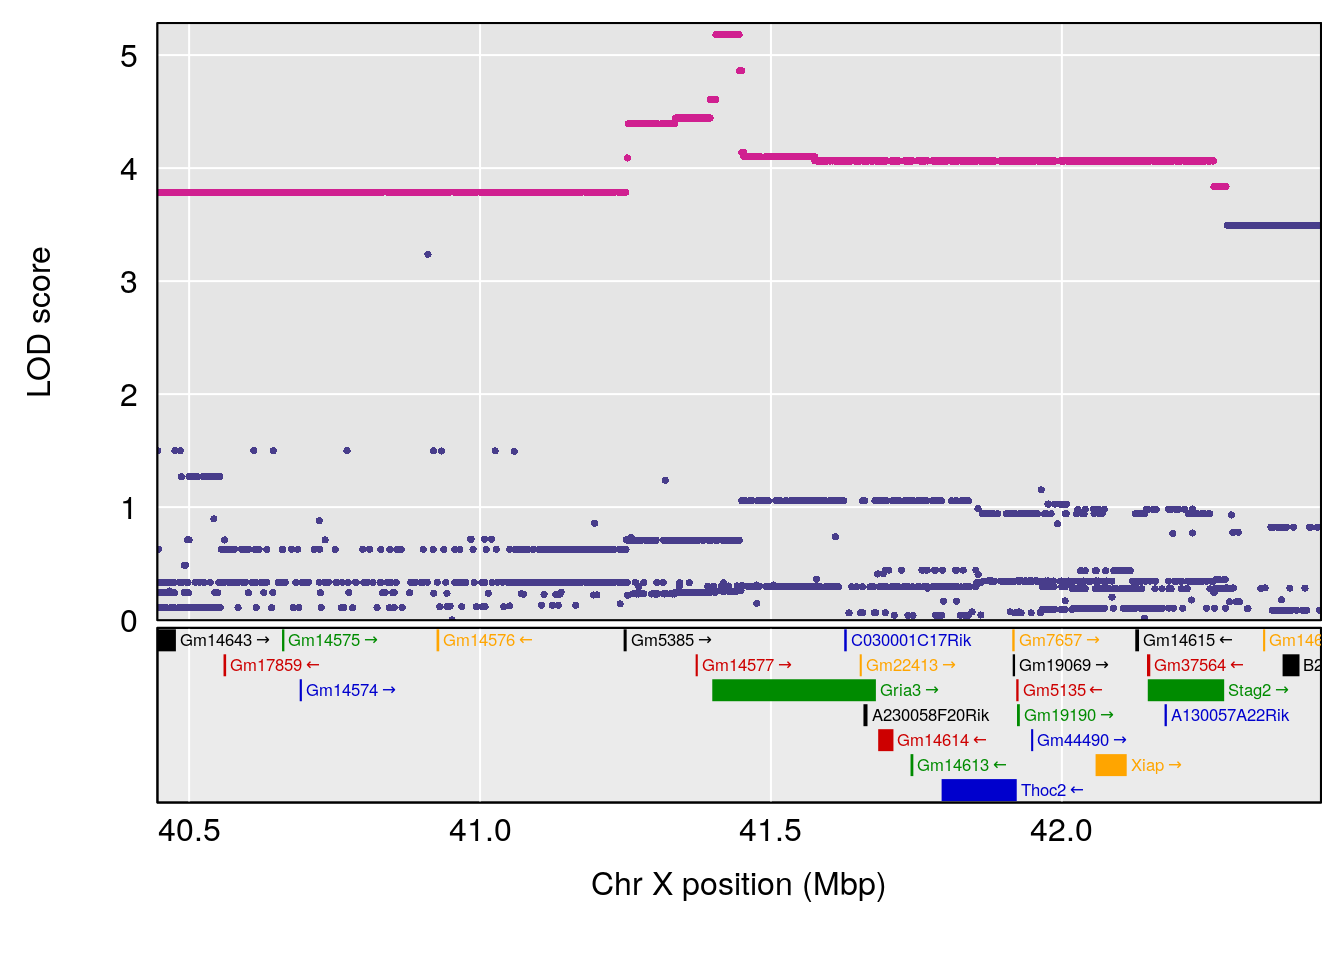
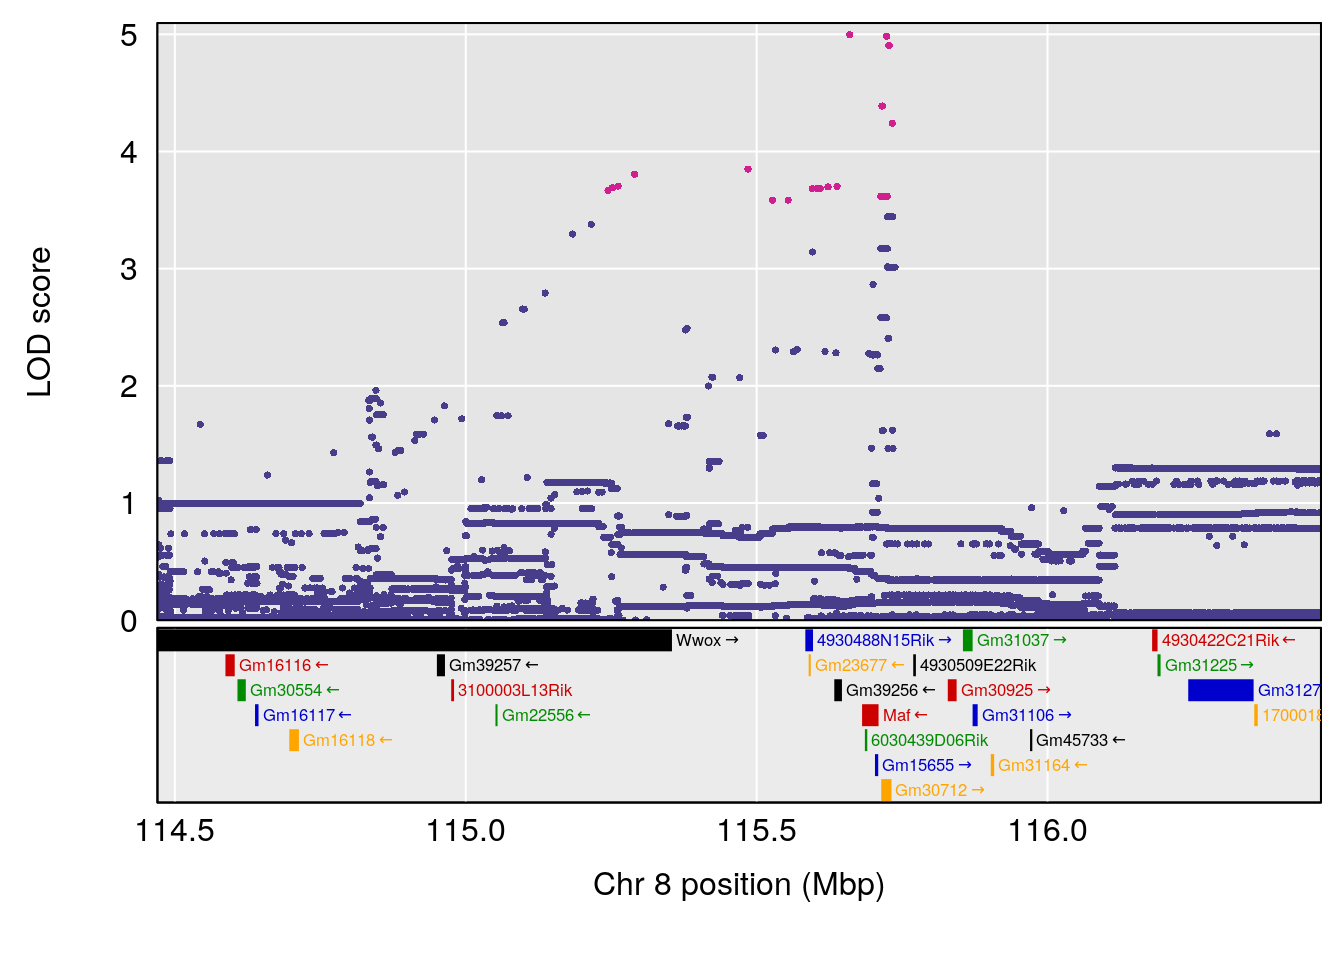
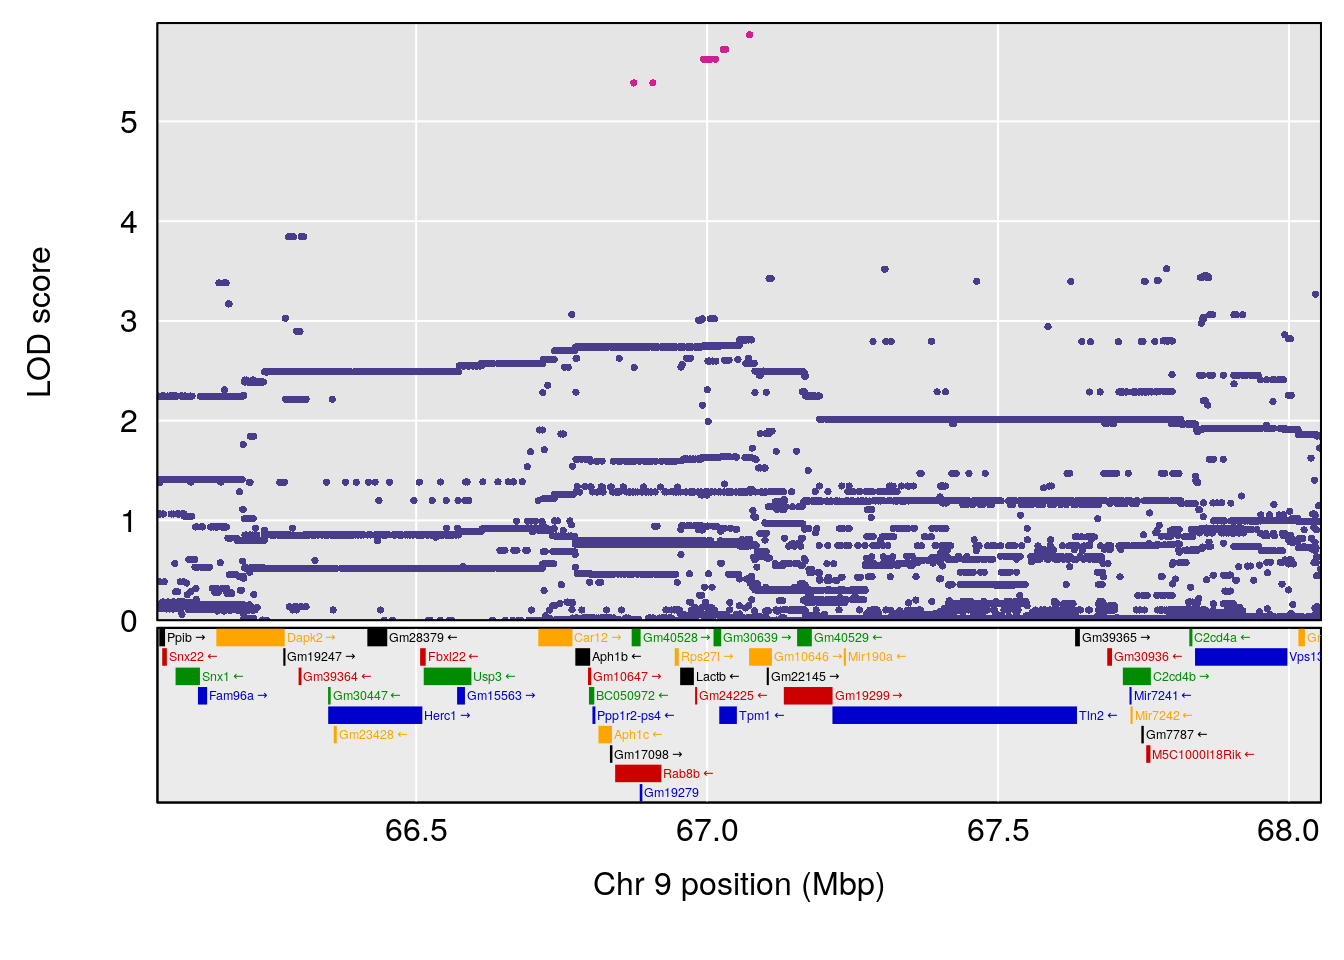
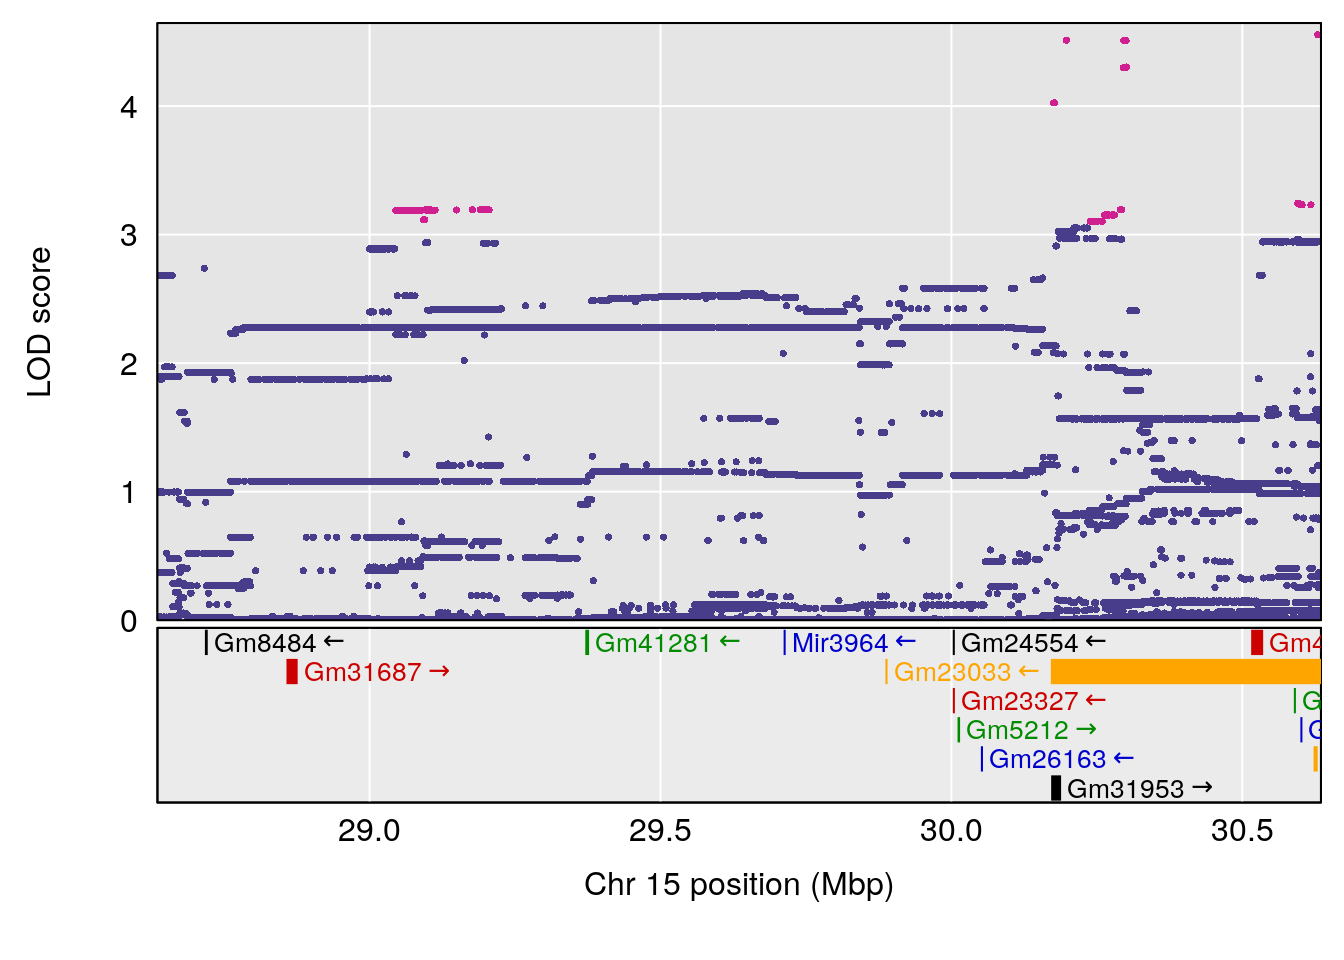
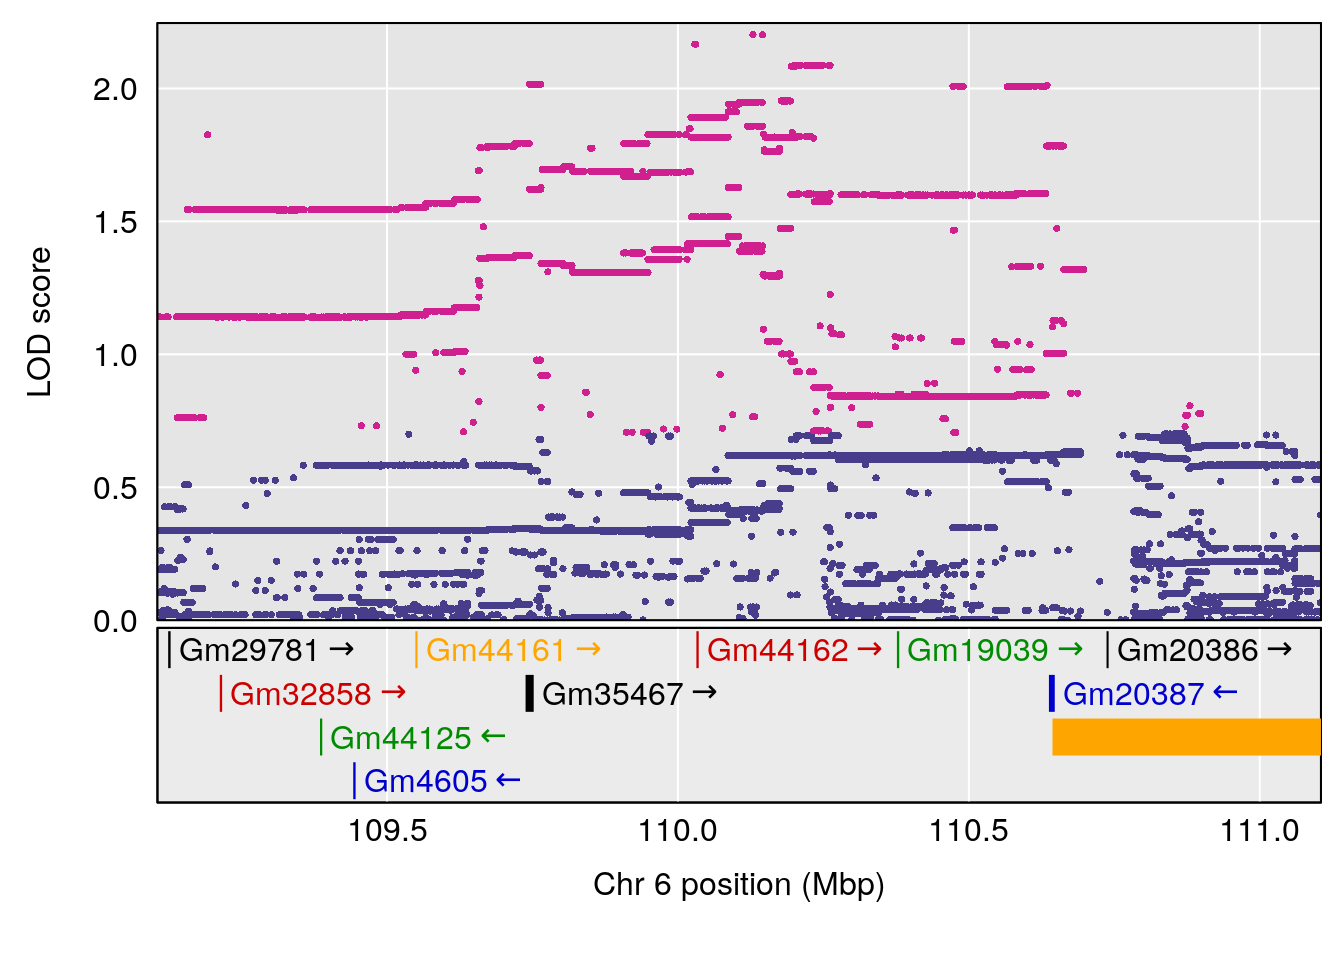
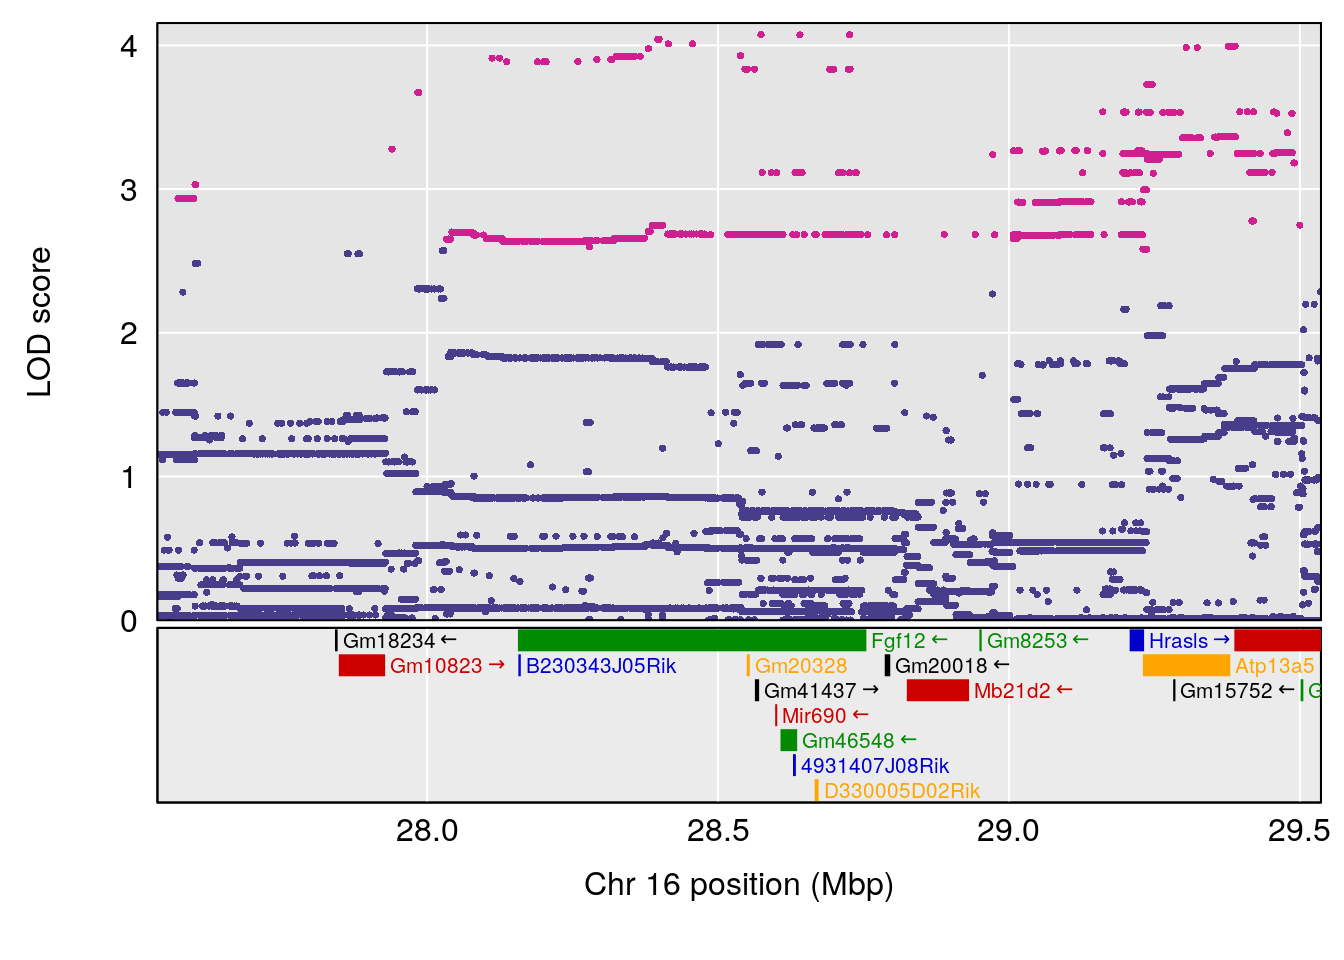
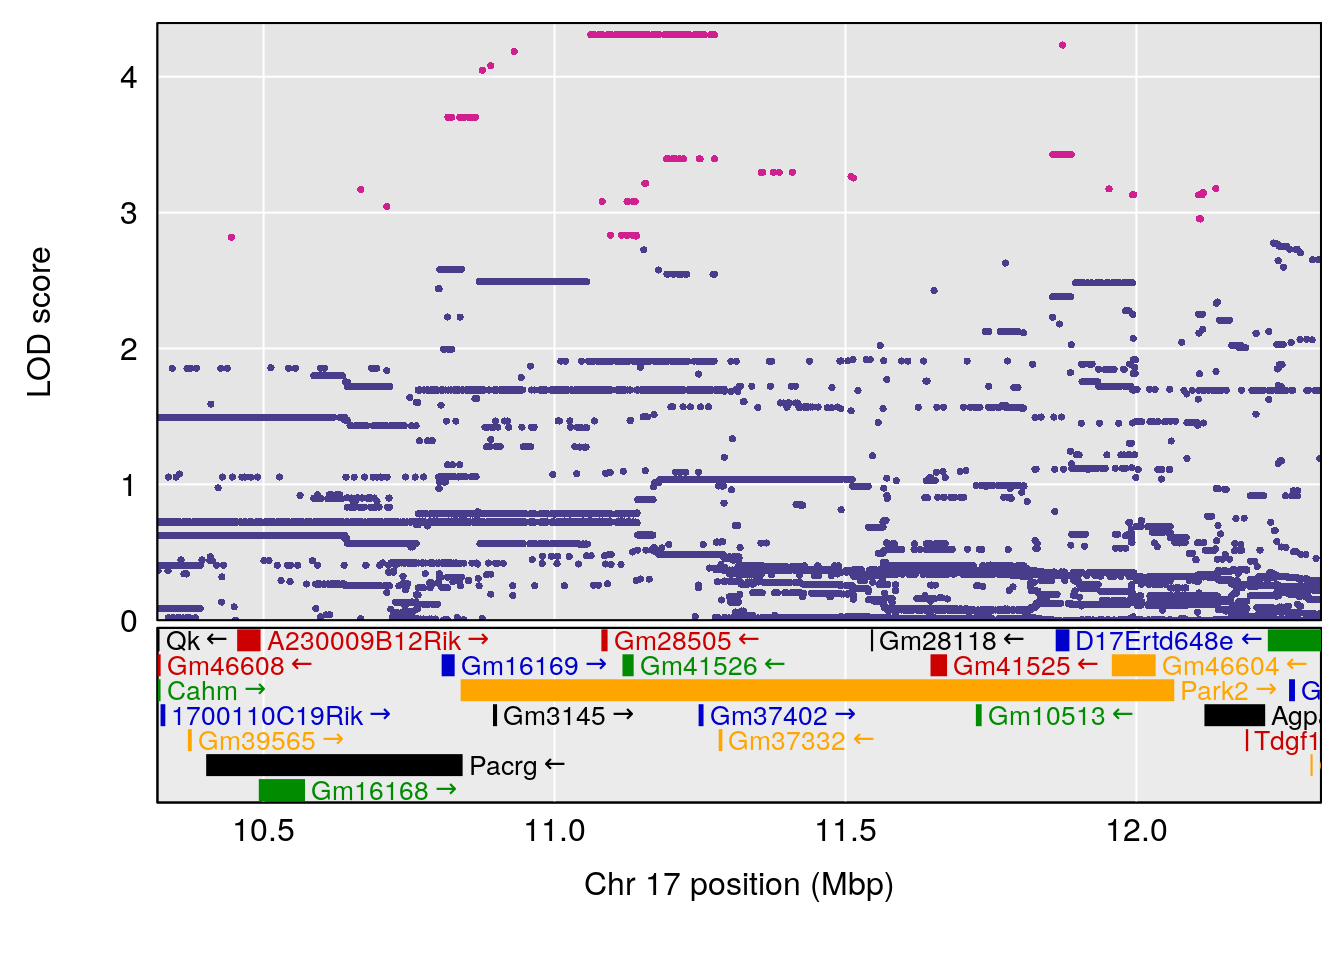
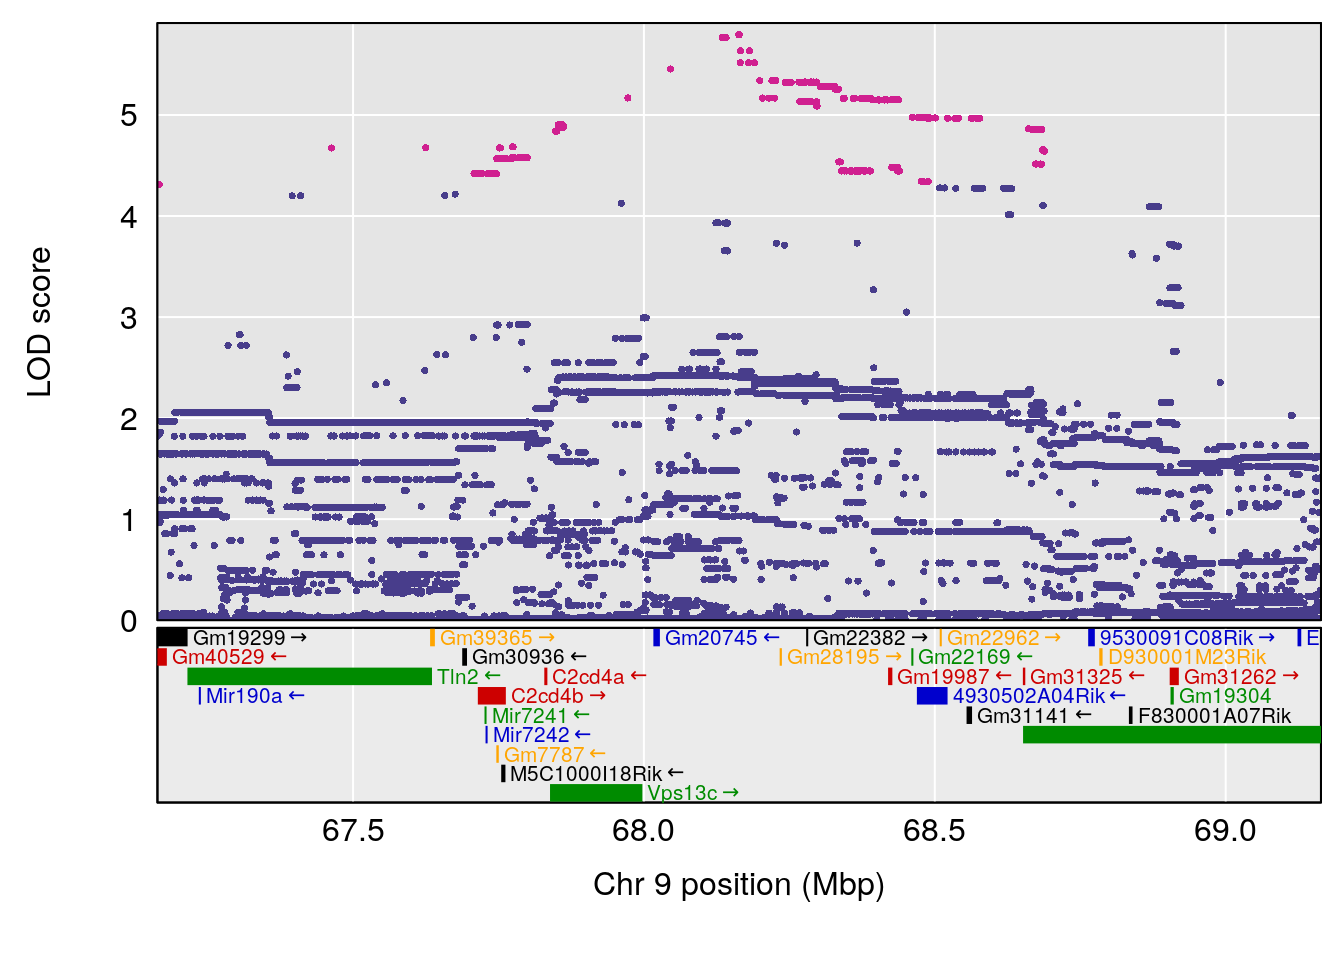
plot(out_snps[[i]][[p]]$lod, out_snps[[i]][[p]]$snpinfo, drop_hilit=1.5, genes=out_genes[[i]][[p]])
}
}
# [1] "Survival.Time"
# lodindex lodcolumn chr pos lod ci_lo ci_hi
# 1 1 pheno1 2 84.22989 6.046307 75.76507 162.24291
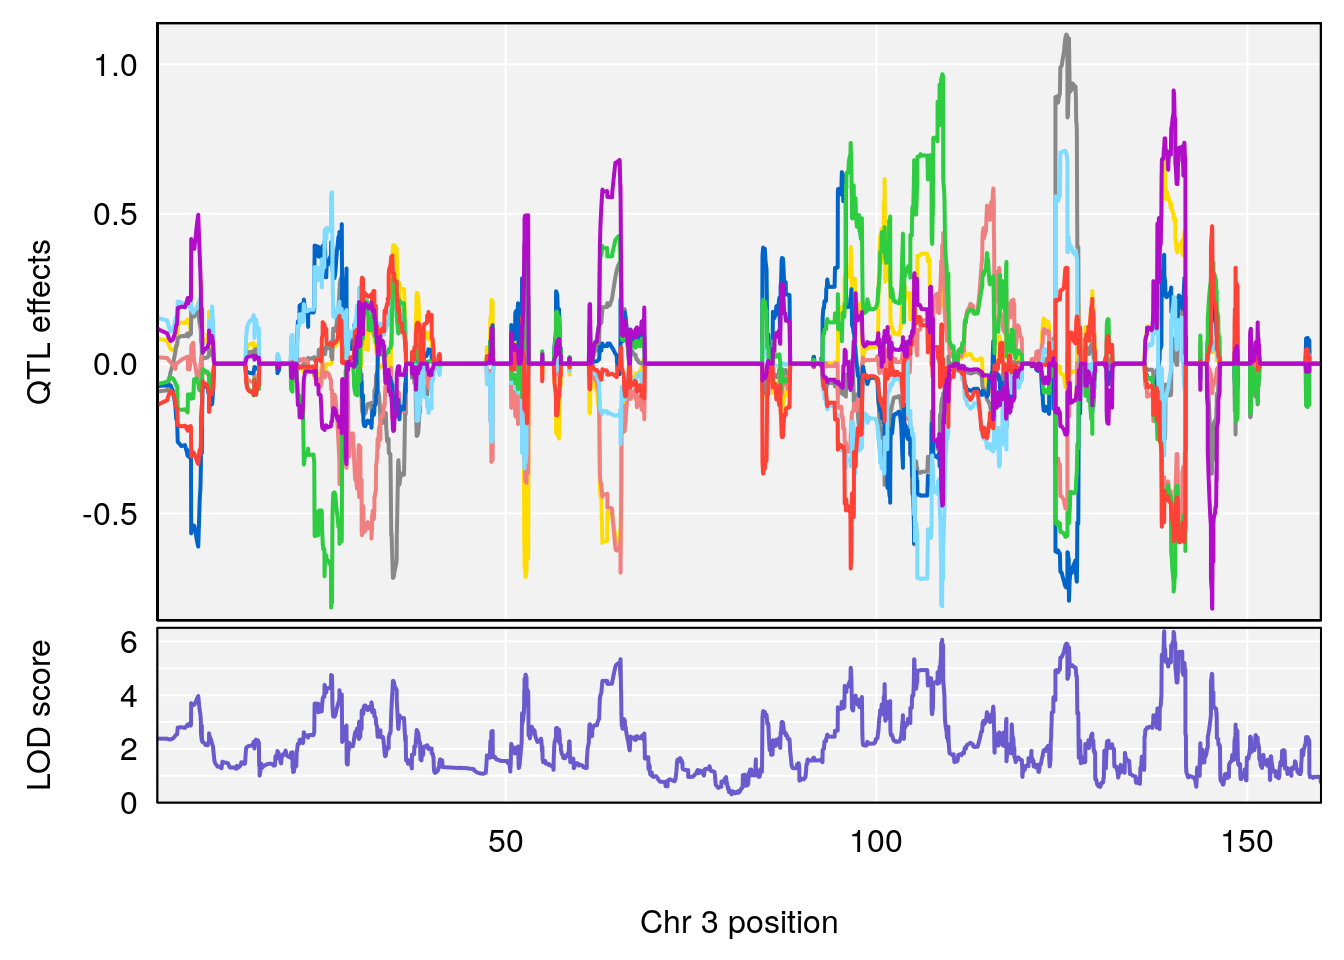
# 2 1 pheno1 3 138.79100 6.380273 64.39701 141.65520
# 3 1 pheno1 4 16.97218 6.542984 16.62465 18.61874
# 4 1 pheno1 6 147.65112 8.516164 93.37250 147.95398
# 5 1 pheno1 8 48.93015 6.406429 45.94523 49.27541
# 6 1 pheno1 10 120.58604 6.749862 119.72620 124.20834
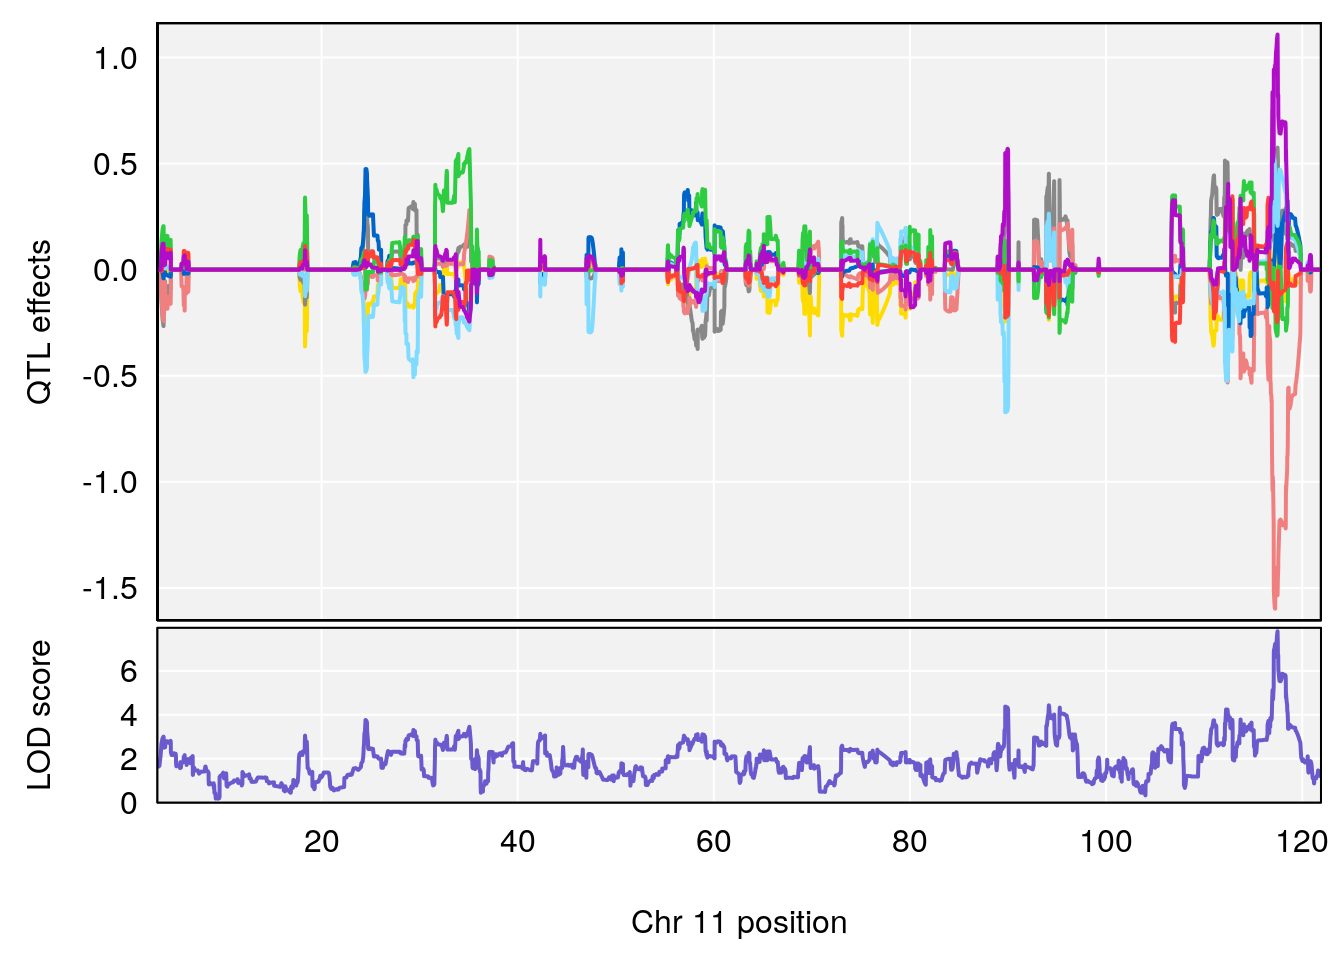
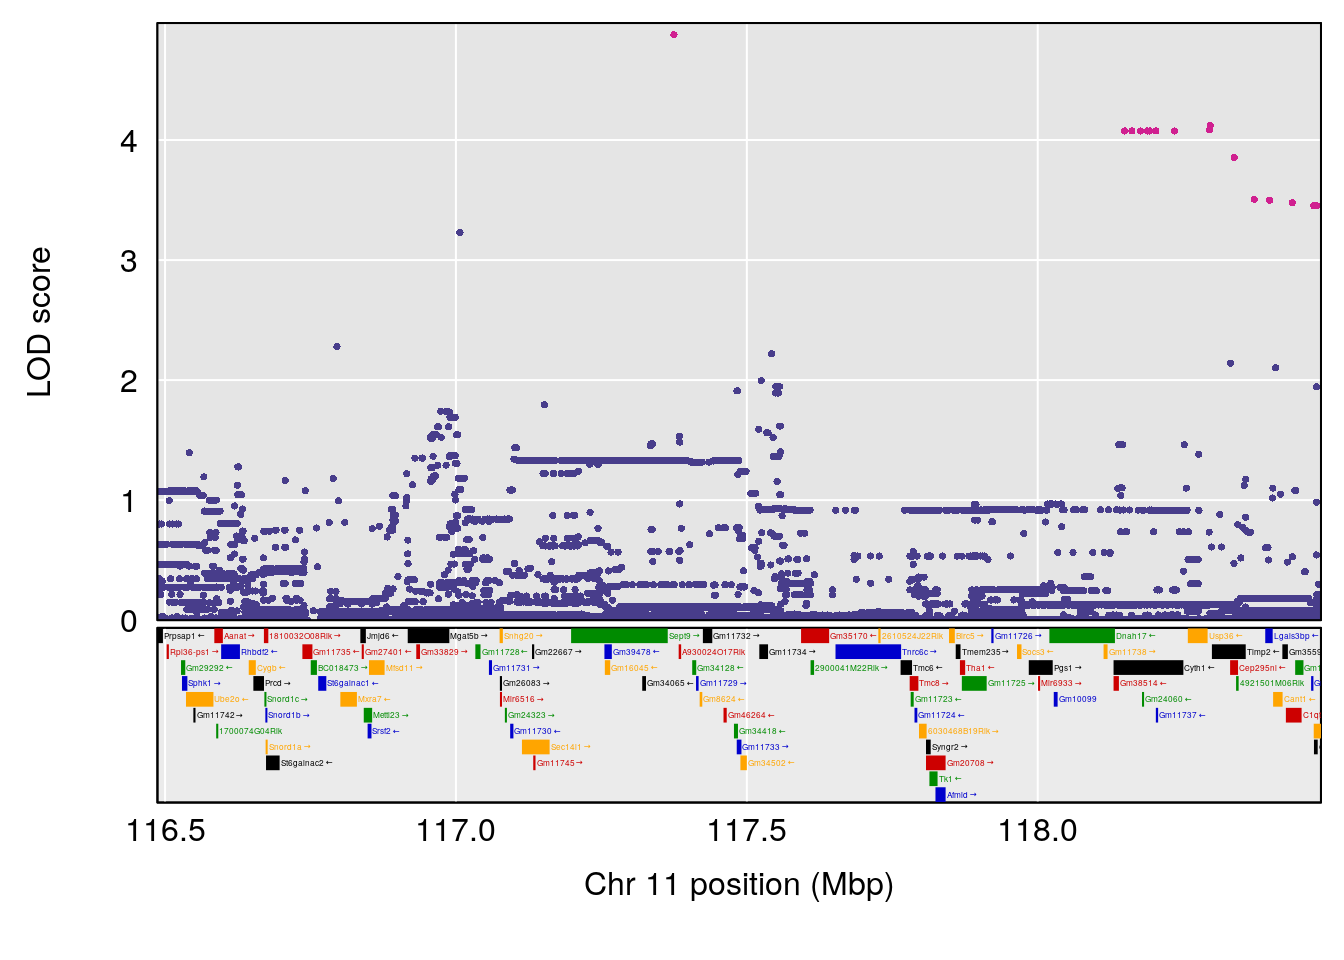
# 7 1 pheno1 11 117.48686 7.807276 117.09262 117.56616
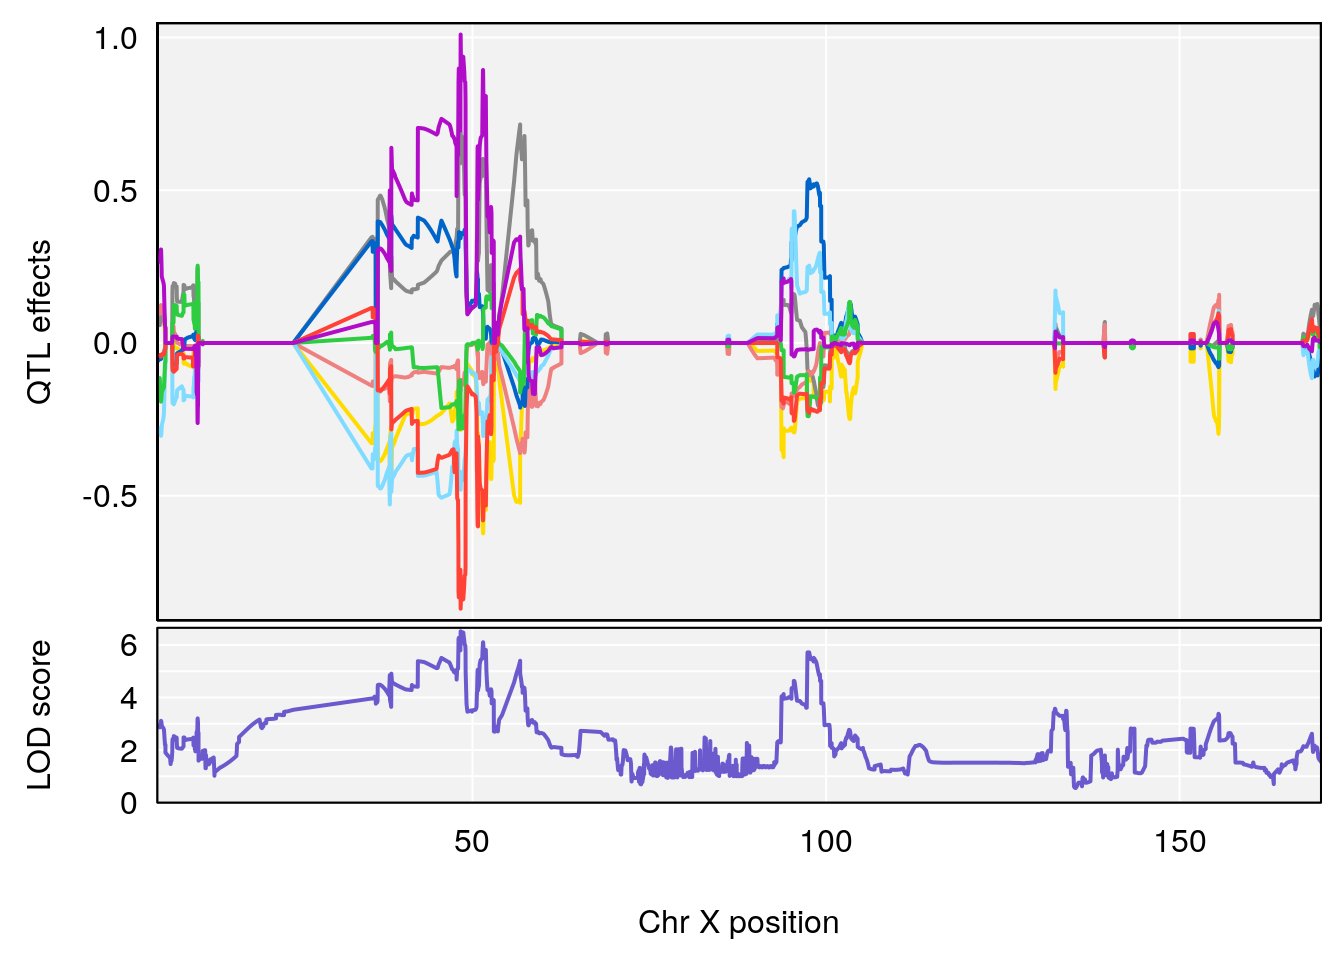
# 8 1 pheno1 X 48.33118 6.518895 42.26096 98.87872
# [1] 1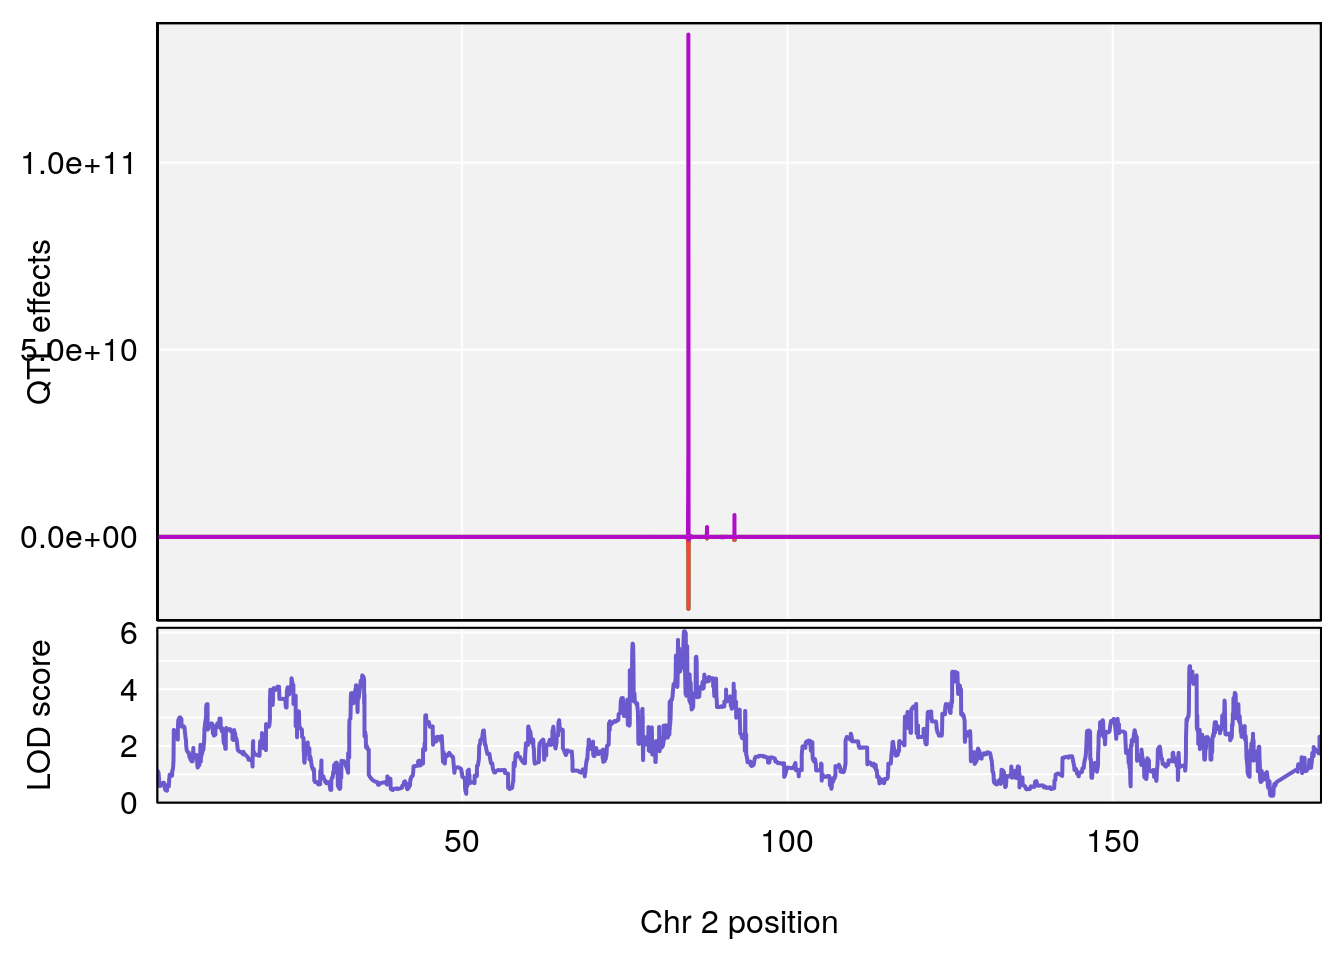
| Version | Author | Date |
|---|---|---|
| 8fe8543 | xhyuo | 2023-02-20 |
| Version | Author | Date |
|---|---|---|
| 8fe8543 | xhyuo | 2023-02-20 |
| Version | Author | Date |
|---|---|---|
| 8fe8543 | xhyuo | 2023-02-20 |
# [1] 2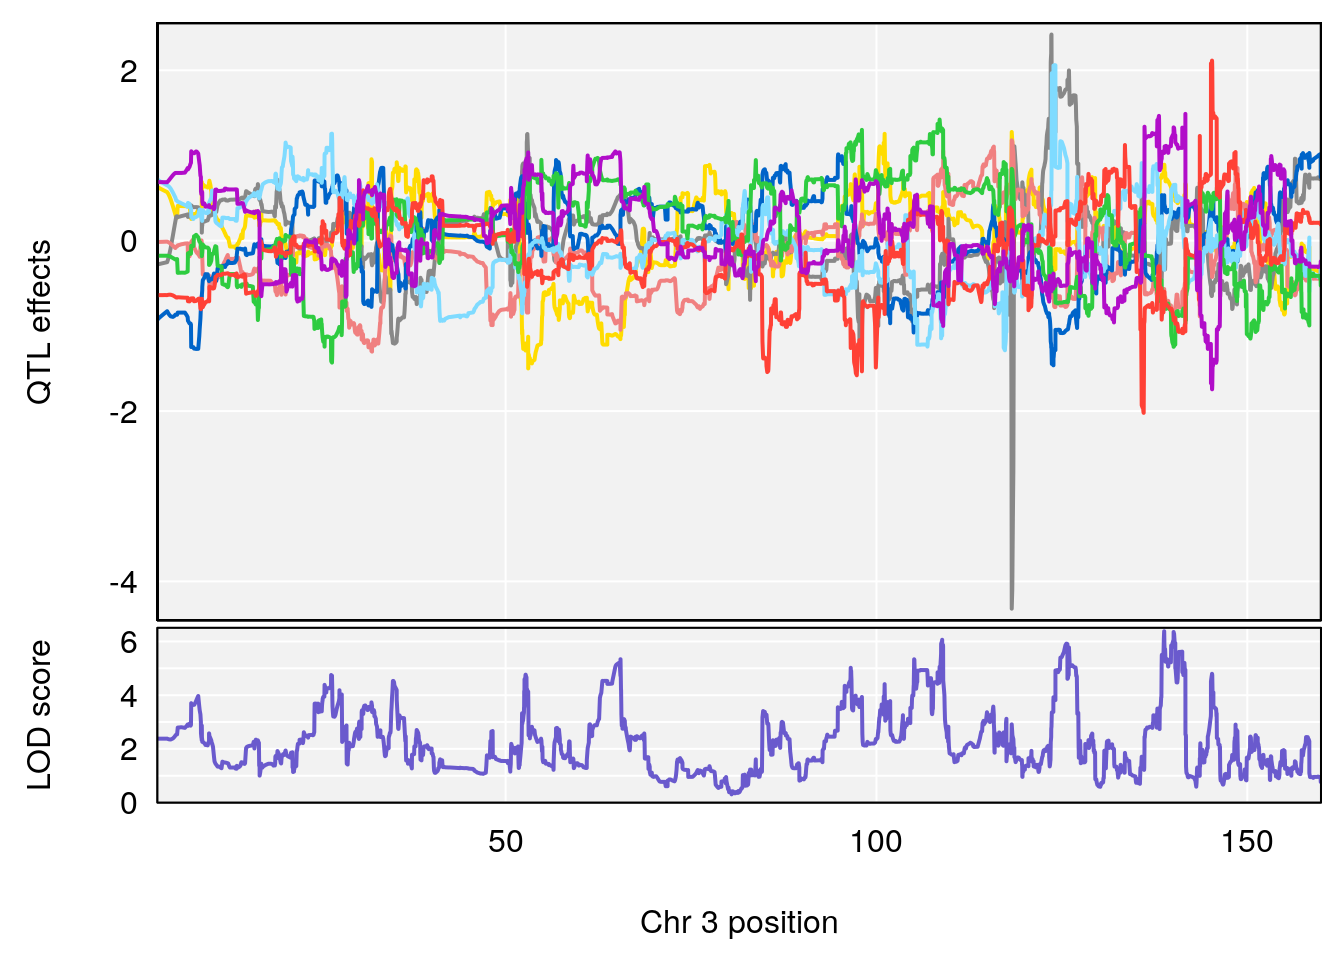
| Version | Author | Date |
|---|---|---|
| 8fe8543 | xhyuo | 2023-02-20 |
| Version | Author | Date |
|---|---|---|
| 8fe8543 | xhyuo | 2023-02-20 |
| Version | Author | Date |
|---|---|---|
| 8fe8543 | xhyuo | 2023-02-20 |
# [1] 3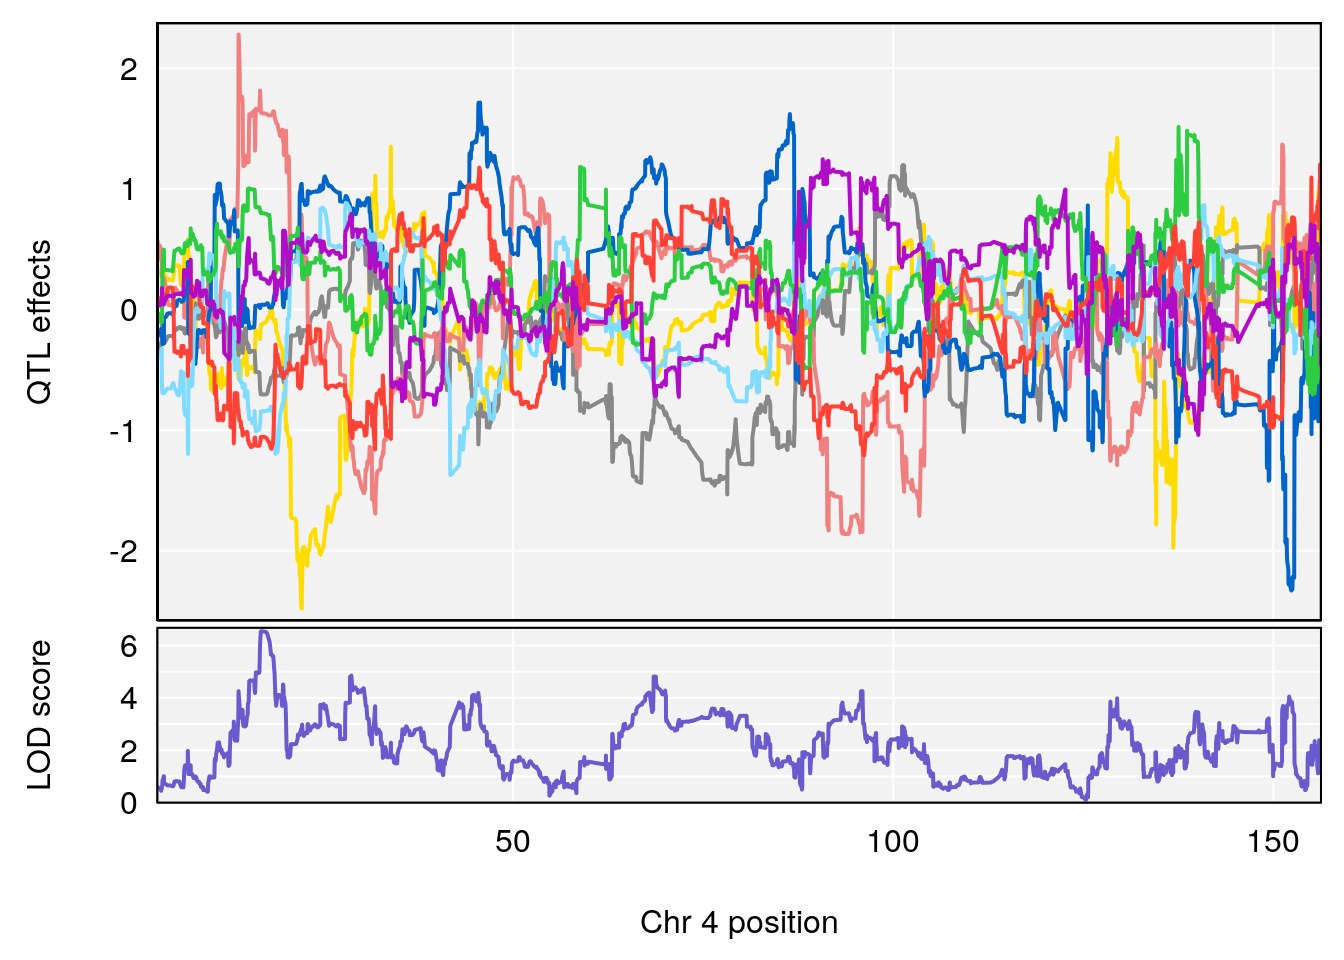
| Version | Author | Date |
|---|---|---|
| 8fe8543 | xhyuo | 2023-02-20 |
| Version | Author | Date |
|---|---|---|
| 8fe8543 | xhyuo | 2023-02-20 |
| Version | Author | Date |
|---|---|---|
| 8fe8543 | xhyuo | 2023-02-20 |
# [1] 4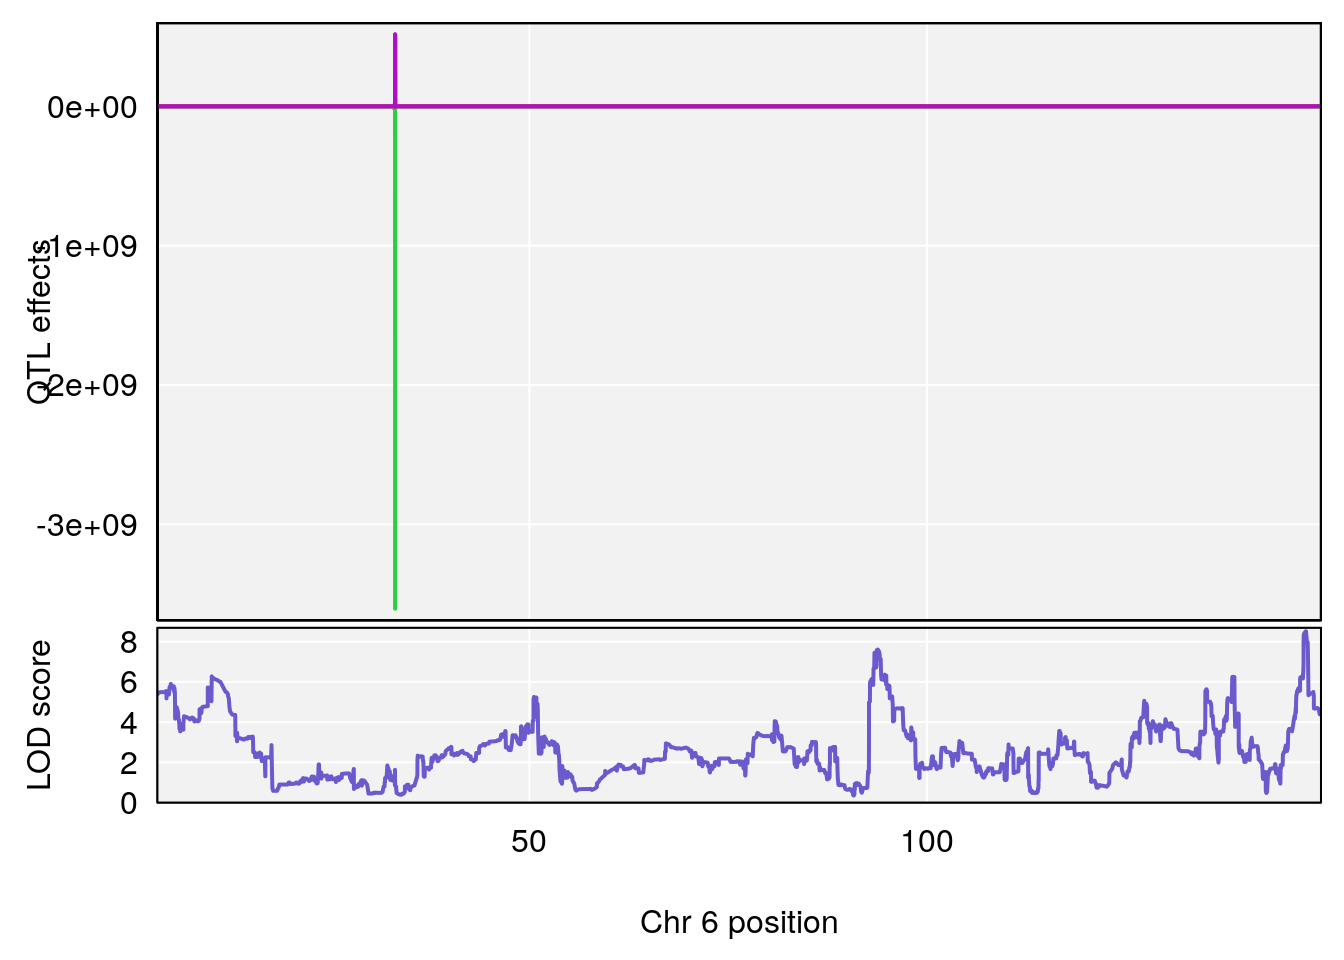
| Version | Author | Date |
|---|---|---|
| 8fe8543 | xhyuo | 2023-02-20 |
| Version | Author | Date |
|---|---|---|
| 8fe8543 | xhyuo | 2023-02-20 |
| Version | Author | Date |
|---|---|---|
| 8fe8543 | xhyuo | 2023-02-20 |
# [1] 5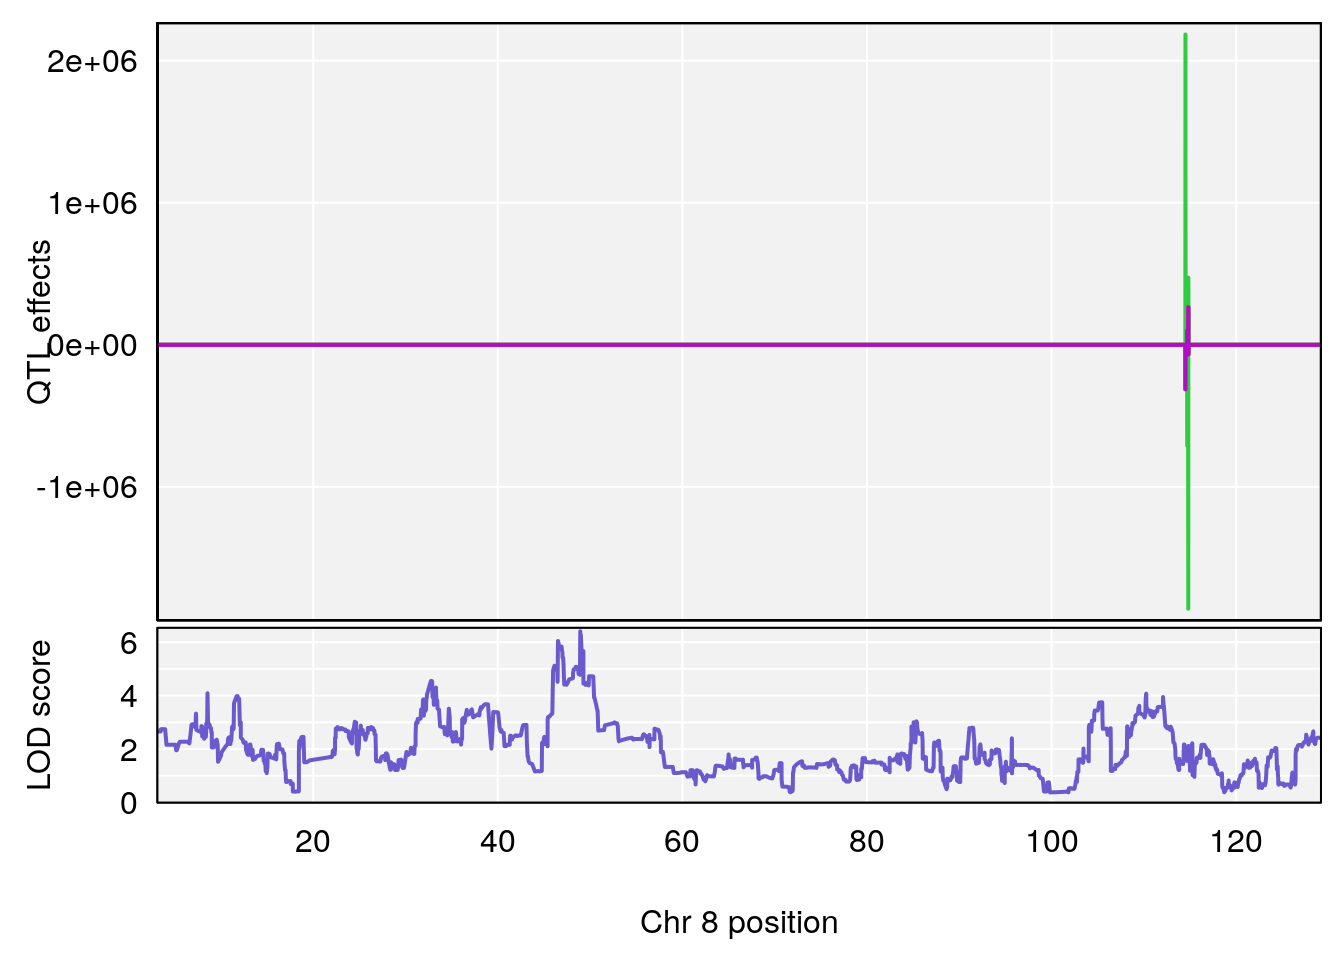
| Version | Author | Date |
|---|---|---|
| 8fe8543 | xhyuo | 2023-02-20 |
| Version | Author | Date |
|---|---|---|
| 8fe8543 | xhyuo | 2023-02-20 |
| Version | Author | Date |
|---|---|---|
| 8fe8543 | xhyuo | 2023-02-20 |
# [1] 6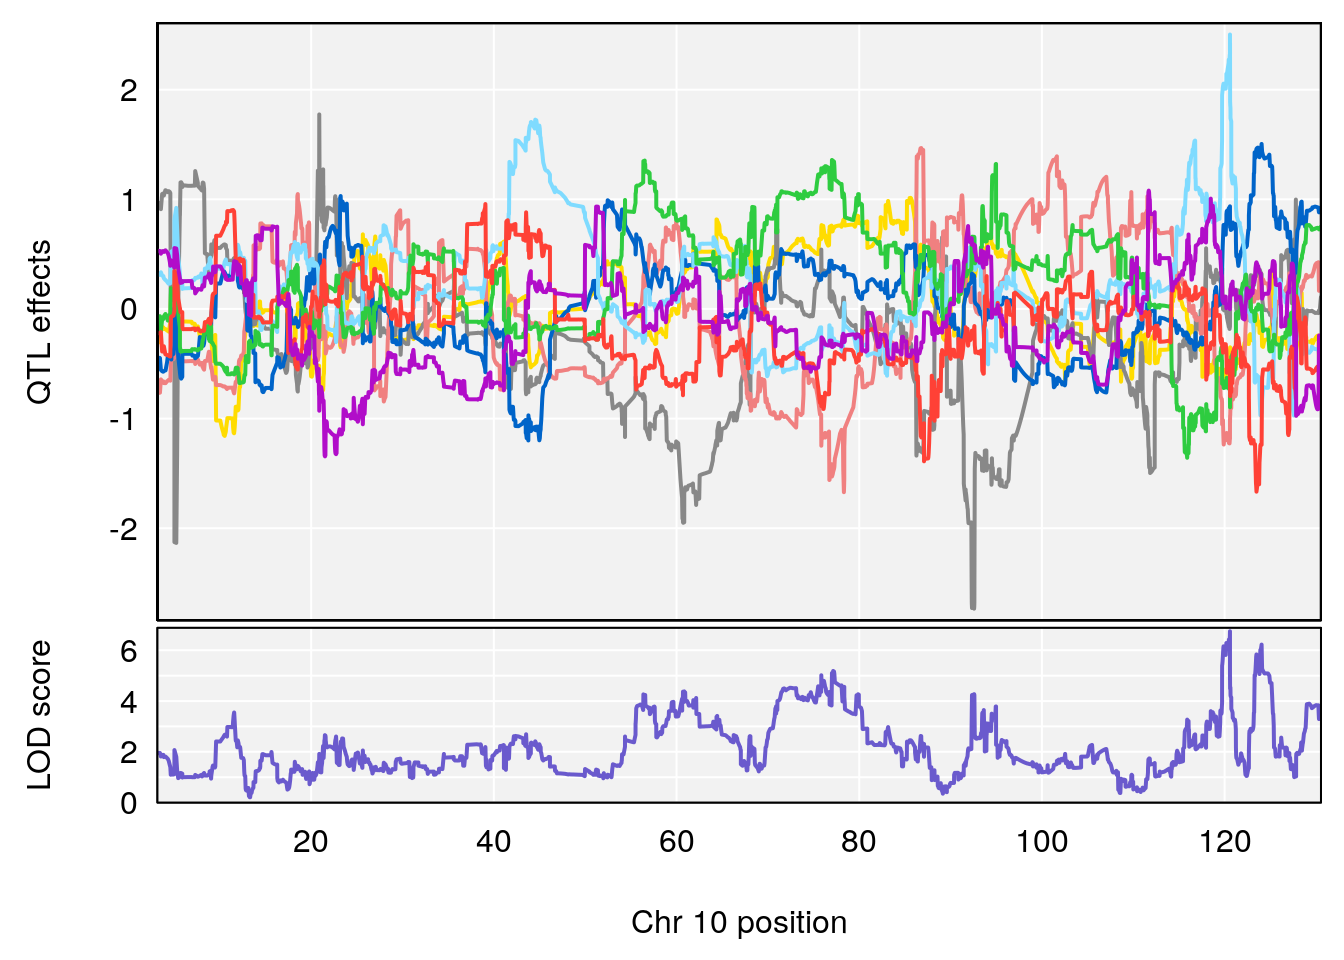
| Version | Author | Date |
|---|---|---|
| 8fe8543 | xhyuo | 2023-02-20 |
| Version | Author | Date |
|---|---|---|
| 8fe8543 | xhyuo | 2023-02-20 |
| Version | Author | Date |
|---|---|---|
| 8fe8543 | xhyuo | 2023-02-20 |
# [1] 7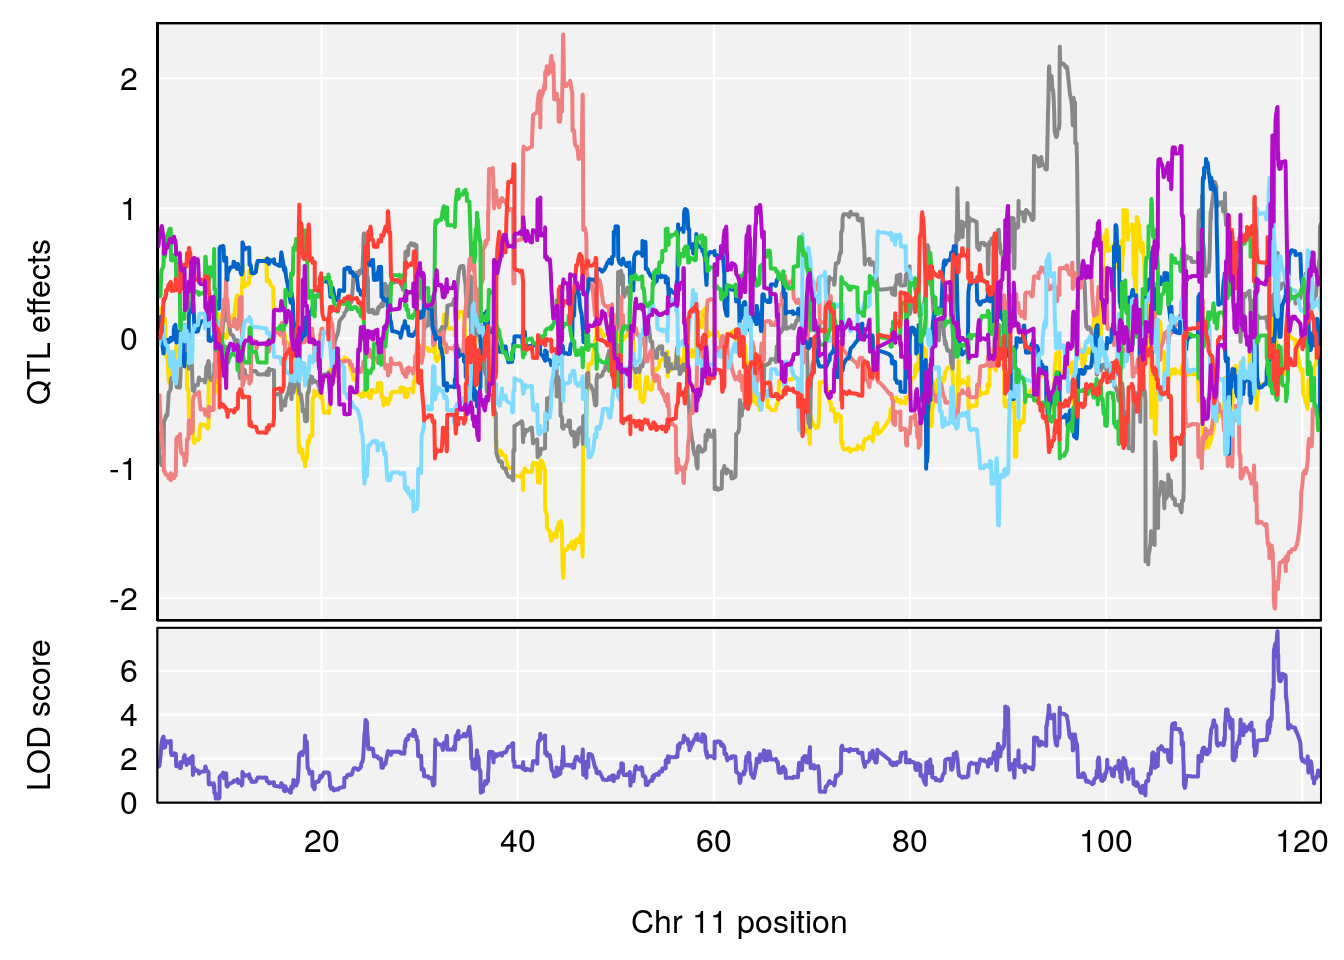
| Version | Author | Date |
|---|---|---|
| 8fe8543 | xhyuo | 2023-02-20 |
| Version | Author | Date |
|---|---|---|
| 8fe8543 | xhyuo | 2023-02-20 |
| Version | Author | Date |
|---|---|---|
| 8fe8543 | xhyuo | 2023-02-20 |
# [1] 8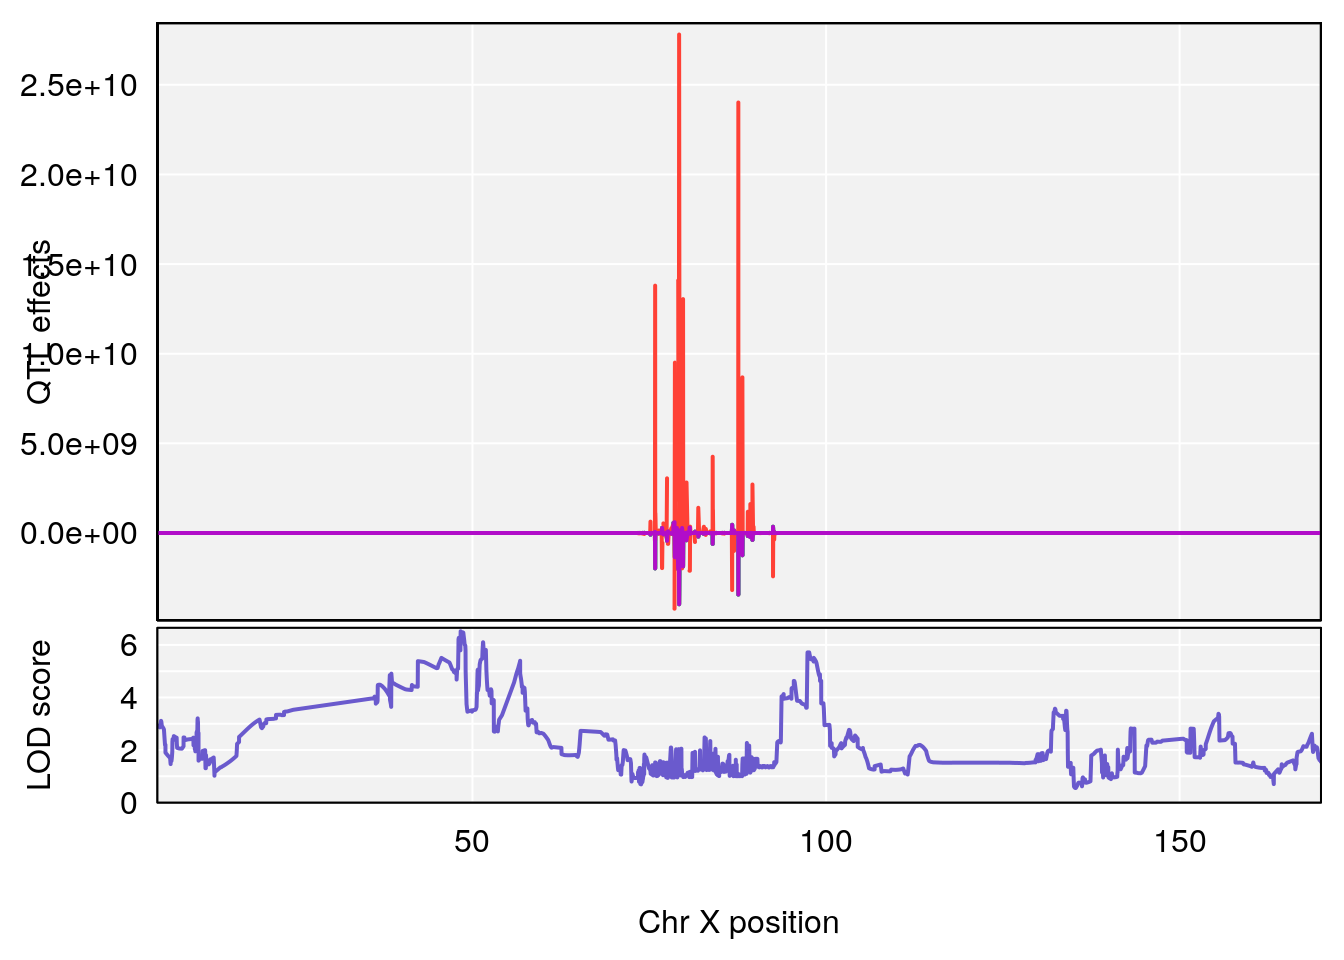
| Version | Author | Date |
|---|---|---|
| 8fe8543 | xhyuo | 2023-02-20 |
| Version | Author | Date |
|---|---|---|
| 8fe8543 | xhyuo | 2023-02-20 |
| Version | Author | Date |
|---|---|---|
| 8fe8543 | xhyuo | 2023-02-20 |
# [1] "Recovery.Time"
# lodindex lodcolumn chr pos lod ci_lo ci_hi
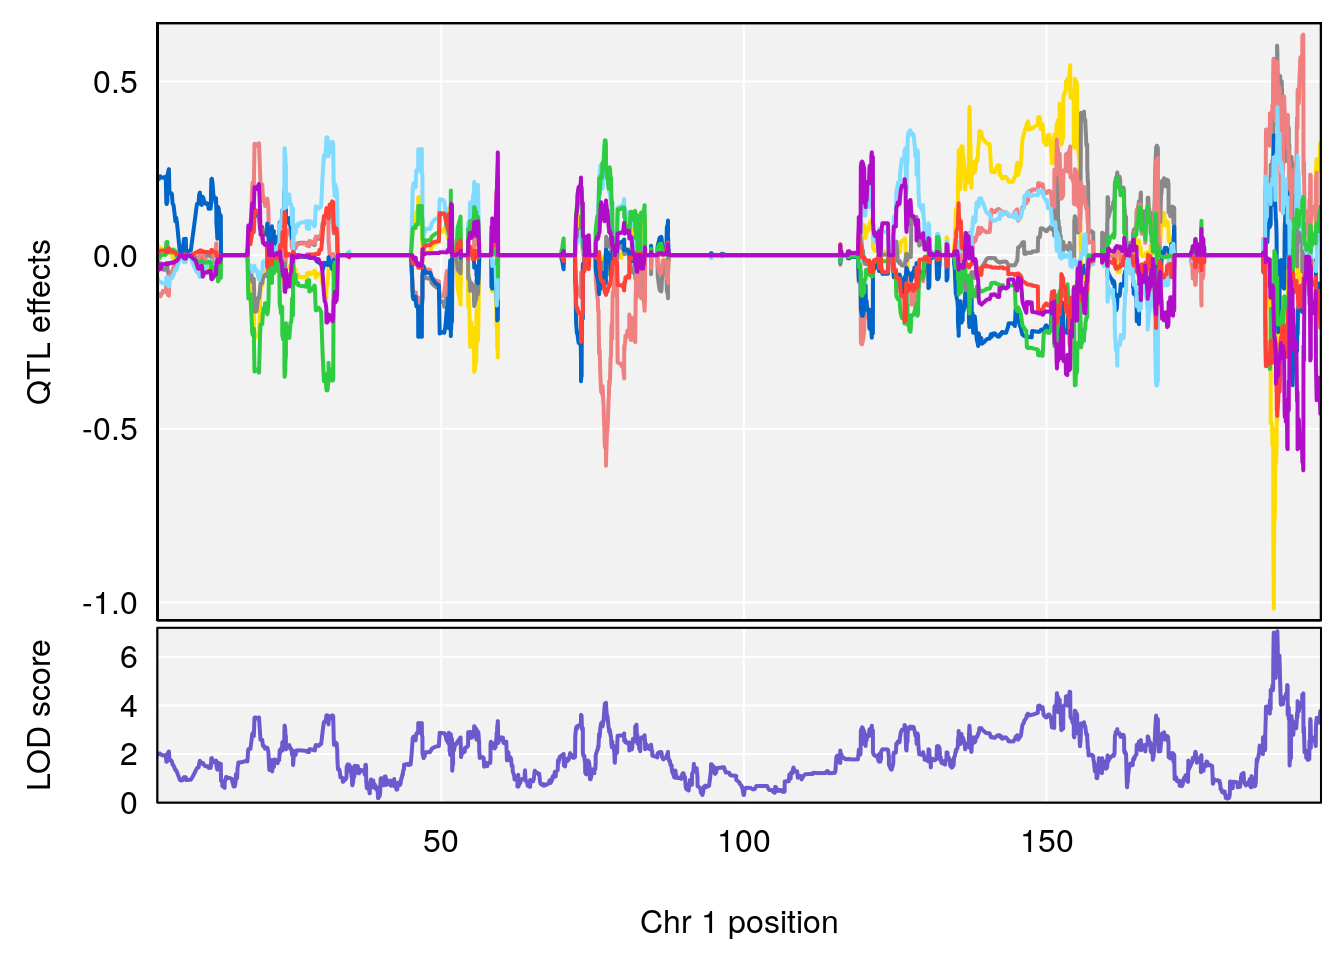
# 1 1 pheno1 1 188.13243 7.053141 187.4489 188.56172
# 2 1 pheno1 2 116.23927 7.091868 114.6279 117.24777
# 3 1 pheno1 7 134.72640 6.233802 134.1477 134.83353
# 4 1 pheno1 19 15.78318 6.236367 11.6891 16.37066
# [1] 1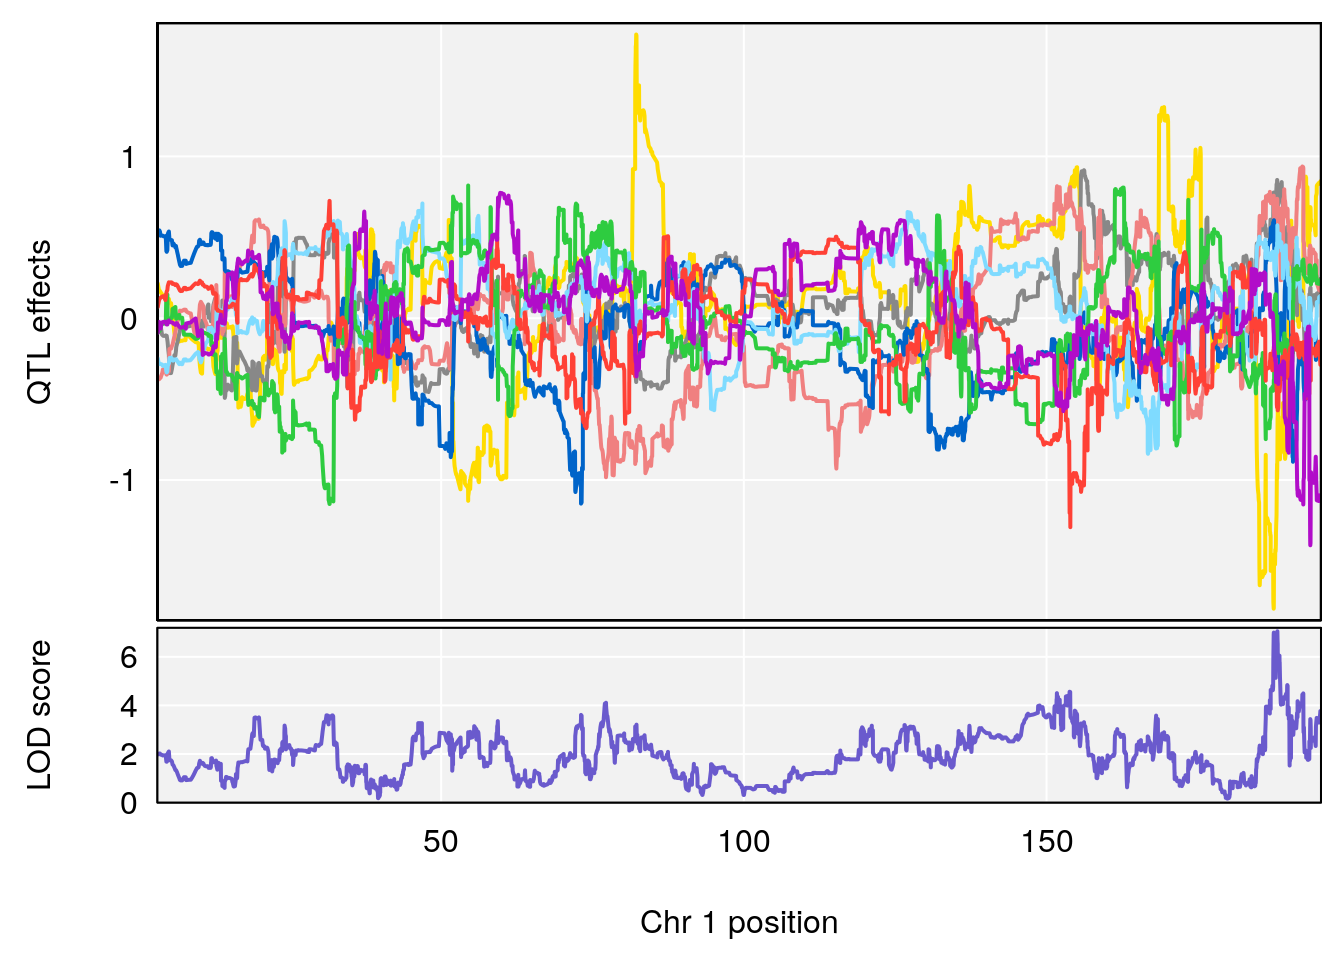
| Version | Author | Date |
|---|---|---|
| 8fe8543 | xhyuo | 2023-02-20 |
| Version | Author | Date |
|---|---|---|
| 8fe8543 | xhyuo | 2023-02-20 |
| Version | Author | Date |
|---|---|---|
| 8fe8543 | xhyuo | 2023-02-20 |
# [1] 2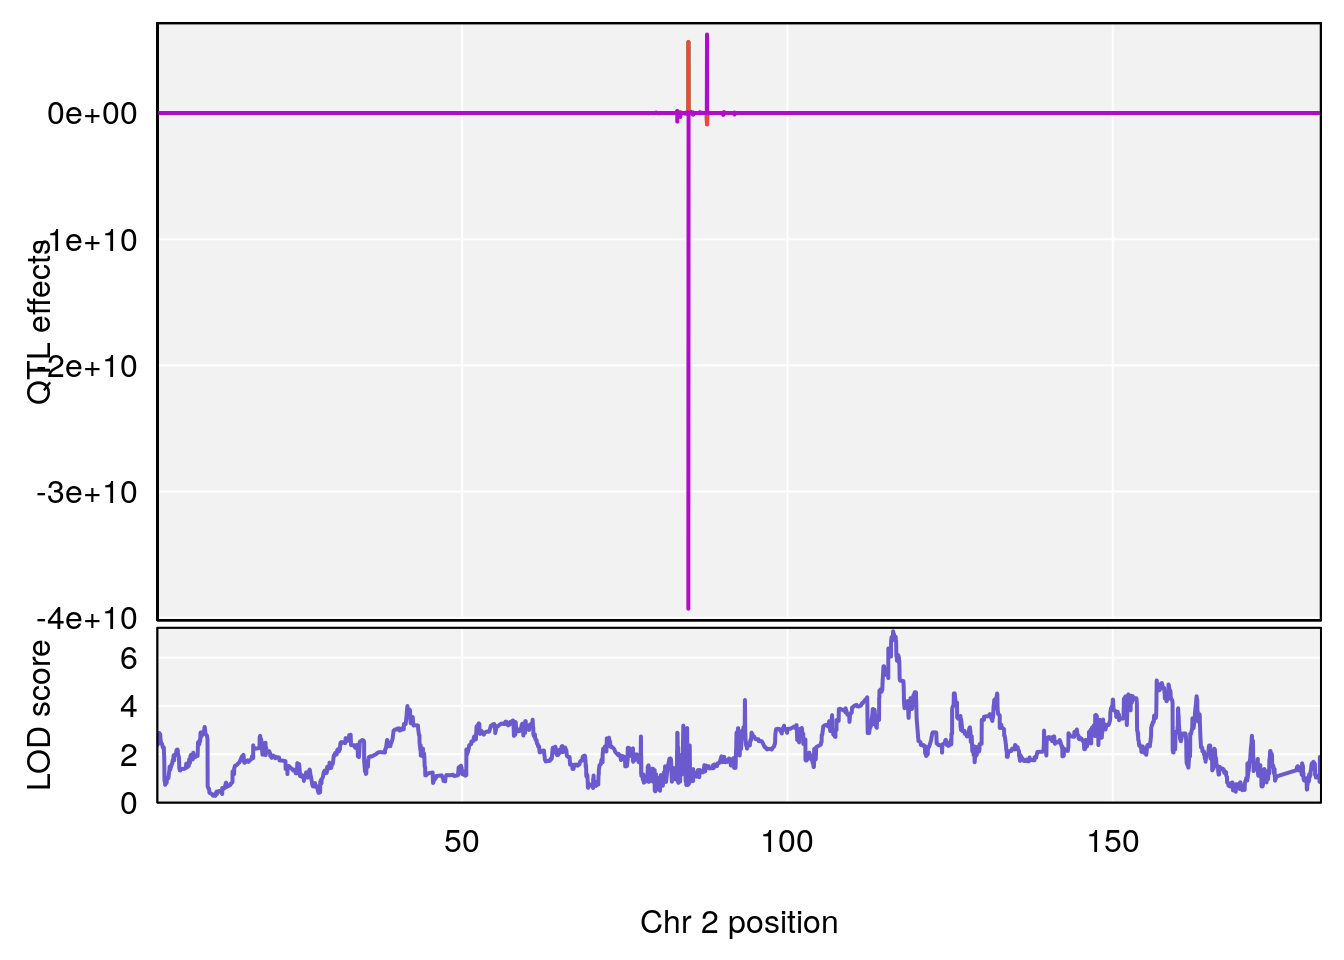
| Version | Author | Date |
|---|---|---|
| 8fe8543 | xhyuo | 2023-02-20 |
| Version | Author | Date |
|---|---|---|
| 8fe8543 | xhyuo | 2023-02-20 |
| Version | Author | Date |
|---|---|---|
| 8fe8543 | xhyuo | 2023-02-20 |
# [1] 3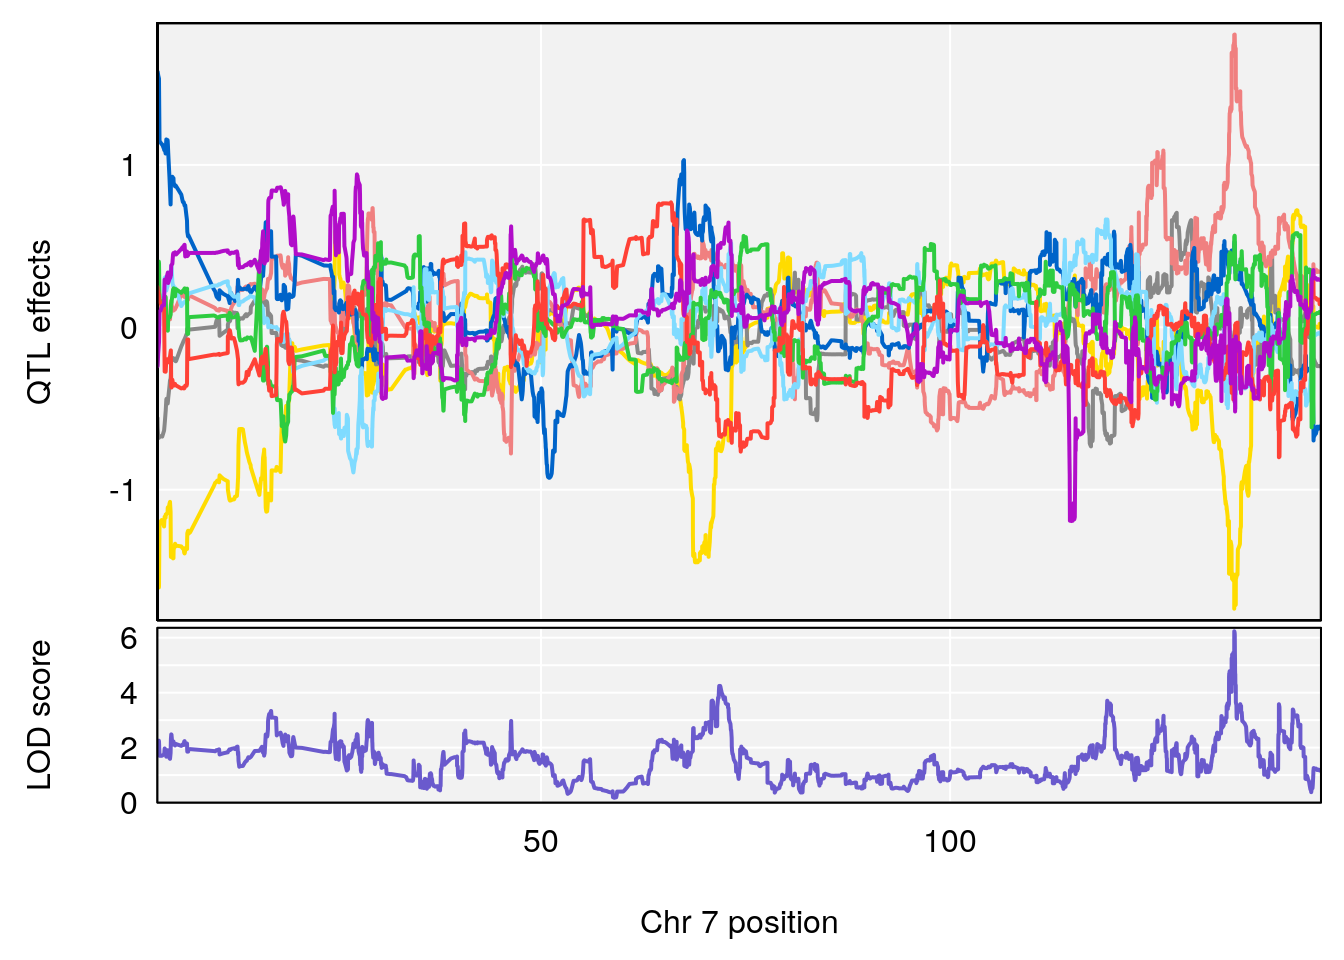
| Version | Author | Date |
|---|---|---|
| 8fe8543 | xhyuo | 2023-02-20 |
| Version | Author | Date |
|---|---|---|
| 8fe8543 | xhyuo | 2023-02-20 |
| Version | Author | Date |
|---|---|---|
| 8fe8543 | xhyuo | 2023-02-20 |
# [1] 4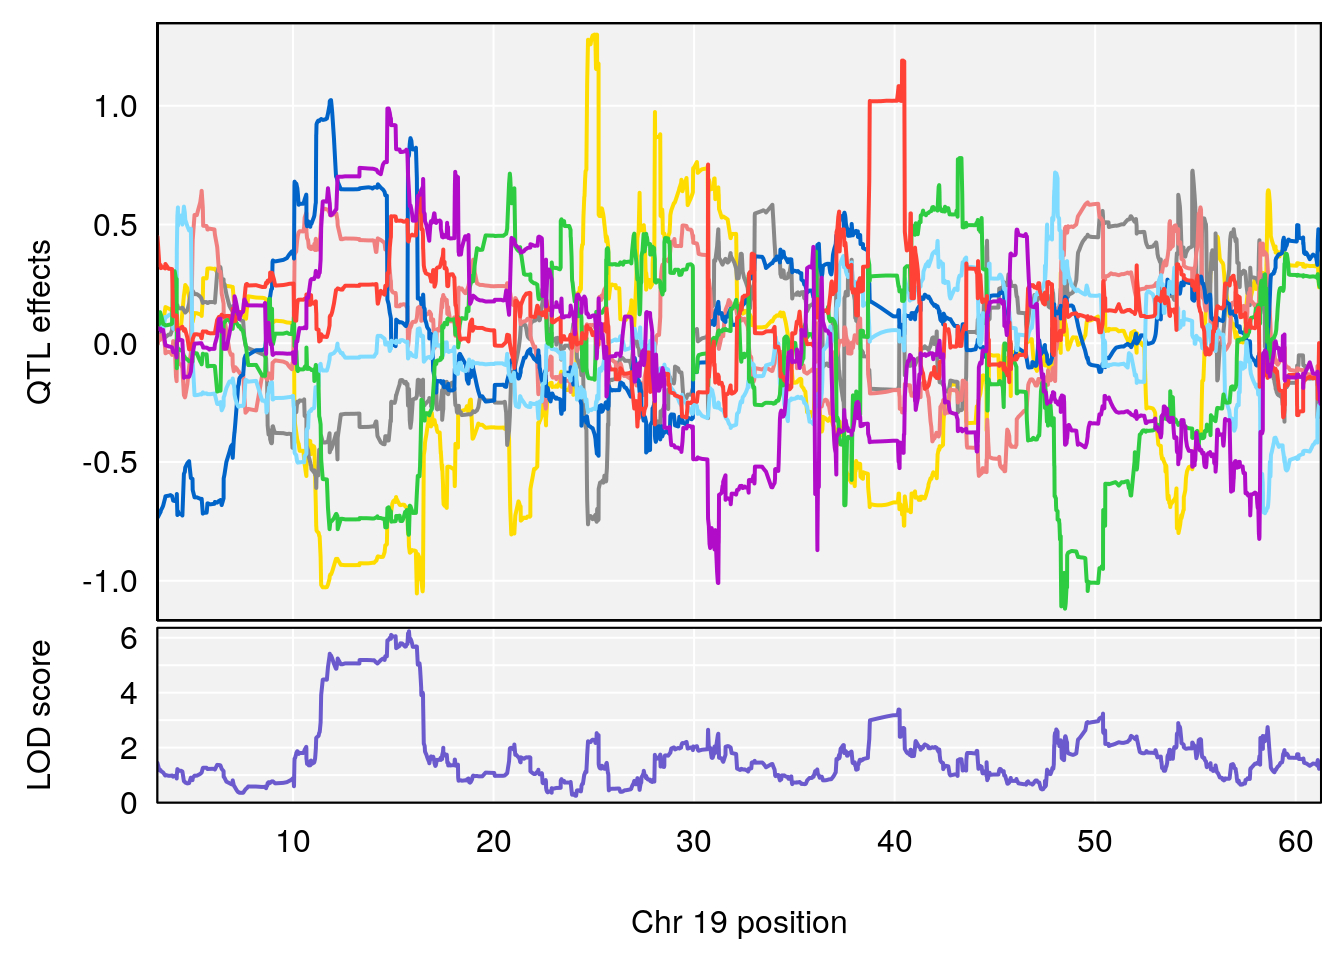
| Version | Author | Date |
|---|---|---|
| 8fe8543 | xhyuo | 2023-02-20 |
| Version | Author | Date |
|---|---|---|
| 8fe8543 | xhyuo | 2023-02-20 |
| Version | Author | Date |
|---|---|---|
| 8fe8543 | xhyuo | 2023-02-20 |
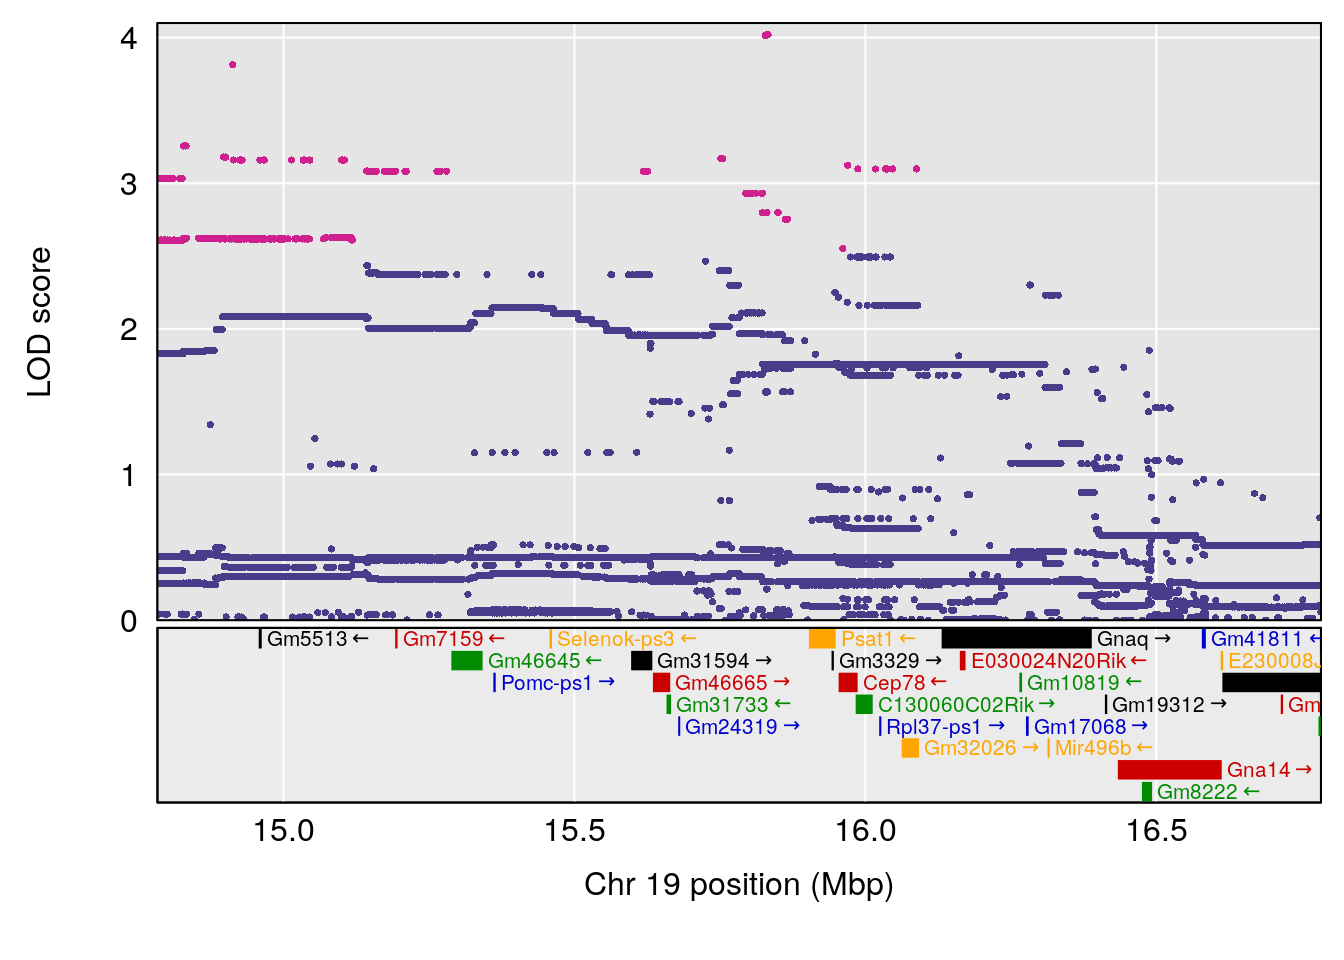
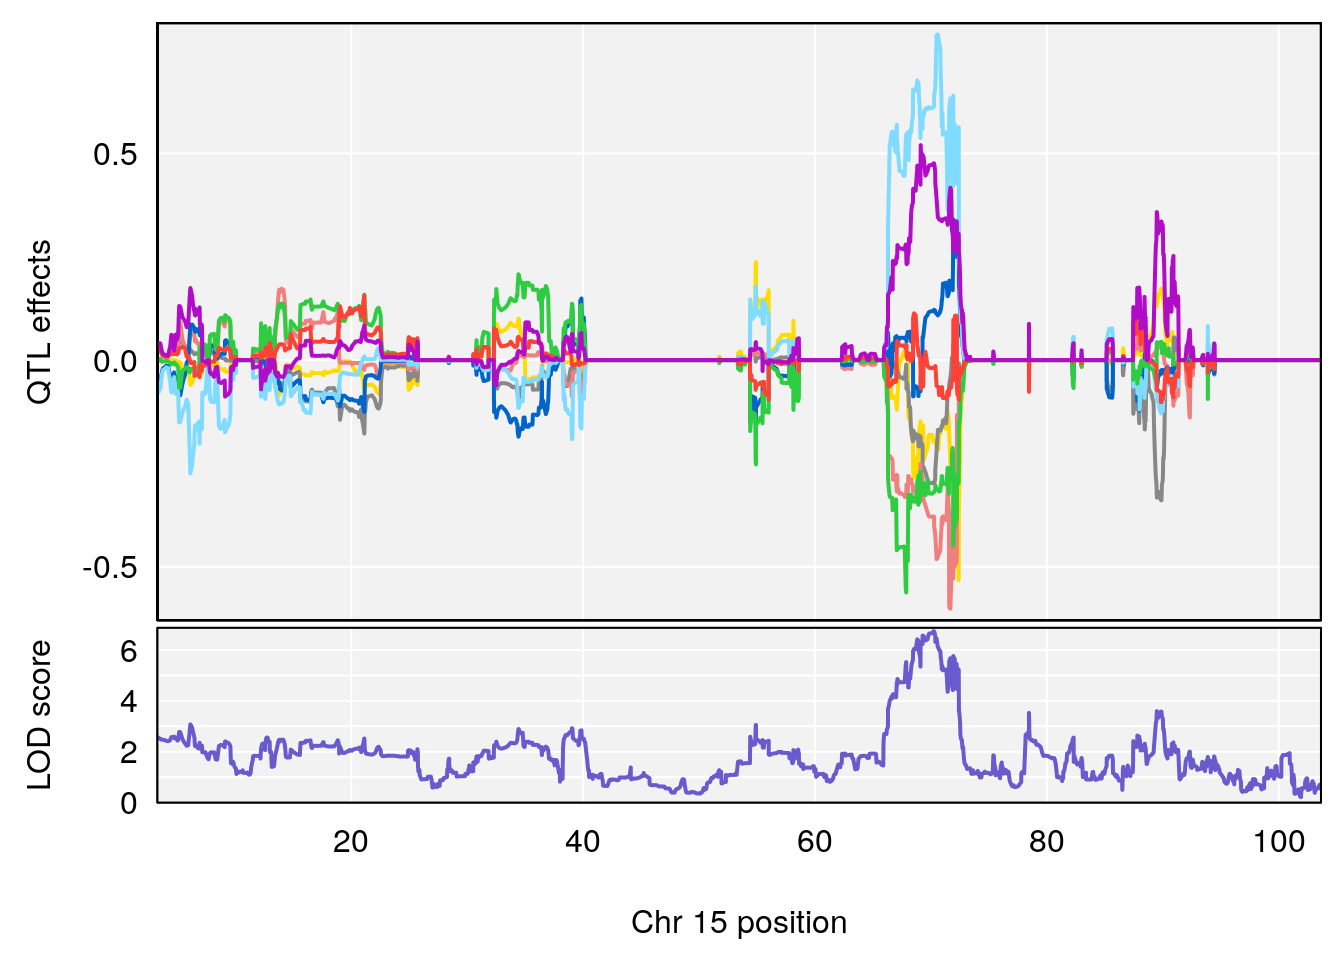
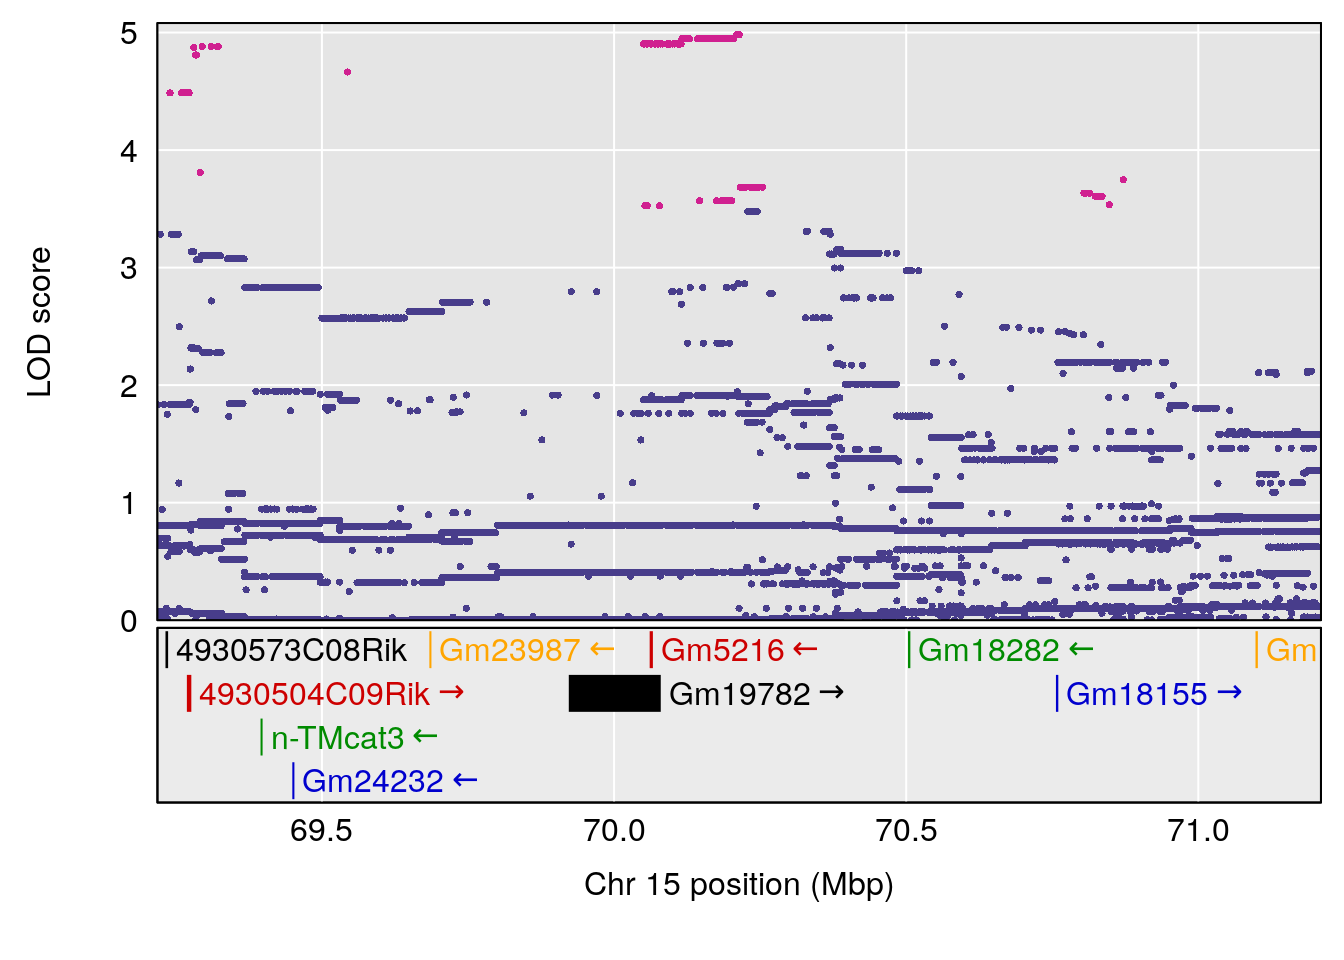
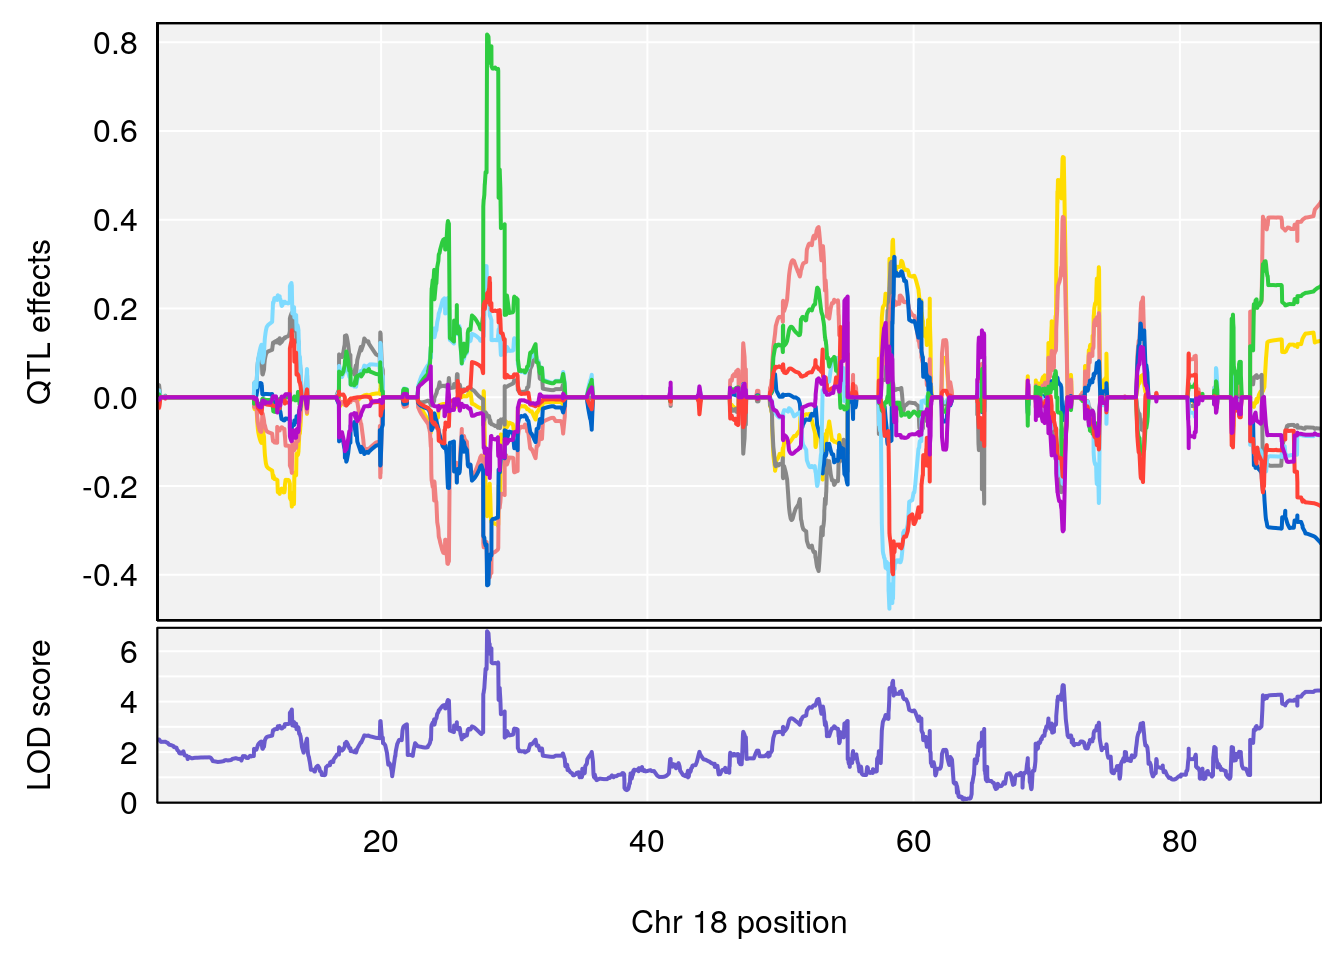
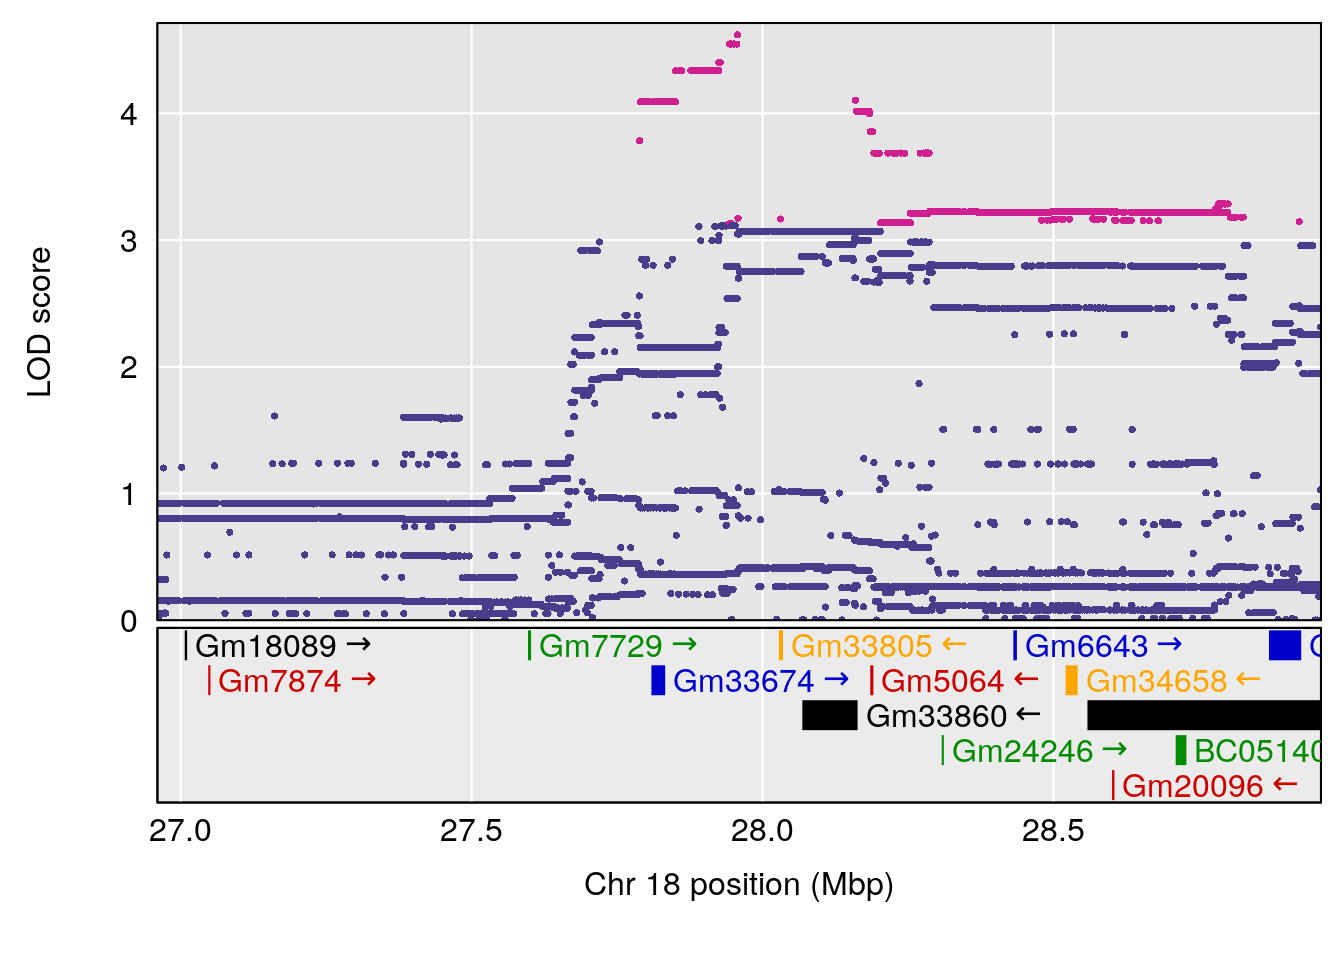
# [1] "Min.depression"
# lodindex lodcolumn chr pos lod ci_lo ci_hi
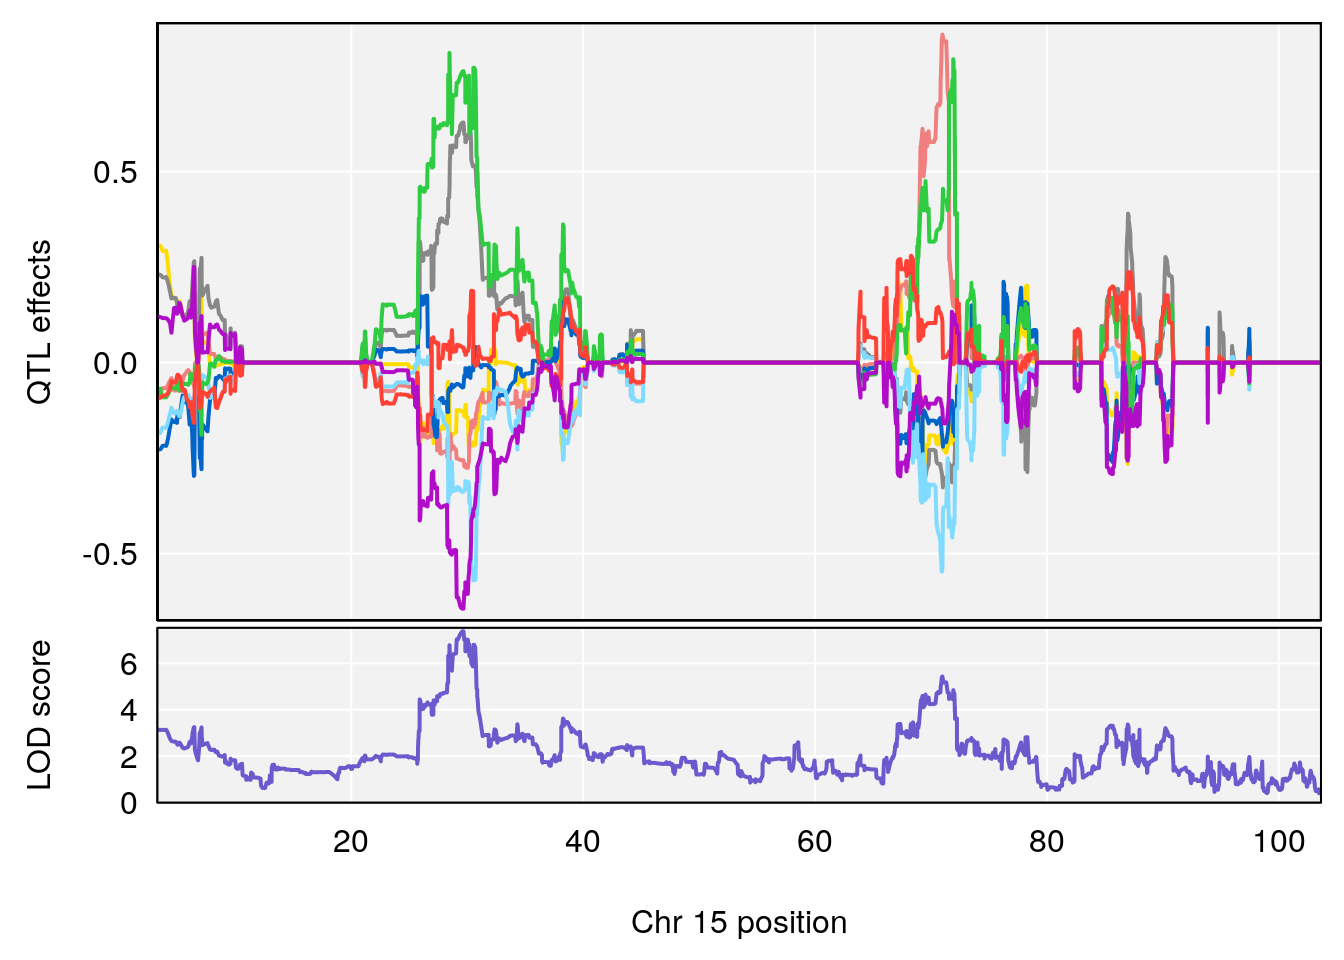
# 1 1 pheno1 15 70.21387 6.737292 67.74024 72.24396
# 2 1 pheno1 18 27.95989 6.788787 27.78975 28.82732
# [1] 1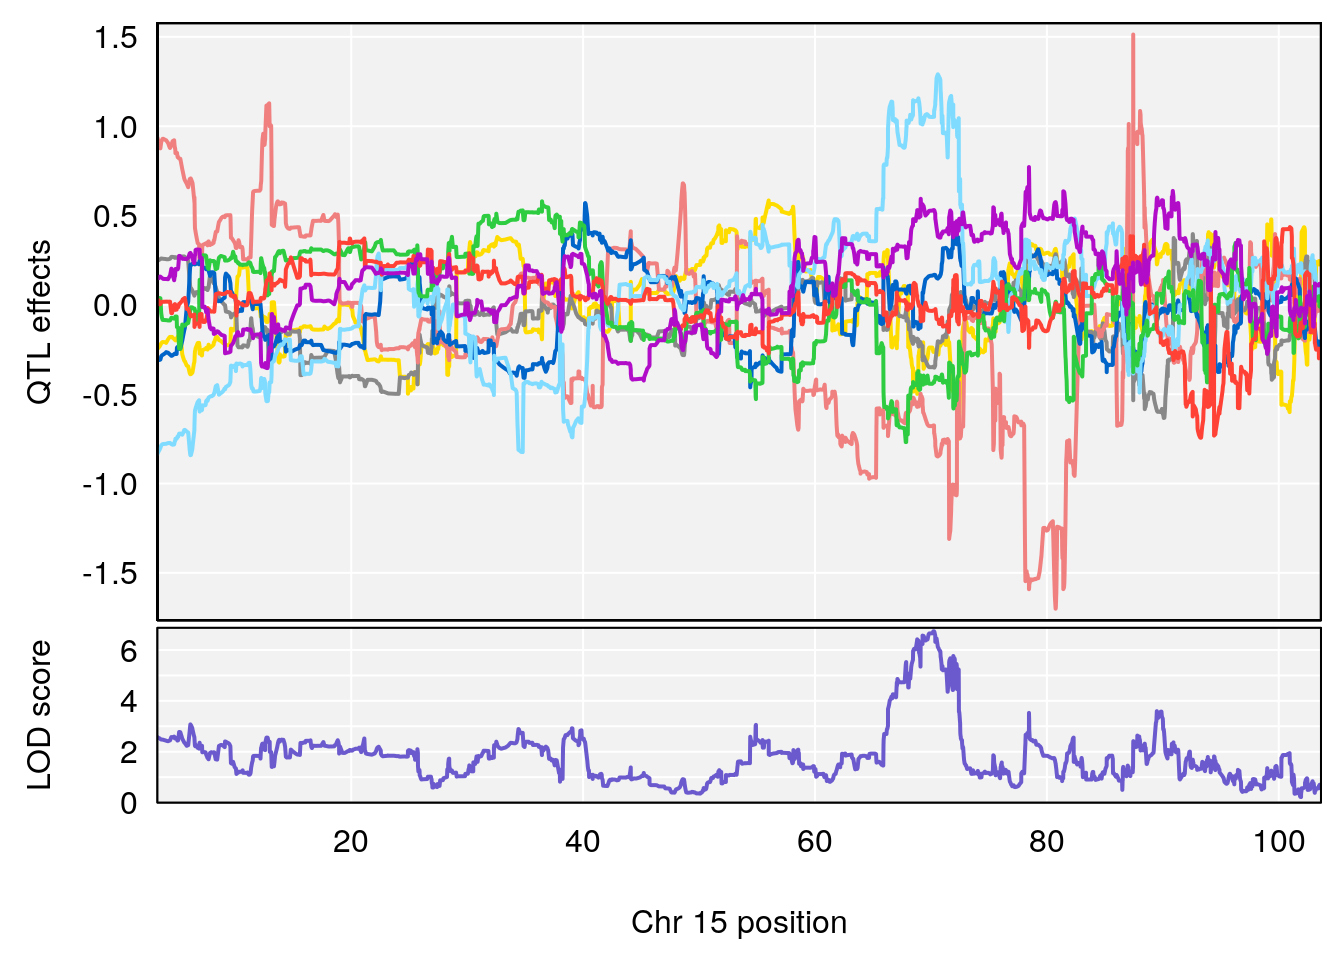
| Version | Author | Date |
|---|---|---|
| 8fe8543 | xhyuo | 2023-02-20 |
| Version | Author | Date |
|---|---|---|
| 8fe8543 | xhyuo | 2023-02-20 |
| Version | Author | Date |
|---|---|---|
| 8fe8543 | xhyuo | 2023-02-20 |
# [1] 2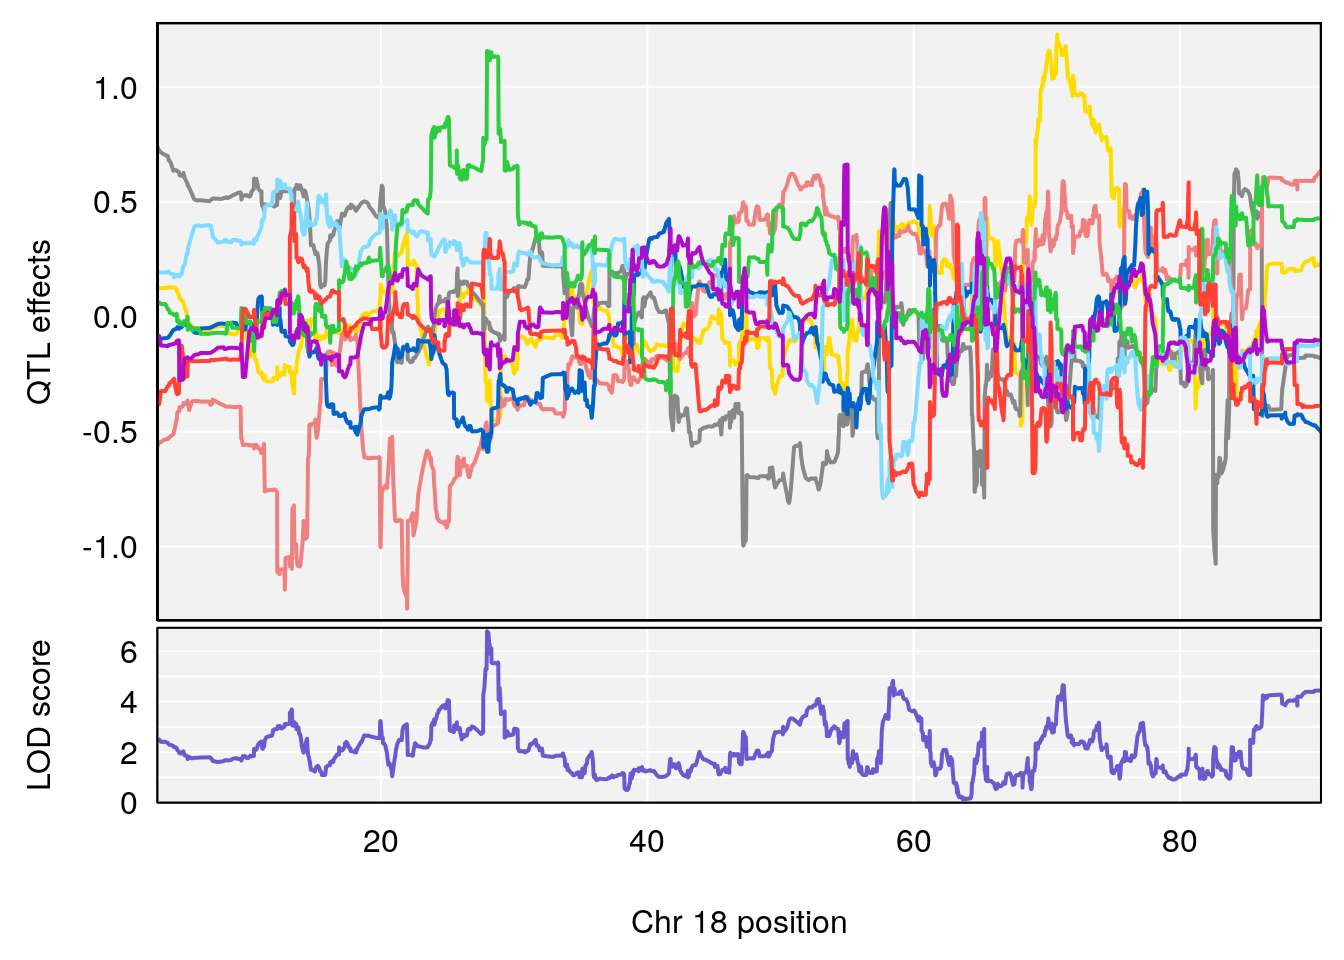
| Version | Author | Date |
|---|---|---|
| 8fe8543 | xhyuo | 2023-02-20 |
| Version | Author | Date |
|---|---|---|
| 8fe8543 | xhyuo | 2023-02-20 |
| Version | Author | Date |
|---|---|---|
| 8fe8543 | xhyuo | 2023-02-20 |
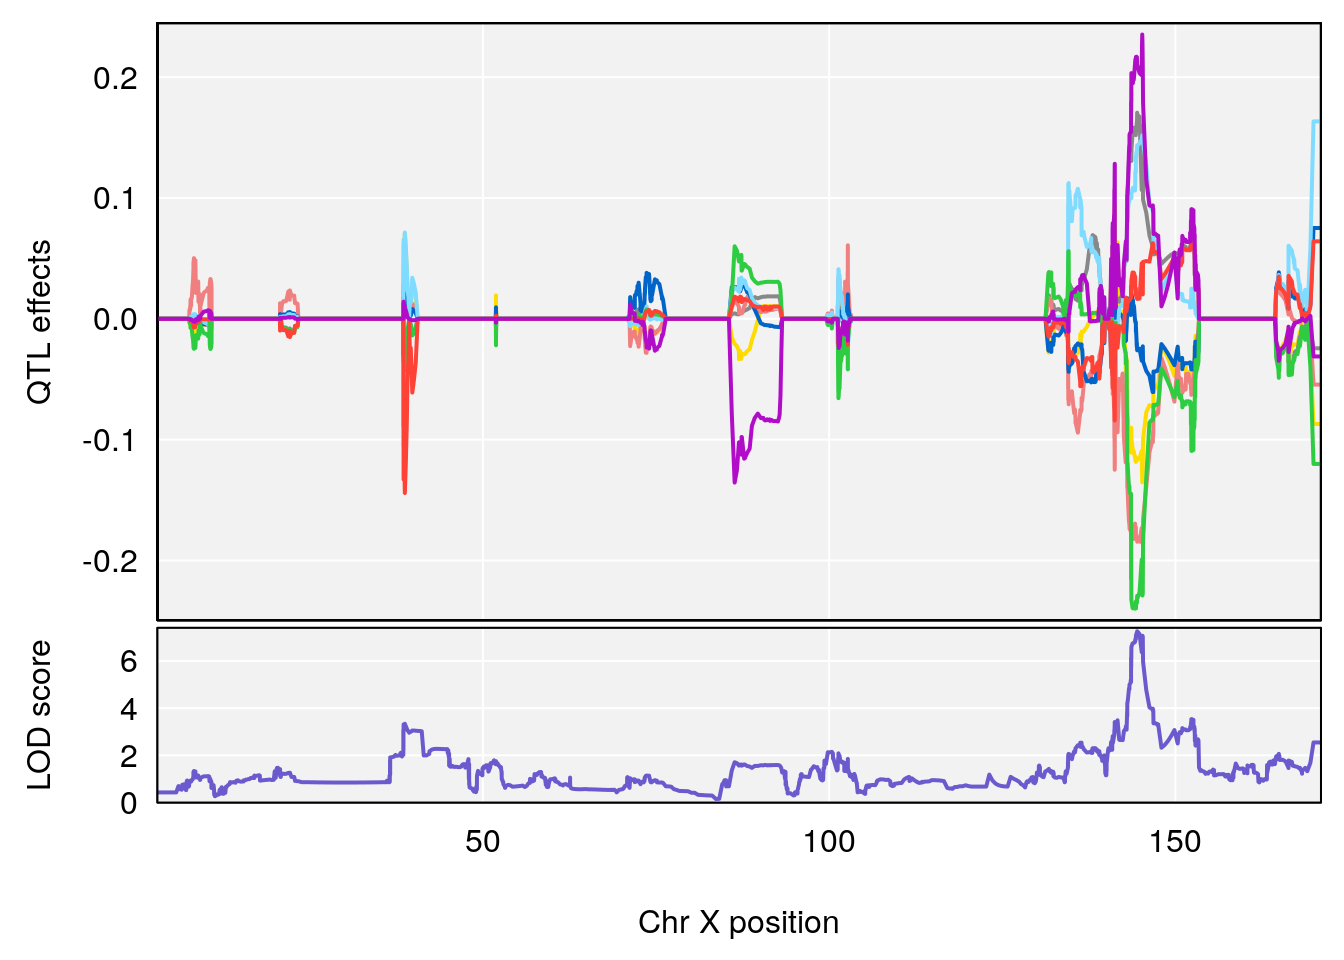
# [1] "Status_bin"
#   lodindex lodcolumn chr      pos      lod    ci_lo    ci_hi
# 1        1    pheno1  15 87.79636 7.389801 87.42813 88.11448
# 2        1    pheno1   X 41.44546 6.867848 36.58281 42.28244
# [1] 1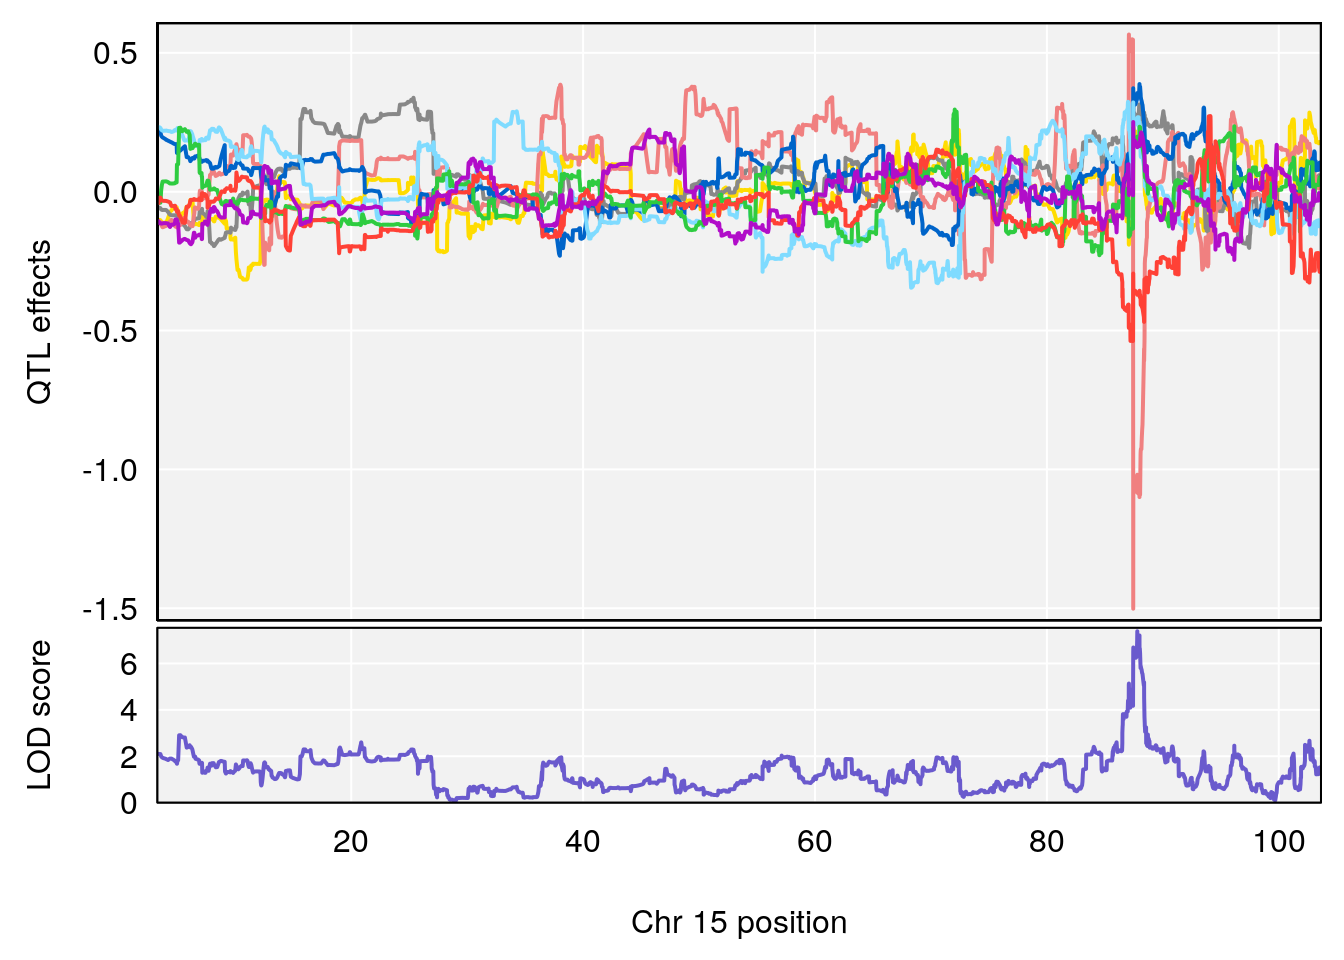
| Version | Author | Date |
|---|---|---|
| 8fe8543 | xhyuo | 2023-02-20 |
| Version | Author | Date |
|---|---|---|
| 8fe8543 | xhyuo | 2023-02-20 |
| Version | Author | Date |
|---|---|---|
| 8fe8543 | xhyuo | 2023-02-20 |
# [1] 2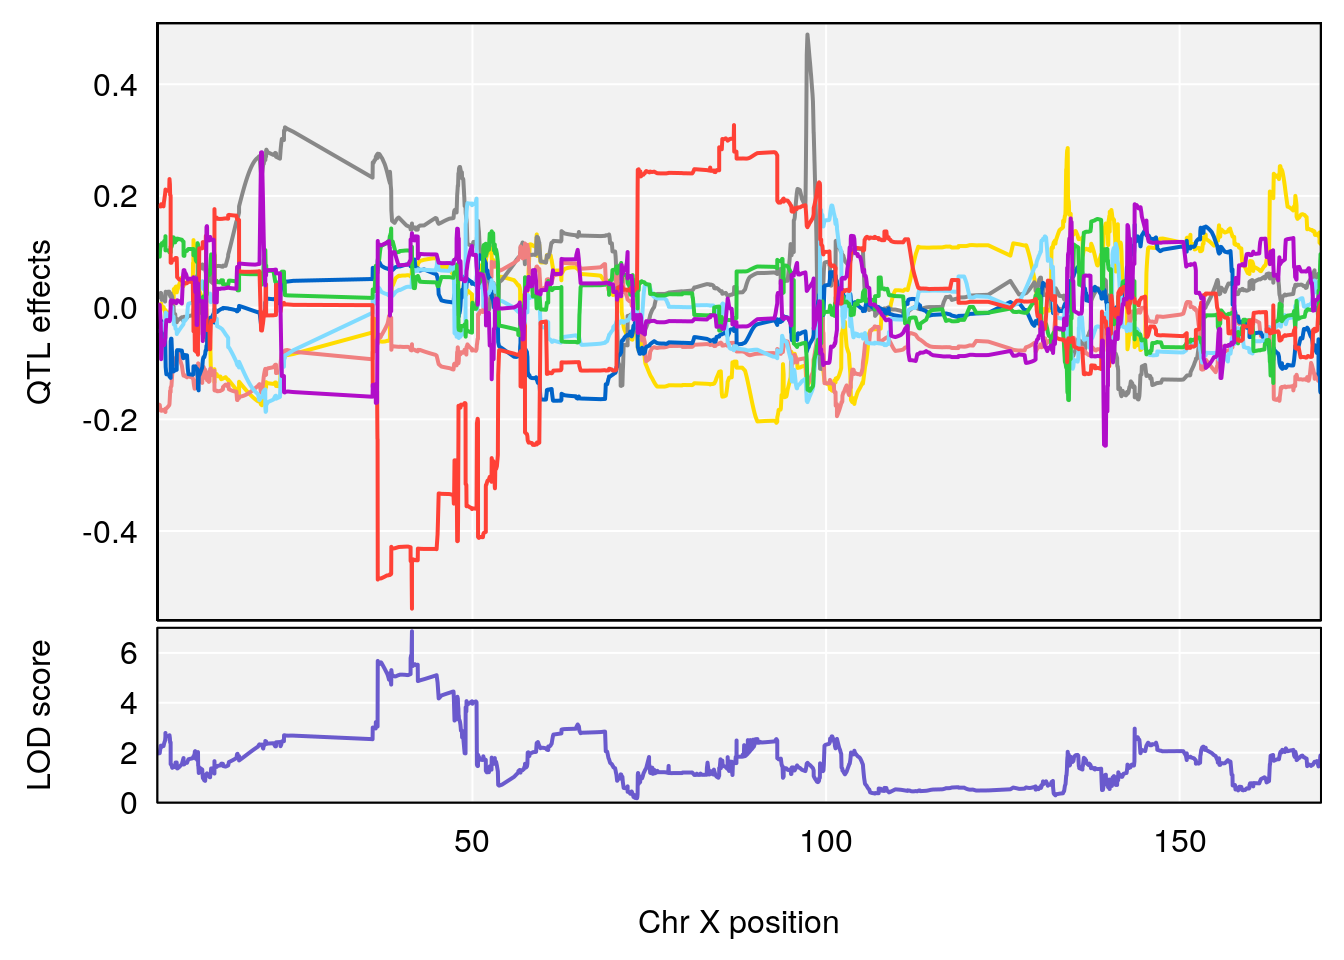
| Version | Author | Date |
|---|---|---|
| 8fe8543 | xhyuo | 2023-02-20 |
| Version | Author | Date |
|---|---|---|
| 8fe8543 | xhyuo | 2023-02-20 |
| Version | Author | Date |
|---|---|---|
| 8fe8543 | xhyuo | 2023-02-20 |
Plot qtl mapping on array female
load("output/qtl.morphine.out.combined_gm.female.RData")
#pmap and gmap
chr.names <- c("1","2","3","4","5","6","7","8","9","10","11","12","13","14","15","16","17","18","19", "X")
gmap <- list()
pmap <- list()
for (chr in chr.names){
  gmap[[chr]] <-  combined_gm$gmap[[chr]]
  pmap[[chr]] <-  combined_gm$pmap[[chr]]
}
attr(gmap, "is_x_chr") <- structure(c(rep(FALSE,19),TRUE), names=1:20)
attr(pmap, "is_x_chr") <- structure(c(rep(FALSE,19),TRUE), names=1:20)

#genome-wide plot
for(i in names(qtl.morphine.out)){
  par(mar=c(5.1, 4.1, 1.1, 1.1))
  ymx <- maxlod(qtl.morphine.out[[i]]) # overall maximum LOD score
  plot(qtl.morphine.out[[i]], map=pmap, lodcolumn=1, col="slateblue", ylim=c(0, max(sapply(qtl.morphine.out, maxlod)) +2))
  abline(h=summary(qtl.morphine.operm[[i]], alpha=c(0.10, 0.05, 0.01))[[1]], col="red")
  abline(h=summary(qtl.morphine.operm[[i]], alpha=c(0.10, 0.05, 0.01))[[2]], col="red")
  abline(h=summary(qtl.morphine.operm[[i]], alpha=c(0.10, 0.05, 0.01))[[3]], col="red")
  title(main = paste0("DO_morphine_",i))
}
| Version | Author | Date |
|---|---|---|
| 8fe8543 | xhyuo | 2023-02-20 |
| Version | Author | Date |
|---|---|---|
| 8fe8543 | xhyuo | 2023-02-20 |
| Version | Author | Date |
|---|---|---|
| 8fe8543 | xhyuo | 2023-02-20 |
| Version | Author | Date |
|---|---|---|
| 8fe8543 | xhyuo | 2023-02-20 |
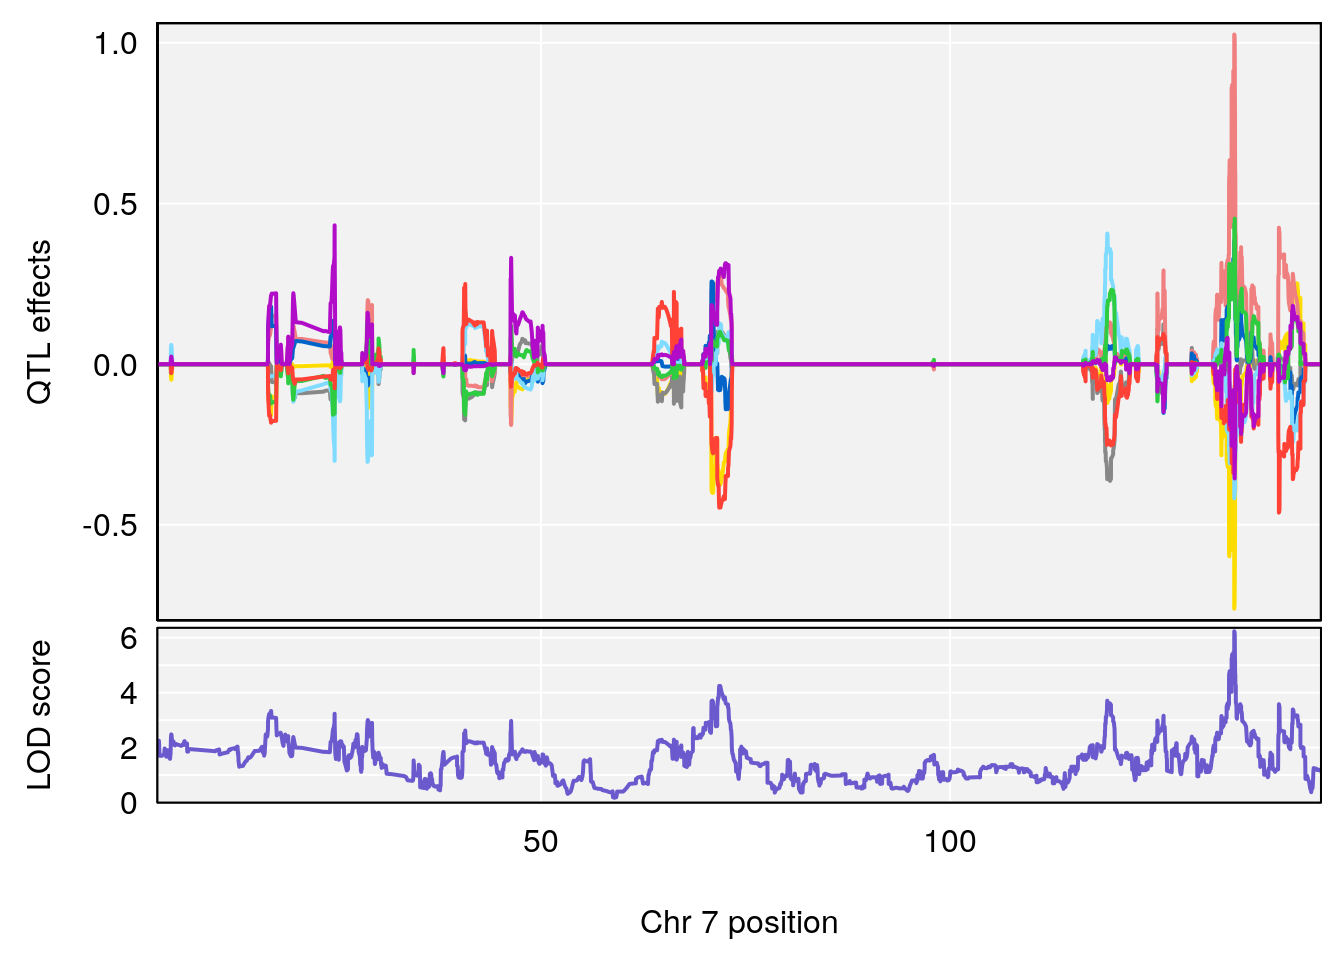
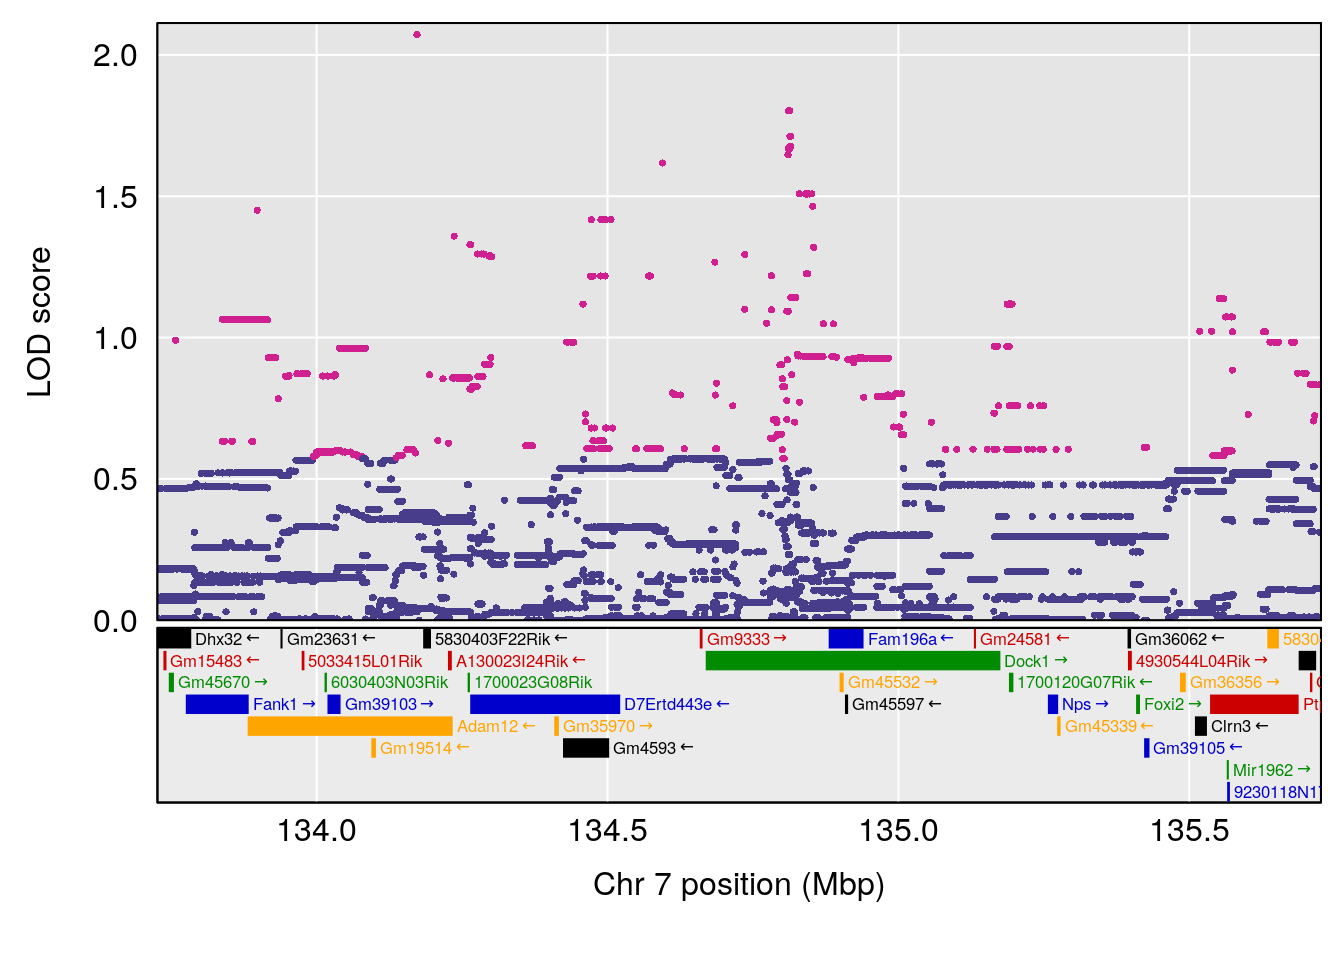
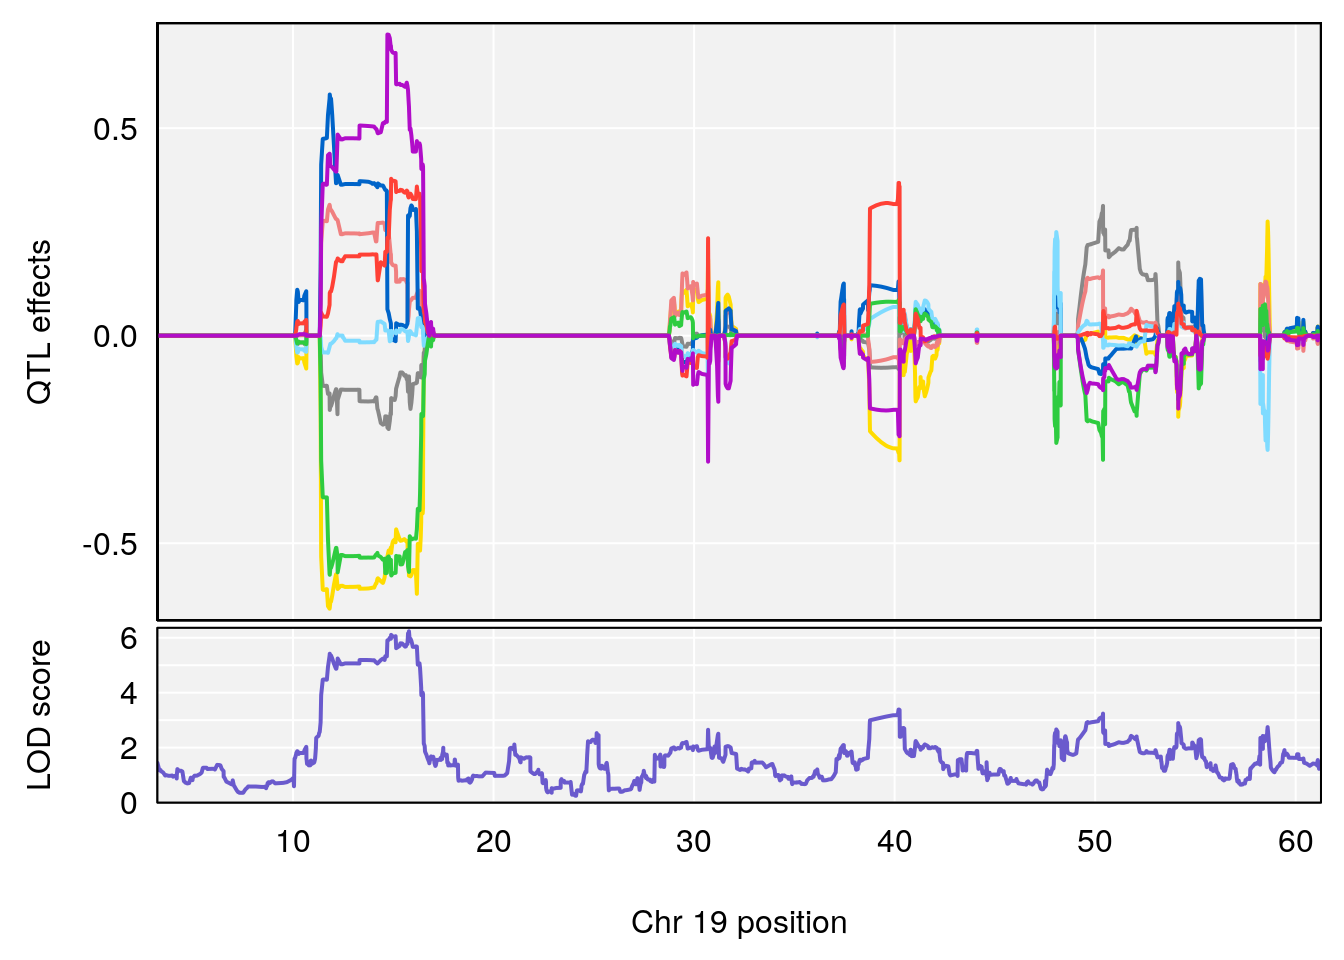
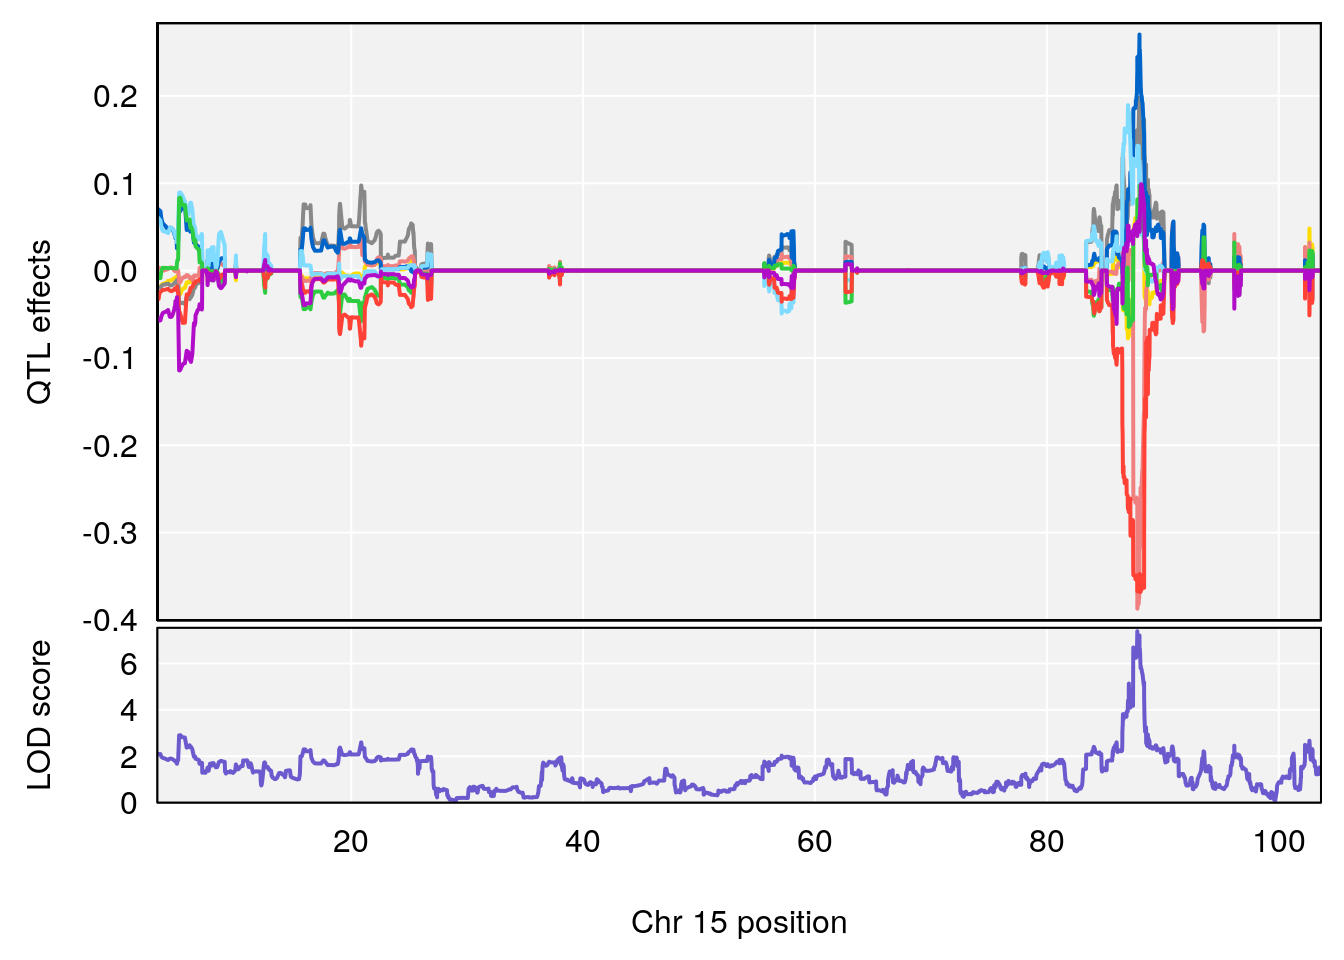
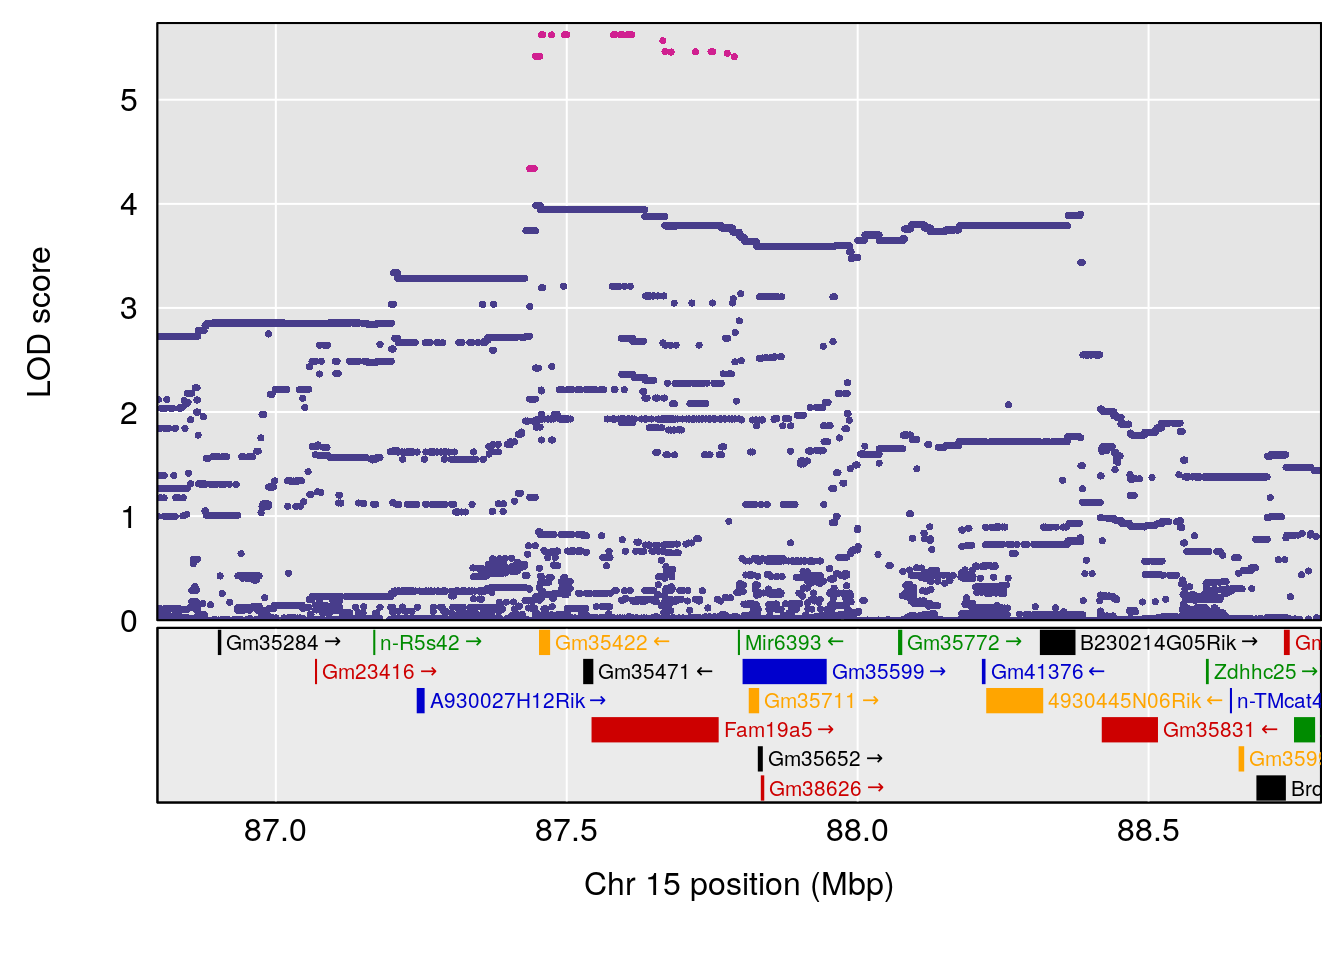
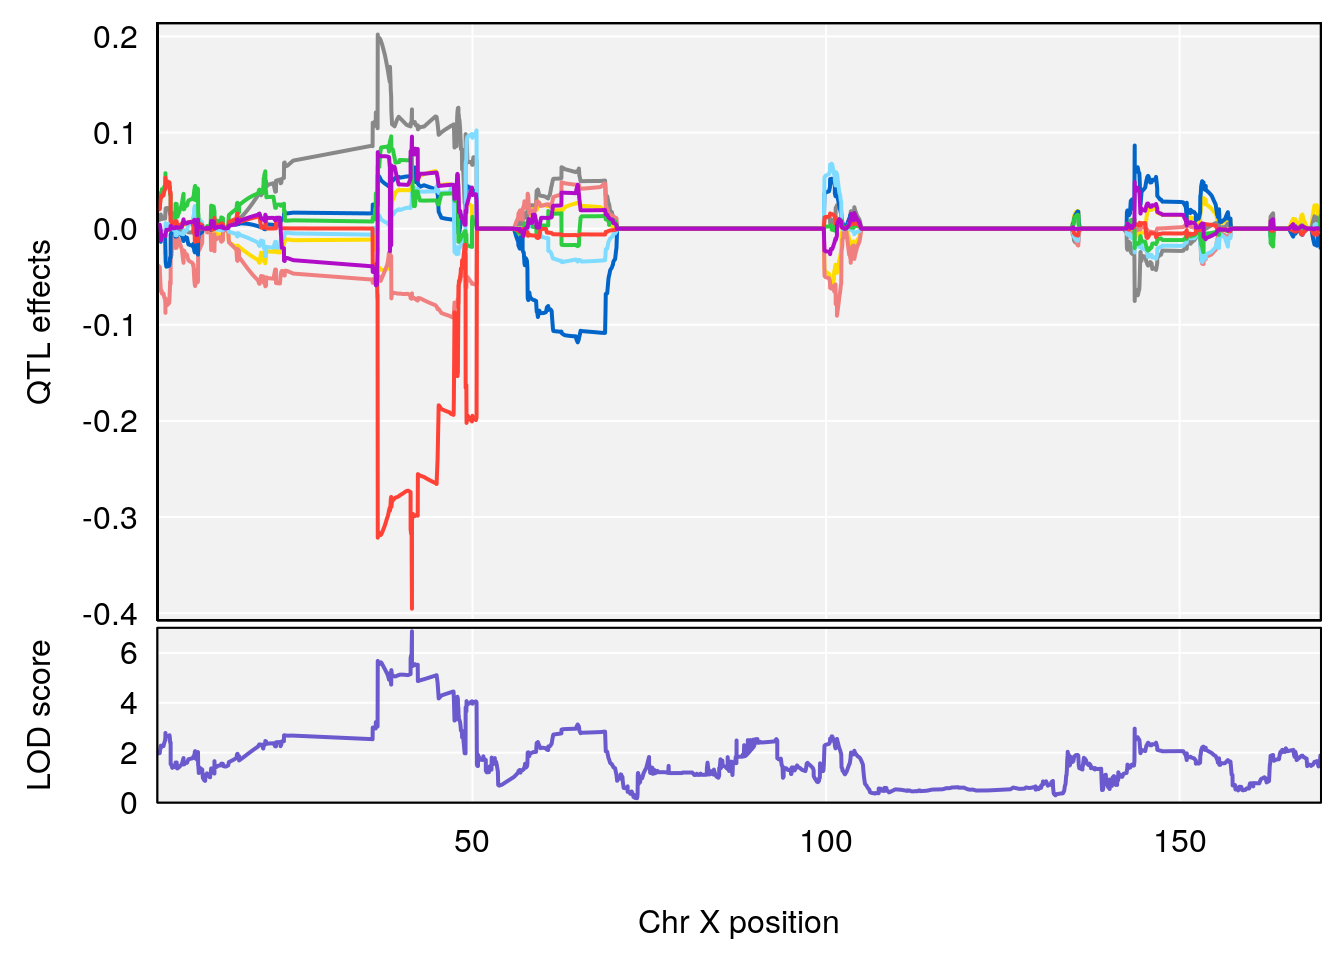
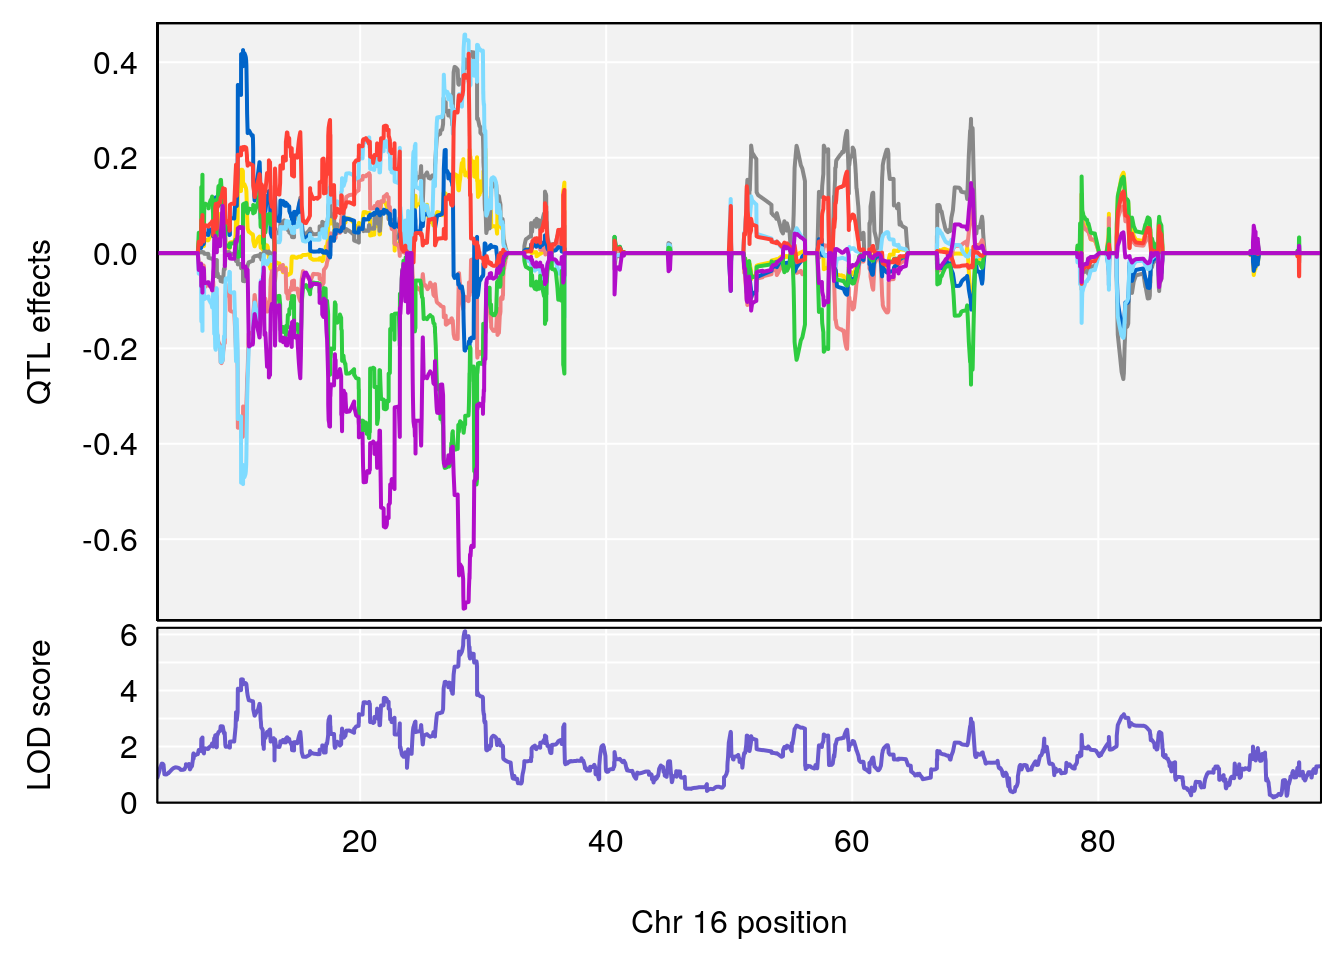
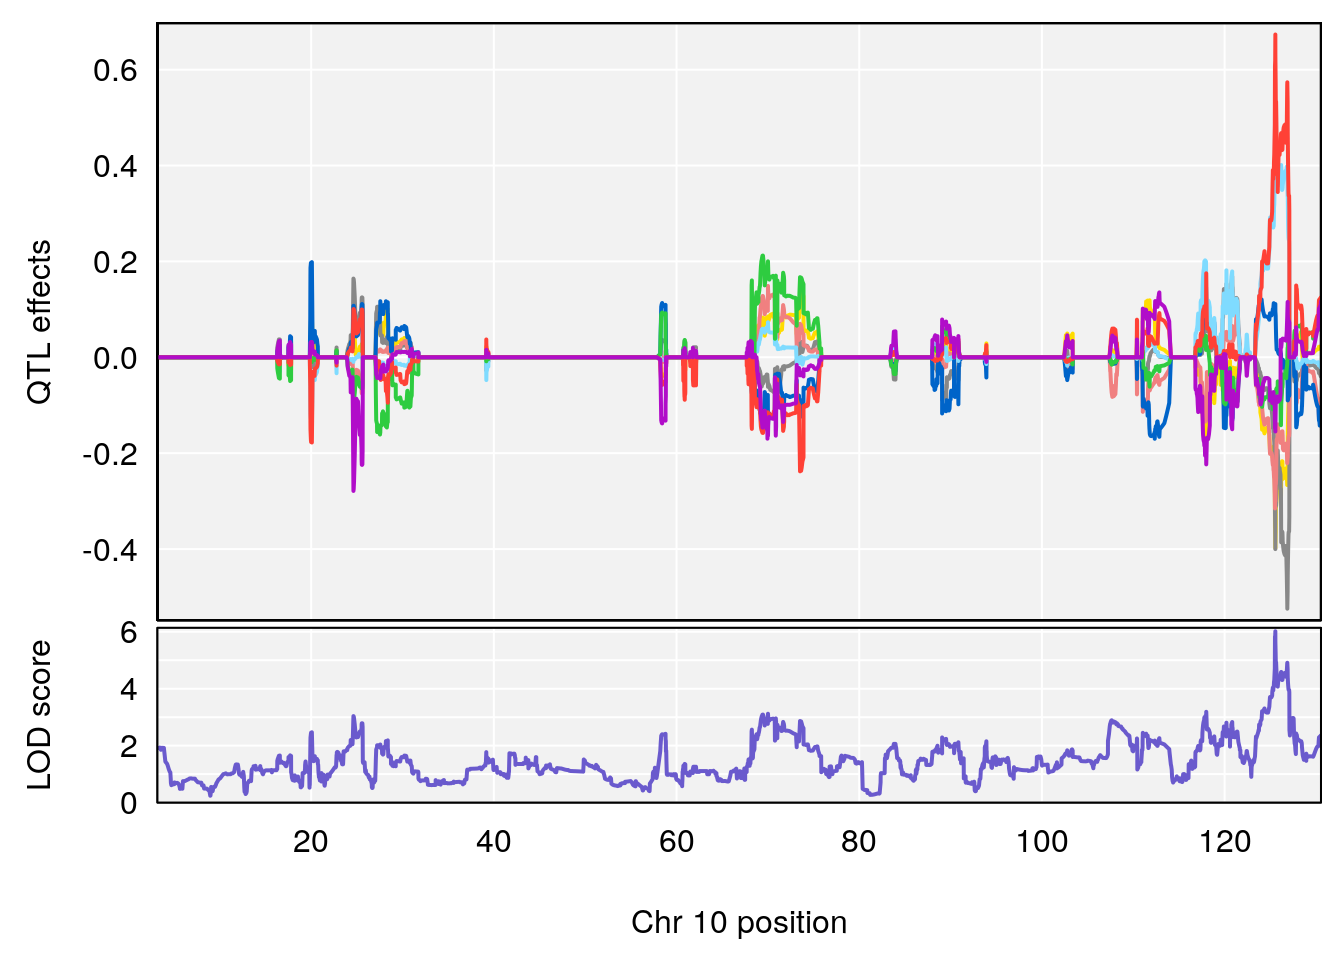
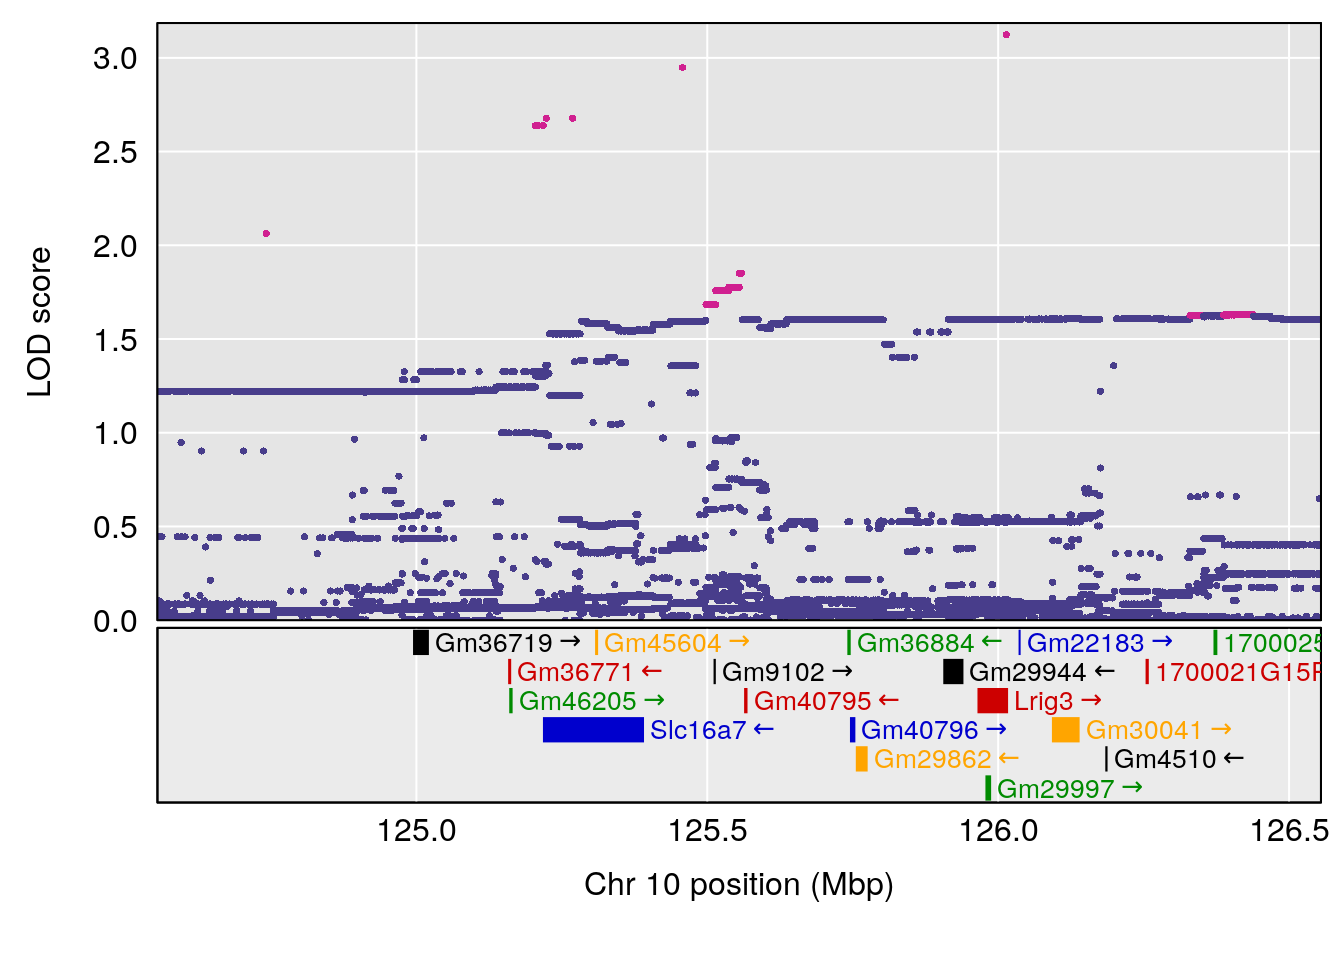
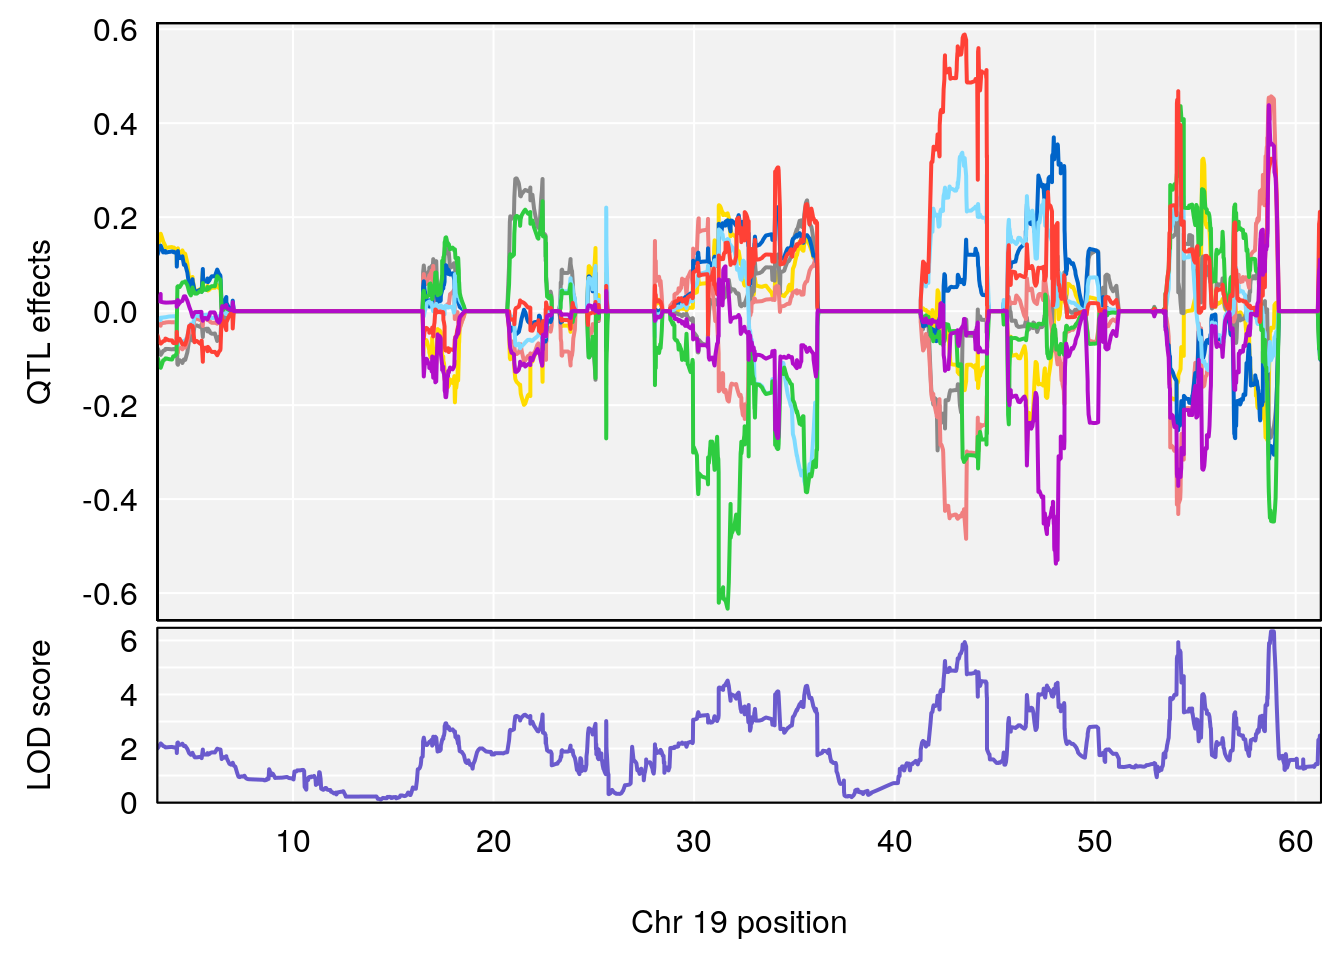
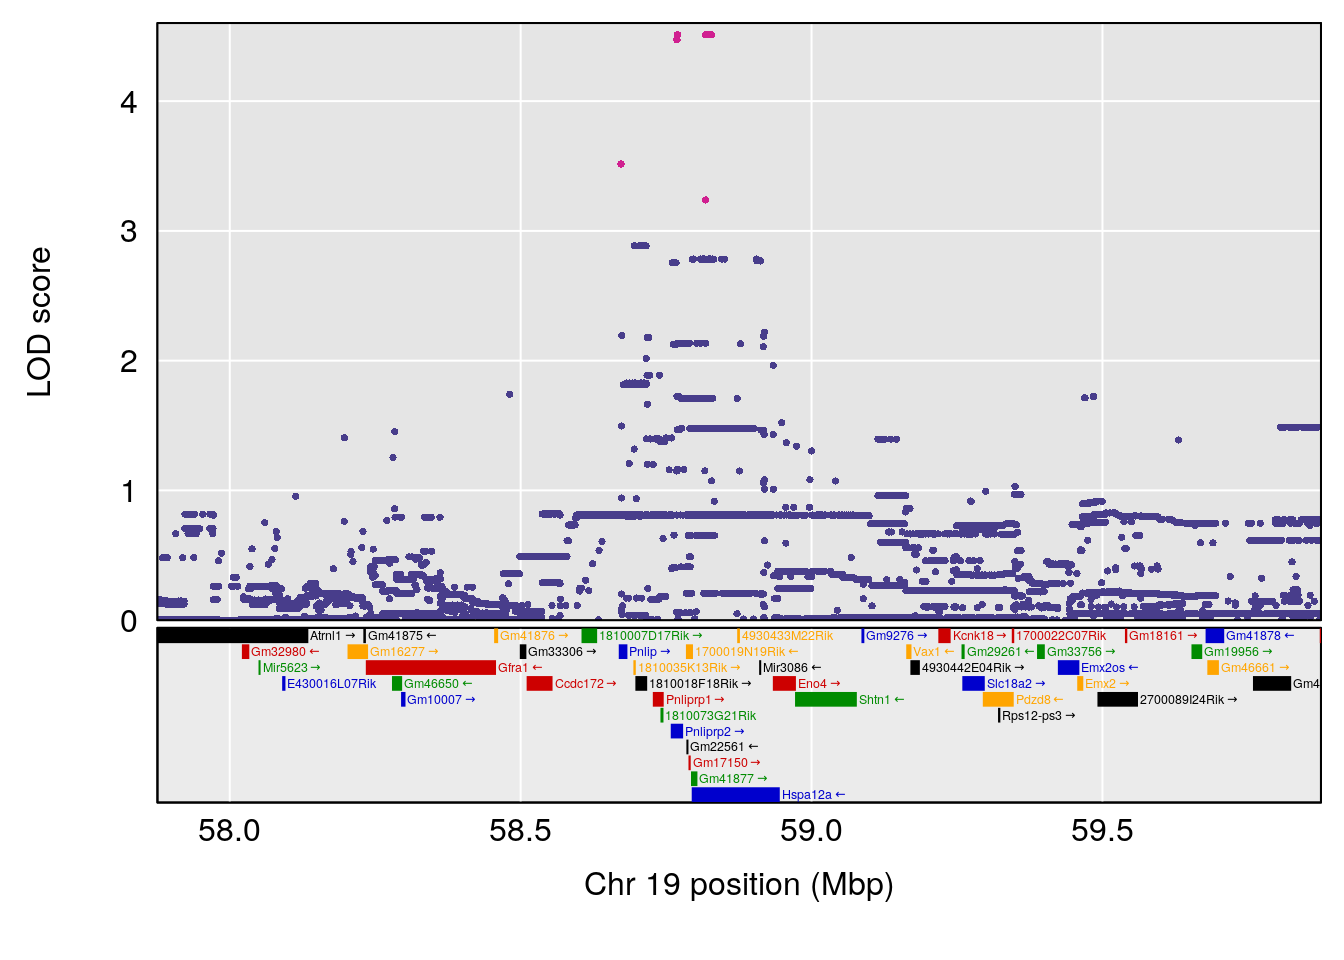
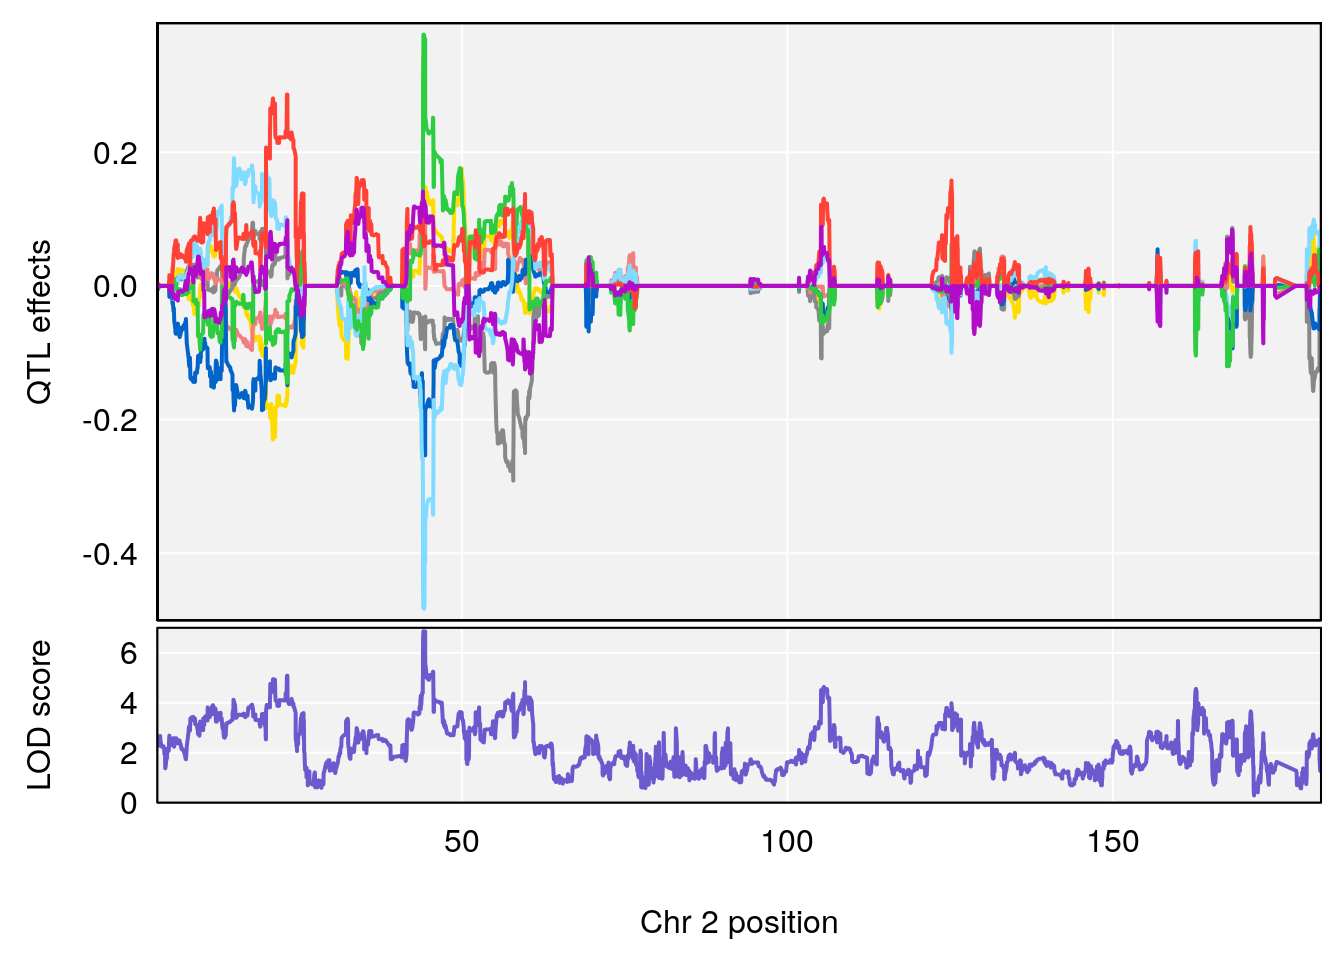
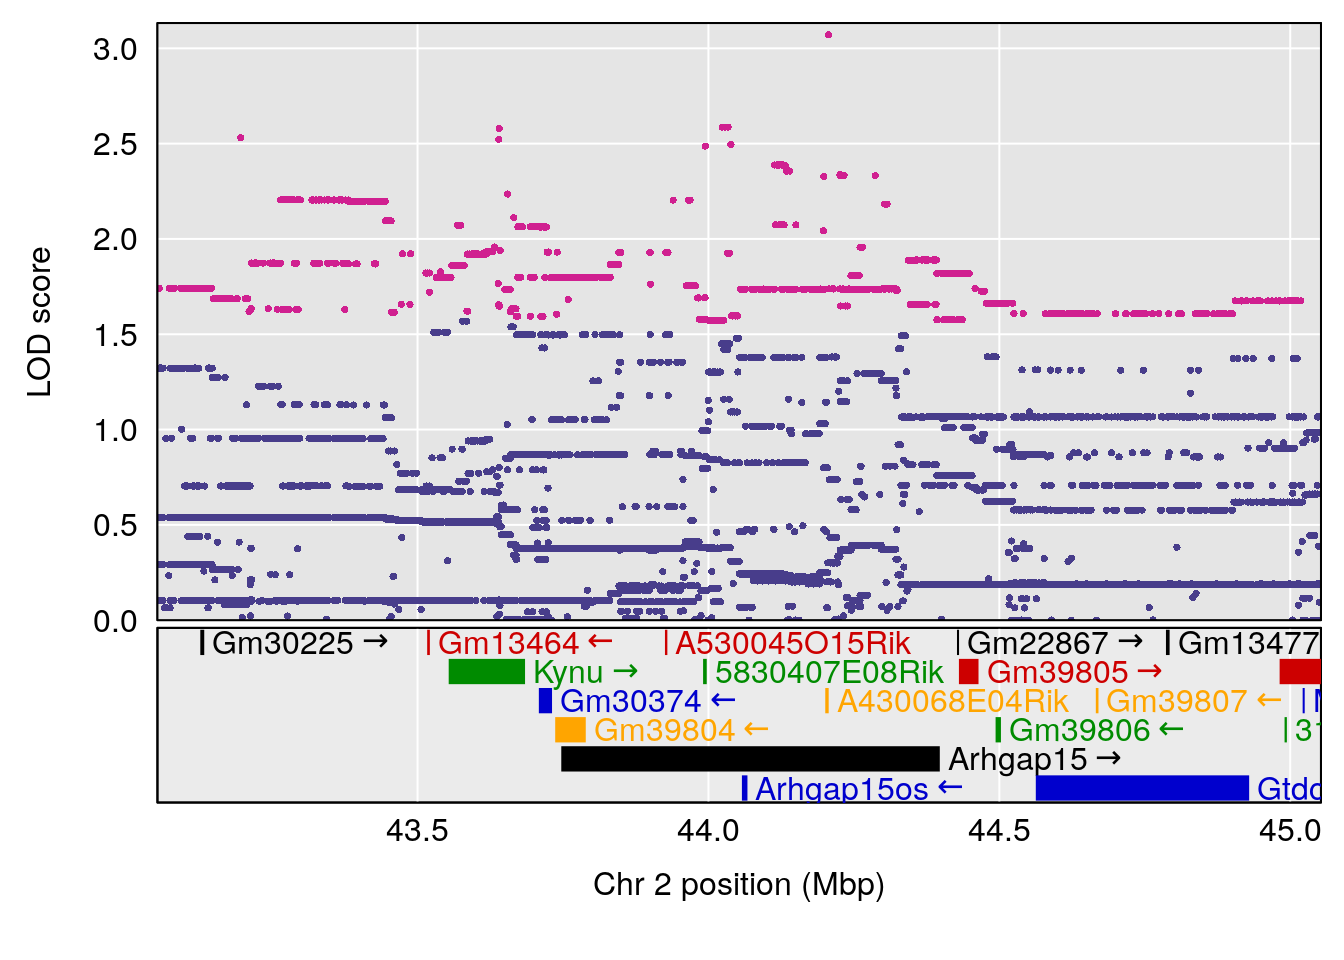
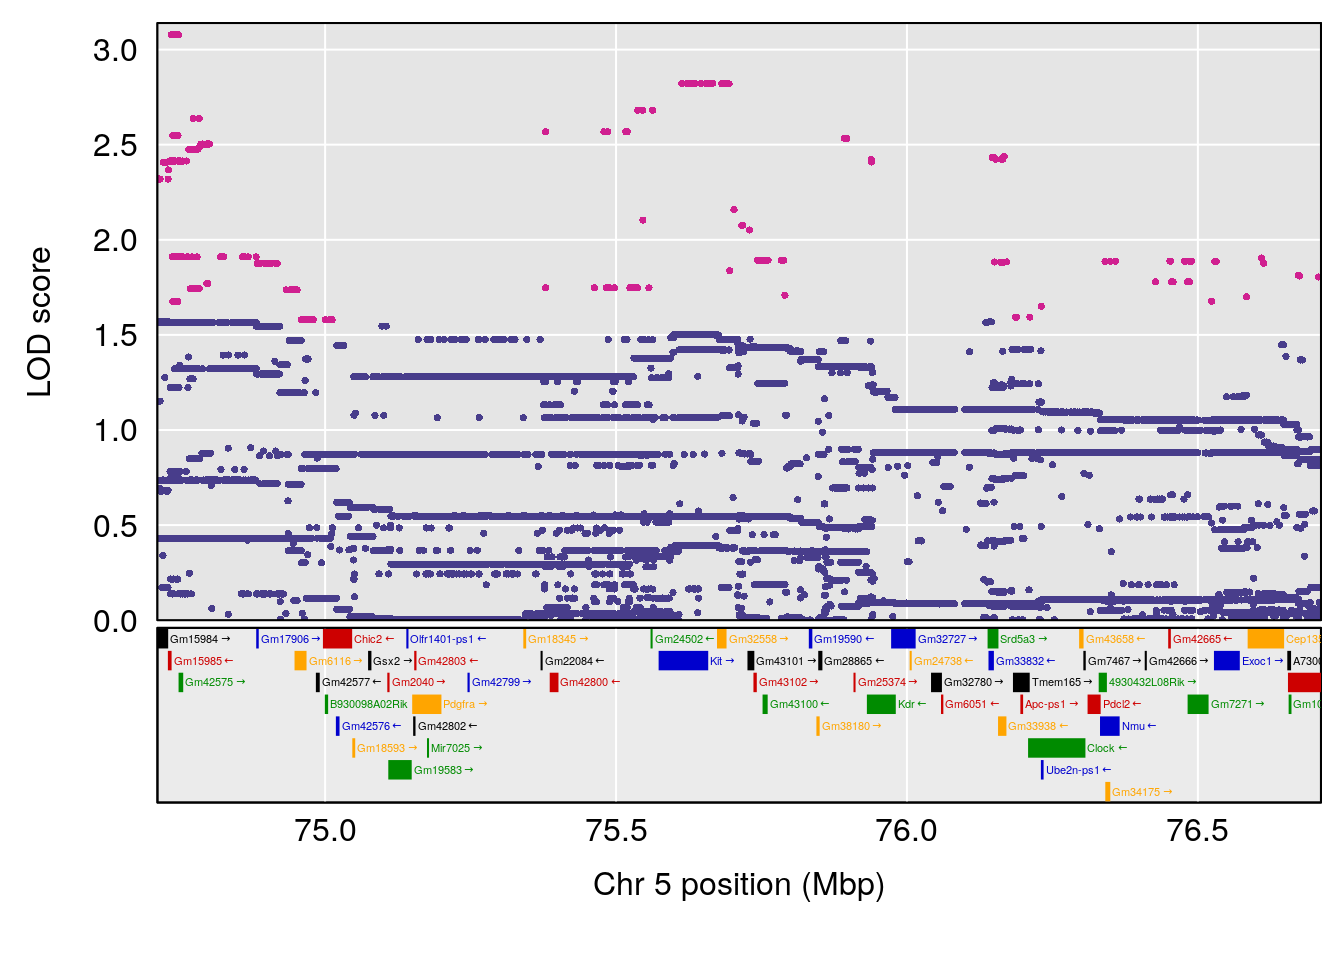
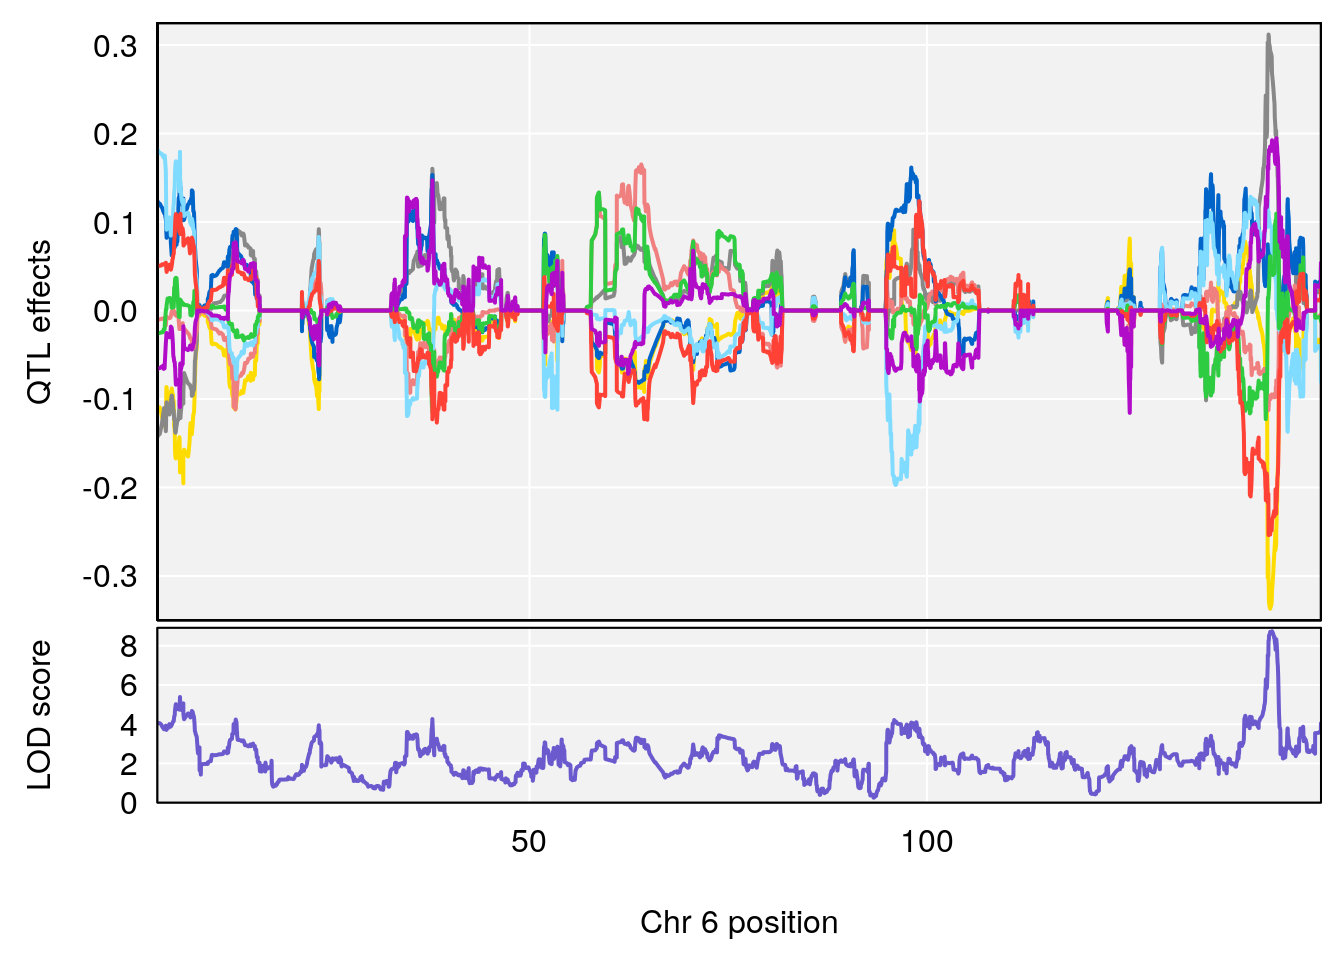
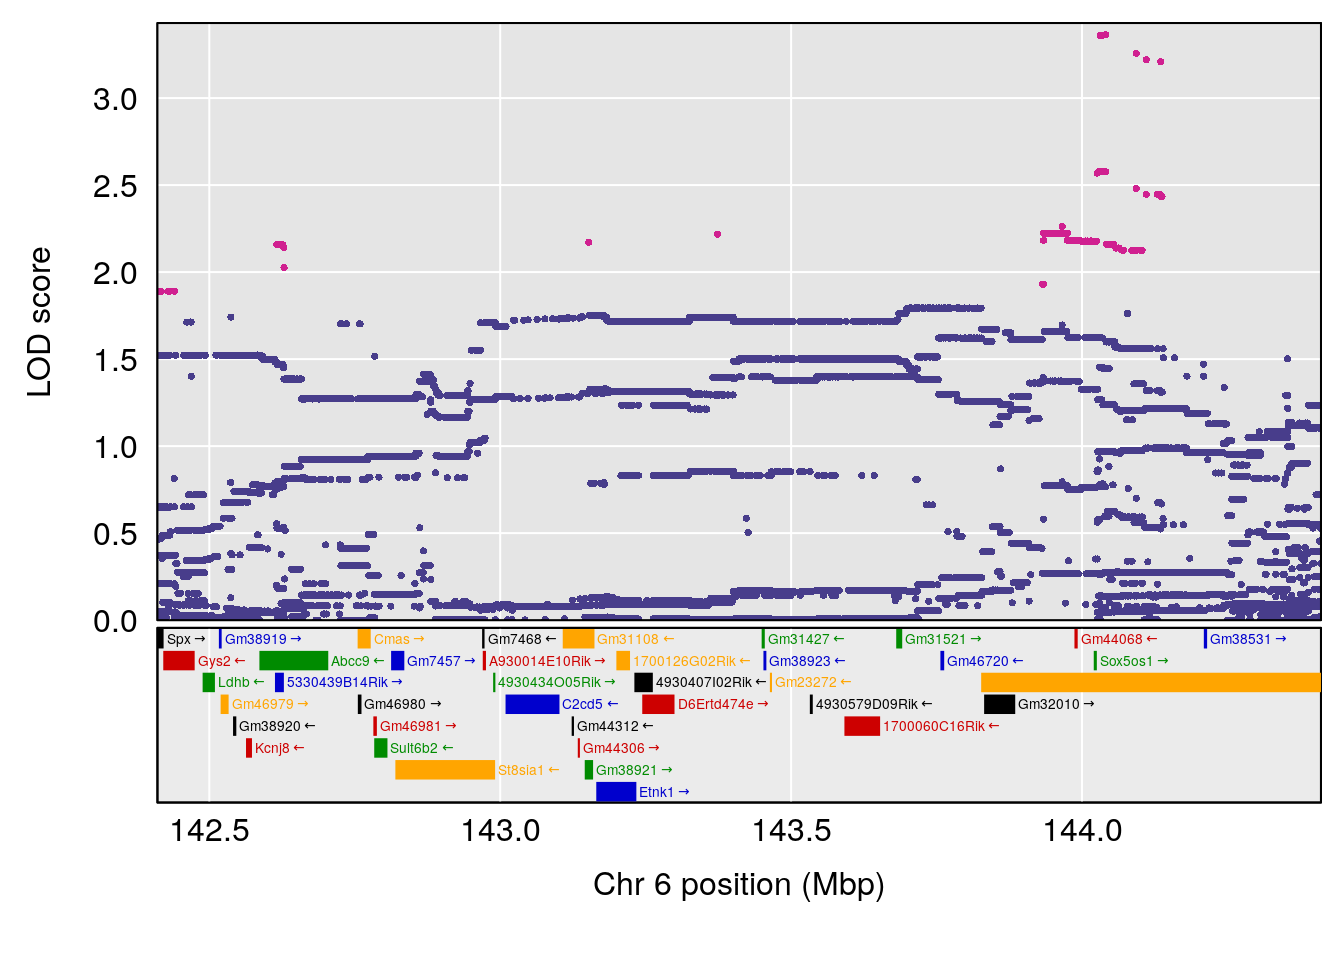
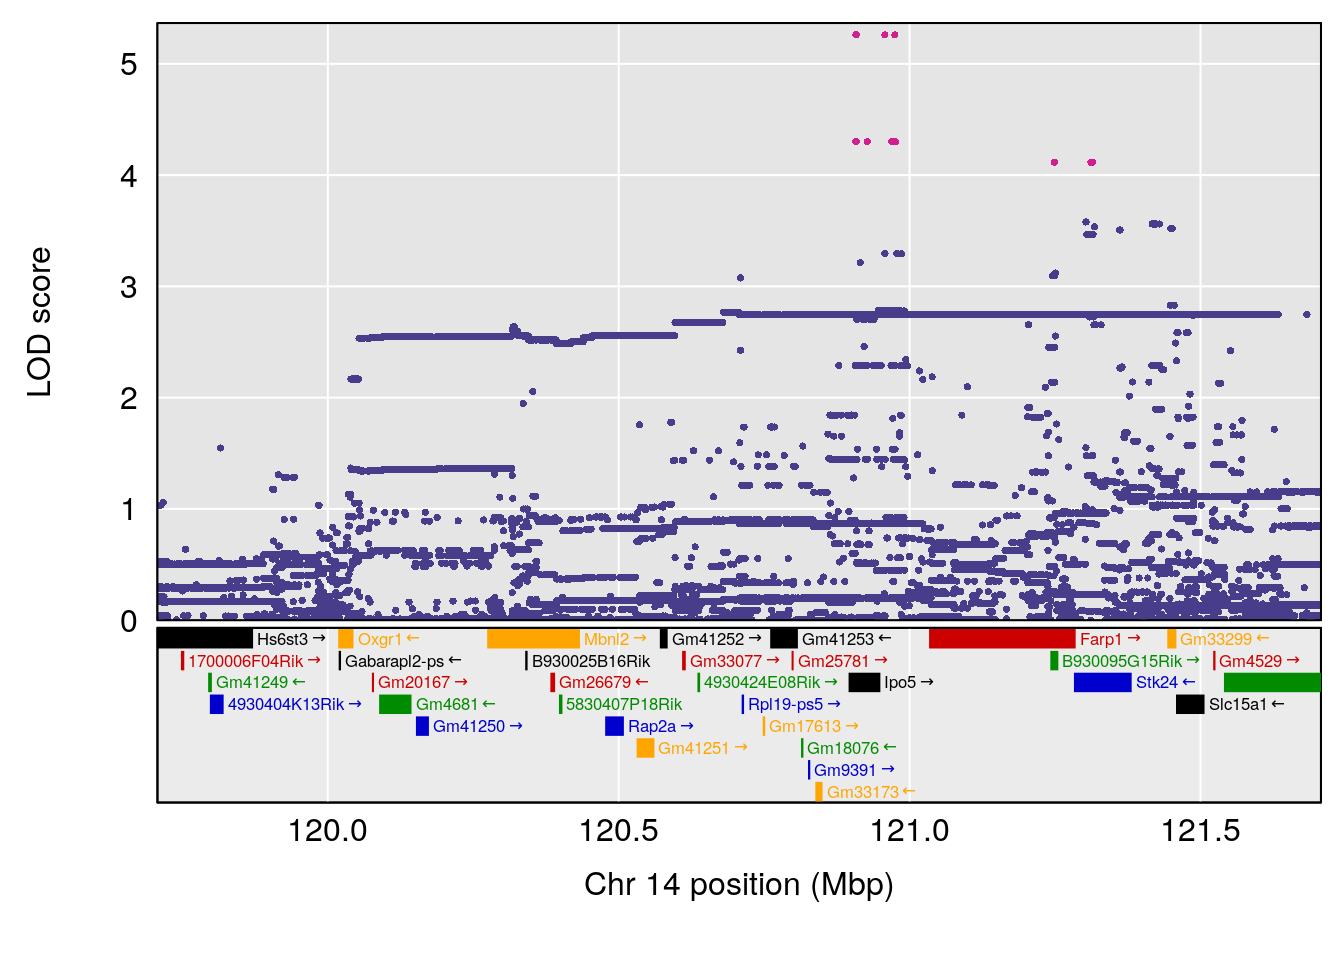
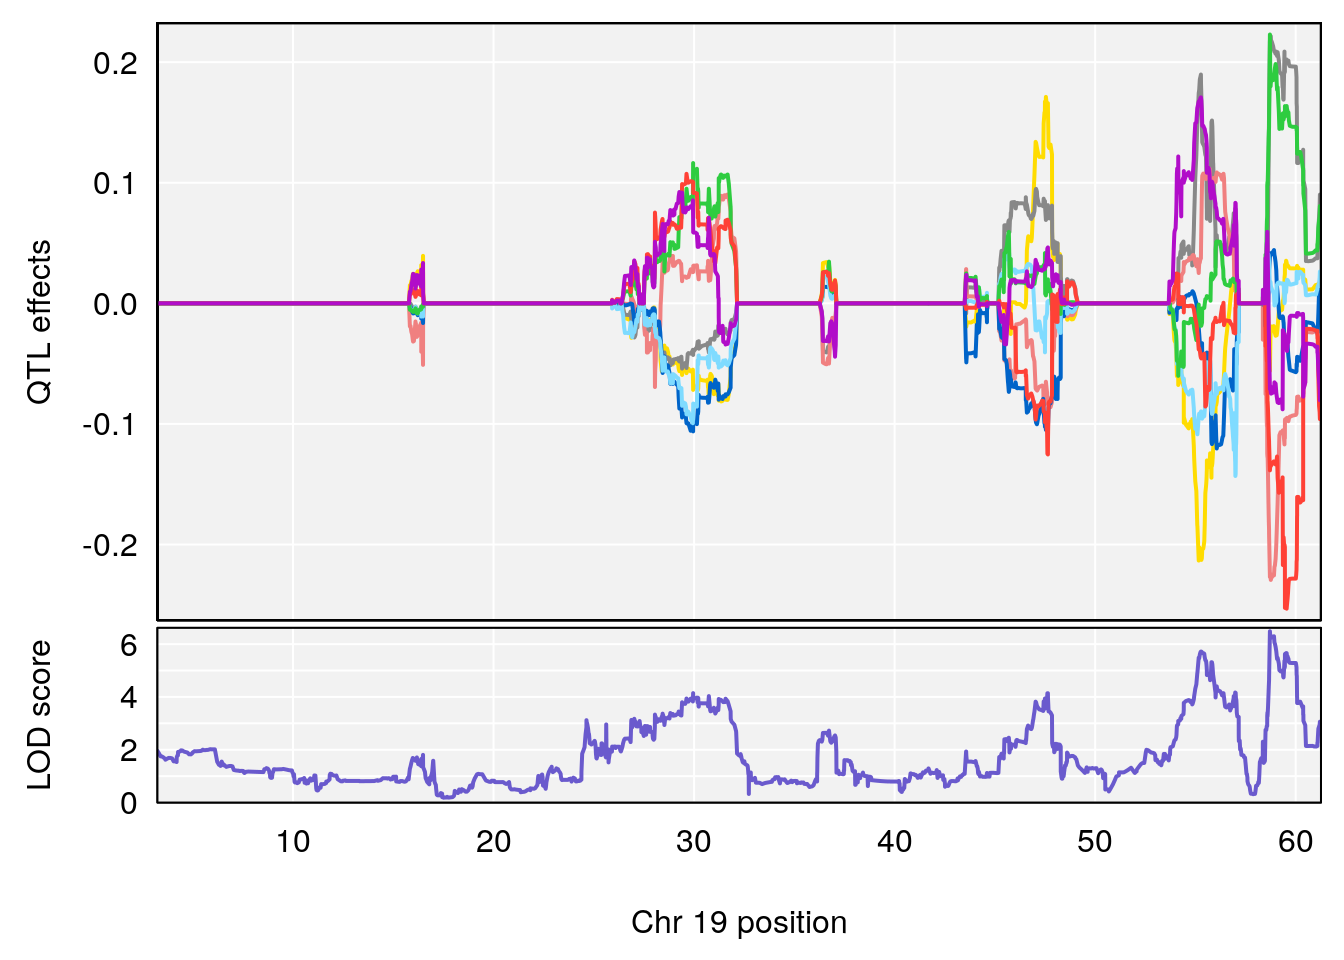
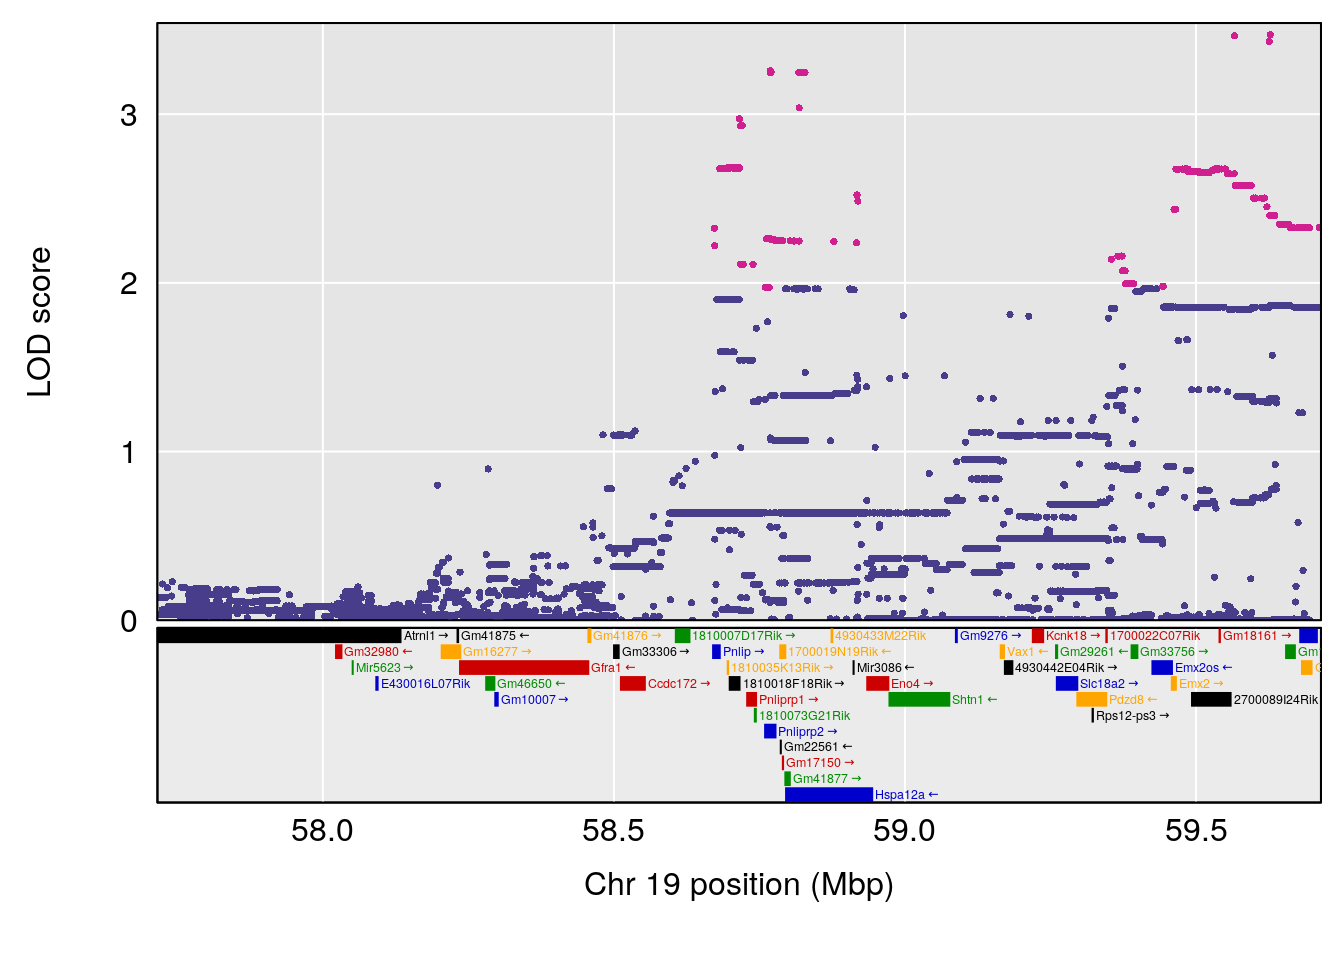
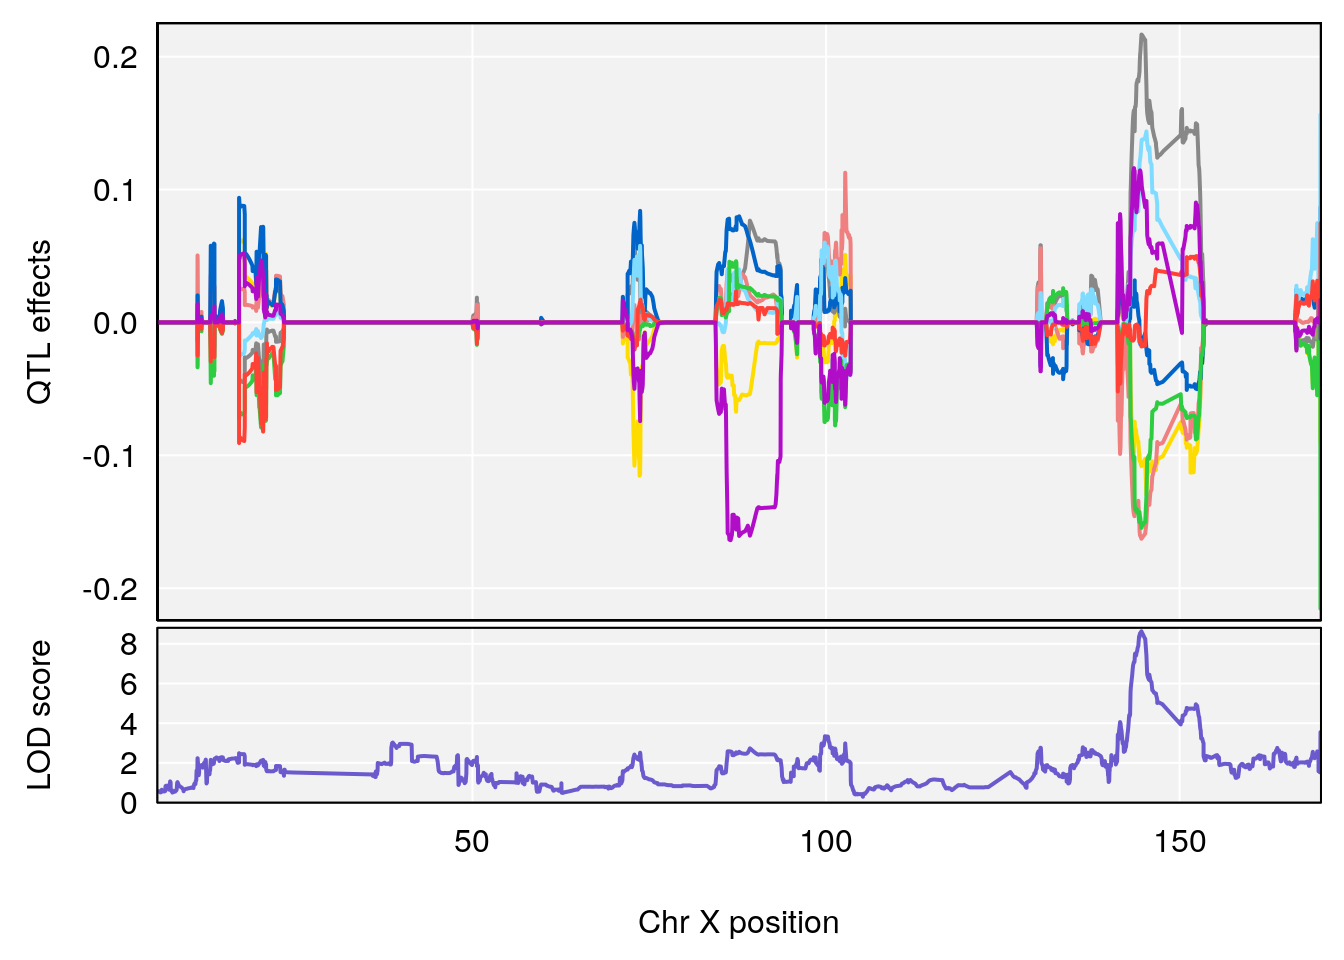
#peaks coeff plot
for(i in names(qtl.morphine.out)){
print(i)
peaks <- find_peaks(qtl.morphine.out[[i]], map=pmap, threshold=6, drop=1.5)
print(peaks)
for(p in 1:dim(peaks)[1]) {
print(p)
chr <-peaks[p,3]
#coeff plot
par(mar=c(4.1, 4.1, 0.6, 0.6))
plot_coefCC(coef_c1[[i]][[p]], pmap[chr], scan1_output=qtl.morphine.out[[i]], bgcolor="gray95", legend=NULL)
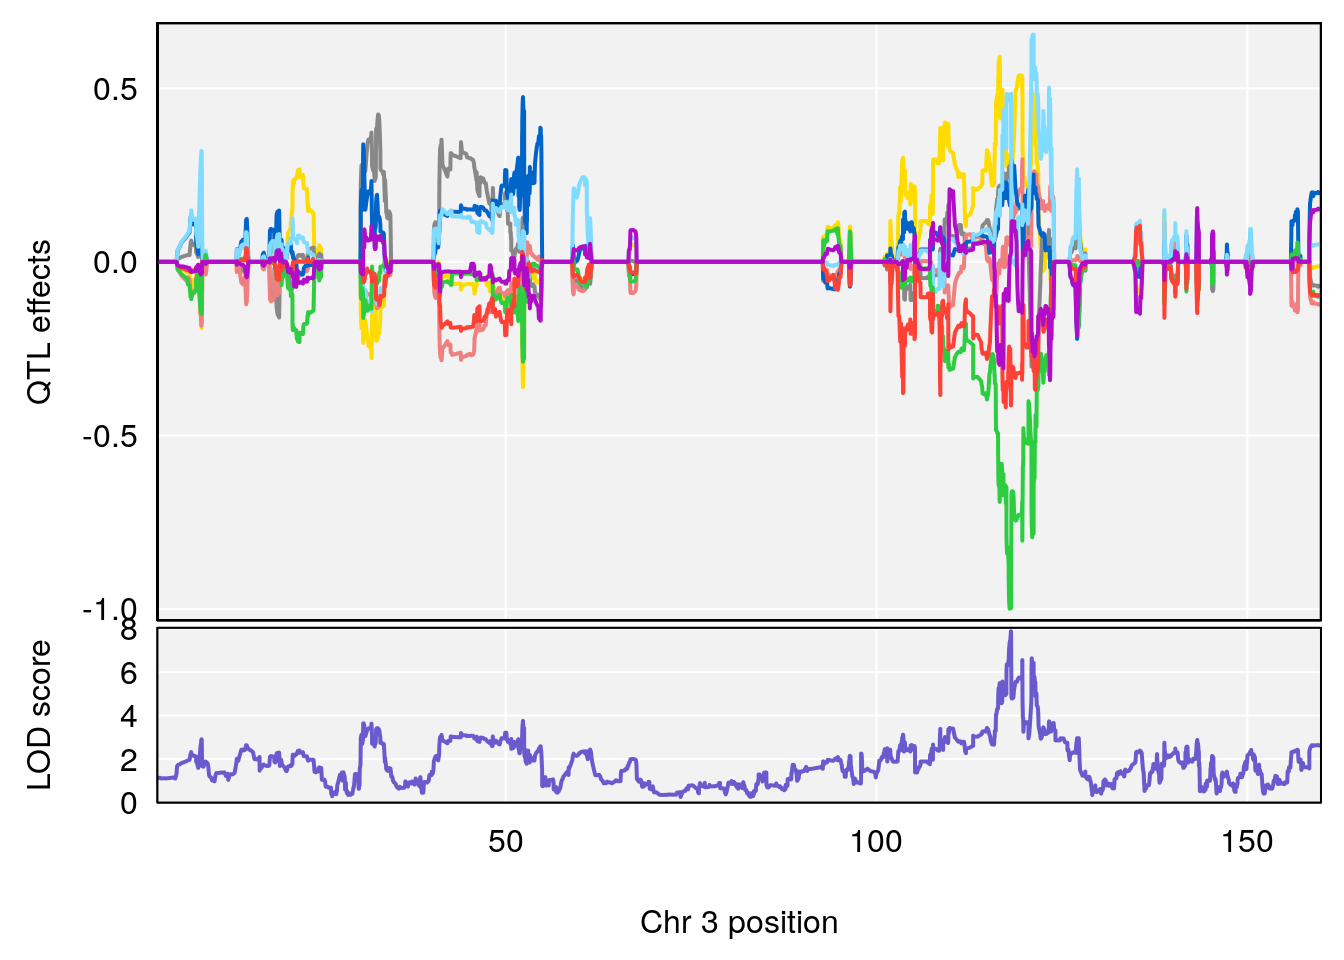
plot_coefCC(coef_c2[[i]][[p]], pmap[chr], scan1_output=qtl.morphine.out[[i]], bgcolor="gray95", legend=NULL)
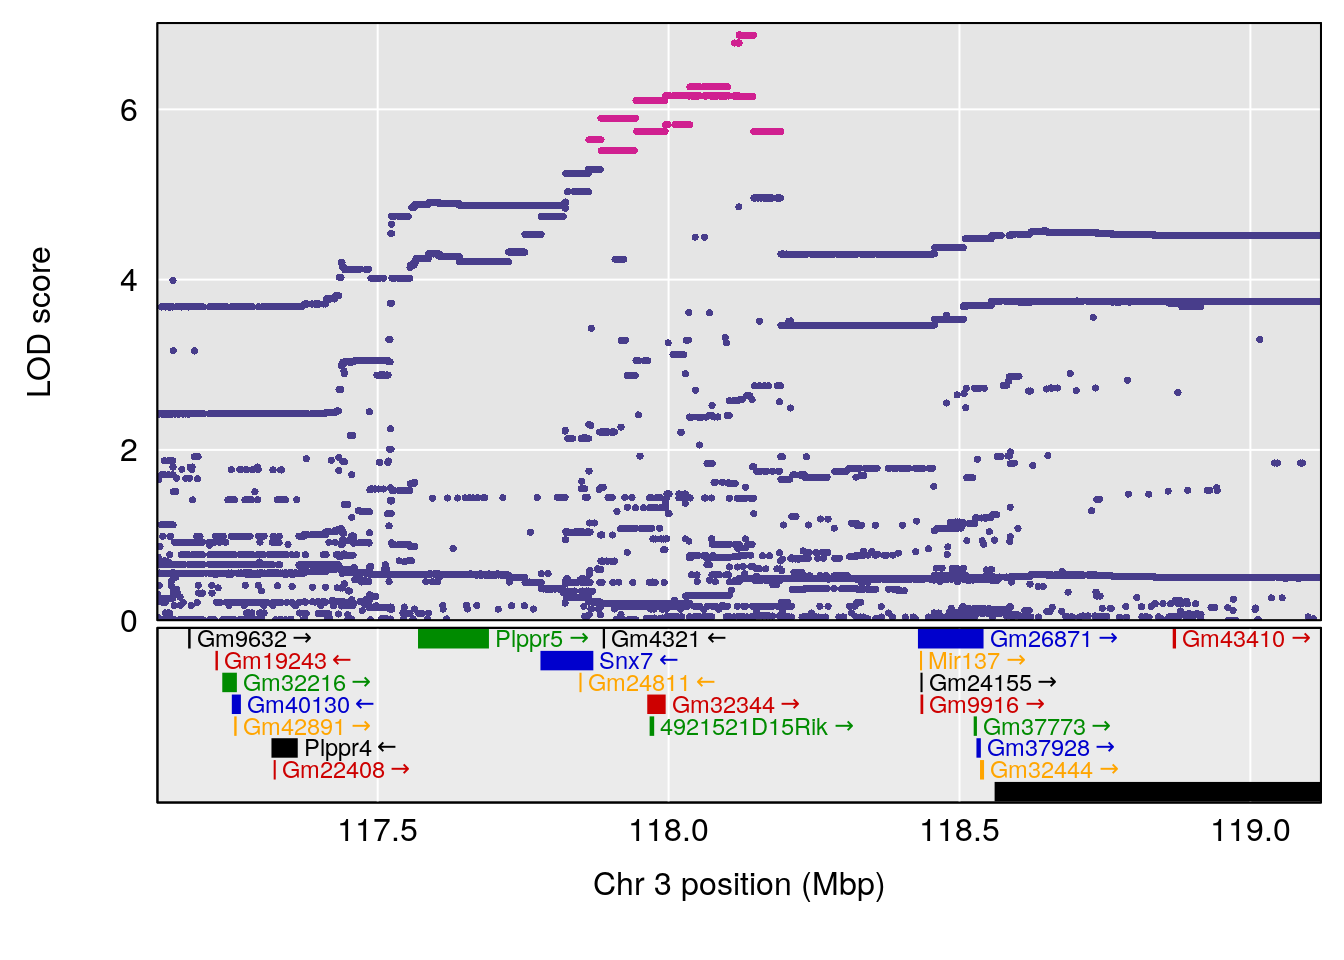
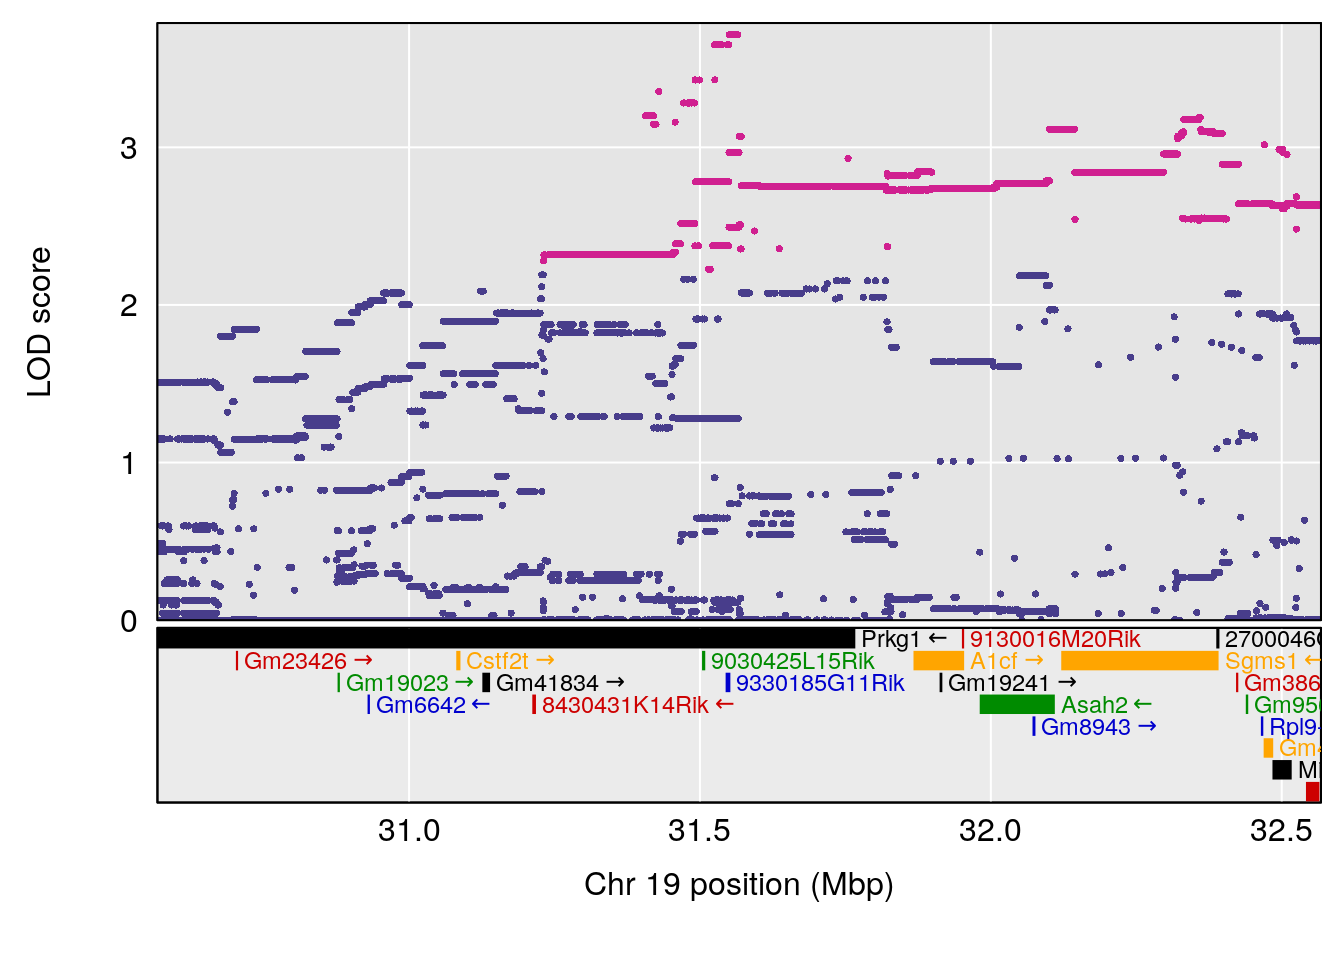
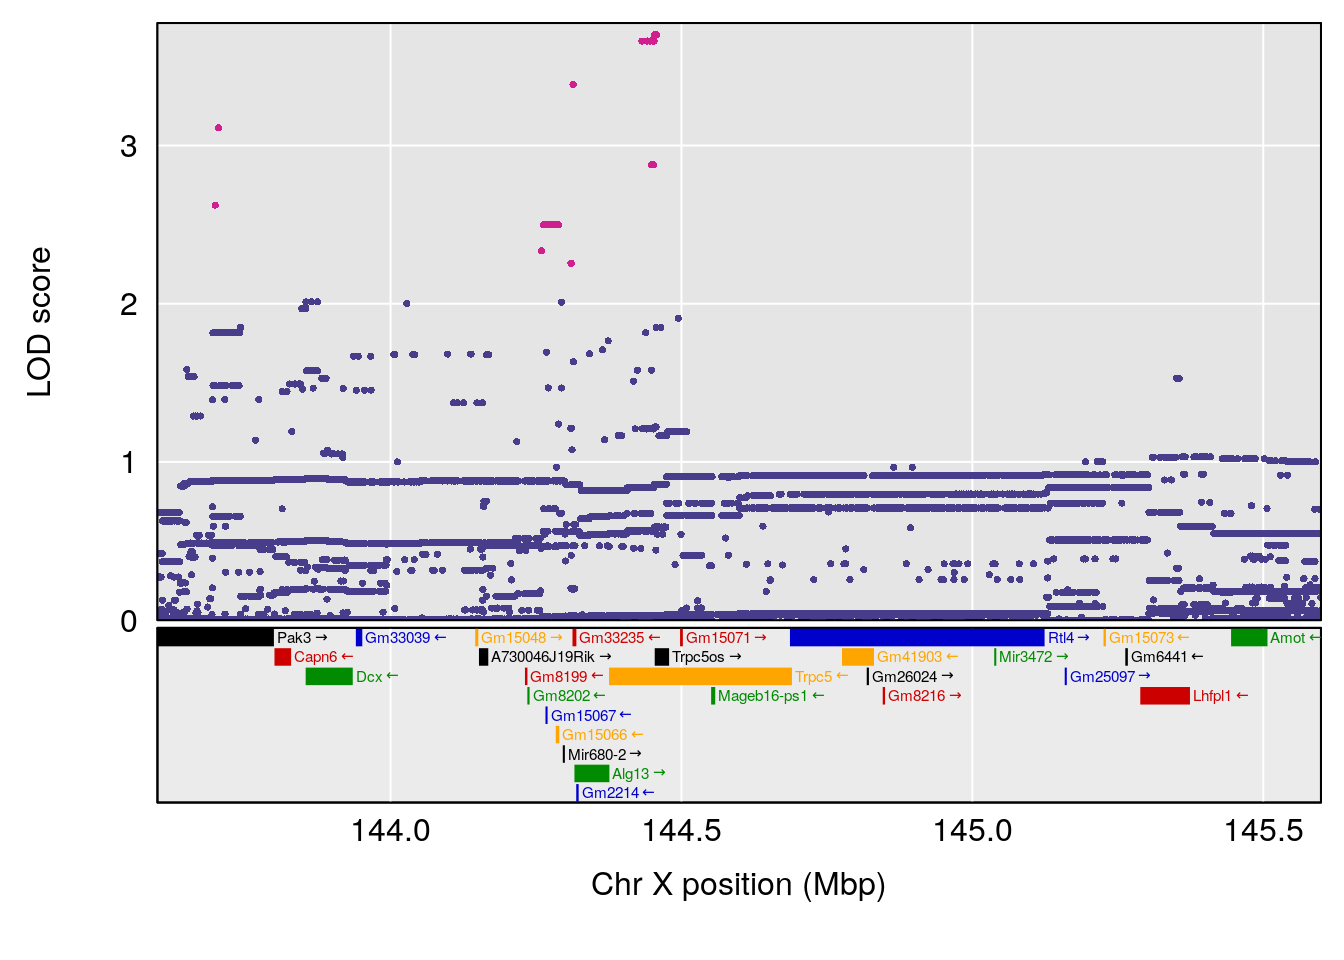
plot(out_snps[[i]][[p]]$lod, out_snps[[i]][[p]]$snpinfo, drop_hilit=1.5, genes=out_genes[[i]][[p]])
}
}
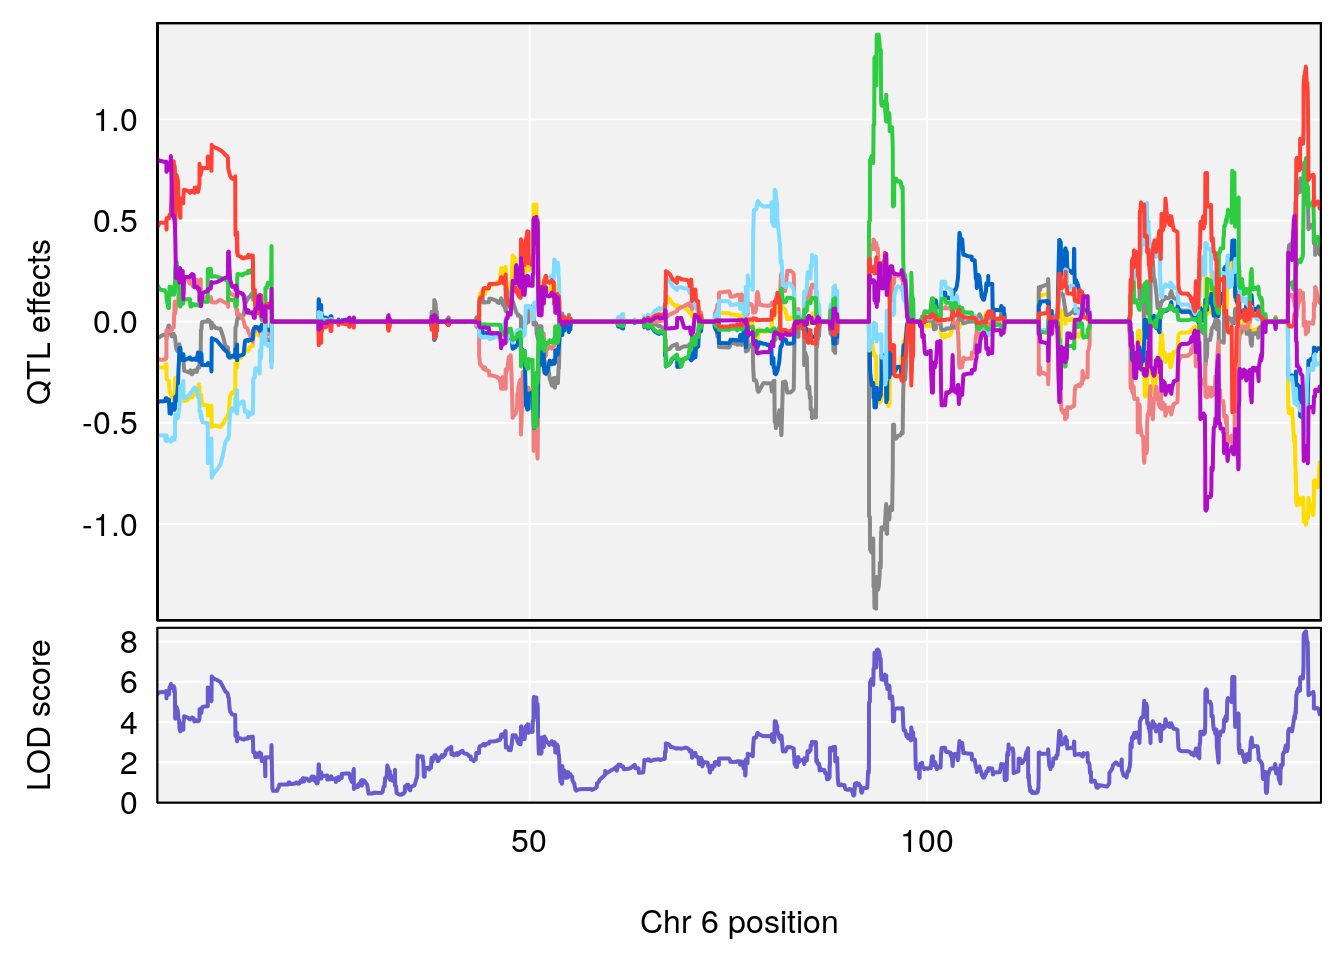
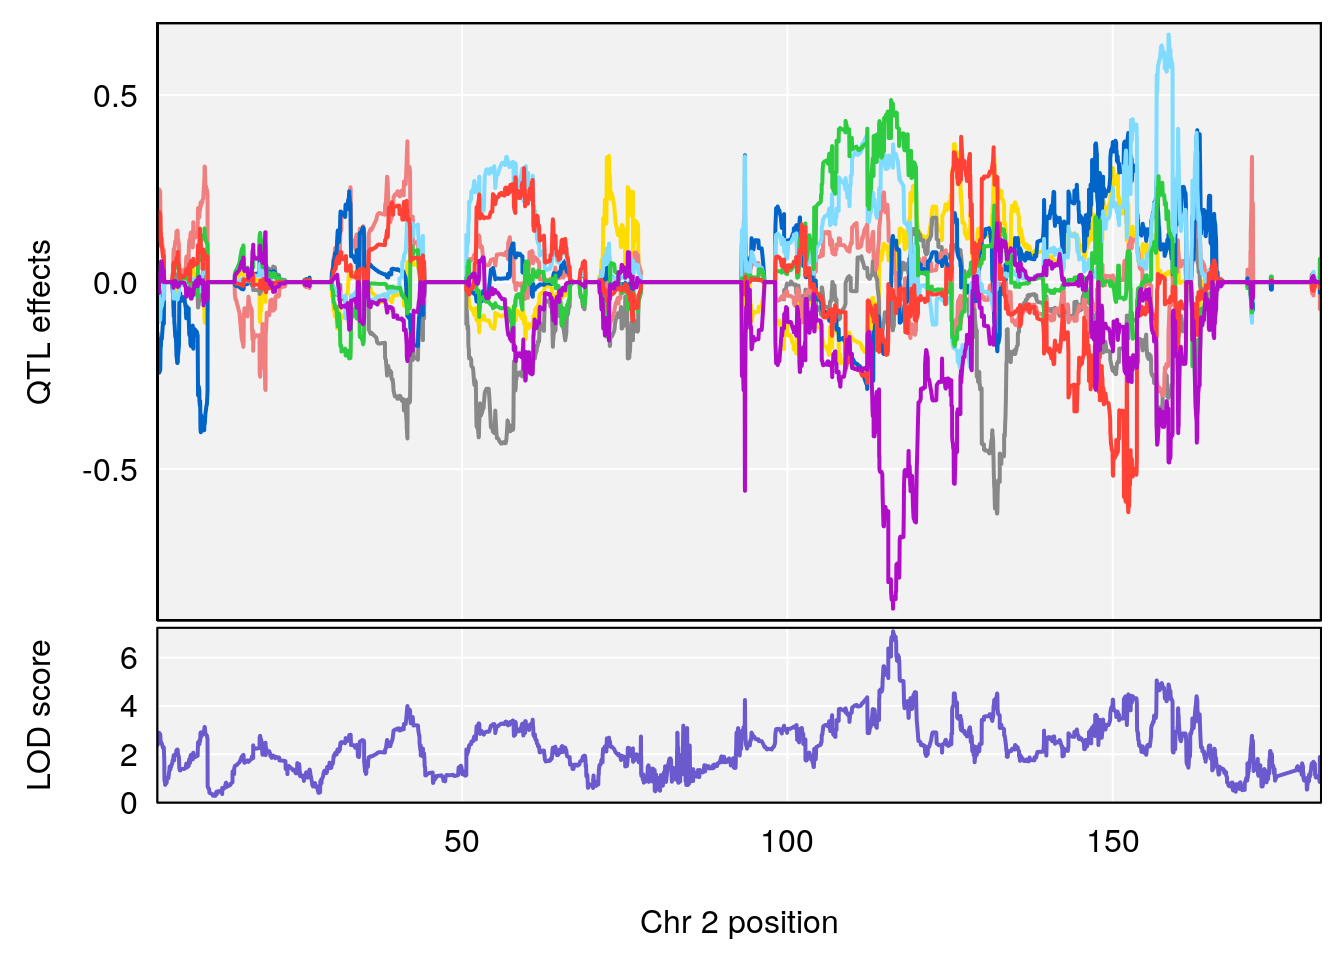
# [1] "Survival.Time"
# lodindex lodcolumn chr pos lod ci_lo ci_hi
# 1 1 pheno1 3 87.75328 7.363908 87.01462 88.24094
# 2 1 pheno1 8 115.47006 10.018661 115.13712 115.57484
# 3 1 pheno1 9 67.05514 7.297535 65.50554 67.16519
# 4 1 pheno1 15 29.63536 7.380134 28.36166 30.77732
# [1] 1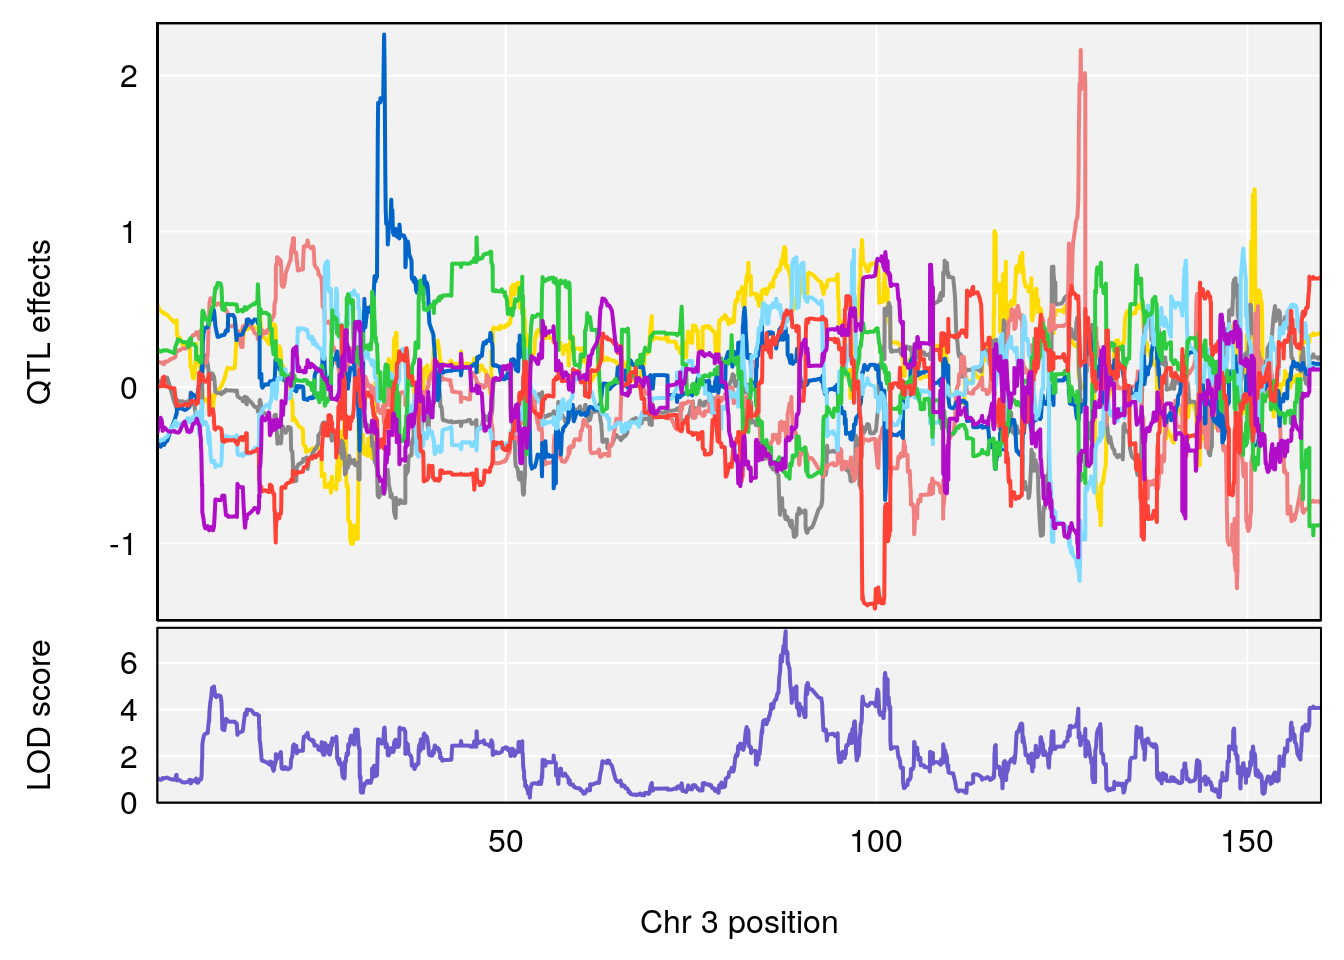
| Version | Author | Date |
|---|---|---|
| 8fe8543 | xhyuo | 2023-02-20 |
| Version | Author | Date |
|---|---|---|
| 8fe8543 | xhyuo | 2023-02-20 |
| Version | Author | Date |
|---|---|---|
| 8fe8543 | xhyuo | 2023-02-20 |
# [1] 2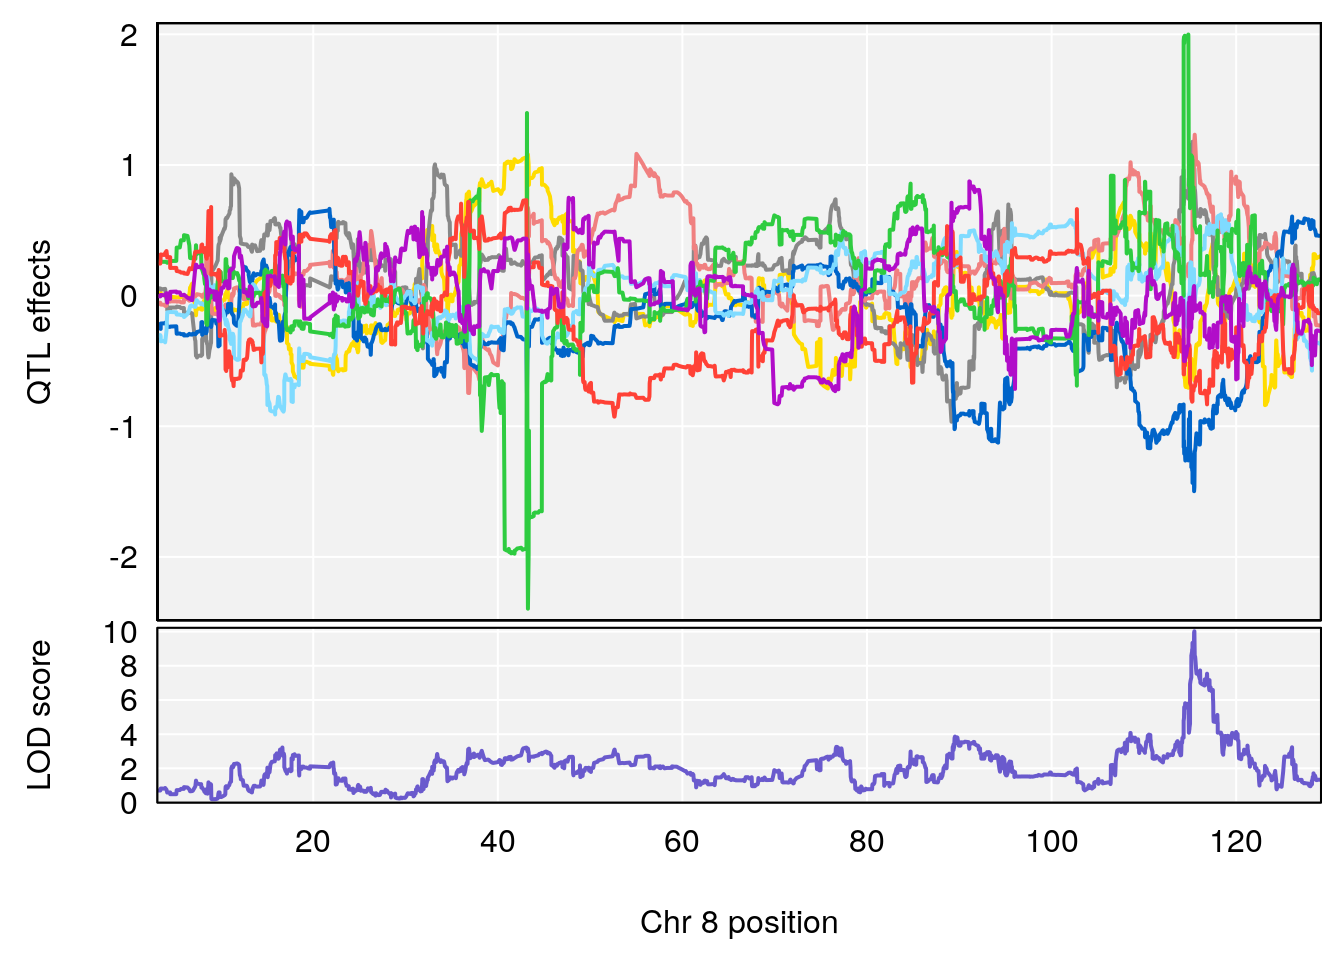
| Version | Author | Date |
|---|---|---|
| 8fe8543 | xhyuo | 2023-02-20 |
| Version | Author | Date |
|---|---|---|
| 8fe8543 | xhyuo | 2023-02-20 |
| Version | Author | Date |
|---|---|---|
| 8fe8543 | xhyuo | 2023-02-20 |
# [1] 3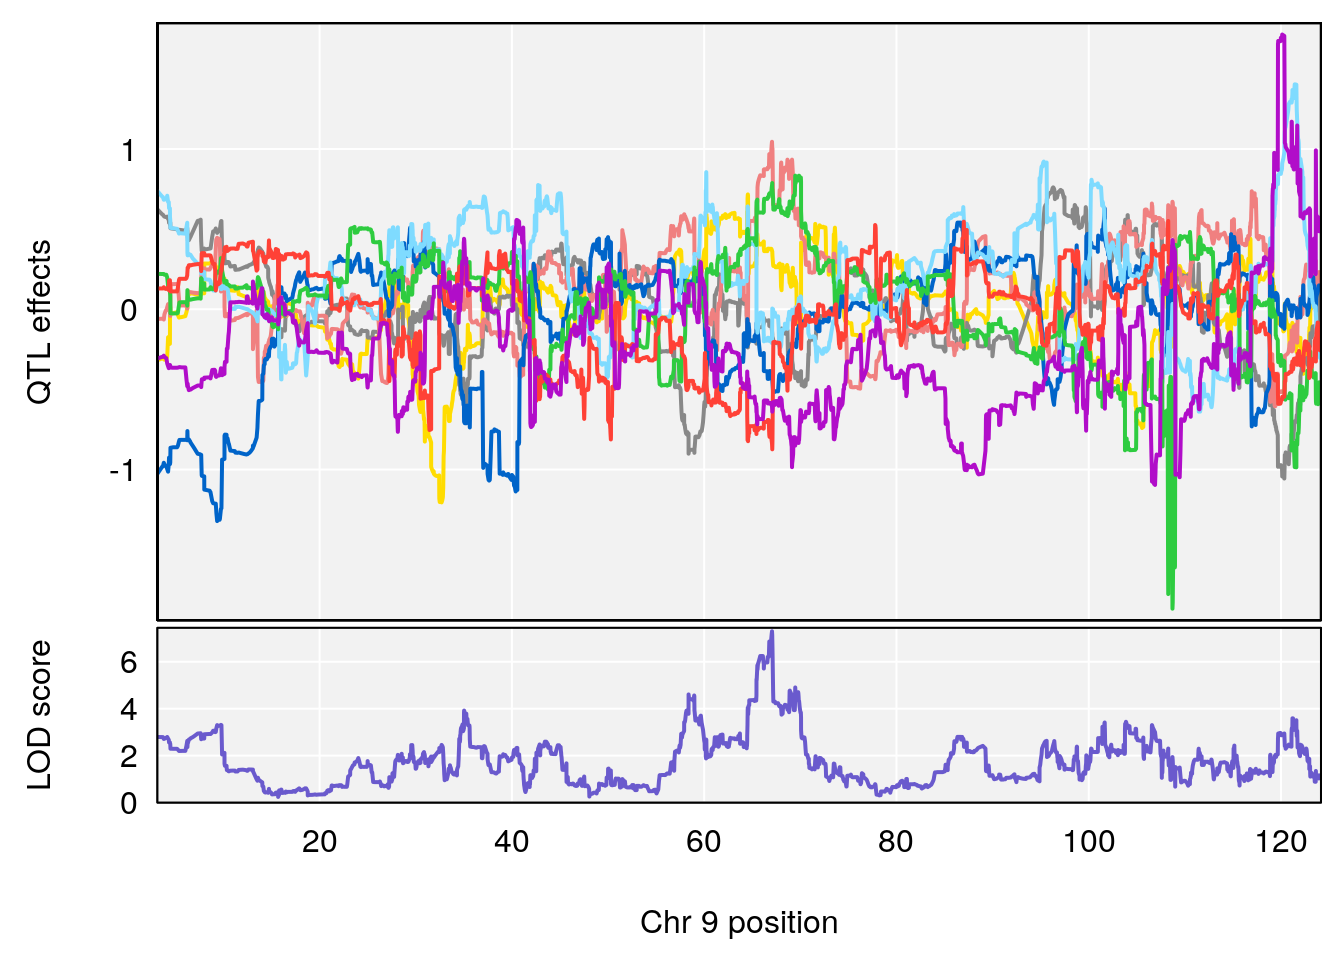
| Version | Author | Date |
|---|---|---|
| 8fe8543 | xhyuo | 2023-02-20 |
| Version | Author | Date |
|---|---|---|
| 8fe8543 | xhyuo | 2023-02-20 |
| Version | Author | Date |
|---|---|---|
| 8fe8543 | xhyuo | 2023-02-20 |
# [1] 4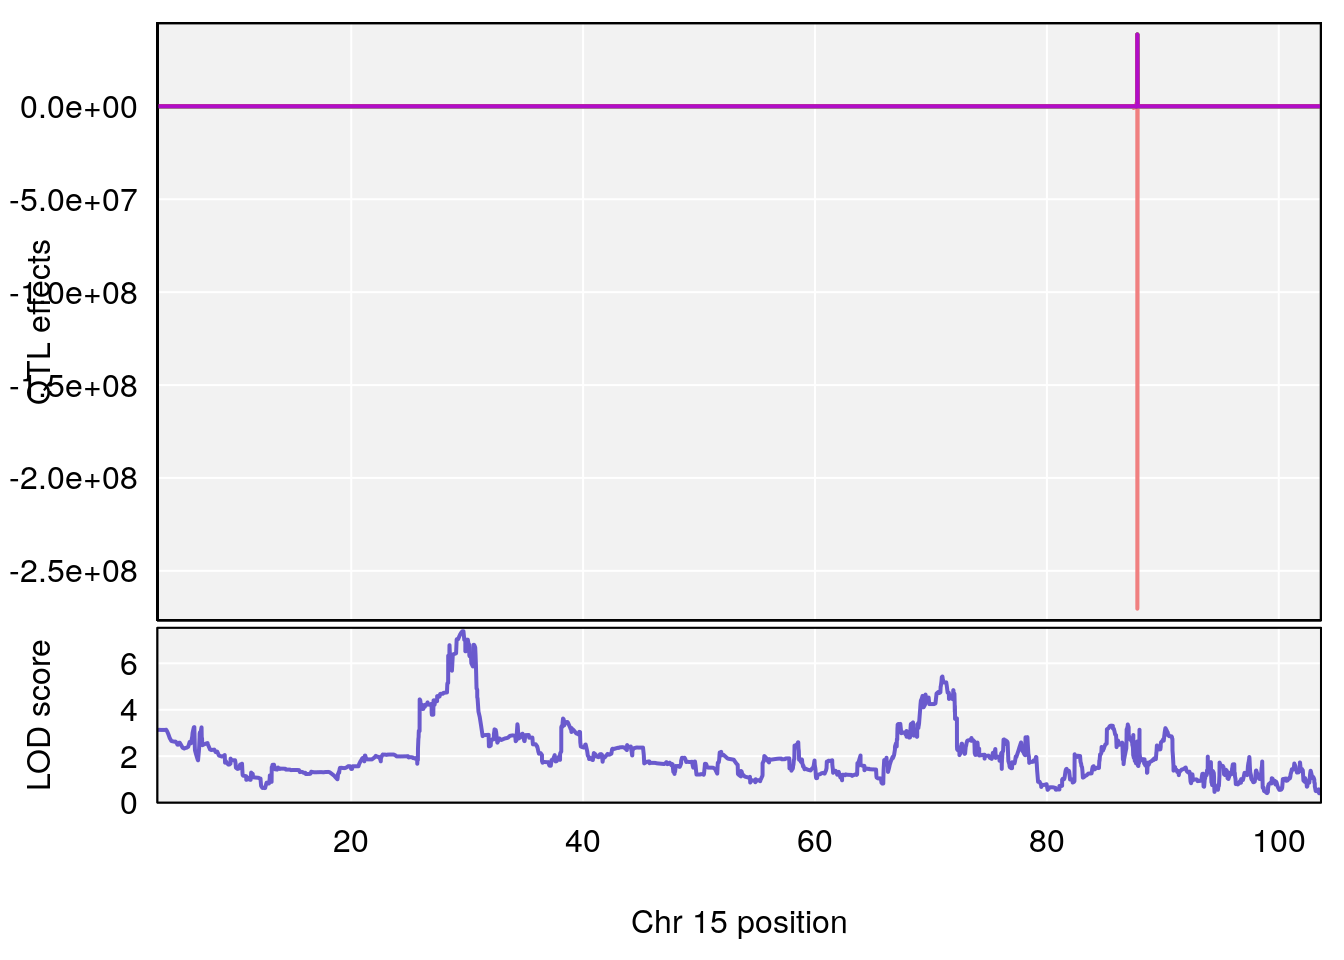
| Version | Author | Date |
|---|---|---|
| 8fe8543 | xhyuo | 2023-02-20 |
| Version | Author | Date |
|---|---|---|
| 8fe8543 | xhyuo | 2023-02-20 |
| Version | Author | Date |
|---|---|---|
| 8fe8543 | xhyuo | 2023-02-20 |
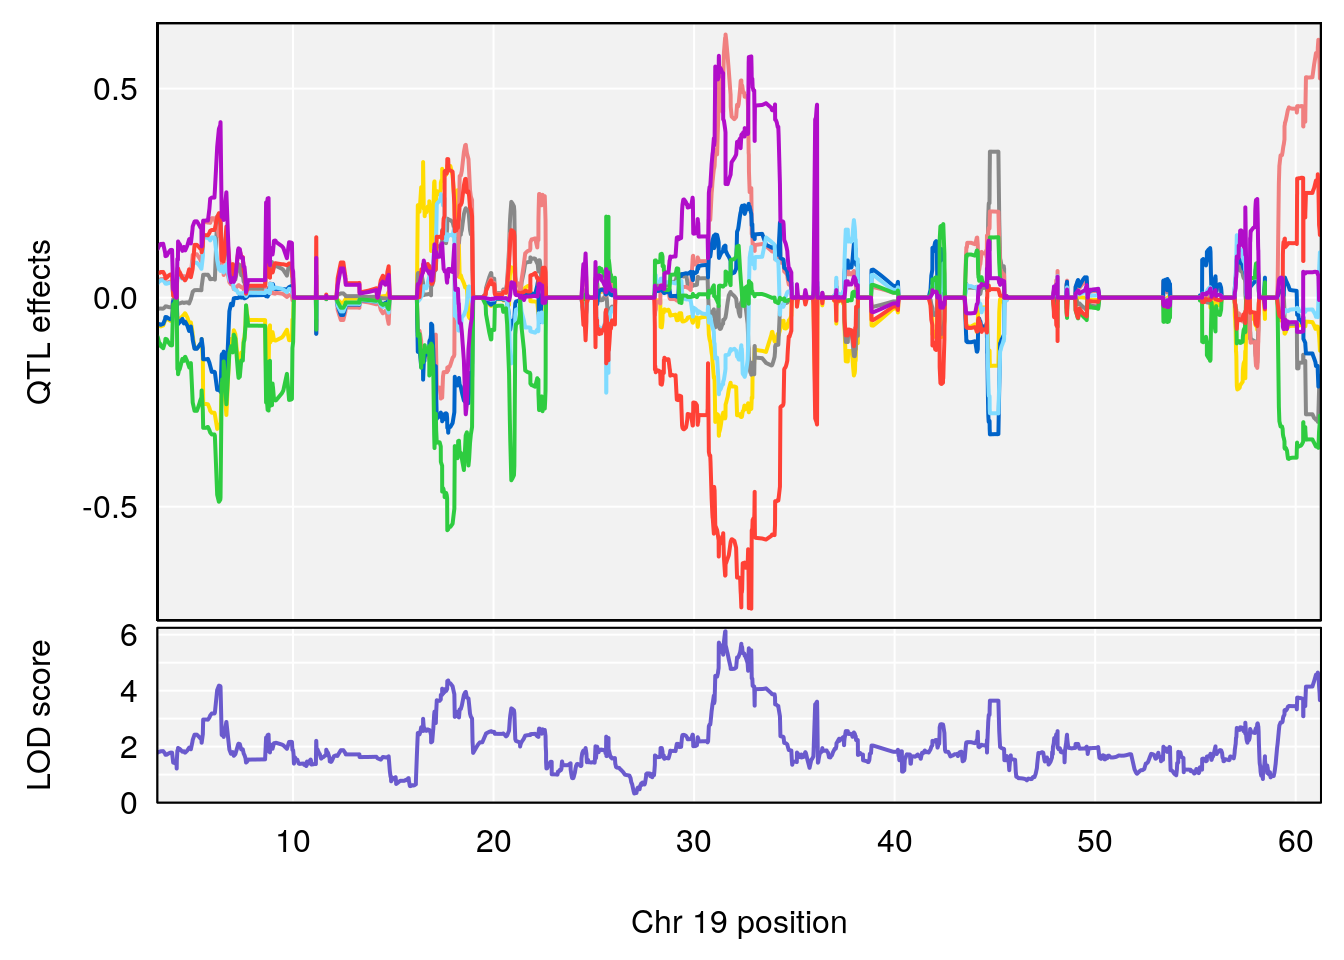
# [1] "Recovery.Time"
#   lodindex lodcolumn chr       pos      lod      ci_lo     ci_hi
# 1        1    pheno1   3 118.12137 7.879474 117.724824 121.19240
# 2        1    pheno1   5  92.74391 6.788068  37.152061  97.94610
# 3        1    pheno1   6 110.10532 6.075225 103.818523 140.20546
# 4        1    pheno1  16  28.53624 6.114898  27.599995  29.50554
# 5        1    pheno1  17  11.31727 6.342205   8.947284  12.16295
# 6        1    pheno1  19  31.56747 6.122590  31.188745  61.13260
# [1] 1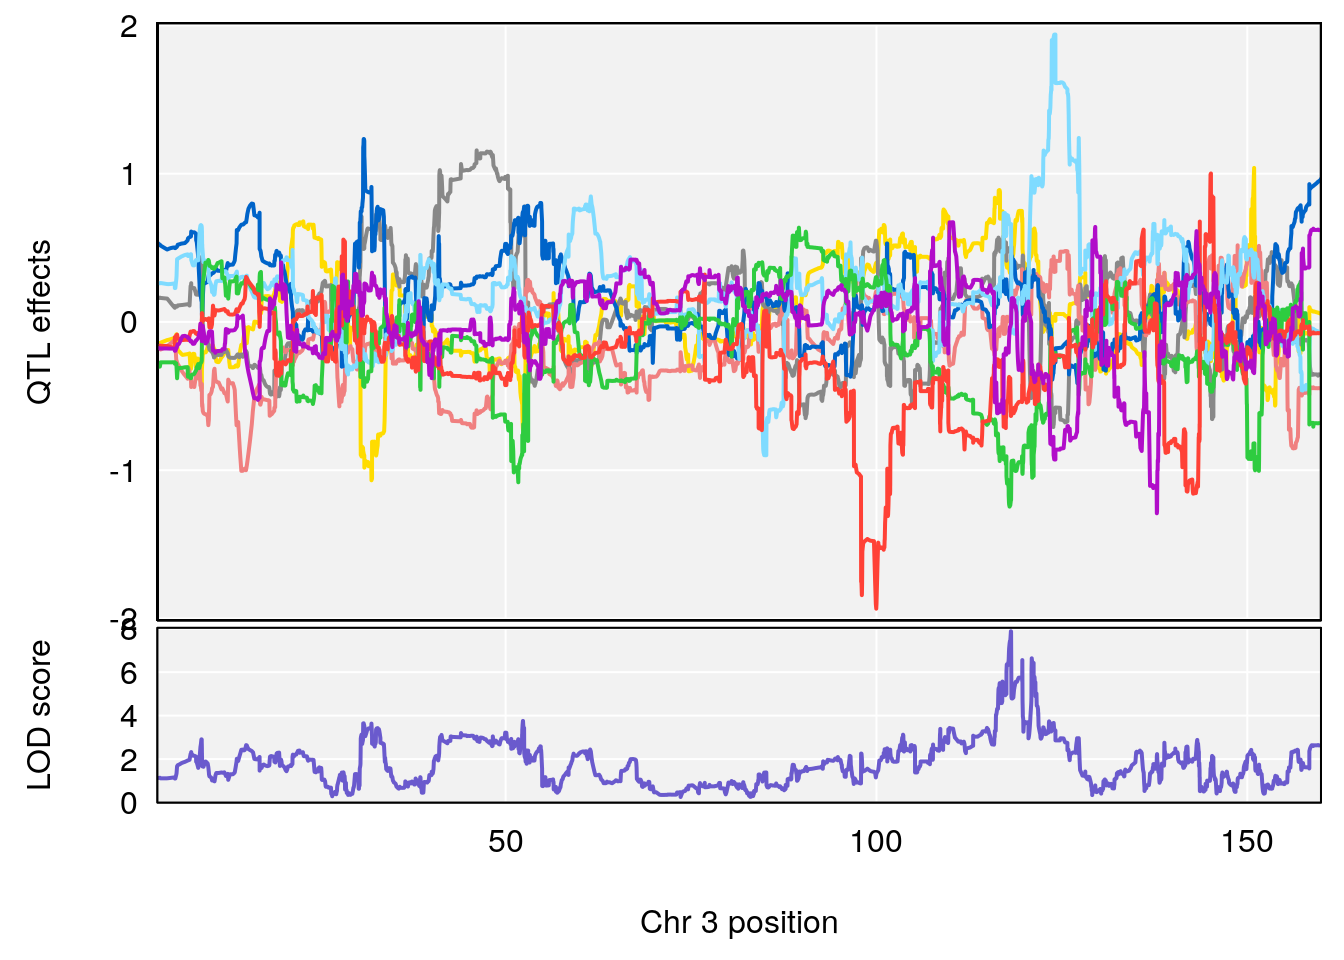
| Version | Author | Date |
|---|---|---|
| 8fe8543 | xhyuo | 2023-02-20 |
| Version | Author | Date |
|---|---|---|
| 8fe8543 | xhyuo | 2023-02-20 |
| Version | Author | Date |
|---|---|---|
| 8fe8543 | xhyuo | 2023-02-20 |
# [1] 2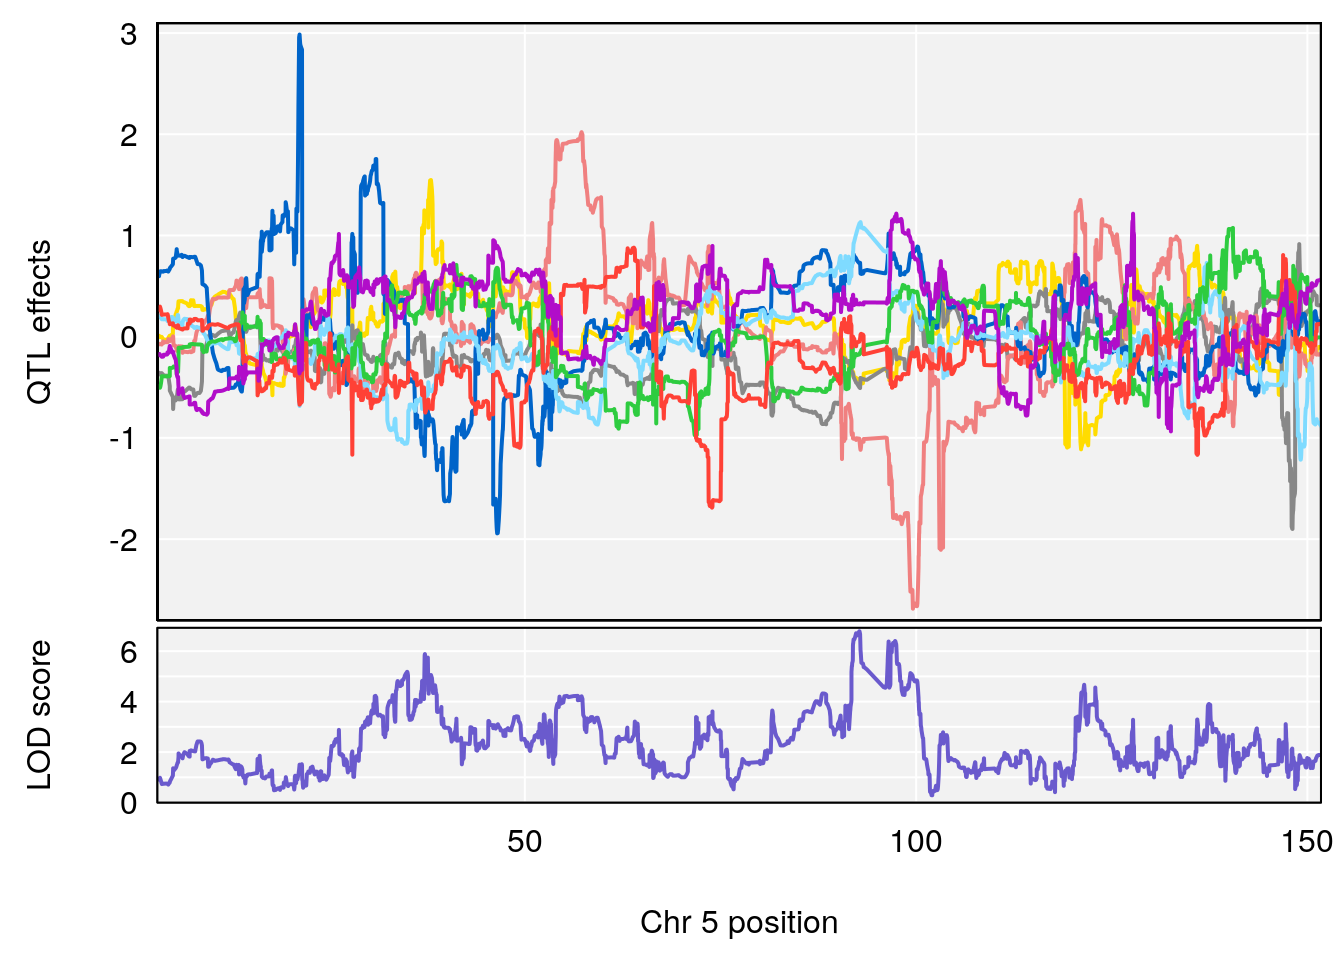
| Version | Author | Date |
|---|---|---|
| 8fe8543 | xhyuo | 2023-02-20 |
| Version | Author | Date |
|---|---|---|
| 8fe8543 | xhyuo | 2023-02-20 |
| Version | Author | Date |
|---|---|---|
| 8fe8543 | xhyuo | 2023-02-20 |
# [1] 3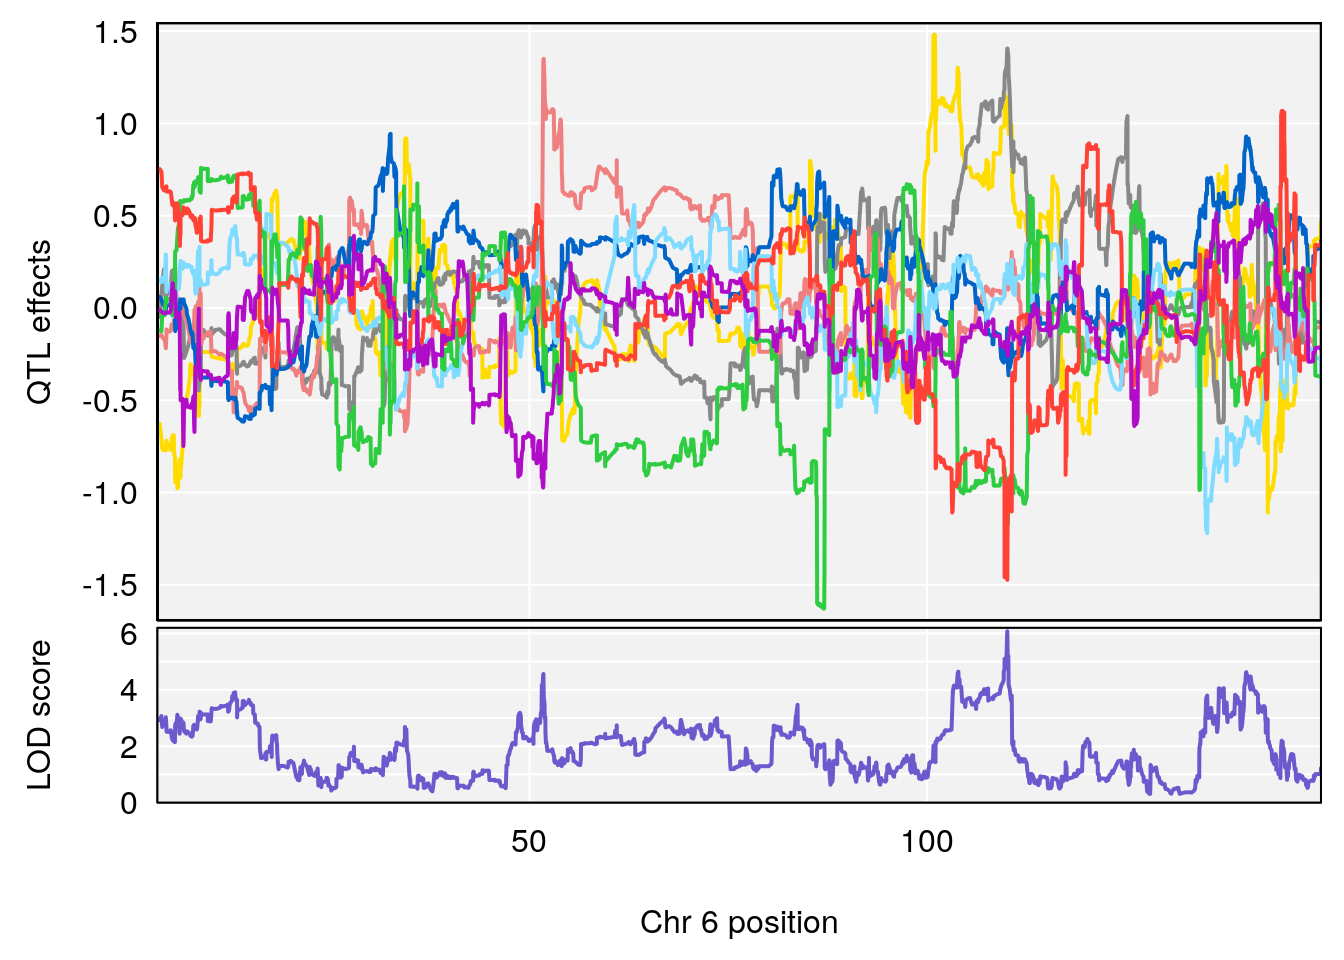
| Version | Author | Date |
|---|---|---|
| 8fe8543 | xhyuo | 2023-02-20 |
| Version | Author | Date |
|---|---|---|
| 8fe8543 | xhyuo | 2023-02-20 |
| Version | Author | Date |
|---|---|---|
| 8fe8543 | xhyuo | 2023-02-20 |
# [1] 4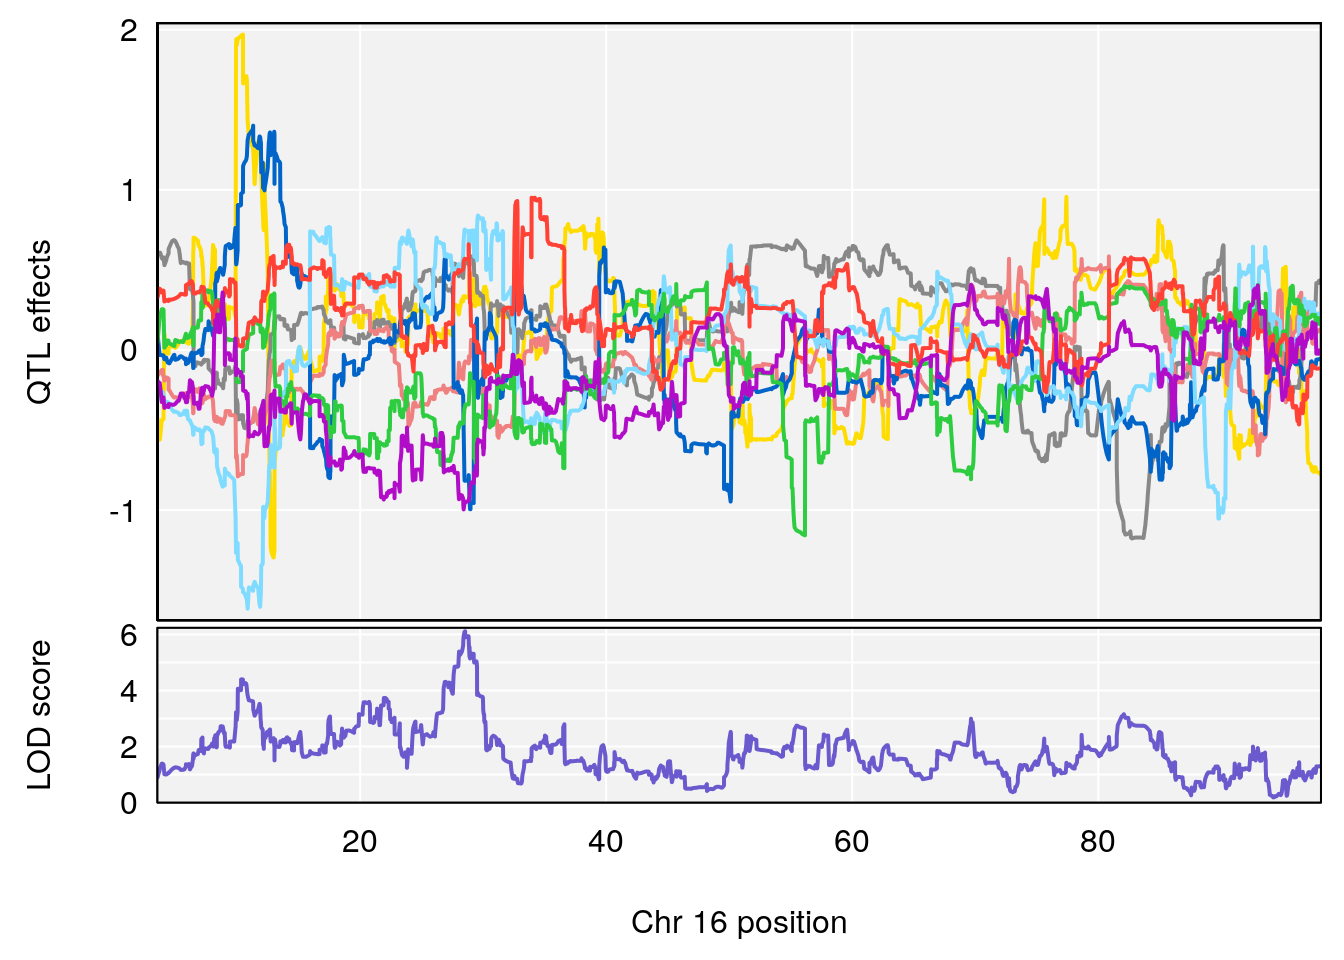
| Version | Author | Date |
|---|---|---|
| 8fe8543 | xhyuo | 2023-02-20 |
| Version | Author | Date |
|---|---|---|
| 8fe8543 | xhyuo | 2023-02-20 |
| Version | Author | Date |
|---|---|---|
| 8fe8543 | xhyuo | 2023-02-20 |
# [1] 5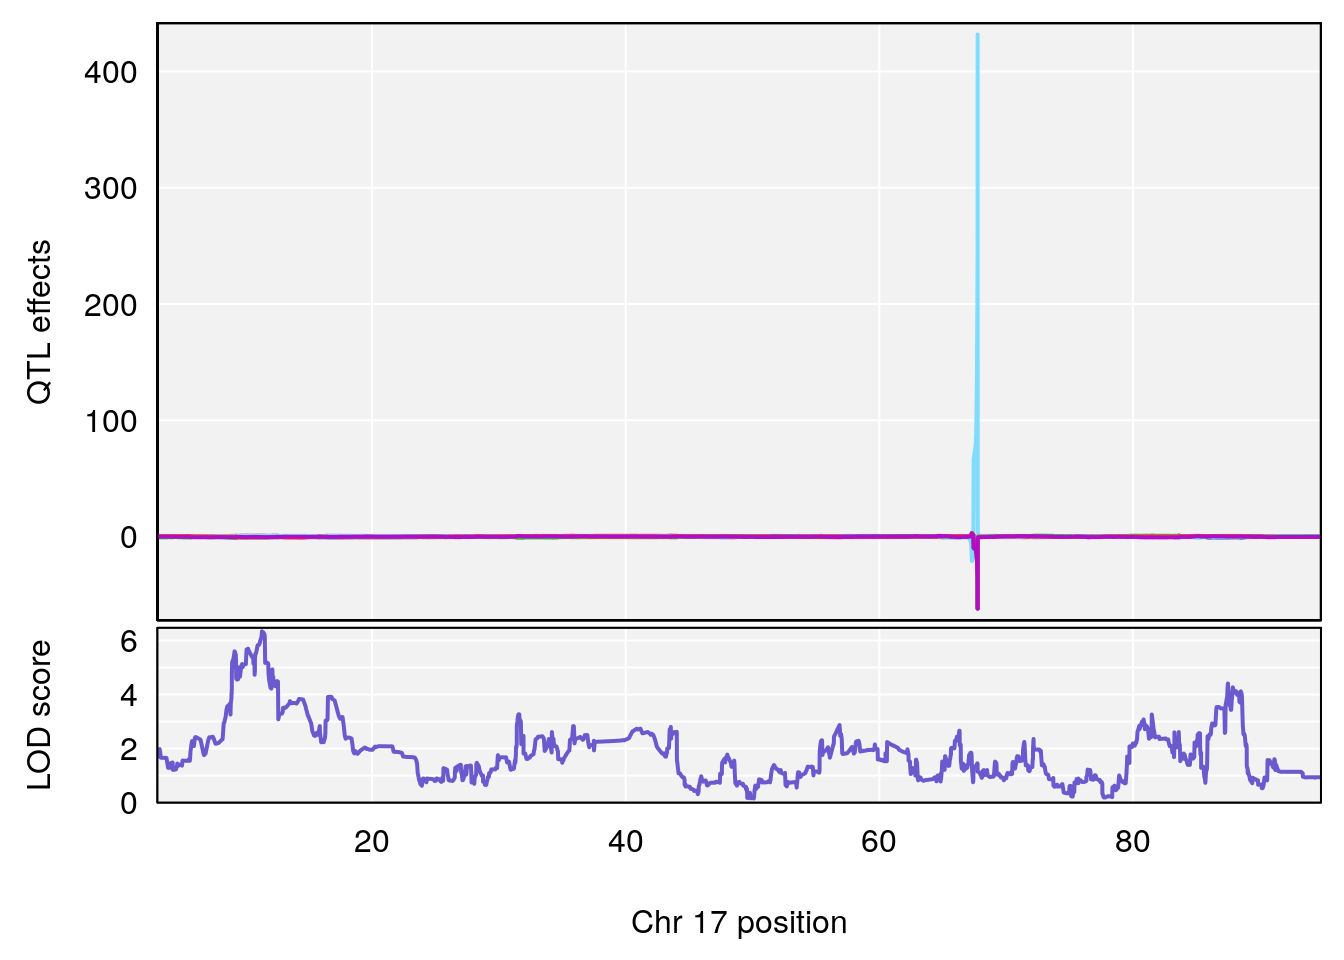
| Version | Author | Date |
|---|---|---|
| 8fe8543 | xhyuo | 2023-02-20 |
| Version | Author | Date |
|---|---|---|
| 8fe8543 | xhyuo | 2023-02-20 |
| Version | Author | Date |
|---|---|---|
| 8fe8543 | xhyuo | 2023-02-20 |
# [1] 6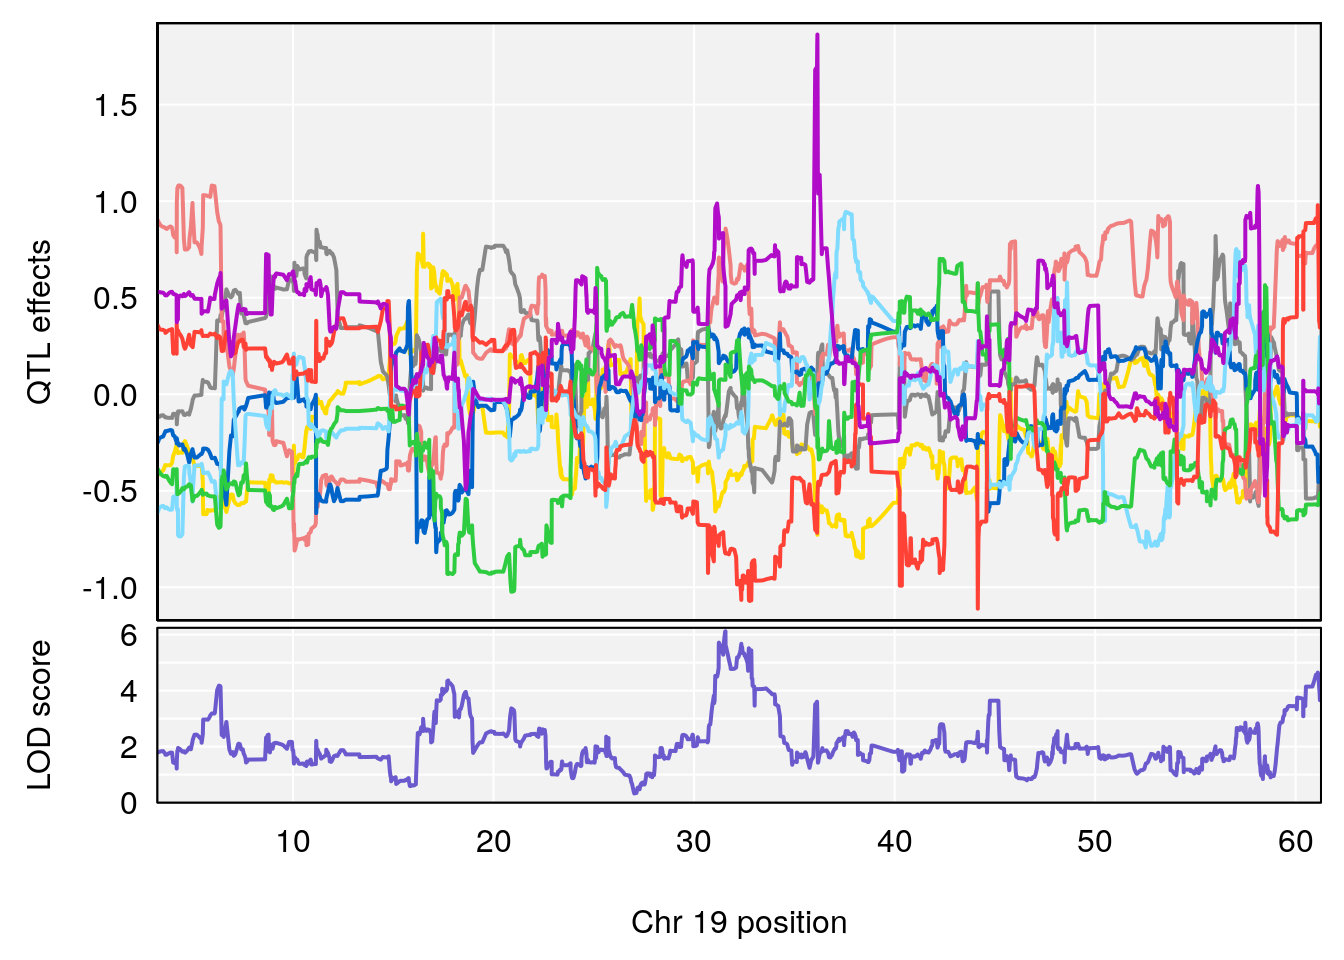
| Version | Author | Date |
|---|---|---|
| 8fe8543 | xhyuo | 2023-02-20 |
| Version | Author | Date |
|---|---|---|
| 8fe8543 | xhyuo | 2023-02-20 |
| Version | Author | Date |
|---|---|---|
| 8fe8543 | xhyuo | 2023-02-20 |
# [1] "Min.depression"
#   lodindex lodcolumn chr       pos      lod      ci_lo     ci_hi
# 1        1    pheno1   4 156.19609 6.005957   9.858468 156.25473
# 2        1    pheno1  10 125.55489 6.017892 125.435827 126.91023
# 3        1    pheno1  19  58.87562 6.340088  42.445420  59.03354
# [1] 1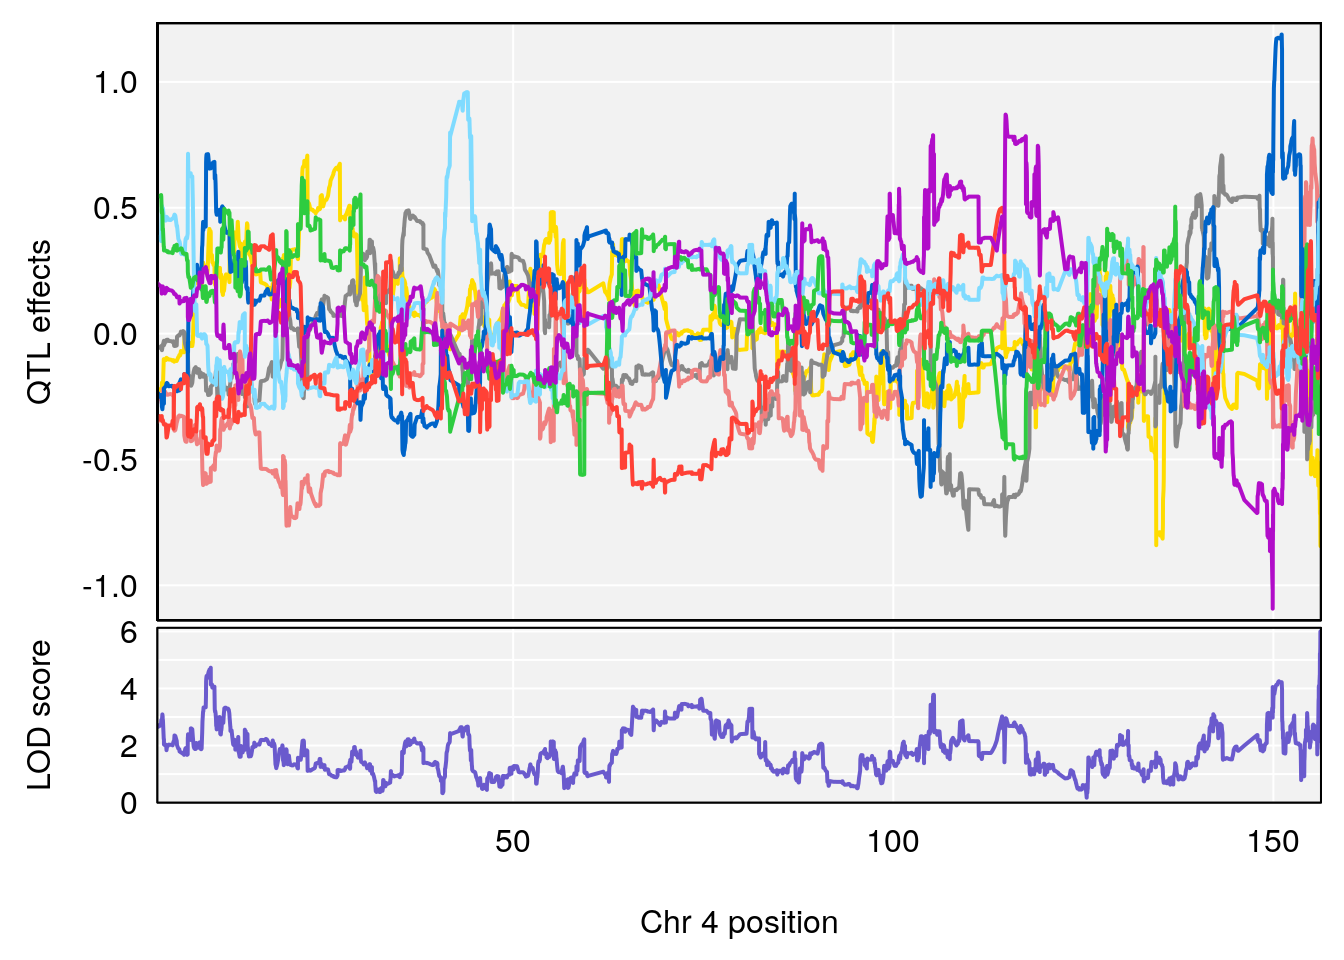
| Version | Author | Date |
|---|---|---|
| 8fe8543 | xhyuo | 2023-02-20 |
| Version | Author | Date |
|---|---|---|
| 8fe8543 | xhyuo | 2023-02-20 |
| Version | Author | Date |
|---|---|---|
| 8fe8543 | xhyuo | 2023-02-20 |
# [1] 2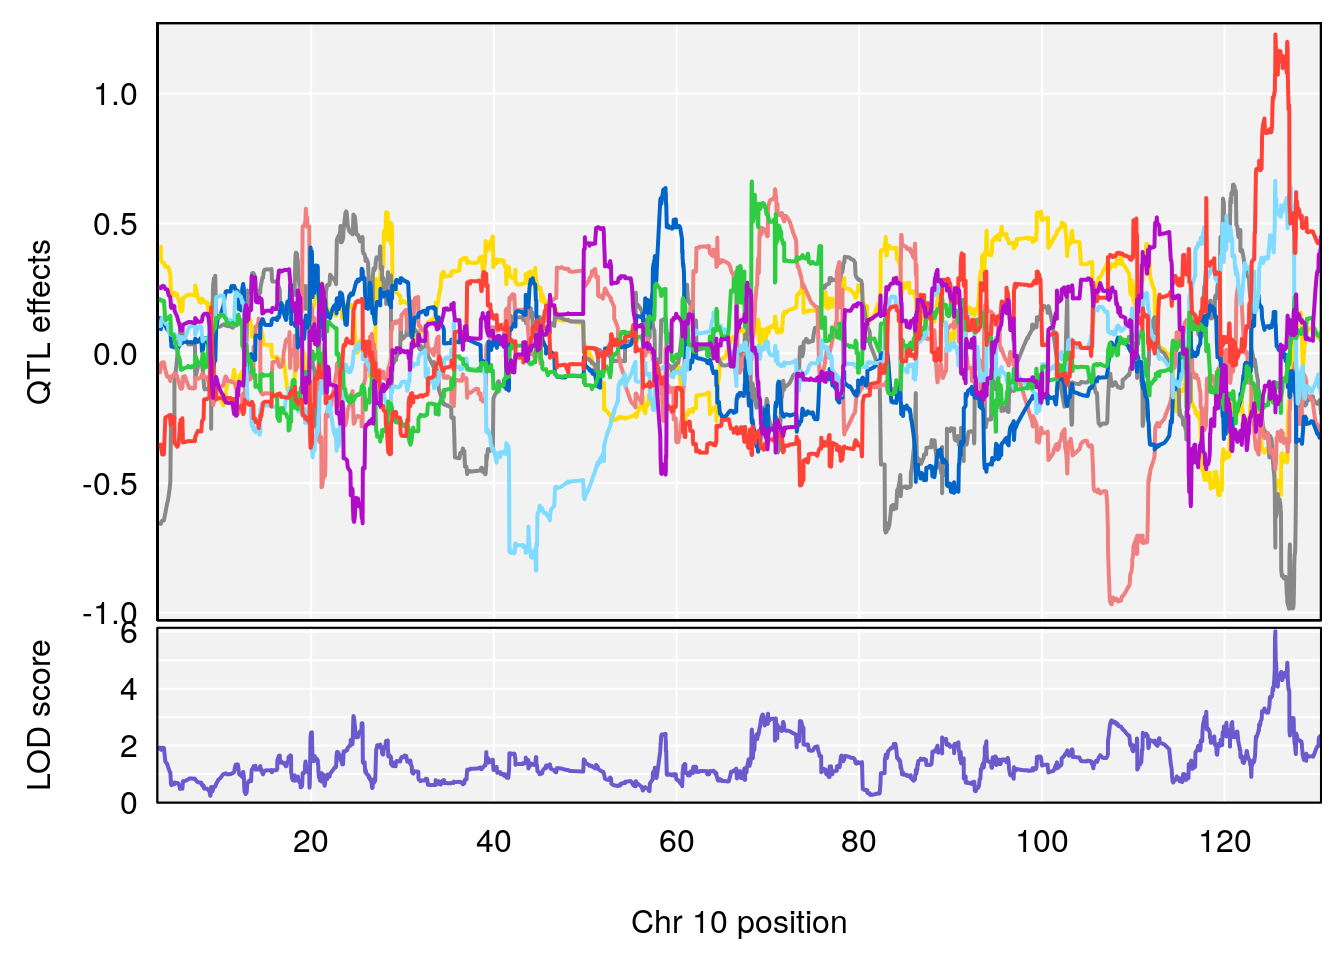
| Version | Author | Date |
|---|---|---|
| 8fe8543 | xhyuo | 2023-02-20 |
| Version | Author | Date |
|---|---|---|
| 8fe8543 | xhyuo | 2023-02-20 |
| Version | Author | Date |
|---|---|---|
| 8fe8543 | xhyuo | 2023-02-20 |
# [1] 3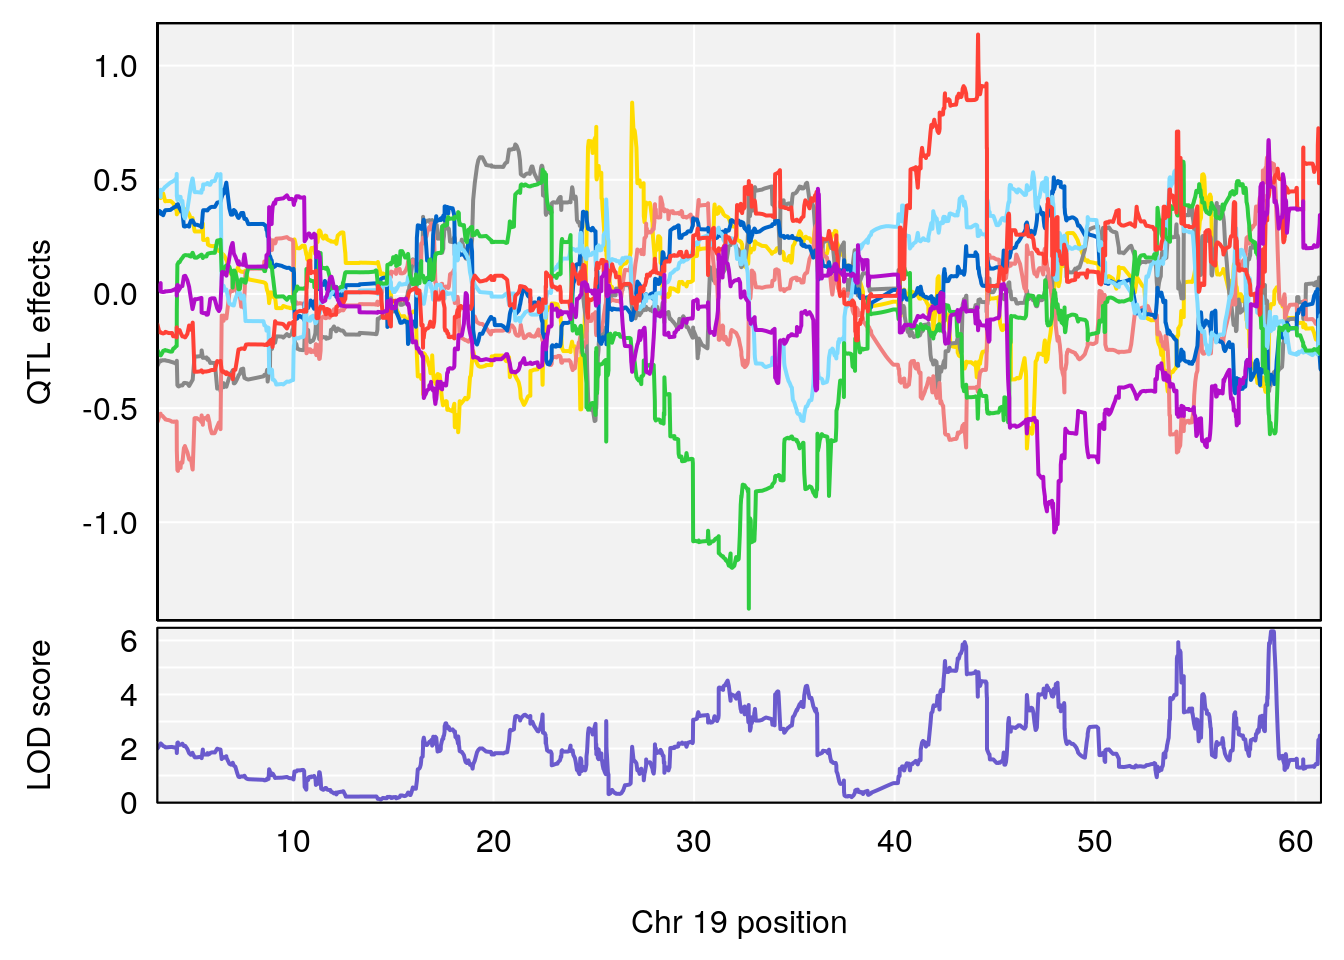
| Version | Author | Date |
|---|---|---|
| 8fe8543 | xhyuo | 2023-02-20 |
| Version | Author | Date |
|---|---|---|
| 8fe8543 | xhyuo | 2023-02-20 |
| Version | Author | Date |
|---|---|---|
| 8fe8543 | xhyuo | 2023-02-20 |
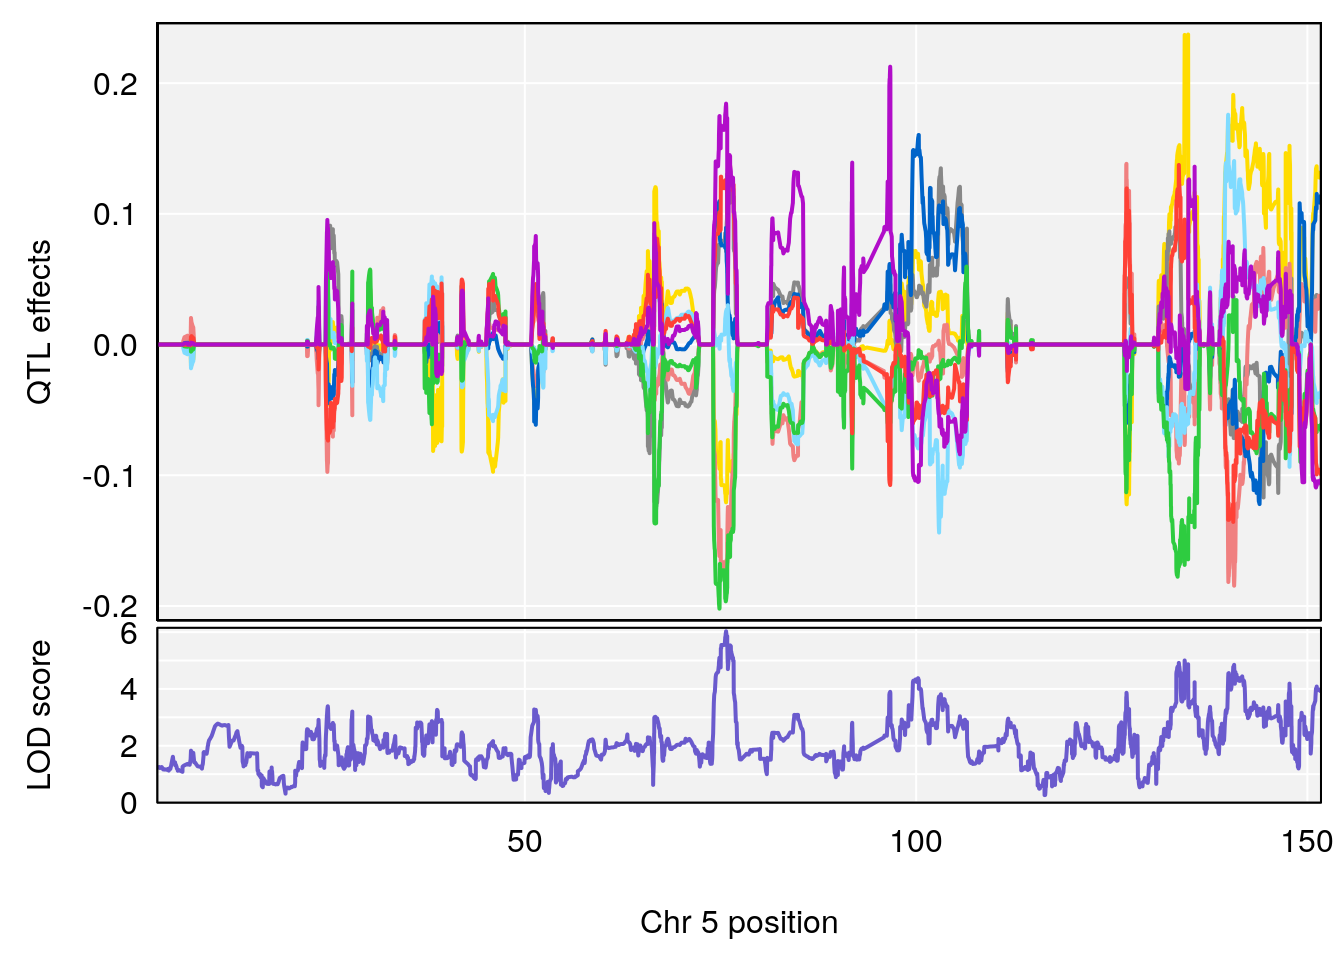
# [1] "Status_bin"
#   lodindex lodcolumn chr        pos      lod      ci_lo     ci_hi
# 1        1    pheno1   2  44.052851 6.865421  43.981019  44.45340
# 2        1    pheno1   4 156.164170 7.313472  11.650579 156.22250
# 3        1    pheno1   5  75.711735 6.031017  74.447060 140.84978
# 4        1    pheno1   6 143.410744 8.741595 142.860829 144.10696
# 5        1    pheno1   9  68.163768 8.619578  67.950946  68.33918
# 6        1    pheno1  10   9.053339 6.040880   7.721133 120.73537
# 7        1    pheno1  14 120.707152 7.088220 103.551070 121.45855
# 8        1    pheno1  19  58.715653 6.486409  55.101359  60.04661
# 9        1    pheno1   X 144.599251 8.636026 143.607480 145.35755
# [1] 1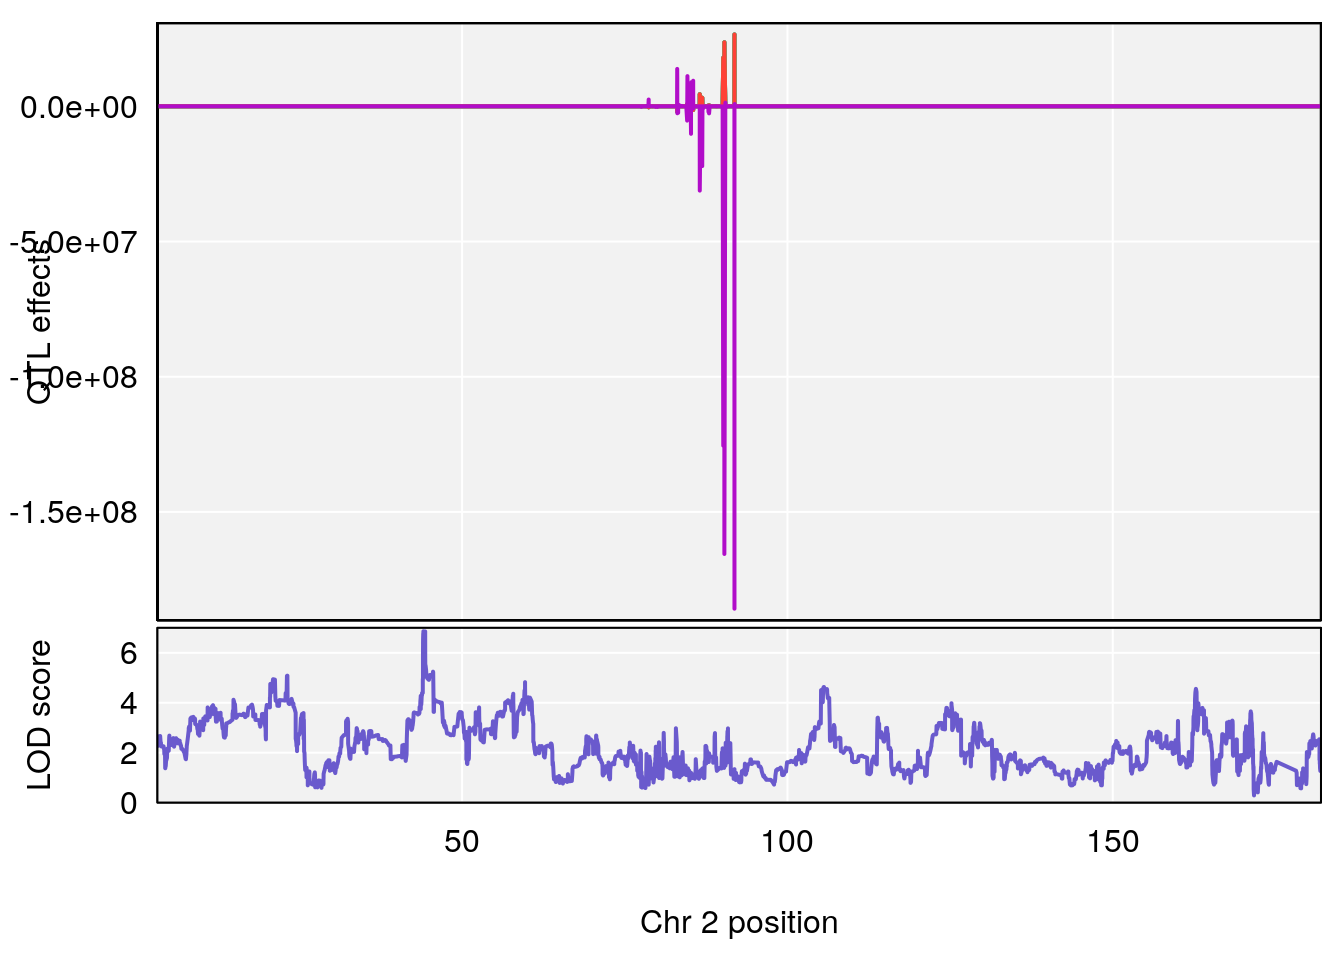
| Version | Author | Date |
|---|---|---|
| 8fe8543 | xhyuo | 2023-02-20 |
| Version | Author | Date |
|---|---|---|
| 8fe8543 | xhyuo | 2023-02-20 |
| Version | Author | Date |
|---|---|---|
| 8fe8543 | xhyuo | 2023-02-20 |
# [1] 2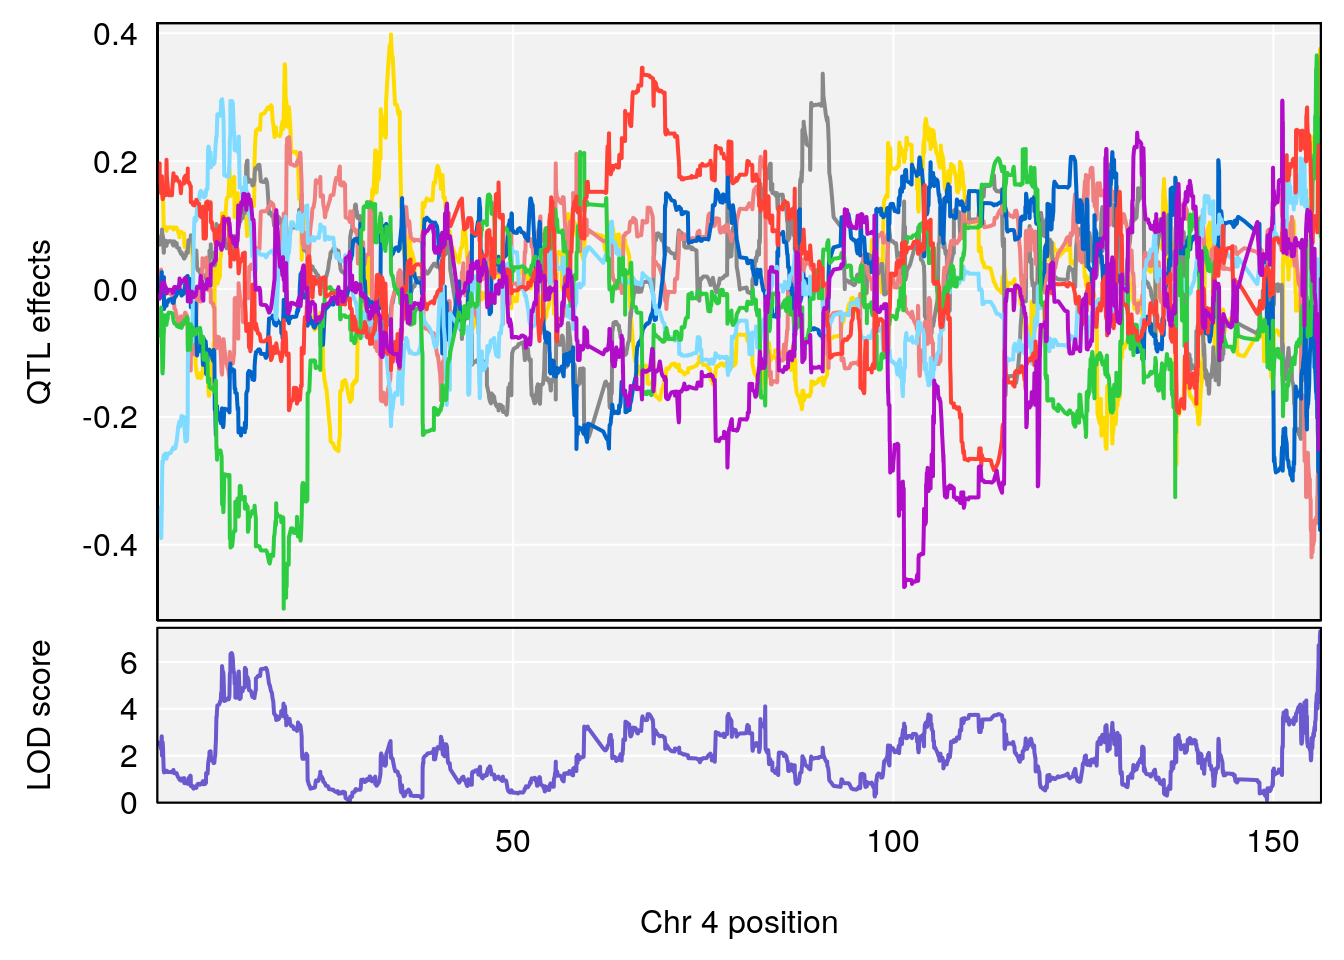
| Version | Author | Date |
|---|---|---|
| 8fe8543 | xhyuo | 2023-02-20 |
| Version | Author | Date |
|---|---|---|
| 8fe8543 | xhyuo | 2023-02-20 |
| Version | Author | Date |
|---|---|---|
| 8fe8543 | xhyuo | 2023-02-20 |
# [1] 3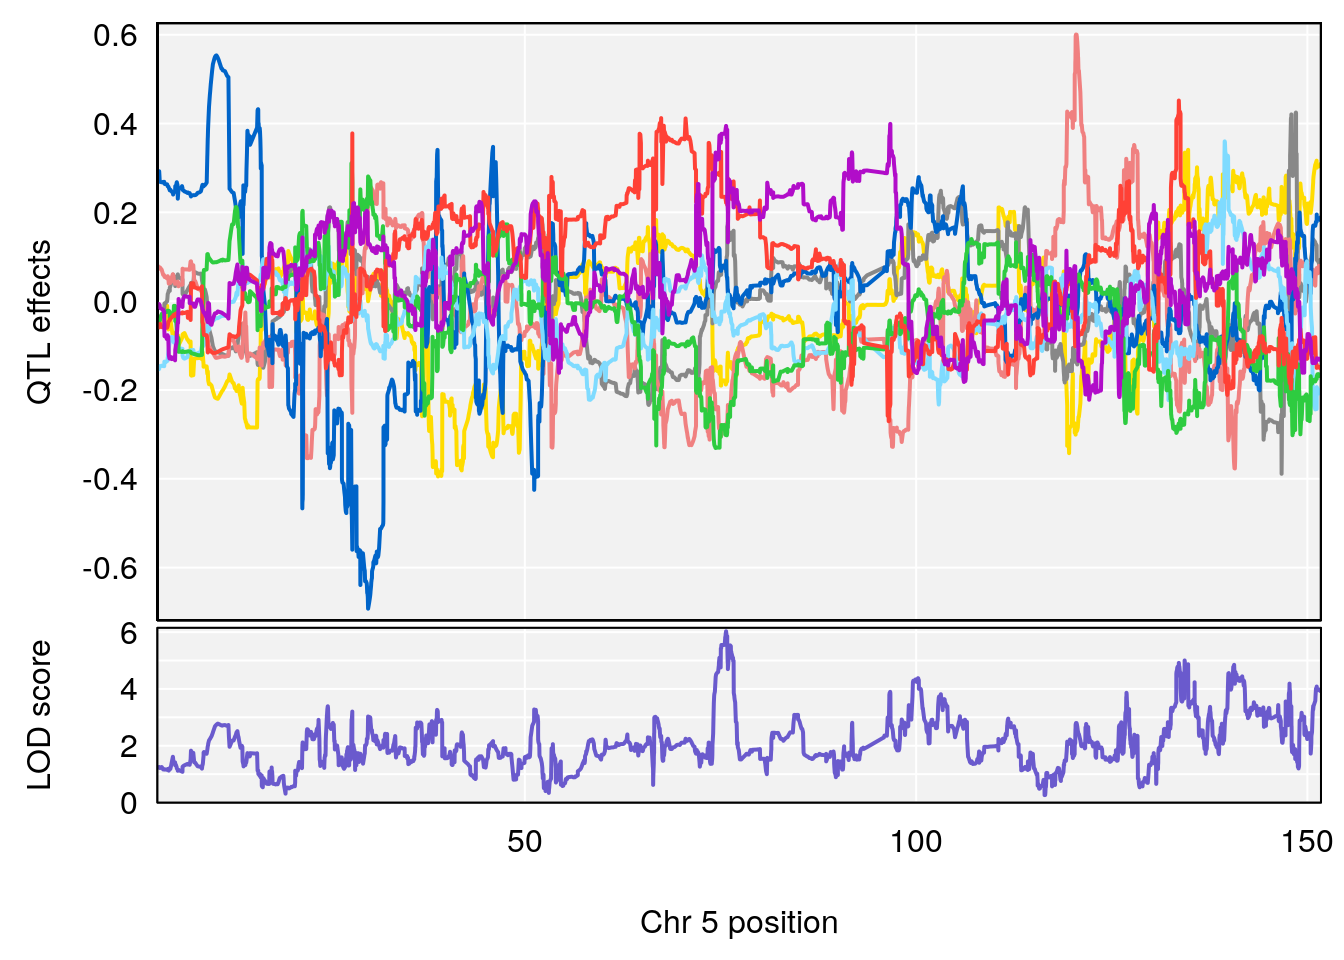
| Version | Author | Date |
|---|---|---|
| 8fe8543 | xhyuo | 2023-02-20 |
| Version | Author | Date |
|---|---|---|
| 8fe8543 | xhyuo | 2023-02-20 |
| Version | Author | Date |
|---|---|---|
| 8fe8543 | xhyuo | 2023-02-20 |
# [1] 4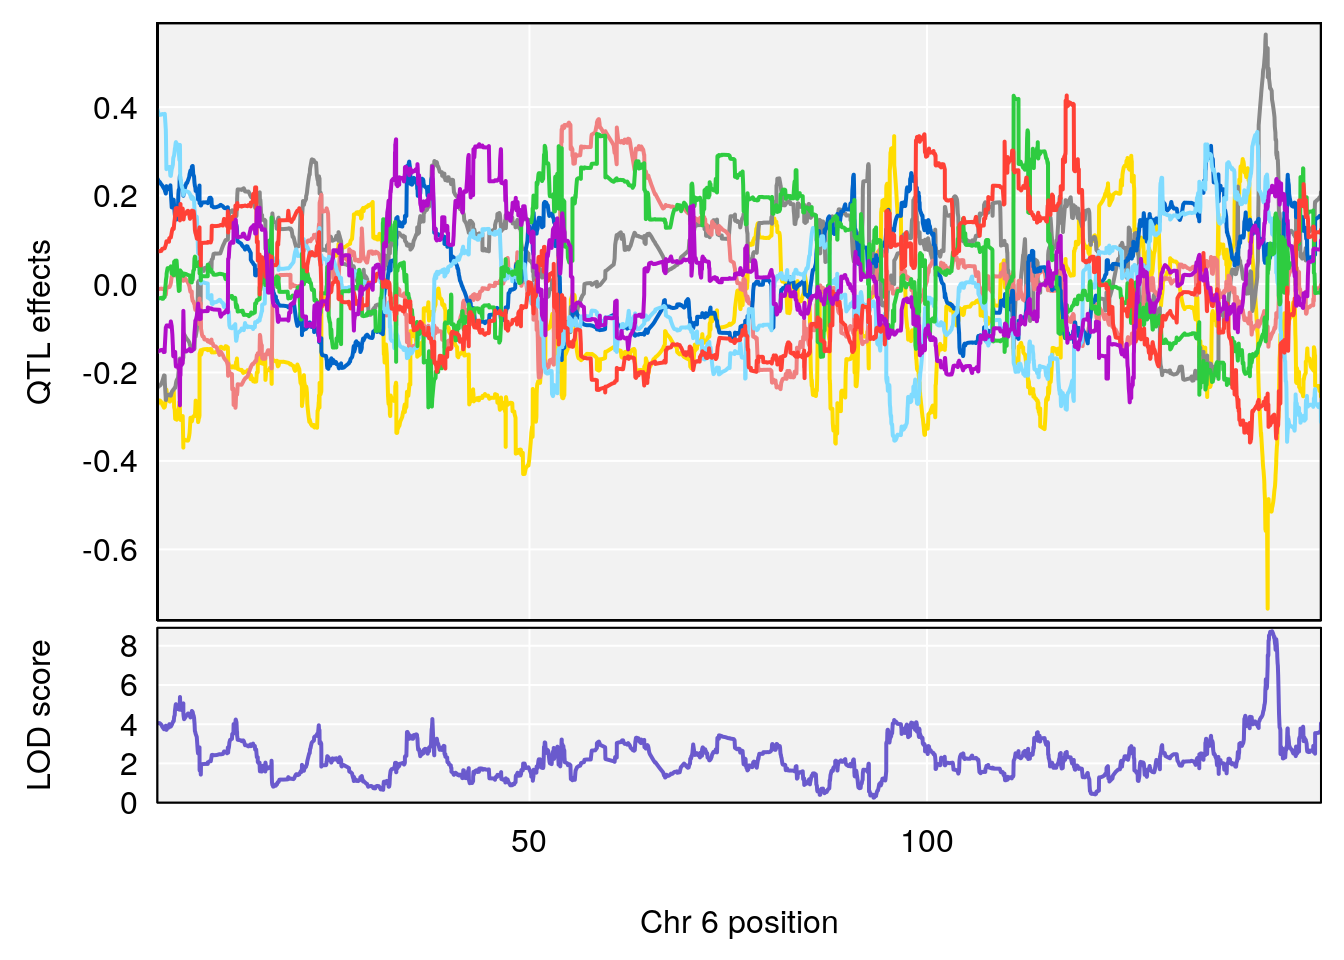
| Version | Author | Date |
|---|---|---|
| 8fe8543 | xhyuo | 2023-02-20 |
| Version | Author | Date |
|---|---|---|
| 8fe8543 | xhyuo | 2023-02-20 |
| Version | Author | Date |
|---|---|---|
| 8fe8543 | xhyuo | 2023-02-20 |
# [1] 5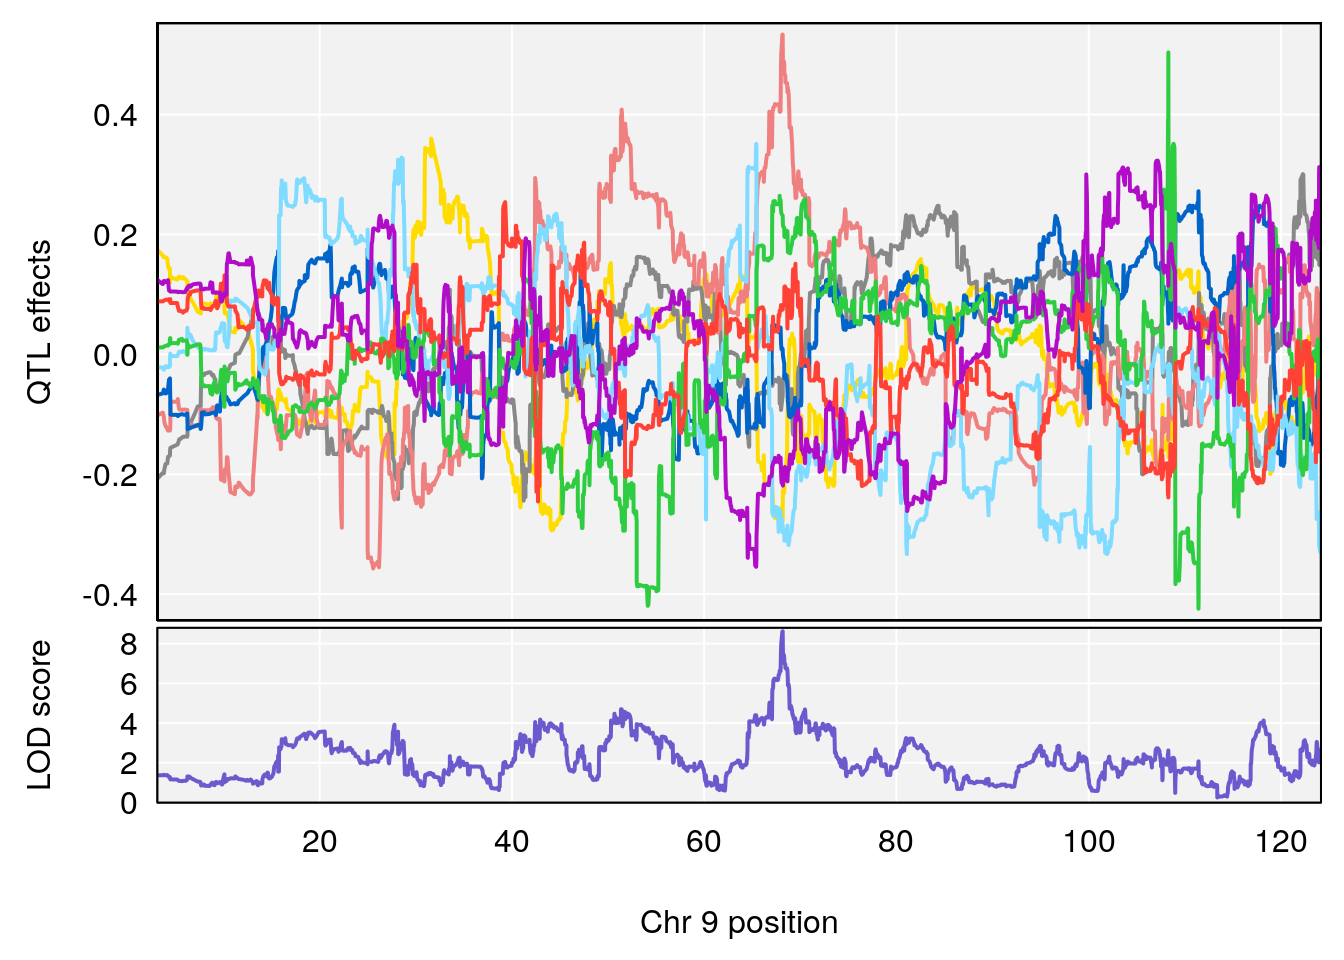
| Version | Author | Date |
|---|---|---|
| 8fe8543 | xhyuo | 2023-02-20 |
| Version | Author | Date |
|---|---|---|
| 8fe8543 | xhyuo | 2023-02-20 |
| Version | Author | Date |
|---|---|---|
| 8fe8543 | xhyuo | 2023-02-20 |
# [1] 6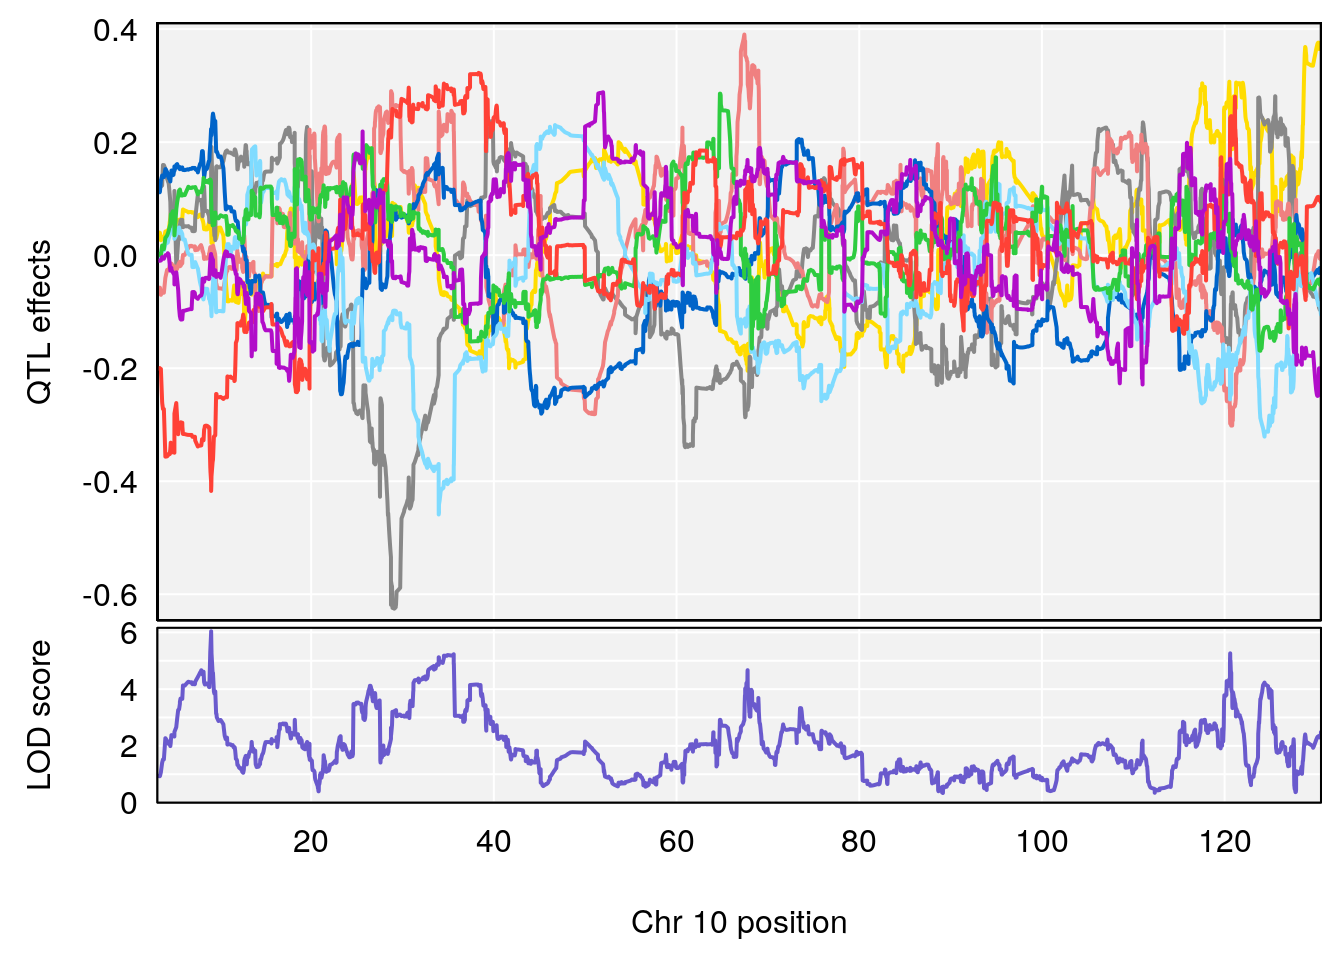
| Version | Author | Date |
|---|---|---|
| 8fe8543 | xhyuo | 2023-02-20 |
| Version | Author | Date |
|---|---|---|
| 8fe8543 | xhyuo | 2023-02-20 |
| Version | Author | Date |
|---|---|---|
| 8fe8543 | xhyuo | 2023-02-20 |
# [1] 7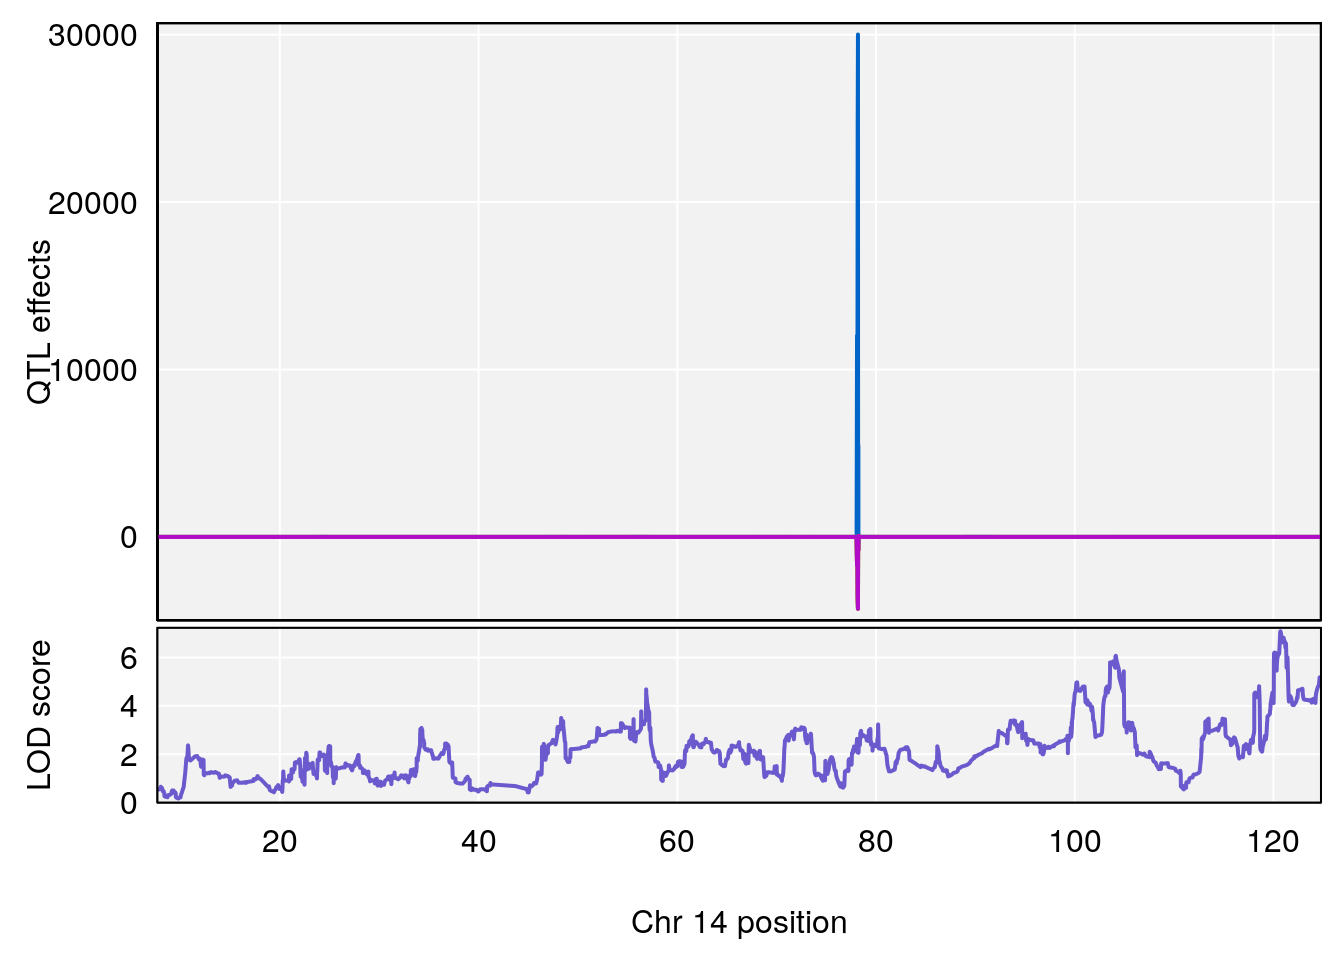
| Version | Author | Date |
|---|---|---|
| 8fe8543 | xhyuo | 2023-02-20 |
| Version | Author | Date |
|---|---|---|
| 8fe8543 | xhyuo | 2023-02-20 |
| Version | Author | Date |
|---|---|---|
| 8fe8543 | xhyuo | 2023-02-20 |
# [1] 8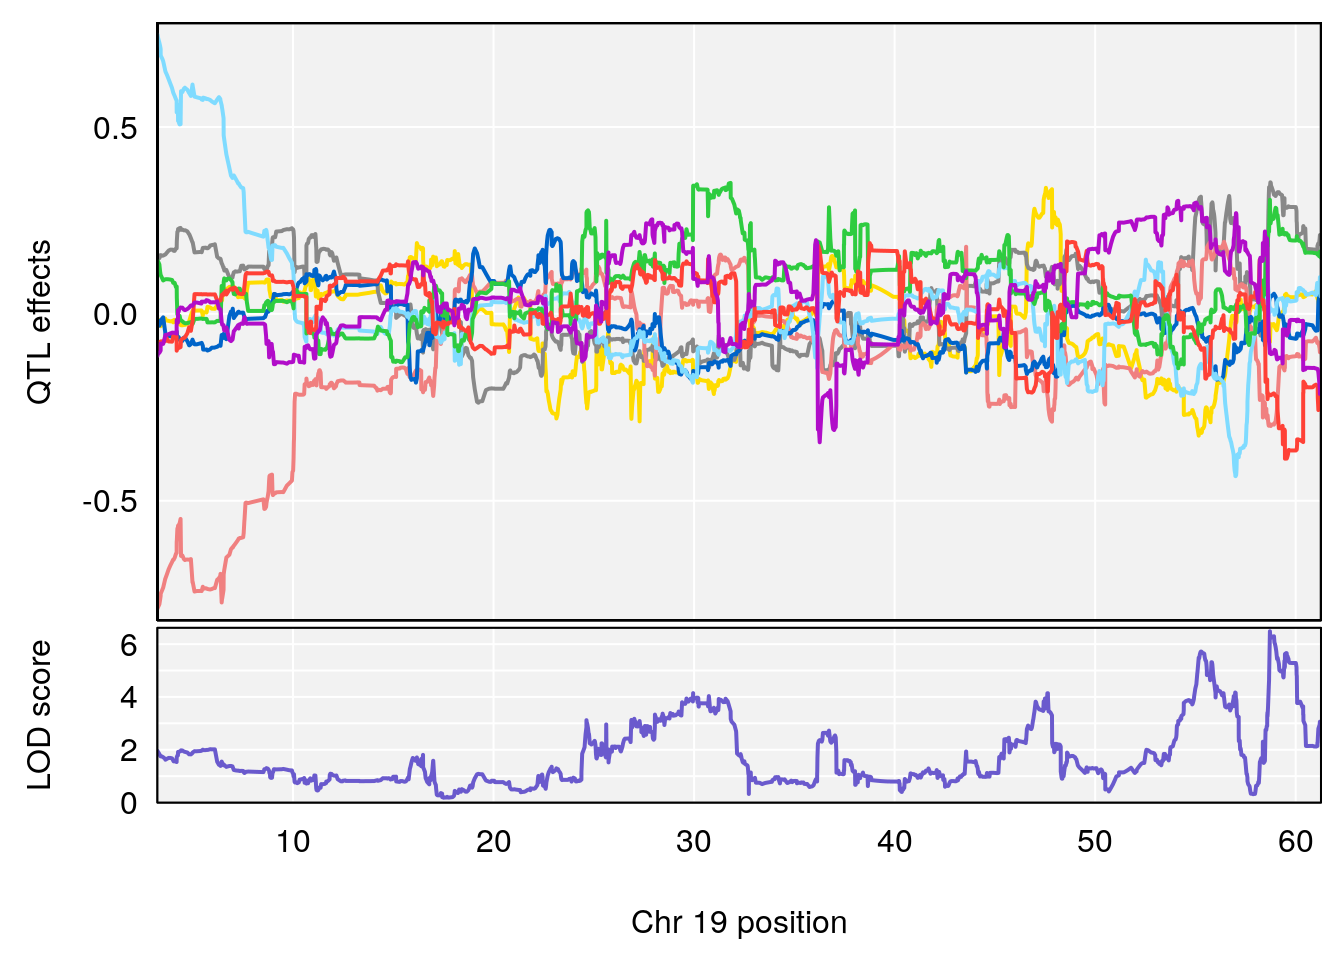
| Version | Author | Date |
|---|---|---|
| 8fe8543 | xhyuo | 2023-02-20 |
| Version | Author | Date |
|---|---|---|
| 8fe8543 | xhyuo | 2023-02-20 |
| Version | Author | Date |
|---|---|---|
| 8fe8543 | xhyuo | 2023-02-20 |
# [1] 9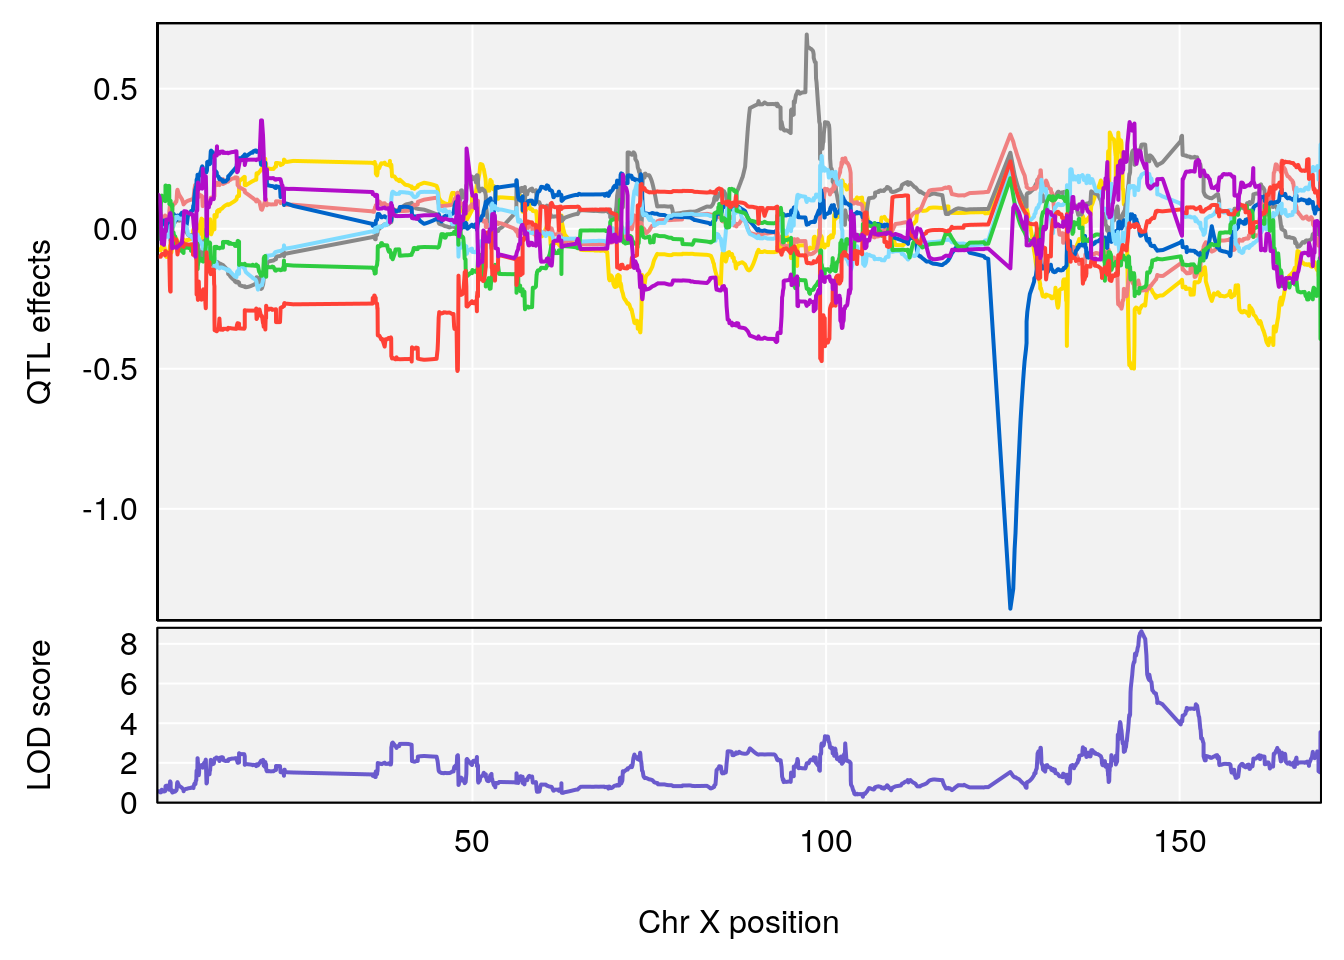
| Version | Author | Date |
|---|---|---|
| 8fe8543 | xhyuo | 2023-02-20 |
| Version | Author | Date |
|---|---|---|
| 8fe8543 | xhyuo | 2023-02-20 |
| Version | Author | Date |
|---|---|---|
| 8fe8543 | xhyuo | 2023-02-20 |
sessionInfo()
# R version 4.0.3 (2020-10-10)
# Platform: x86_64-pc-linux-gnu (64-bit)
# Running under: Ubuntu 20.04.2 LTS
#
# Matrix products: default
# BLAS/LAPACK: /usr/lib/x86_64-linux-gnu/openblas-pthread/libopenblasp-r0.3.8.so
#
# locale:
#  [1] LC_CTYPE=en_US.UTF-8       LC_NUMERIC=C
#  [3] LC_TIME=en_US.UTF-8        LC_COLLATE=en_US.UTF-8
#  [5] LC_MONETARY=en_US.UTF-8    LC_MESSAGES=C
#  [7] LC_PAPER=en_US.UTF-8       LC_NAME=C
#  [9] LC_ADDRESS=C               LC_TELEPHONE=C
# [11] LC_MEASUREMENT=en_US.UTF-8 LC_IDENTIFICATION=C
#
# attached base packages:
# [1] parallel  stats     graphics  grDevices utils     datasets  methods
# [8] base
#
# other attached packages:
# [1] readxl_1.3.1    abind_1.4-5     regress_1.3-21  survival_3.2-7
# [5] qtl2_0.24       GGally_2.1.0    gridExtra_2.3   ggplot2_3.3.3
# [9] workflowr_1.6.2
#
# loaded via a namespace (and not attached):
#  [1] tidyselect_1.1.0   xfun_0.21          purrr_0.3.4        lattice_0.20-41
#  [5] splines_4.0.3      colorspace_2.0-0   vctrs_0.3.6        generics_0.1.0
#  [9] htmltools_0.5.1.1  yaml_2.2.1         blob_1.2.1         rlang_1.0.2
# [13] later_1.1.0.1      pillar_1.4.7       glue_1.4.2         withr_2.4.1
# [17] DBI_1.1.1          bit64_4.0.5        RColorBrewer_1.1-2 lifecycle_1.0.0
# [21] plyr_1.8.6         stringr_1.4.0      cellranger_1.1.0   munsell_0.5.0
# [25] gtable_0.3.0       evaluate_0.14      memoise_2.0.0      labeling_0.4.2
# [29] knitr_1.31         fastmap_1.1.0      httpuv_1.5.5       highr_0.8
# [33] Rcpp_1.0.6         promises_1.2.0.1   scales_1.1.1       cachem_1.0.4
# [37] farver_2.0.3       fs_1.5.0           bit_4.0.4          digest_0.6.27
# [41] stringi_1.5.3      dplyr_1.0.4        grid_4.0.3         rprojroot_2.0.2
# [45] cli_2.3.0          tools_4.0.3        magrittr_2.0.1     tibble_3.0.6
# [49] RSQLite_2.2.3      crayon_1.4.1       whisker_0.4        pkgconfig_2.0.3
# [53] Matrix_1.3-2       ellipsis_0.3.1     data.table_1.13.6  assertthat_0.2.1
# [57] rmarkdown_2.6      reshape_0.8.8      R6_2.5.0           git2r_0.28.0
# [61] compiler_4.0.3
This R Markdown site was created with workflowr