Plot_DO_fentanyl_alternate_metrics
Hao He
2021-12-20
Last updated: 2021-12-20
Checks: 7 0
Knit directory: DO_Opioid/
This reproducible R Markdown analysis was created with workflowr (version 1.6.2). The Checks tab describes the reproducibility checks that were applied when the results were created. The Past versions tab lists the development history.
Great! Since the R Markdown file has been committed to the Git repository, you know the exact version of the code that produced these results.
Great job! The global environment was empty. Objects defined in the global environment can affect the analysis in your R Markdown file in unknown ways. For reproduciblity it’s best to always run the code in an empty environment.
The command set.seed(20200504) was run prior to running the code in the R Markdown file. Setting a seed ensures that any results that rely on randomness, e.g. subsampling or permutations, are reproducible.
Great job! Recording the operating system, R version, and package versions is critical for reproducibility.
Nice! There were no cached chunks for this analysis, so you can be confident that you successfully produced the results during this run.
Great job! Using relative paths to the files within your workflowr project makes it easier to run your code on other machines.
Great! You are using Git for version control. Tracking code development and connecting the code version to the results is critical for reproducibility.
The results in this page were generated with repository version 344b6bc. See the Past versions tab to see a history of the changes made to the R Markdown and HTML files.
Note that you need to be careful to ensure that all relevant files for the analysis have been committed to Git prior to generating the results (you can use wflow_publish or wflow_git_commit). workflowr only checks the R Markdown file, but you know if there are other scripts or data files that it depends on. Below is the status of the Git repository when the results were generated:
Ignored files:
    Ignored:    .RData
    Ignored:    .Rhistory
    Ignored:    .Rproj.user/
    Ignored:    analysis/Picture1.png

Untracked files:
    Untracked:  analysis/DDO_morphine1_second_set_69k.stdout
    Untracked:  analysis/DO_Fentanyl.R
    Untracked:  analysis/DO_Fentanyl.err
    Untracked:  analysis/DO_Fentanyl.out
    Untracked:  analysis/DO_Fentanyl.sh
    Untracked:  analysis/DO_Fentanyl_69k.R
    Untracked:  analysis/DO_Fentanyl_69k.err
    Untracked:  analysis/DO_Fentanyl_69k.out
    Untracked:  analysis/DO_Fentanyl_69k.sh
    Untracked:  analysis/DO_Fentanyl_GCTA_herit.R
    Untracked:  analysis/DO_Fentanyl_alternate_metrics_69k.R
    Untracked:  analysis/DO_Fentanyl_alternate_metrics_69k.err
    Untracked:  analysis/DO_Fentanyl_alternate_metrics_69k.out
    Untracked:  analysis/DO_Fentanyl_alternate_metrics_69k.sh
    Untracked:  analysis/DO_Fentanyl_alternate_metrics_array.R
    Untracked:  analysis/DO_Fentanyl_alternate_metrics_array.err
    Untracked:  analysis/DO_Fentanyl_alternate_metrics_array.out
    Untracked:  analysis/DO_Fentanyl_alternate_metrics_array.sh
    Untracked:  analysis/DO_Fentanyl_array.R
    Untracked:  analysis/DO_Fentanyl_array.err
    Untracked:  analysis/DO_Fentanyl_array.out
    Untracked:  analysis/DO_Fentanyl_array.sh
    Untracked:  analysis/DO_Fentanyl_finalreport_to_plink.sh
    Untracked:  analysis/DO_Fentanyl_gemma.R
    Untracked:  analysis/DO_Fentanyl_gemma.err
    Untracked:  analysis/DO_Fentanyl_gemma.out
    Untracked:  analysis/DO_Fentanyl_gemma.sh
    Untracked:  analysis/DO_morphine1.R
    Untracked:  analysis/DO_morphine1.Rout
    Untracked:  analysis/DO_morphine1.sh
    Untracked:  analysis/DO_morphine1.stderr
    Untracked:  analysis/DO_morphine1.stdout
    Untracked:  analysis/DO_morphine1_SNP.R
    Untracked:  analysis/DO_morphine1_SNP.Rout
    Untracked:  analysis/DO_morphine1_SNP.sh
    Untracked:  analysis/DO_morphine1_SNP.stderr
    Untracked:  analysis/DO_morphine1_SNP.stdout
    Untracked:  analysis/DO_morphine1_combined.R
    Untracked:  analysis/DO_morphine1_combined.Rout
    Untracked:  analysis/DO_morphine1_combined.sh
    Untracked:  analysis/DO_morphine1_combined.stderr
    Untracked:  analysis/DO_morphine1_combined.stdout
    Untracked:  analysis/DO_morphine1_combined_69k.R
    Untracked:  analysis/DO_morphine1_combined_69k.Rout
    Untracked:  analysis/DO_morphine1_combined_69k.sh
    Untracked:  analysis/DO_morphine1_combined_69k.stderr
    Untracked:  analysis/DO_morphine1_combined_69k.stdout
    Untracked:  analysis/DO_morphine1_combined_69k_m2.R
    Untracked:  analysis/DO_morphine1_combined_69k_m2.Rout
    Untracked:  analysis/DO_morphine1_combined_69k_m2.sh
    Untracked:  analysis/DO_morphine1_combined_69k_m2.stderr
    Untracked:  analysis/DO_morphine1_combined_69k_m2.stdout
    Untracked:  analysis/DO_morphine1_combined_weight_DOB.R
    Untracked:  analysis/DO_morphine1_combined_weight_DOB.Rout
    Untracked:  analysis/DO_morphine1_combined_weight_DOB.err
    Untracked:  analysis/DO_morphine1_combined_weight_DOB.out
    Untracked:  analysis/DO_morphine1_combined_weight_DOB.sh
    Untracked:  analysis/DO_morphine1_combined_weight_DOB.stderr
    Untracked:  analysis/DO_morphine1_combined_weight_DOB.stdout
    Untracked:  analysis/DO_morphine1_combined_weight_age.R
    Untracked:  analysis/DO_morphine1_combined_weight_age.err
    Untracked:  analysis/DO_morphine1_combined_weight_age.out
    Untracked:  analysis/DO_morphine1_combined_weight_age.sh
    Untracked:  analysis/DO_morphine1_combined_weight_age_GAMMT.R
    Untracked:  analysis/DO_morphine1_combined_weight_age_GAMMT.err
    Untracked:  analysis/DO_morphine1_combined_weight_age_GAMMT.out
    Untracked:  analysis/DO_morphine1_combined_weight_age_GAMMT.sh
    Untracked:  analysis/DO_morphine1_combined_weight_age_GAMMT_chr19.R
    Untracked:  analysis/DO_morphine1_combined_weight_age_GAMMT_chr19.err
    Untracked:  analysis/DO_morphine1_combined_weight_age_GAMMT_chr19.out
    Untracked:  analysis/DO_morphine1_combined_weight_age_GAMMT_chr19.sh
    Untracked:  analysis/DO_morphine1_cph.R
    Untracked:  analysis/DO_morphine1_cph.Rout
    Untracked:  analysis/DO_morphine1_cph.sh
    Untracked:  analysis/DO_morphine1_second_set.R
    Untracked:  analysis/DO_morphine1_second_set.Rout
    Untracked:  analysis/DO_morphine1_second_set.sh
    Untracked:  analysis/DO_morphine1_second_set.stderr
    Untracked:  analysis/DO_morphine1_second_set.stdout
    Untracked:  analysis/DO_morphine1_second_set_69k.R
    Untracked:  analysis/DO_morphine1_second_set_69k.Rout
    Untracked:  analysis/DO_morphine1_second_set_69k.sh
    Untracked:  analysis/DO_morphine1_second_set_69k.stderr
    Untracked:  analysis/DO_morphine1_second_set_SNP.R
    Untracked:  analysis/DO_morphine1_second_set_SNP.Rout
    Untracked:  analysis/DO_morphine1_second_set_SNP.sh
    Untracked:  analysis/DO_morphine1_second_set_SNP.stderr
    Untracked:  analysis/DO_morphine1_second_set_SNP.stdout
    Untracked:  analysis/DO_morphine1_second_set_weight_DOB.R
    Untracked:  analysis/DO_morphine1_second_set_weight_DOB.Rout
    Untracked:  analysis/DO_morphine1_second_set_weight_DOB.err
    Untracked:  analysis/DO_morphine1_second_set_weight_DOB.out
    Untracked:  analysis/DO_morphine1_second_set_weight_DOB.sh
    Untracked:  analysis/DO_morphine1_second_set_weight_DOB.stderr
    Untracked:  analysis/DO_morphine1_second_set_weight_DOB.stdout
    Untracked:  analysis/DO_morphine1_second_set_weight_age.R
    Untracked:  analysis/DO_morphine1_second_set_weight_age.Rout
    Untracked:  analysis/DO_morphine1_second_set_weight_age.err
    Untracked:  analysis/DO_morphine1_second_set_weight_age.out
    Untracked:  analysis/DO_morphine1_second_set_weight_age.sh
    Untracked:  analysis/DO_morphine1_second_set_weight_age.stderr
    Untracked:  analysis/DO_morphine1_second_set_weight_age.stdout
    Untracked:  analysis/DO_morphine1_weight_DOB.R
    Untracked:  analysis/DO_morphine1_weight_DOB.sh
    Untracked:  analysis/DO_morphine1_weight_age.R
    Untracked:  analysis/DO_morphine1_weight_age.sh
    Untracked:  analysis/DO_morphine_gemma.R
    Untracked:  analysis/DO_morphine_gemma.err
    Untracked:  analysis/DO_morphine_gemma.out
    Untracked:  analysis/DO_morphine_gemma.sh
    Untracked:  analysis/DO_morphine_gemma_firstmin.R
    Untracked:  analysis/DO_morphine_gemma_firstmin.err
    Untracked:  analysis/DO_morphine_gemma_firstmin.out
    Untracked:  analysis/DO_morphine_gemma_firstmin.sh
    Untracked:  analysis/DO_morphine_gemma_withpermu.R
    Untracked:  analysis/DO_morphine_gemma_withpermu.err
    Untracked:  analysis/DO_morphine_gemma_withpermu.out
    Untracked:  analysis/DO_morphine_gemma_withpermu.sh
    Untracked:  analysis/DO_morphine_gemma_withpermu_firstbatch_min.depression.R
    Untracked:  analysis/DO_morphine_gemma_withpermu_firstbatch_min.depression.err
    Untracked:  analysis/DO_morphine_gemma_withpermu_firstbatch_min.depression.out
    Untracked:  analysis/DO_morphine_gemma_withpermu_firstbatch_min.depression.sh
    Untracked:  analysis/Plot_DO_morphine1_SNP.R
    Untracked:  analysis/Plot_DO_morphine1_SNP.Rout
    Untracked:  analysis/Plot_DO_morphine1_SNP.sh
    Untracked:  analysis/Plot_DO_morphine1_SNP.stderr
    Untracked:  analysis/Plot_DO_morphine1_SNP.stdout
    Untracked:  analysis/Plot_DO_morphine1_second_set_SNP.R
    Untracked:  analysis/Plot_DO_morphine1_second_set_SNP.Rout
    Untracked:  analysis/Plot_DO_morphine1_second_set_SNP.sh
    Untracked:  analysis/Plot_DO_morphine1_second_set_SNP.stderr
    Untracked:  analysis/Plot_DO_morphine1_second_set_SNP.stdout
    Untracked:  analysis/heritability_first_second_batch.R
    Untracked:  analysis/scripts/
    Untracked:  analysis/tibmr.R
    Untracked:  analysis/workflow_proc.R
    Untracked:  analysis/workflow_proc.sh
    Untracked:  analysis/workflow_proc.stderr
    Untracked:  analysis/workflow_proc.stdout
    Untracked:  analysis/x.R
    Untracked:  code/cfw/
    Untracked:  code/gemma_plot.R
    Untracked:  code/reconst_utils.R
    Untracked:  data/69k_grid_pgmap.RData
    Untracked:  data/DO_WBP_Data_JAB_to_map.xlsx
    Untracked:  data/Fentanyl_alternate_metrics.xlsx
    Untracked:  data/FinalReport/
    Untracked:  data/GM/
    Untracked:  data/GM_covar.csv
    Untracked:  data/GM_covar_07092018_morphine.csv
    Untracked:  data/Jackson_Lab_Bubier_MURGIGV01/
    Untracked:  data/MPD_Upload_October.csv
    Untracked:  data/MPD_Upload_October_updated_sex.csv
    Untracked:  data/Master Fentanyl DO Study Sheet.xlsx
    Untracked:  data/MasterMorphine Second Set DO w DOB2.xlsx
    Untracked:  data/MasterMorphine Second Set DO.xlsx
    Untracked:  data/Morphine CC DO mice Updated with Published inbred strains.csv
    Untracked:  data/Morphine_CC_DO_mice_Updated_with_Published_inbred_strains.csv
    Untracked:  data/cc_variants.sqlite
    Untracked:  data/combined/
    Untracked:  data/fentanyl/
    Untracked:  data/first/
    Untracked:  data/founder_geno.csv
    Untracked:  data/genetic_map.csv
    Untracked:  data/gm.json
    Untracked:  data/gwas.sh
    Untracked:  data/marker_grid_0.02cM_plus.txt
    Untracked:  data/mouse_genes_mgi.sqlite
    Untracked:  data/pheno.csv
    Untracked:  data/pheno_qtl2.csv
    Untracked:  data/pheno_qtl2_07092018_morphine.csv
    Untracked:  data/pheno_qtl2_w_dob.csv
    Untracked:  data/physical_map.csv
    Untracked:  data/rnaseq/
    Untracked:  data/sample_geno.csv
    Untracked:  data/second/
    Untracked:  figure/
    Untracked:  glimma-plots/
    Untracked:  output/DO_morphine_Min.depression.png
    Untracked:  output/DO_morphine_Min.depression22222_violin_chr5.pdf
    Untracked:  output/DO_morphine_Min.depression_coefplot.pdf
    Untracked:  output/DO_morphine_Min.depression_coefplot_blup.pdf
    Untracked:  output/DO_morphine_Min.depression_coefplot_blup_chr5.png
    Untracked:  output/DO_morphine_Min.depression_coefplot_blup_chrX.png
    Untracked:  output/DO_morphine_Min.depression_coefplot_chr5.png
    Untracked:  output/DO_morphine_Min.depression_coefplot_chrX.png
    Untracked:  output/DO_morphine_Min.depression_peak_genes_chr5.png
    Untracked:  output/DO_morphine_Min.depression_violin_chr5.png
    Untracked:  output/DO_morphine_Recovery.Time.png
    Untracked:  output/DO_morphine_Recovery.Time_coefplot.pdf
    Untracked:  output/DO_morphine_Recovery.Time_coefplot_blup.pdf
    Untracked:  output/DO_morphine_Recovery.Time_coefplot_blup_chr11.png
    Untracked:  output/DO_morphine_Recovery.Time_coefplot_blup_chr4.png
    Untracked:  output/DO_morphine_Recovery.Time_coefplot_blup_chr7.png
    Untracked:  output/DO_morphine_Recovery.Time_coefplot_blup_chr9.png
    Untracked:  output/DO_morphine_Recovery.Time_coefplot_chr11.png
    Untracked:  output/DO_morphine_Recovery.Time_coefplot_chr4.png
    Untracked:  output/DO_morphine_Recovery.Time_coefplot_chr7.png
    Untracked:  output/DO_morphine_Recovery.Time_coefplot_chr9.png
    Untracked:  output/DO_morphine_Status_bin.png
    Untracked:  output/DO_morphine_Status_bin_coefplot.pdf
    Untracked:  output/DO_morphine_Status_bin_coefplot_blup.pdf
    Untracked:  output/DO_morphine_Survival.Time.png
    Untracked:  output/DO_morphine_Survival.Time_coefplot.pdf
    Untracked:  output/DO_morphine_Survival.Time_coefplot_blup.pdf
    Untracked:  output/DO_morphine_Survival.Time_coefplot_blup_chr17.png
    Untracked:  output/DO_morphine_Survival.Time_coefplot_blup_chr8.png
    Untracked:  output/DO_morphine_Survival.Time_coefplot_chr17.png
    Untracked:  output/DO_morphine_Survival.Time_coefplot_chr8.png
    Untracked:  output/DO_morphine_combine_batch_peak_violin.pdf
    Untracked:  output/DO_morphine_combined_69k_m2_Min.depression.png
    Untracked:  output/DO_morphine_combined_69k_m2_Min.depression_coefplot.pdf
    Untracked:  output/DO_morphine_combined_69k_m2_Min.depression_coefplot_blup.pdf
    Untracked:  output/DO_morphine_combined_69k_m2_Recovery.Time.png
    Untracked:  output/DO_morphine_combined_69k_m2_Recovery.Time_coefplot.pdf
    Untracked:  output/DO_morphine_combined_69k_m2_Recovery.Time_coefplot_blup.pdf
    Untracked:  output/DO_morphine_combined_69k_m2_Status_bin.png
    Untracked:  output/DO_morphine_combined_69k_m2_Status_bin_coefplot.pdf
    Untracked:  output/DO_morphine_combined_69k_m2_Status_bin_coefplot_blup.pdf
    Untracked:  output/DO_morphine_combined_69k_m2_Survival.Time.png
    Untracked:  output/DO_morphine_combined_69k_m2_Survival.Time_coefplot.pdf
    Untracked:  output/DO_morphine_combined_69k_m2_Survival.Time_coefplot_blup.pdf
    Untracked:  output/DO_morphine_coxph_24hrs_kinship_QTL.png
    Untracked:  output/DO_morphine_cphout.RData
    Untracked:  output/DO_morphine_first_batch_peak_in_second_batch_violin.pdf
    Untracked:  output/DO_morphine_first_batch_peak_in_second_batch_violin_sidebyside.pdf
    Untracked:  output/DO_morphine_first_batch_peak_violin.pdf
    Untracked:  output/DO_morphine_operm.cph.RData
    Untracked:  output/DO_morphine_second_batch_on_first_batch_peak_violin.pdf
    Untracked:  output/DO_morphine_second_batch_peak_ch6surv_on_first_batchviolin.pdf
    Untracked:  output/DO_morphine_second_batch_peak_ch6surv_on_first_batchviolin2.pdf
    Untracked:  output/DO_morphine_second_batch_peak_in_first_batch_violin.pdf
    Untracked:  output/DO_morphine_second_batch_peak_in_first_batch_violin_sidebyside.pdf
    Untracked:  output/DO_morphine_second_batch_peak_violin.pdf
    Untracked:  output/DO_morphine_secondbatch_69k_Min.depression.png
    Untracked:  output/DO_morphine_secondbatch_69k_Min.depression_coefplot.pdf
    Untracked:  output/DO_morphine_secondbatch_69k_Min.depression_coefplot_blup.pdf
    Untracked:  output/DO_morphine_secondbatch_69k_Recovery.Time.png
    Untracked:  output/DO_morphine_secondbatch_69k_Recovery.Time_coefplot.pdf
    Untracked:  output/DO_morphine_secondbatch_69k_Recovery.Time_coefplot_blup.pdf
    Untracked:  output/DO_morphine_secondbatch_69k_Status_bin.png
    Untracked:  output/DO_morphine_secondbatch_69k_Status_bin_coefplot.pdf
    Untracked:  output/DO_morphine_secondbatch_69k_Status_bin_coefplot_blup.pdf
    Untracked:  output/DO_morphine_secondbatch_69k_Survival.Time.png
    Untracked:  output/DO_morphine_secondbatch_69k_Survival.Time_coefplot.pdf
    Untracked:  output/DO_morphine_secondbatch_69k_Survival.Time_coefplot_blup.pdf
    Untracked:  output/DO_morphine_secondbatch_Min.depression.png
    Untracked:  output/DO_morphine_secondbatch_Min.depression_coefplot.pdf
    Untracked:  output/DO_morphine_secondbatch_Min.depression_coefplot_blup.pdf
    Untracked:  output/DO_morphine_secondbatch_Recovery.Time.png
    Untracked:  output/DO_morphine_secondbatch_Recovery.Time_coefplot.pdf
    Untracked:  output/DO_morphine_secondbatch_Recovery.Time_coefplot_blup.pdf
    Untracked:  output/DO_morphine_secondbatch_Status_bin.png
    Untracked:  output/DO_morphine_secondbatch_Status_bin_coefplot.pdf
    Untracked:  output/DO_morphine_secondbatch_Status_bin_coefplot_blup.pdf
    Untracked:  output/DO_morphine_secondbatch_Survival.Time.png
    Untracked:  output/DO_morphine_secondbatch_Survival.Time_coefplot.pdf
    Untracked:  output/DO_morphine_secondbatch_Survival.Time_coefplot_blup.pdf
    Untracked:  output/Fentanyl/
    Untracked:  output/TIMBR.test.RData
    Untracked:  output/apr_69kchr_combined.RData
    Untracked:  output/apr_69kchr_k_loco_combined.rds
    Untracked:  output/apr_69kchr_second_set.RData
    Untracked:  output/combine_batch_variation.RData
    Untracked:  output/combined_gm.RData
    Untracked:  output/combined_gm.k_loco.rds
    Untracked:  output/combined_gm.k_overall.rds
    Untracked:  output/combined_gm.probs_8state.rds
    Untracked:  output/coxph/
    Untracked:  output/do.morphine.RData
    Untracked:  output/do.morphine.k_loco.rds
    Untracked:  output/do.morphine.probs_36state.rds
    Untracked:  output/do.morphine.probs_8state.rds
    Untracked:  output/first_batch_variation.RData
    Untracked:  output/first_second_survival_peak_chr.xlsx
    Untracked:  output/hsq_1_first_batch_herit_qtl2.RData
    Untracked:  output/hsq_2_second_batch_herit_qtl2.RData
    Untracked:  output/old_temp/
    Untracked:  output/pr_69kchr_combined.RData
    Untracked:  output/pr_69kchr_second_set.RData
    Untracked:  output/qtl.morphine.69k.out.combined.RData
    Untracked:  output/qtl.morphine.69k.out.combined_m2.RData
    Untracked:  output/qtl.morphine.69k.out.second_set.RData
    Untracked:  output/qtl.morphine.operm.RData
    Untracked:  output/qtl.morphine.out.RData
    Untracked:  output/qtl.morphine.out.combined_gm.RData
    Untracked:  output/qtl.morphine.out.combined_weight_DOB.RData
    Untracked:  output/qtl.morphine.out.combined_weight_age.RData
    Untracked:  output/qtl.morphine.out.second_set.RData
    Untracked:  output/qtl.morphine.out.second_set.weight_DOB.RData
    Untracked:  output/qtl.morphine.out.second_set.weight_age.RData
    Untracked:  output/qtl.morphine.out.weight_DOB.RData
    Untracked:  output/qtl.morphine.out.weight_age.RData
    Untracked:  output/qtl.morphine1.snpout.RData
    Untracked:  output/qtl.morphine2.snpout.RData
    Untracked:  output/second_batch_variation.RData
    Untracked:  output/second_set_apr_69kchr_k_loco.rds
    Untracked:  output/second_set_gm.RData
    Untracked:  output/second_set_gm.k_loco.rds
    Untracked:  output/second_set_gm.probs_36state.rds
    Untracked:  output/second_set_gm.probs_8state.rds
    Untracked:  output/topSNP_chr5_mindepression.csv
    Untracked:  output/zoompeak_Min.depression_9.pdf
    Untracked:  output/zoompeak_Recovery.Time_16.pdf
    Untracked:  output/zoompeak_Status_bin_11.pdf
    Untracked:  output/zoompeak_Survival.Time_1.pdf
    Untracked:  output/zoompeak_fentanyl_Survival.Time_2.pdf

Unstaged changes:
    Modified:   _workflowr.yml
    Modified:   analysis/marker_violin.Rmd
Note that any generated files, e.g. HTML, png, CSS, etc., are not included in this status report because it is ok for generated content to have uncommitted changes.
These are the previous versions of the repository in which changes were made to the R Markdown (analysis/Plot_DO_fentanyl_alternate_metrics.Rmd) and HTML (docs/Plot_DO_fentanyl_alternate_metrics.html) files. If you’ve configured a remote Git repository (see ?wflow_git_remote), click on the hyperlinks in the table below to view the files as they were in that past version.
| File | Version | Author | Date | Message |
|---|---|---|---|---|
| Rmd | 344b6bc | xhyuo | 2021-12-20 | Plot_DO_fentanyl_alternate_metrics |
| html | f412738 | xhyuo | 2021-12-20 | Build site. |
| Rmd | a90242b | xhyuo | 2021-12-20 | Plot_DO_fentanyl_alternate_metrics.Rmd |
Last update: 2021-12-20
##loading libraries
library(ggplot2)
library(gridExtra)
library(GGally)
library(parallel)
library(qtl2)
library(parallel)
library(survival)
library(regress)
library(abind)
library(openxlsx)
library(tidyverse)
library(cowplot)
library(furrr)
library(patchwork)
library(qtl)
theme_set(theme_cowplot())

rz.transform <- function(y) {
  rankY=rank(y, ties.method="average", na.last="keep")
  rzT=qnorm(rankY/(length(na.exclude(rankY))+1))
  return(rzT)
}

Pvaltolod <- function(p){
  if(p == 0) p = 1e-10
  y = ifelse(p >= 0.5, 0, qchisq(1-2*p, df=1)/(2*log(10)))
  y
}

load("code/do.colors.RData")
###Read phenotype data
do.pheno <- read.xlsx("data/Master Fentanyl DO Study Sheet.xlsx", sheet = 1,
                      rows = 1:399, na.strings = "NaN", detectDates = TRUE)
#second 31009 is really 31109
do.pheno[do.pheno$ID == 31009 & do.pheno$File == 20210519, "ID"] = 31109
#remove zombie mice
do.pheno <- do.pheno %>%
  dplyr::filter(is.na(Censor)) %>%
  dplyr::rename(.,
                Min.depression = 9,
                Survival.Time  = 10,
                Recovery.Time  = 11) %>%
  dplyr::mutate(Status_bin = ifelse(Survival == "ALIVE", 1, 0)) %>%
  dplyr::mutate(ID = as.character(ID)) %>%
  dplyr::arrange(ID, desc(File)) %>%
  dplyr::distinct(ID, .keep_all = TRUE)
#Fentanyl_alternate_metrics.xlsx
do.pheno.alt <- read.xlsx("data/Fentanyl_alternate_metrics.xlsx", sheet = 1,
                      na.strings = "NaN") %>%
  mutate(ID = as.character(Mouse.ID)) %>%
  filter(!(if_all(2:11, is.na))) %>%
  distinct(ID, .keep_all = TRUE)
colnames(do.pheno.alt) <- str_replace(colnames(do.pheno.alt), "\\(", "")
colnames(do.pheno.alt) <- str_replace(colnames(do.pheno.alt), "\\)", "")
colnames(do.pheno.alt) <- str_replace(colnames(do.pheno.alt), "\\%/", "")
colnames(do.pheno.alt) <- str_replace(colnames(do.pheno.alt), "\\.%", "")
#get sex and dob
do.pheno <- left_join(do.pheno.alt, do.pheno[, 2:4])
# Read genotype data -----------------------------------------------------------
load("data/Jackson_Lab_Bubier_MURGIGV01/gm_DO395_qc_newid.RData")#gm_after_qc
overlap.id  = intersect(ind_ids(gm_after_qc), do.pheno$ID)

#subset
gm = gm_after_qc[overlap.id, ]
do.pheno = do.pheno[do.pheno$ID %in% overlap.id, ]
rownames(do.pheno) = do.pheno$ID
do.pheno = do.pheno[overlap.id,]
all.equal(ind_ids(gm), do.pheno$ID)
# [1] TRUE

#covar
do.pheno$Sex <- as.factor(do.pheno$Sex)
do.pheno$dob <- as.factor(do.pheno$dob)
#addcovar
options(na.action='na.pass')
addcovar = model.matrix(~Sex + dob, data = do.pheno[, c("Sex", "dob")])[,-1]
colnames(addcovar) <- c("sex", "dob")

#histgram for raw phenotypes------------
do.pheno %>%
     select(2:11) %>%
     map2(.,.y = colnames(.), ~ ggplot(do.pheno, aes(x = .x)) +
               geom_histogram() +
               xlab(.y)
     ) %>%
     wrap_plots( ncol = 3)
# Warning: Removed 204 rows containing non-finite values (stat_bin).
# Warning: Removed 37 rows containing non-finite values (stat_bin).

# Warning: Removed 37 rows containing non-finite values (stat_bin).

# Warning: Removed 37 rows containing non-finite values (stat_bin).
# Warning: Removed 72 rows containing non-finite values (stat_bin).
# Warning: Removed 282 rows containing non-finite values (stat_bin).

# Warning: Removed 282 rows containing non-finite values (stat_bin).

# Warning: Removed 282 rows containing non-finite values (stat_bin).

# Warning: Removed 282 rows containing non-finite values (stat_bin).

# Warning: Removed 282 rows containing non-finite values (stat_bin).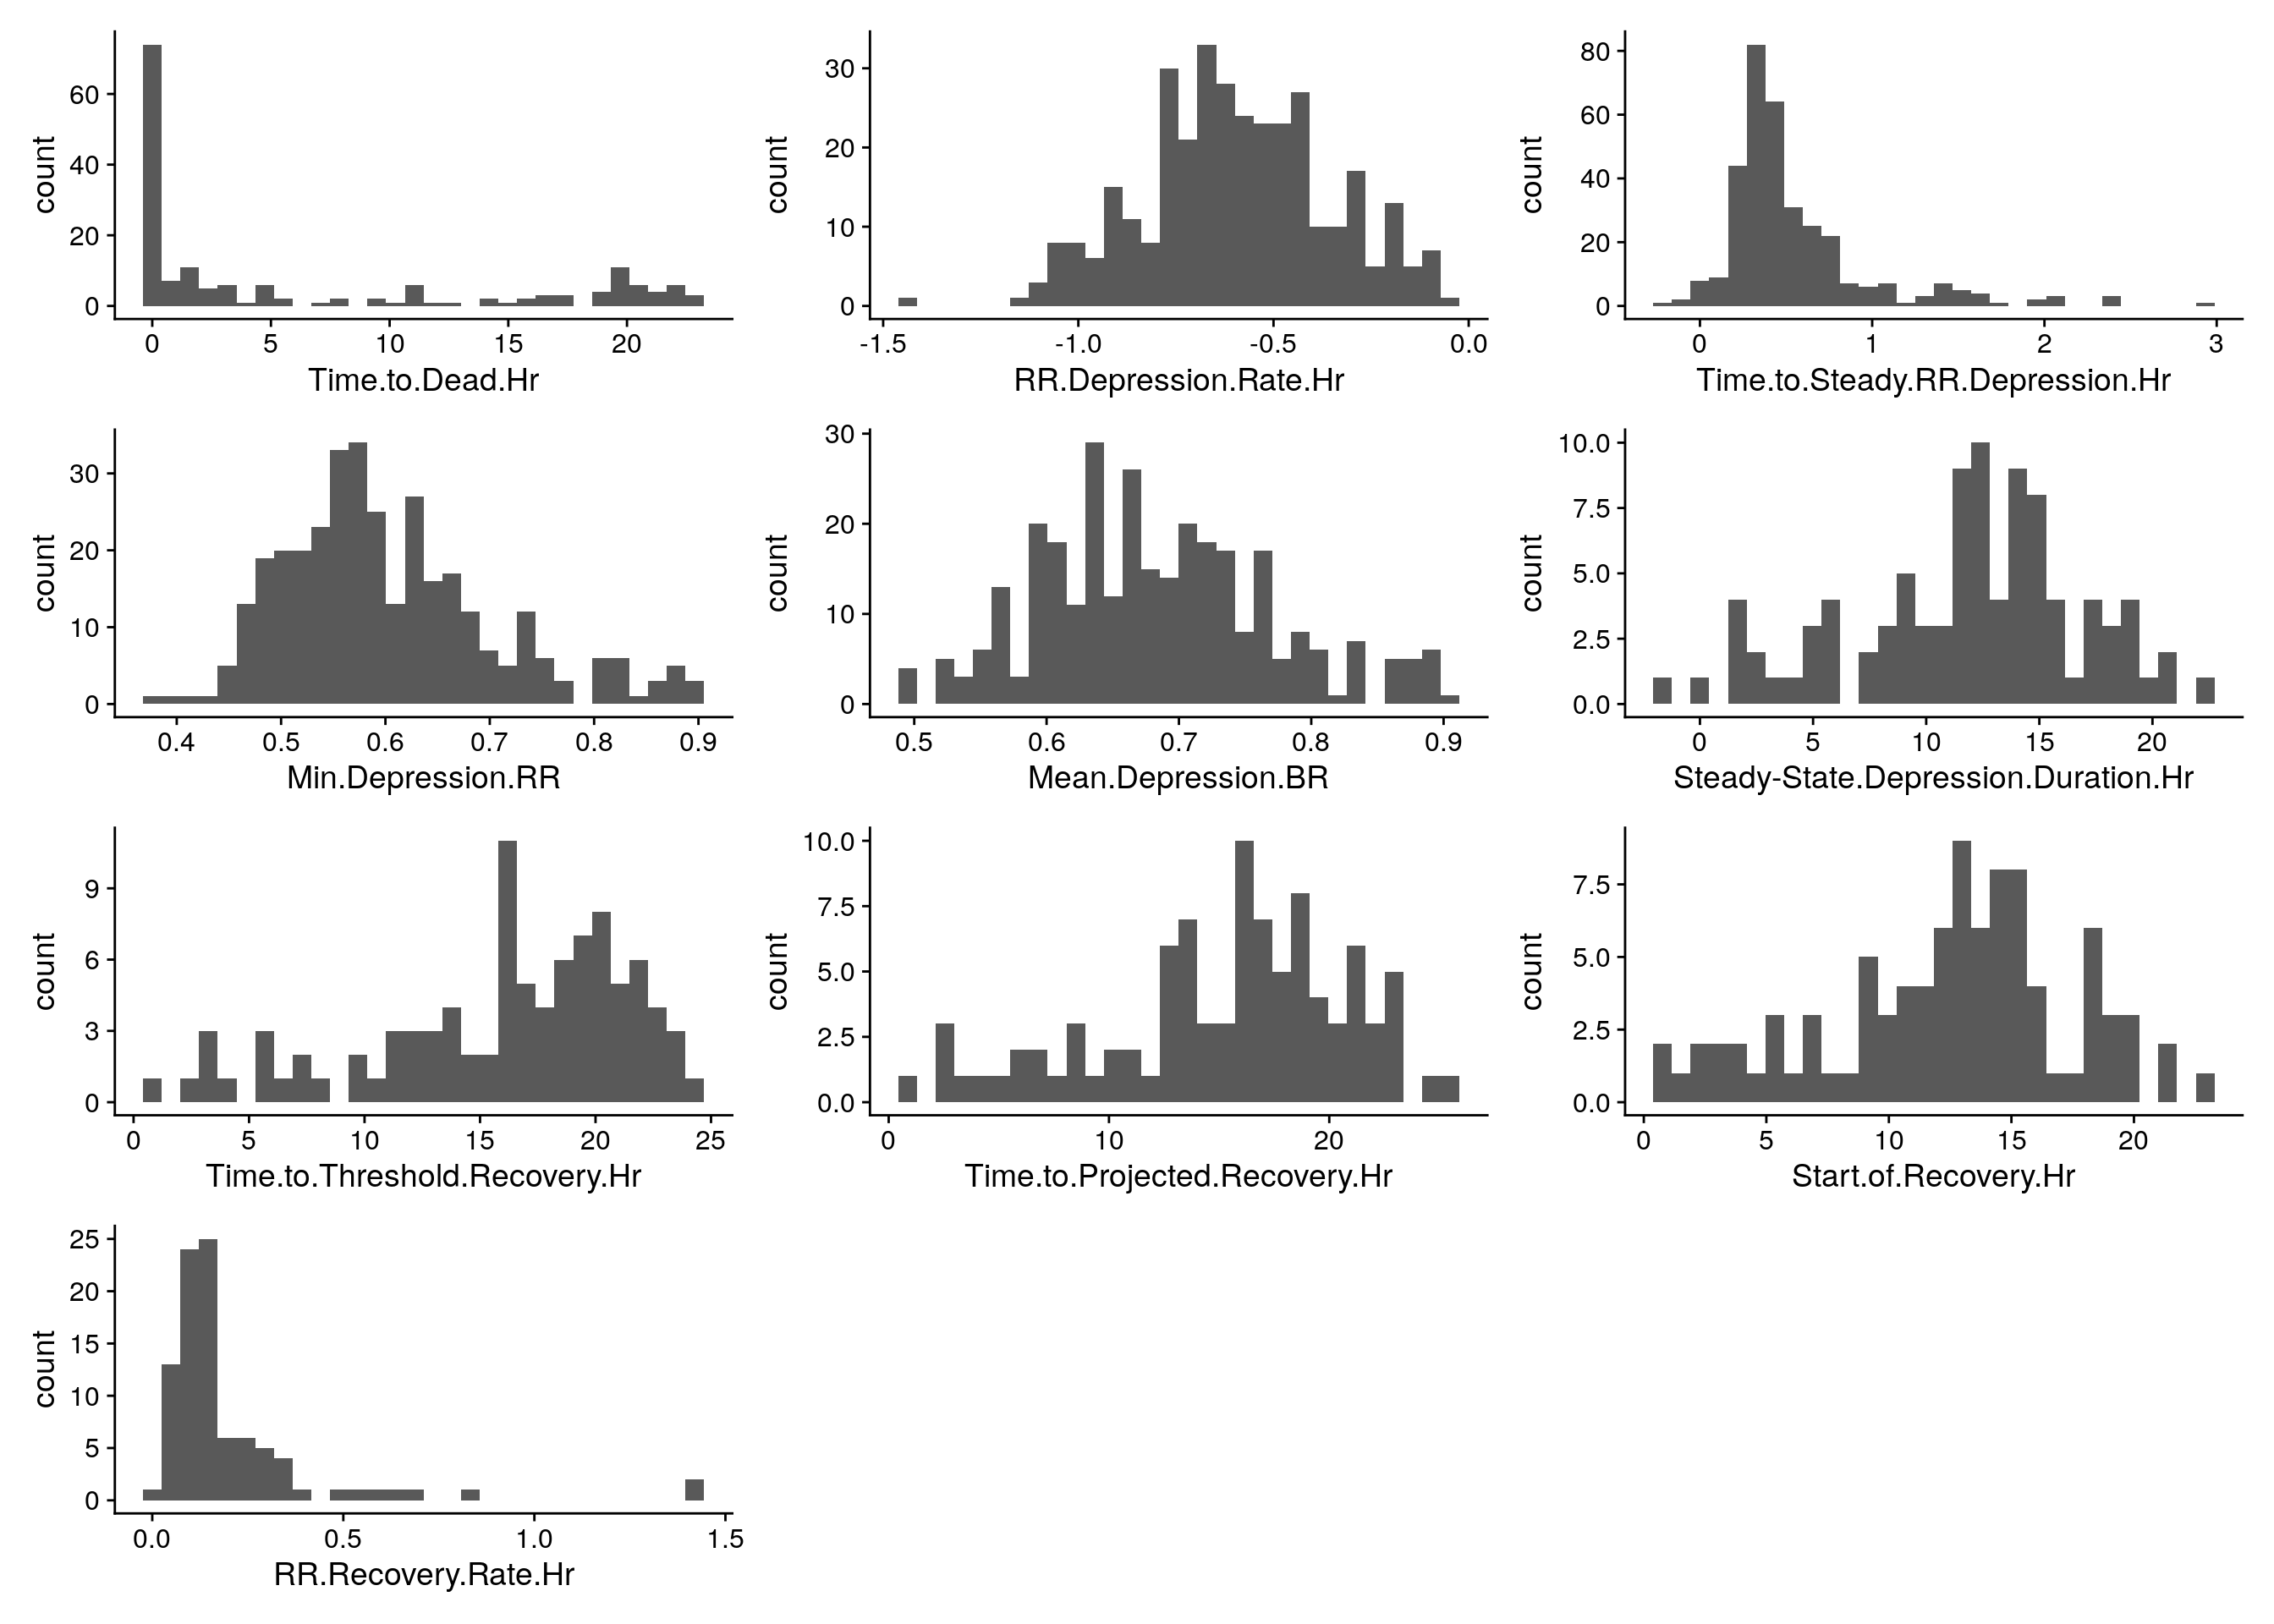
| Version | Author | Date |
|---|---|---|
| f412738 | xhyuo | 2021-12-20 |
#histgram for rankz phenotypes------------
do.pheno %>%
     select(2:11) %>%
     map2(.,.y = colnames(.), ~ ggplot(do.pheno, aes(x = rz.transform(.x))) +
               geom_histogram() +
               xlab(.y)
     ) %>%
     wrap_plots( ncol = 3)
# Warning: Removed 204 rows containing non-finite values (stat_bin).
# Warning: Removed 37 rows containing non-finite values (stat_bin).

# Warning: Removed 37 rows containing non-finite values (stat_bin).

# Warning: Removed 37 rows containing non-finite values (stat_bin).
# Warning: Removed 72 rows containing non-finite values (stat_bin).
# Warning: Removed 282 rows containing non-finite values (stat_bin).

# Warning: Removed 282 rows containing non-finite values (stat_bin).

# Warning: Removed 282 rows containing non-finite values (stat_bin).

# Warning: Removed 282 rows containing non-finite values (stat_bin).

# Warning: Removed 282 rows containing non-finite values (stat_bin).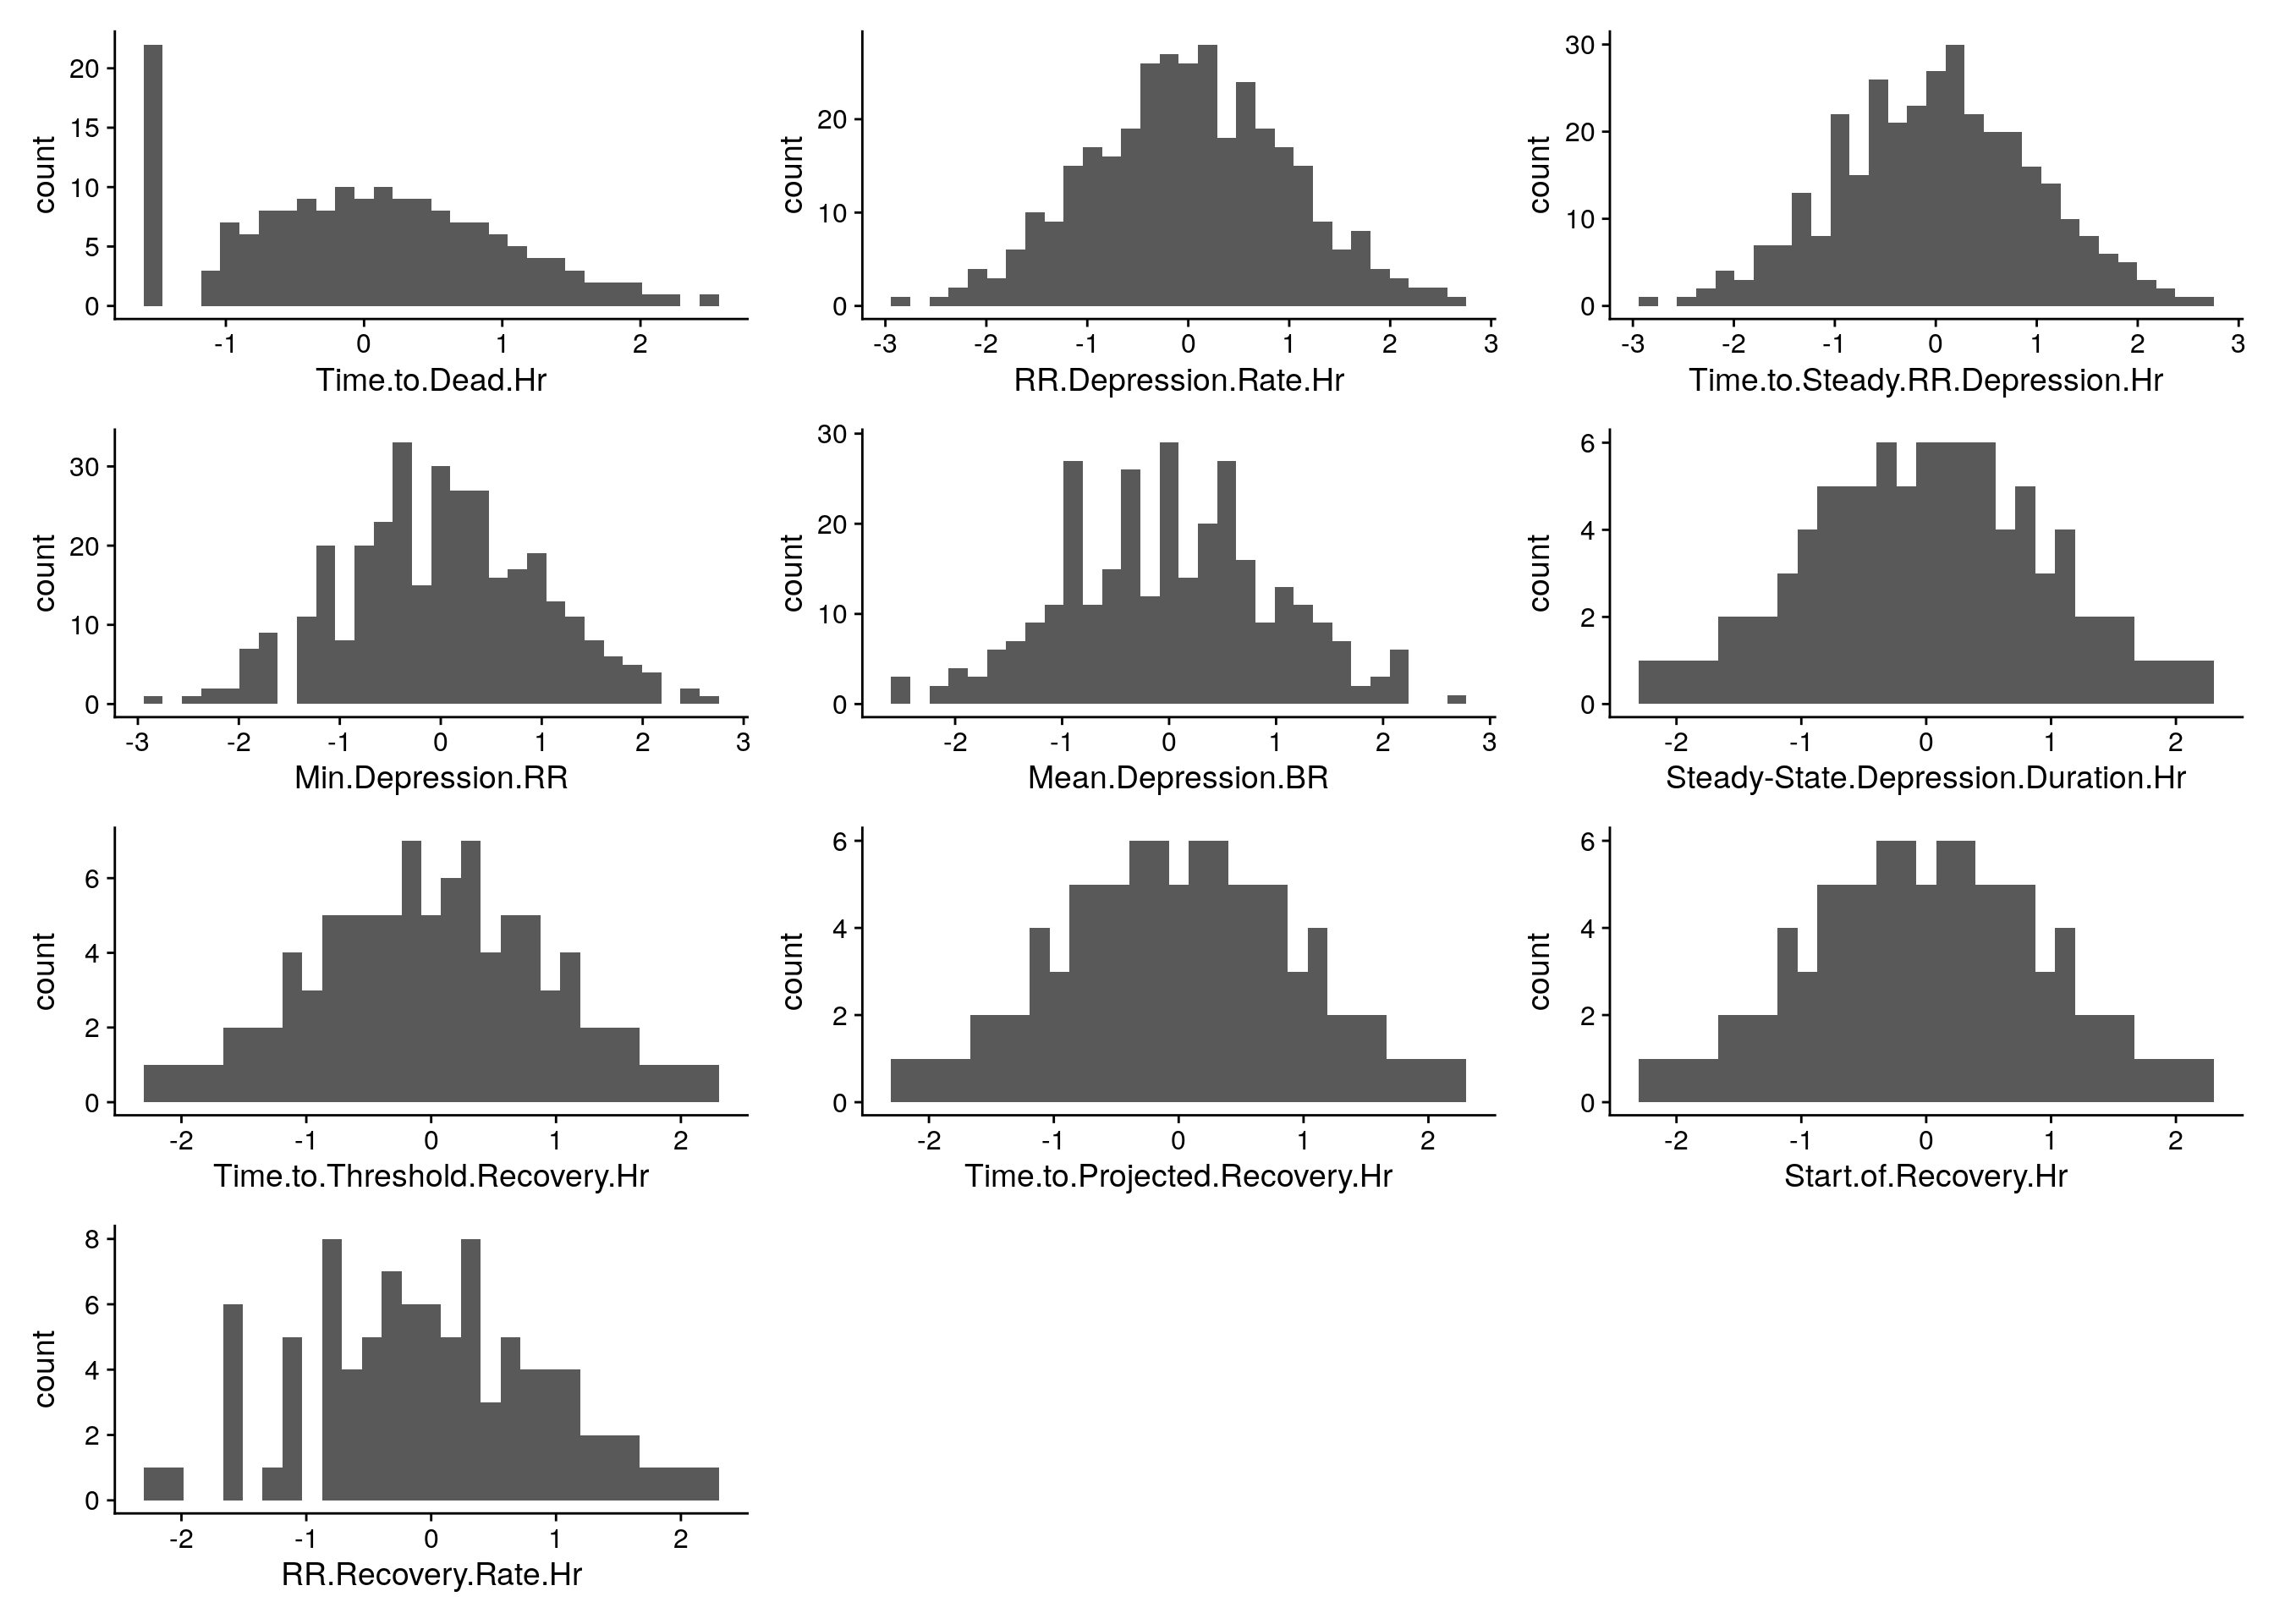
| Version | Author | Date |
|---|---|---|
| f412738 | xhyuo | 2021-12-20 |
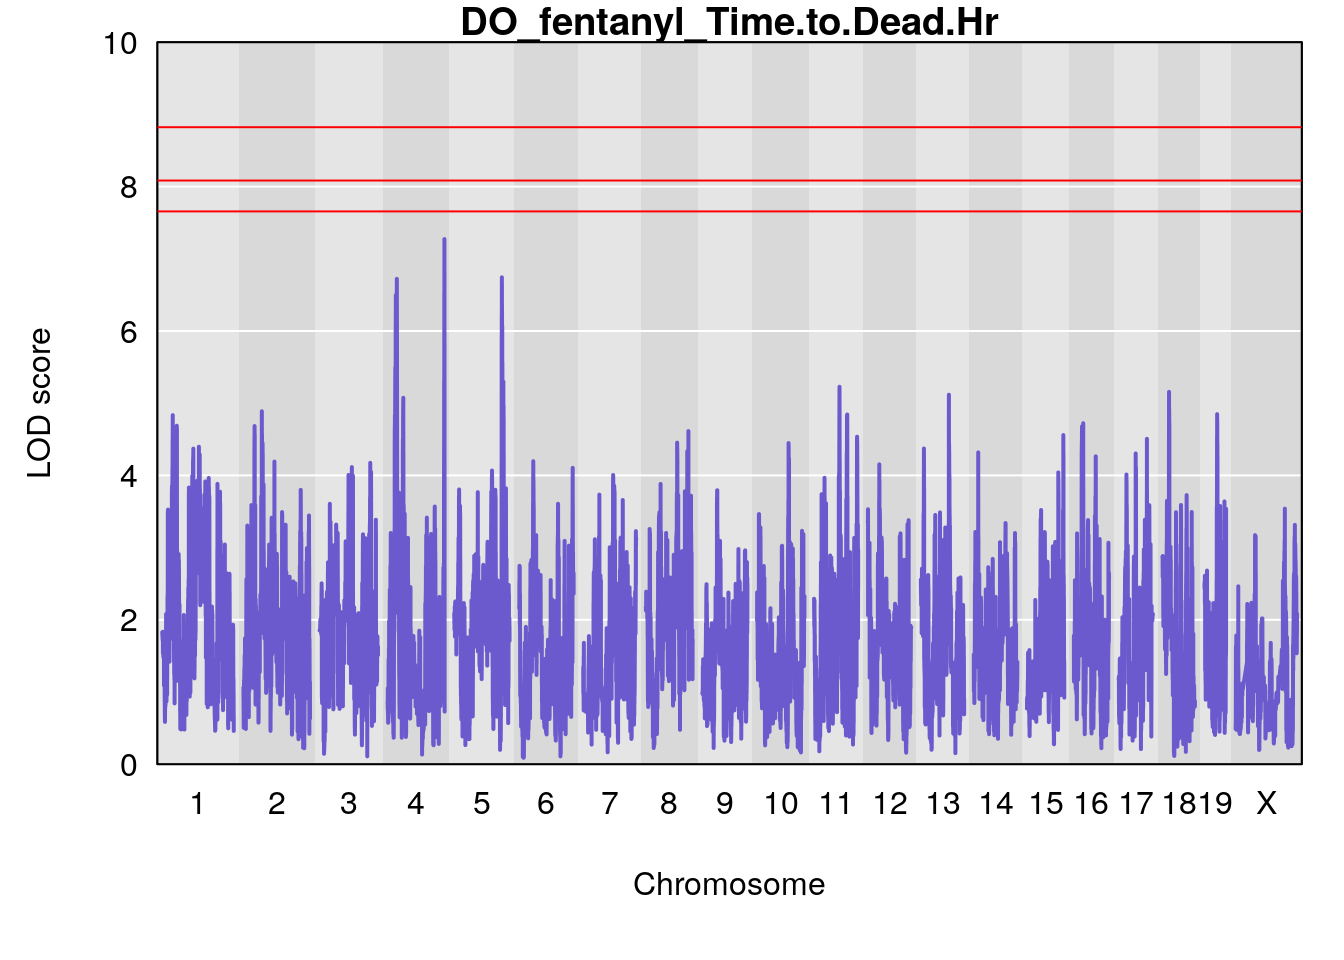
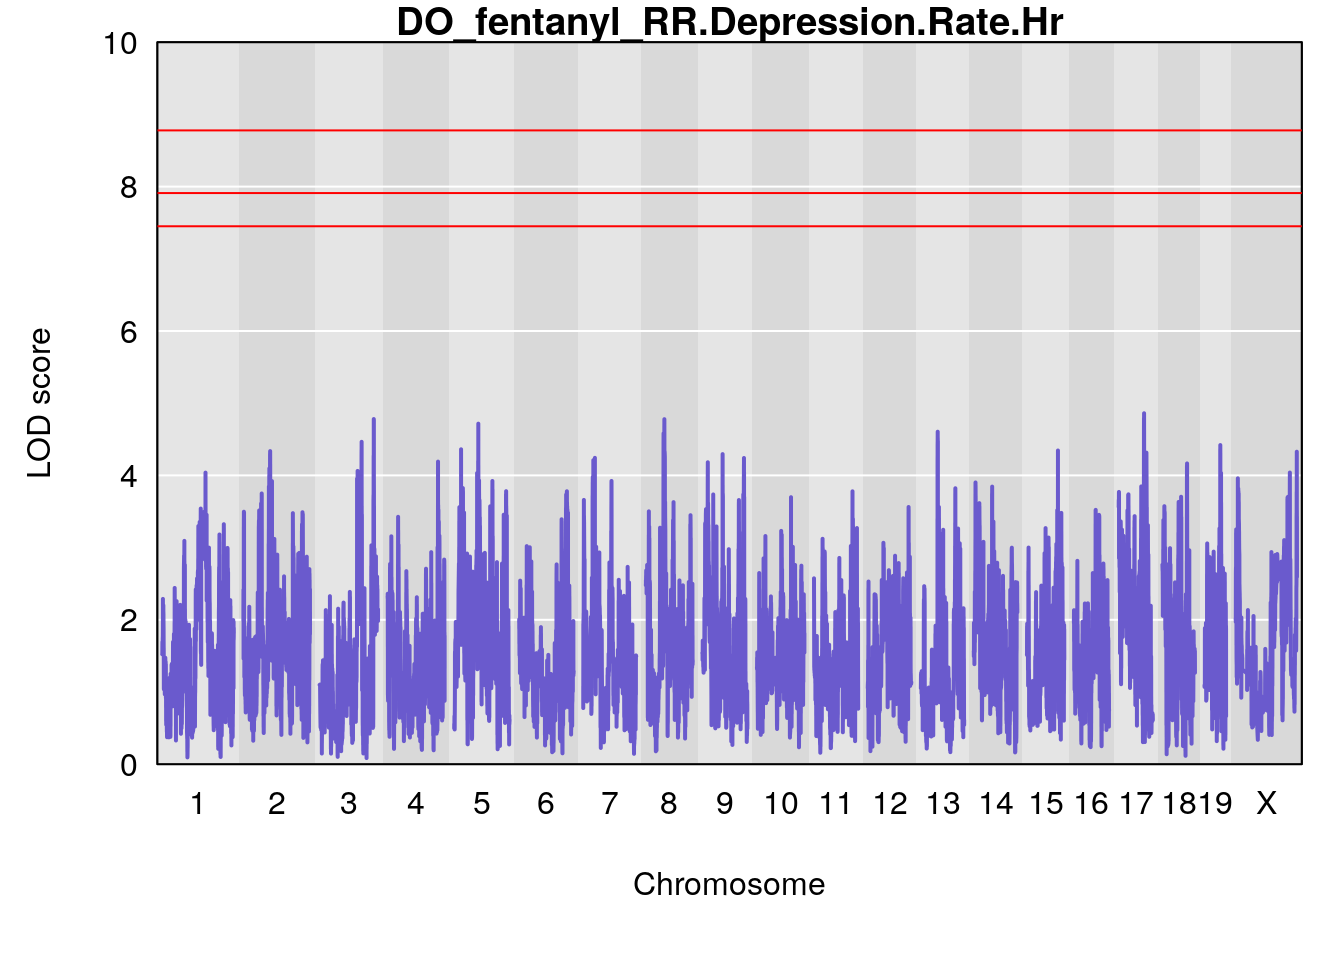
###Plot qtl mapping on array
load("output/Fentanyl/qtl.fentanyl.array.alternate.metrics.out.RData")
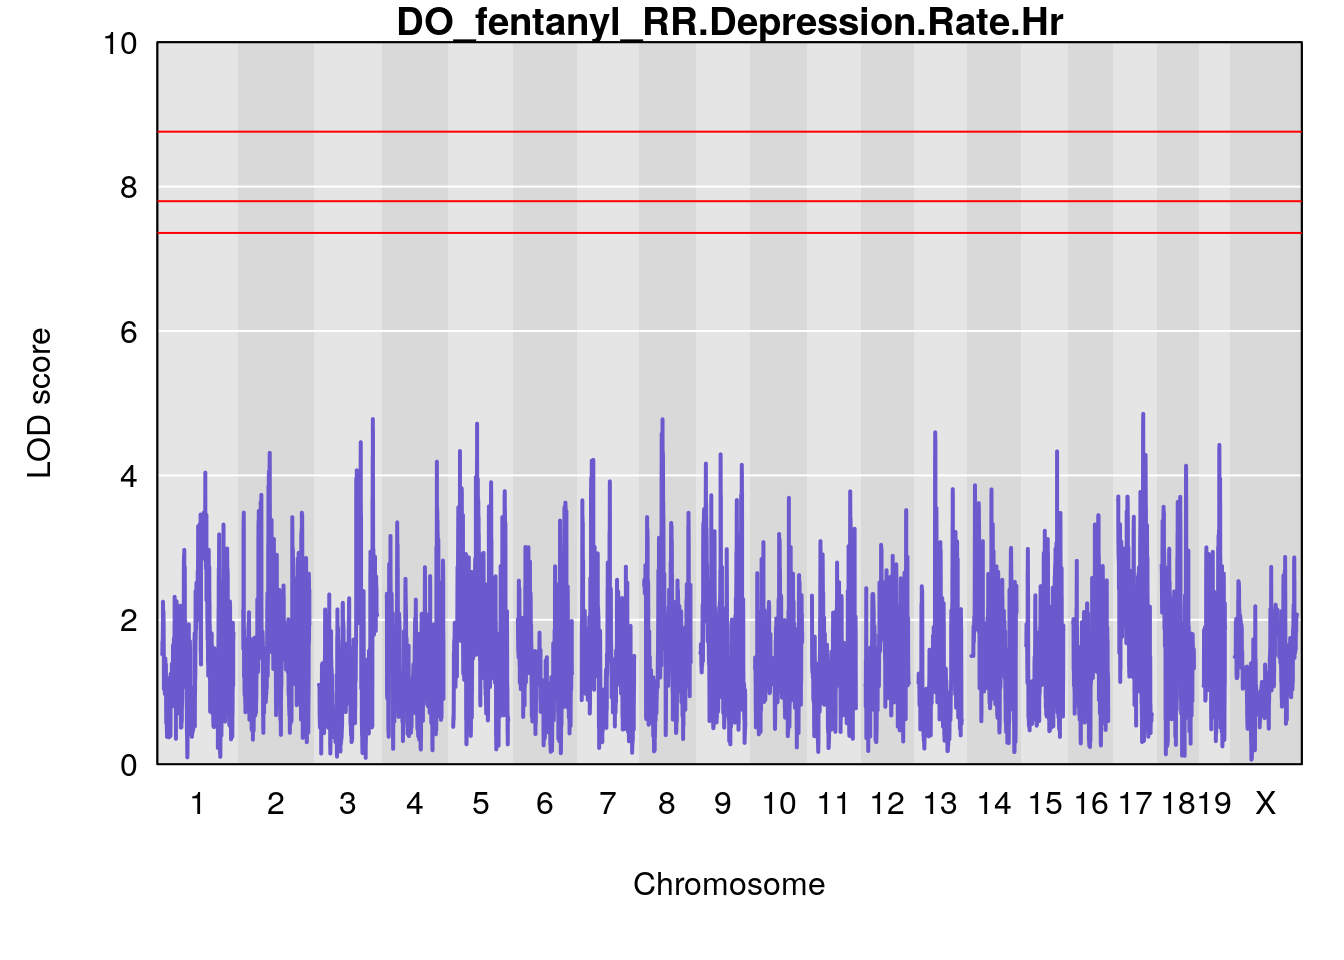
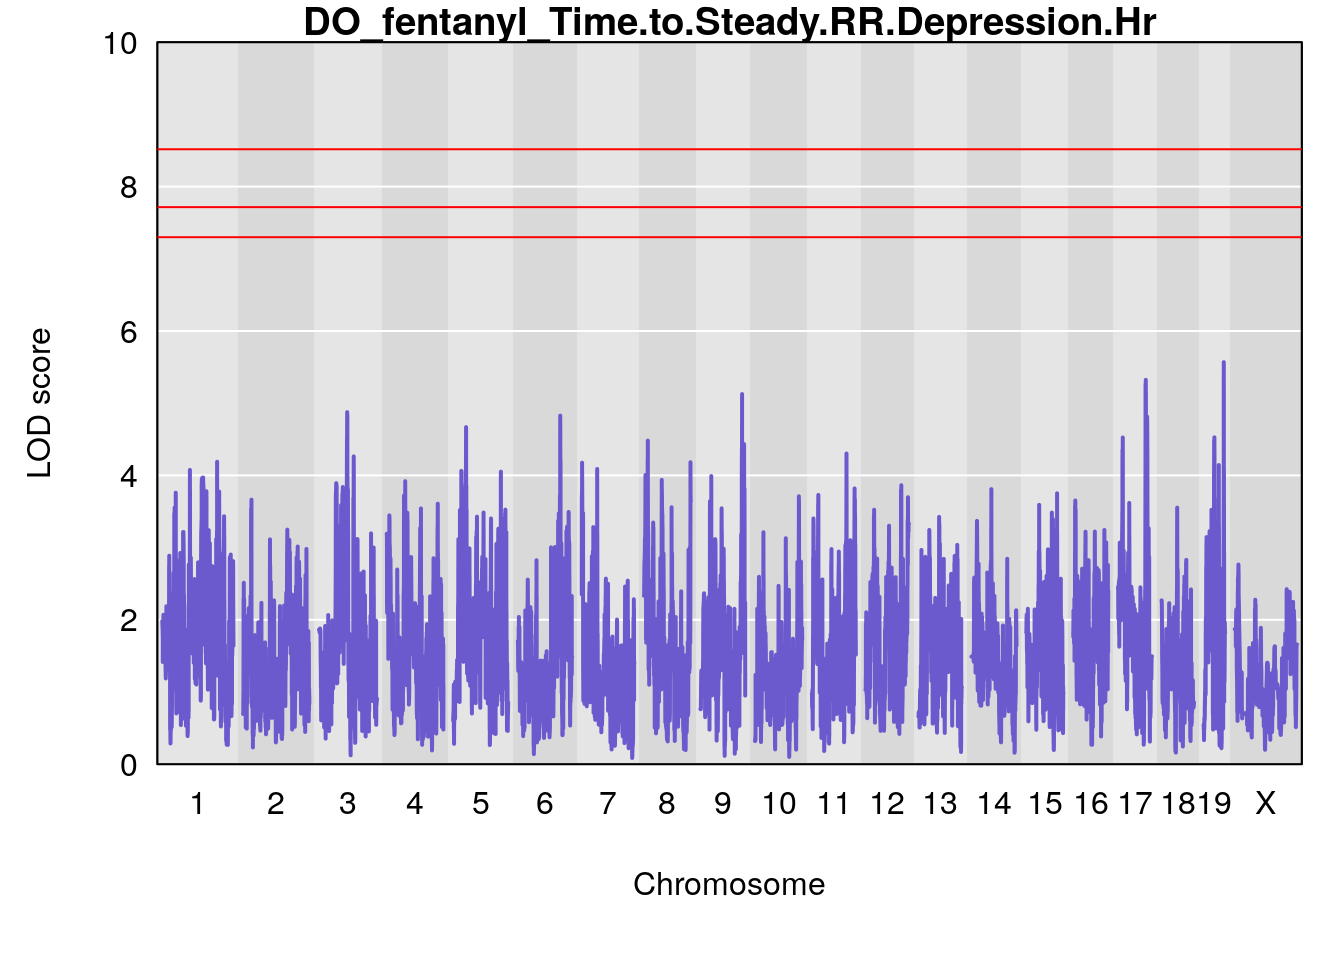
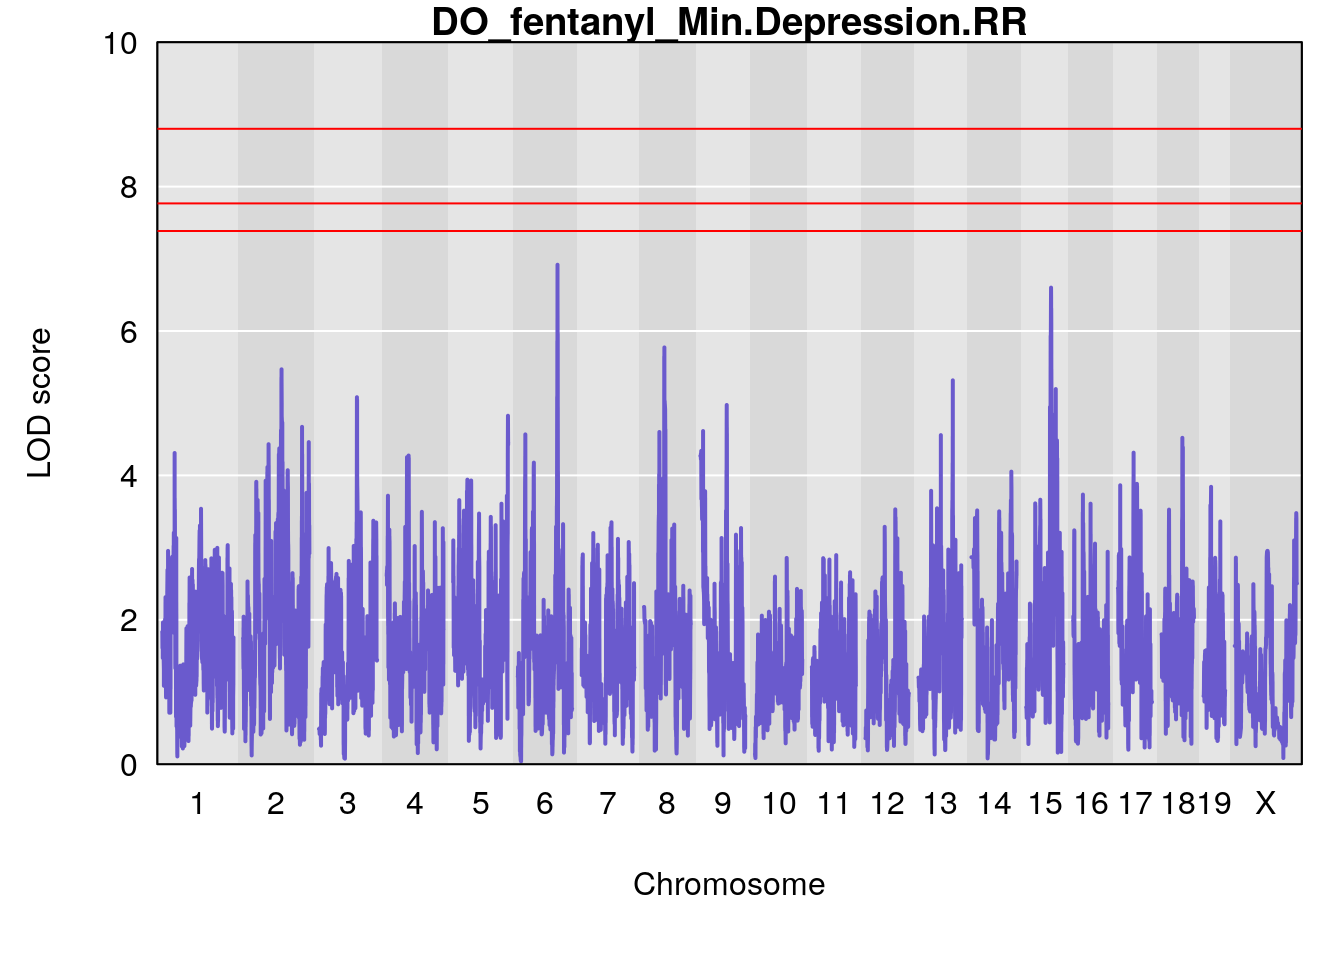
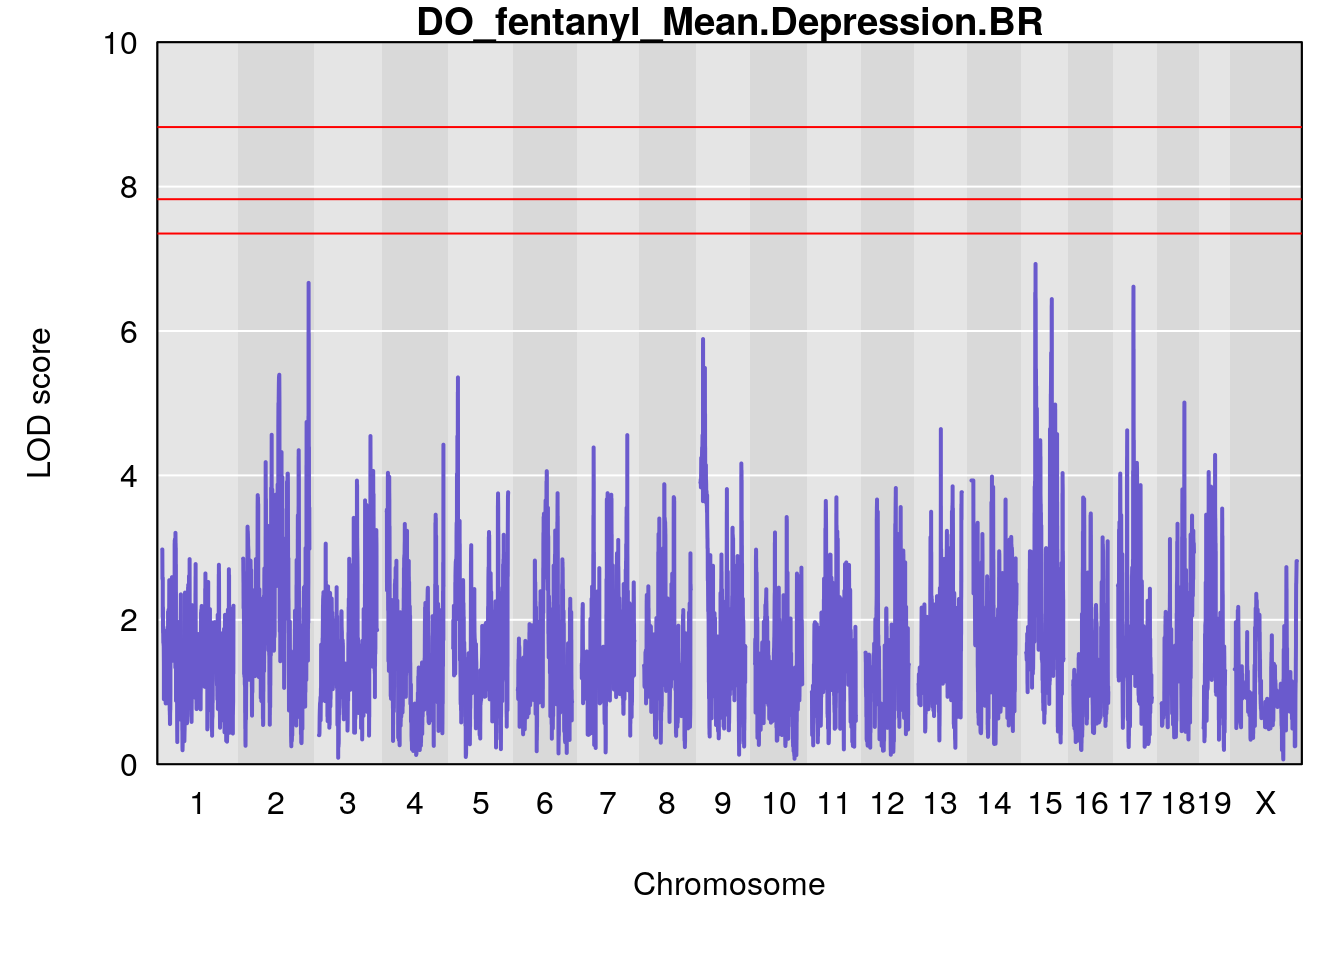
#genome-wide plot
for(i in names(qtl.morphine.out)){
par(mar=c(5.1, 4.1, 1.1, 1.1))
ymx <- maxlod(qtl.morphine.out[[i]]) # overall maximum LOD score
plot(qtl.morphine.out[[i]], map=gm$pmap, lodcolumn=1, col="slateblue", ylim=c(0, 10))
abline(h=summary(qtl.morphine.operm[[i]], alpha=c(0.10, 0.05, 0.01))[[1]], col="red")
abline(h=summary(qtl.morphine.operm[[i]], alpha=c(0.10, 0.05, 0.01))[[2]], col="red")
abline(h=summary(qtl.morphine.operm[[i]], alpha=c(0.10, 0.05, 0.01))[[3]], col="red")
title(main = paste0("DO_fentanyl_",i))
}
#save genome-wide plot
for(i in names(qtl.morphine.out)){
png(file = paste0("output/Fentanyl/DO_fentanyl_array_alternate_metrics_", i, ".png"), width = 16, height =8, res=300, units = "in")
par(mar=c(5.1, 4.1, 1.1, 1.1))
ymx <- maxlod(qtl.morphine.out[[i]]) # overall maximum LOD score
plot(qtl.morphine.out[[i]], map=gm$pmap, lodcolumn=1, col="slateblue", ylim=c(0, 10))
abline(h=summary(qtl.morphine.operm[[i]], alpha=c(0.10, 0.05, 0.01))[[1]], col="red")
abline(h=summary(qtl.morphine.operm[[i]], alpha=c(0.10, 0.05, 0.01))[[2]], col="red")
abline(h=summary(qtl.morphine.operm[[i]], alpha=c(0.10, 0.05, 0.01))[[3]], col="red")
title(main = paste0("DO_fentanyl_",i))
dev.off()
}
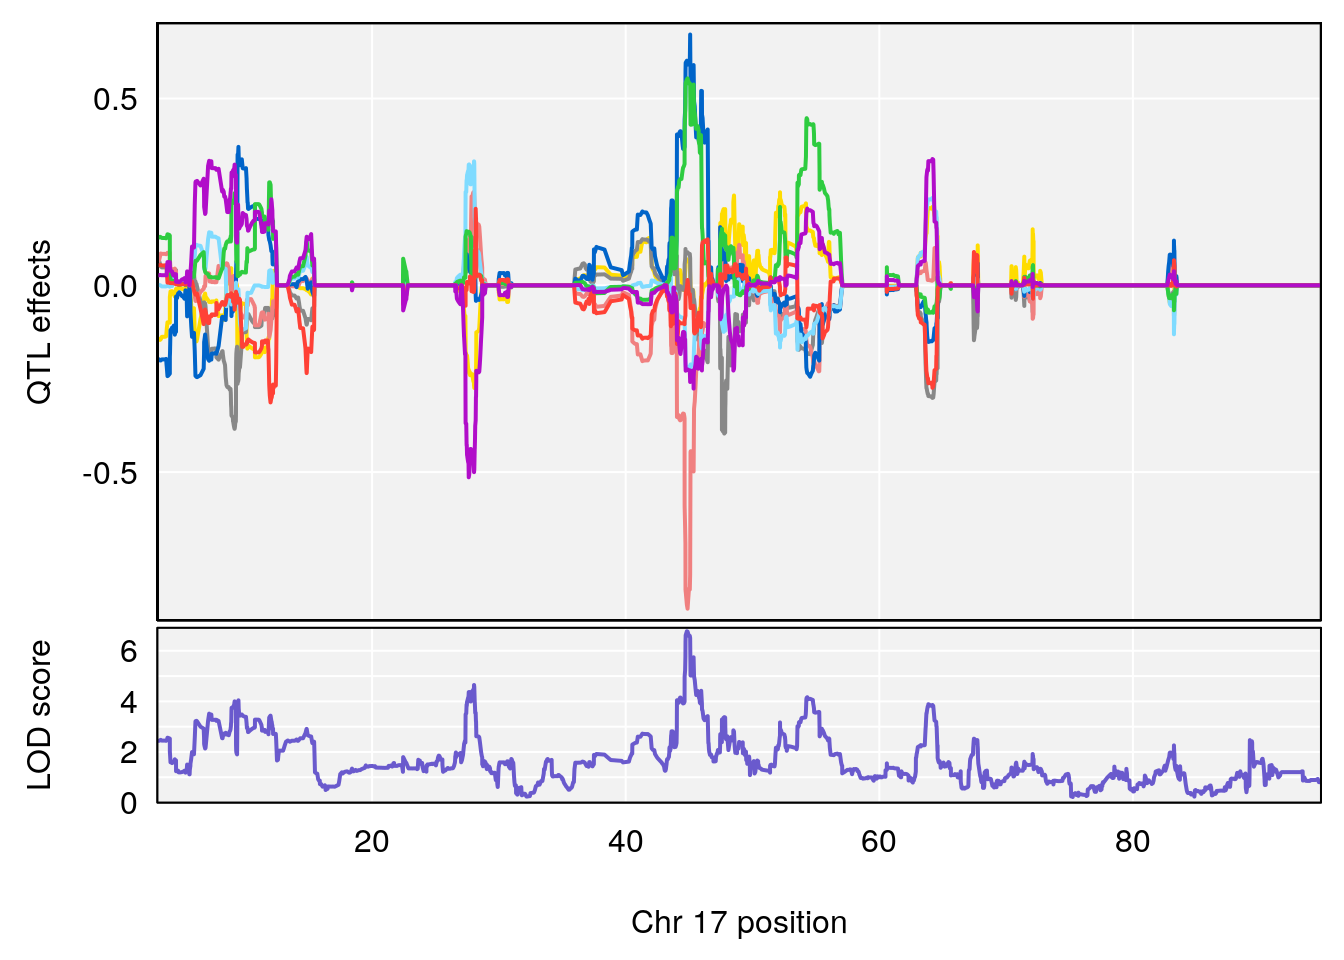
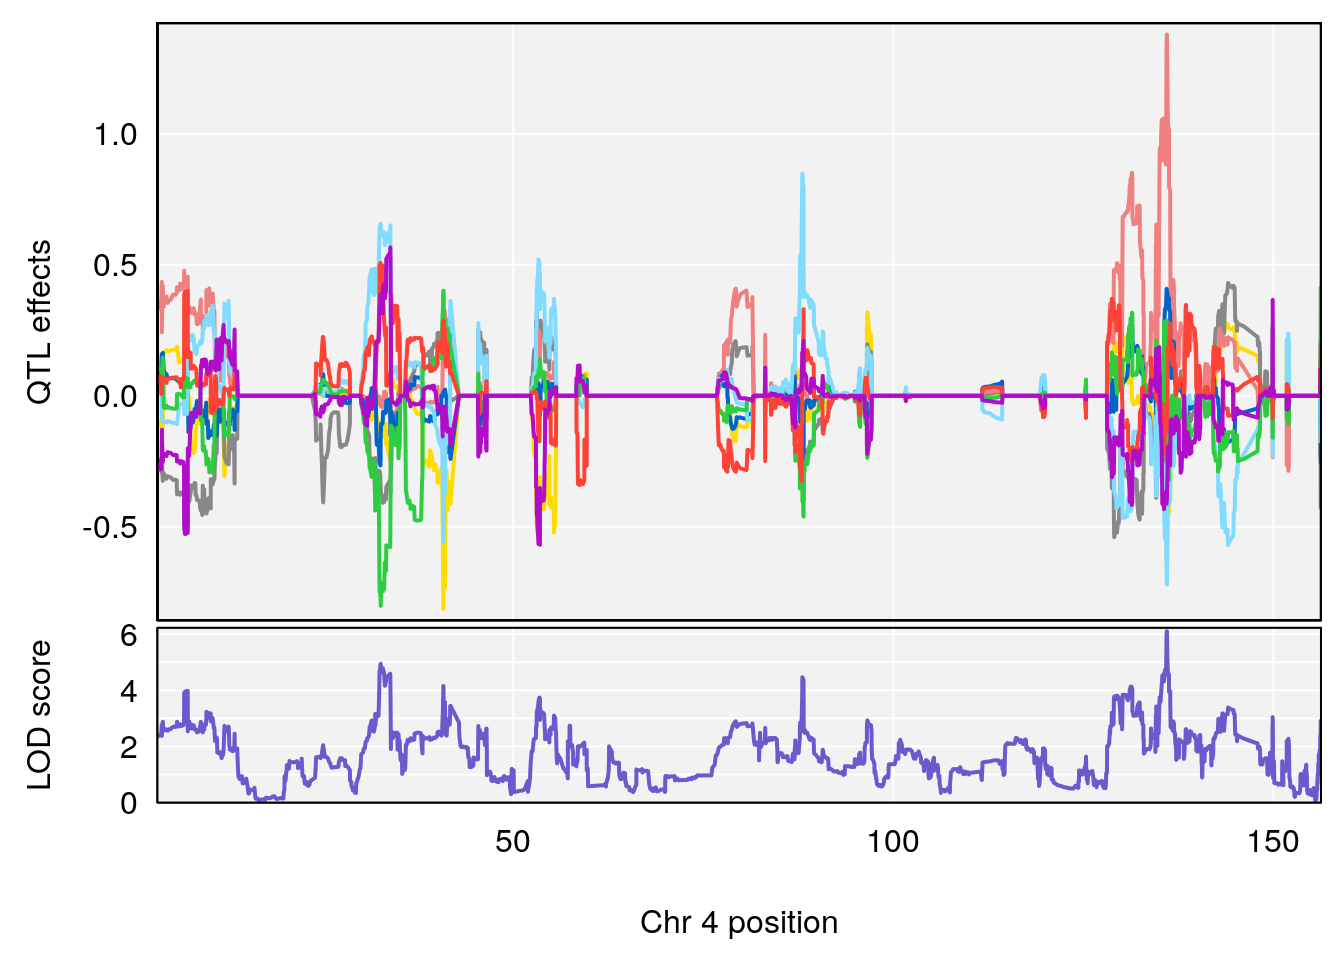
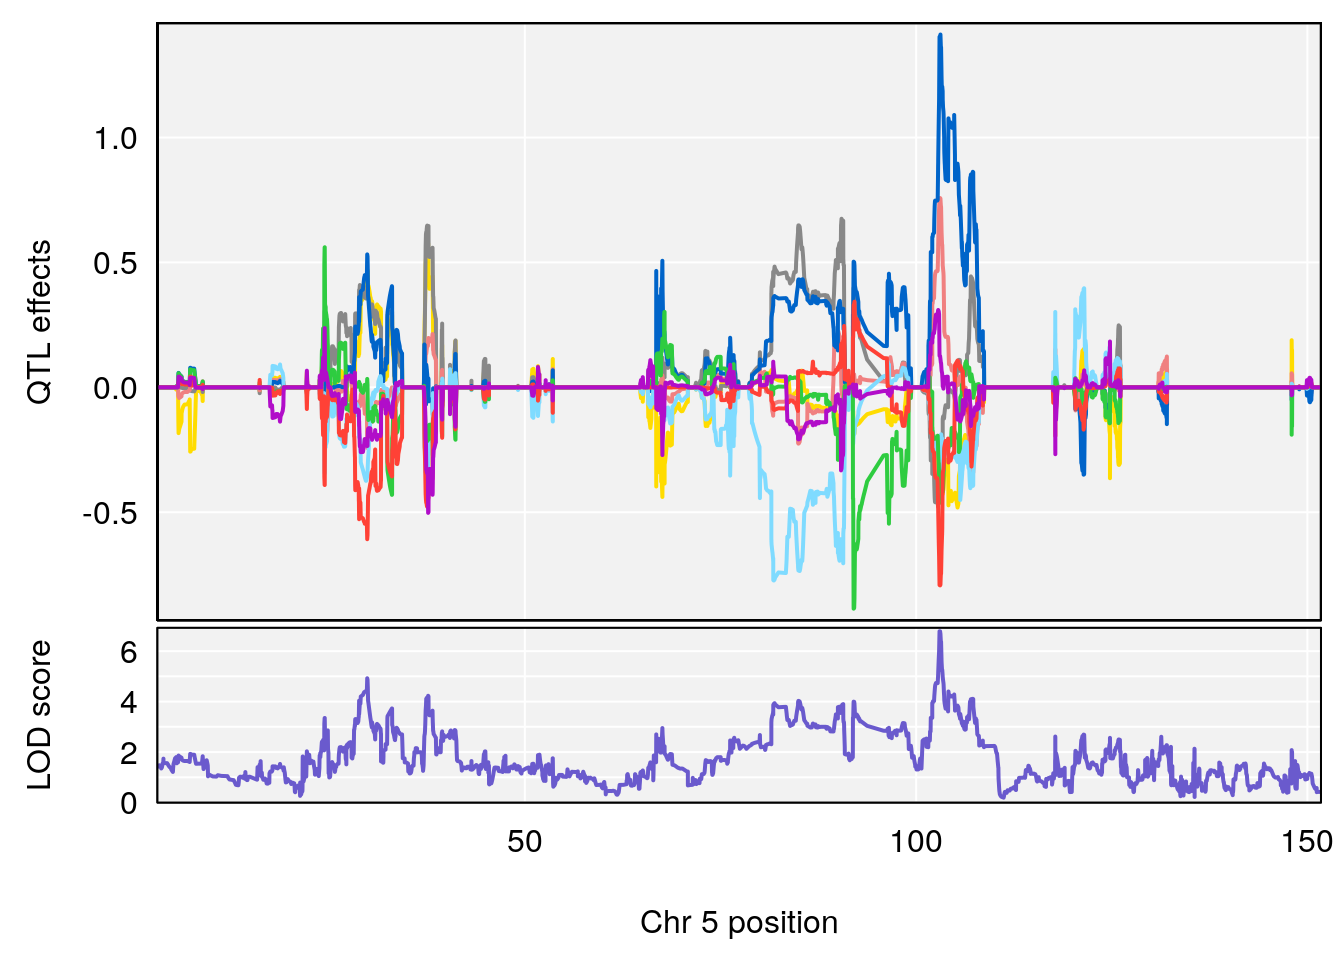
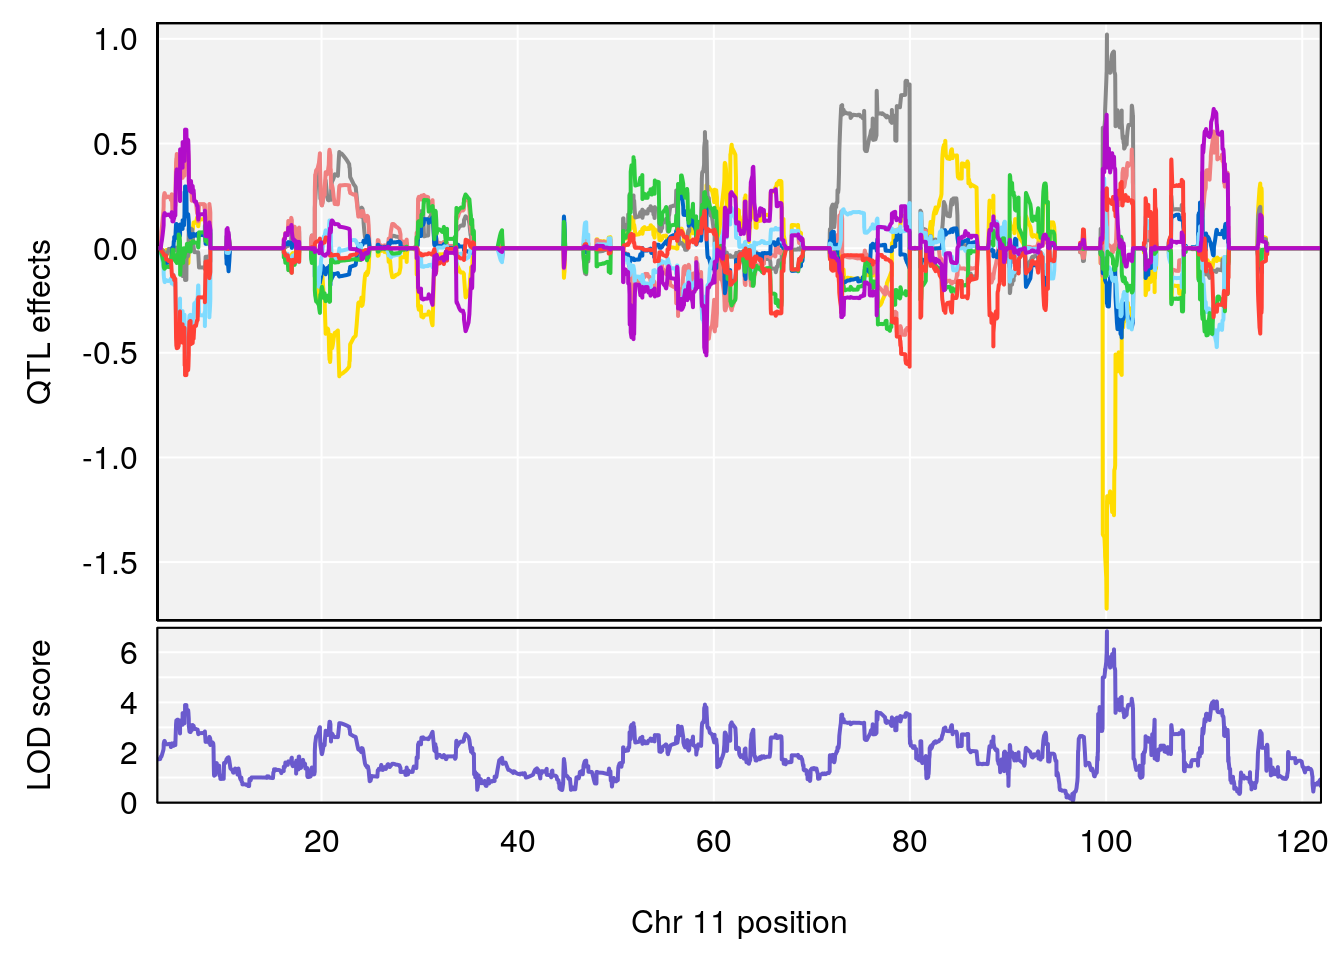
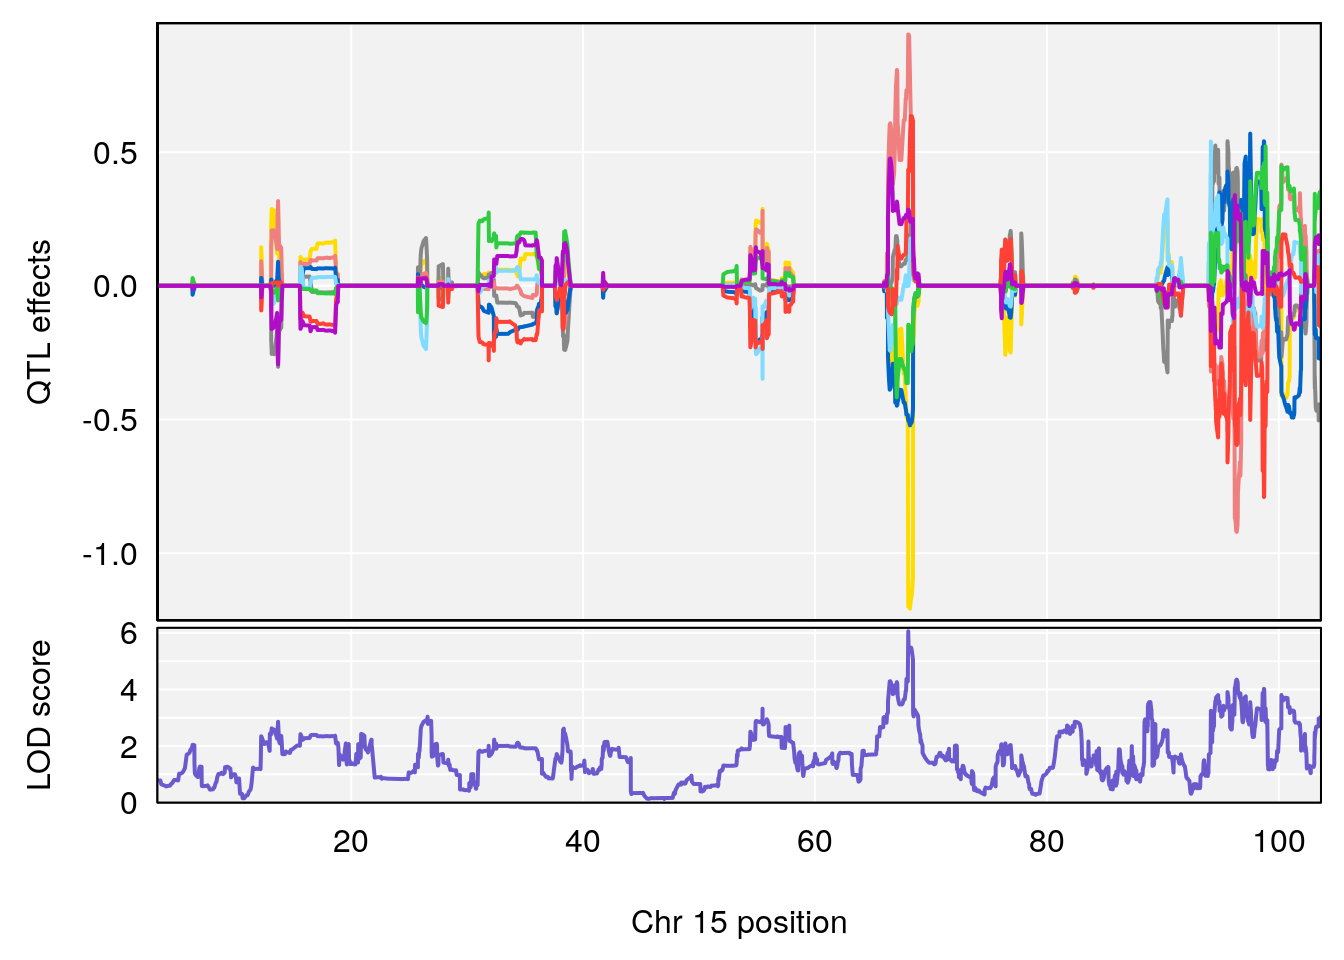
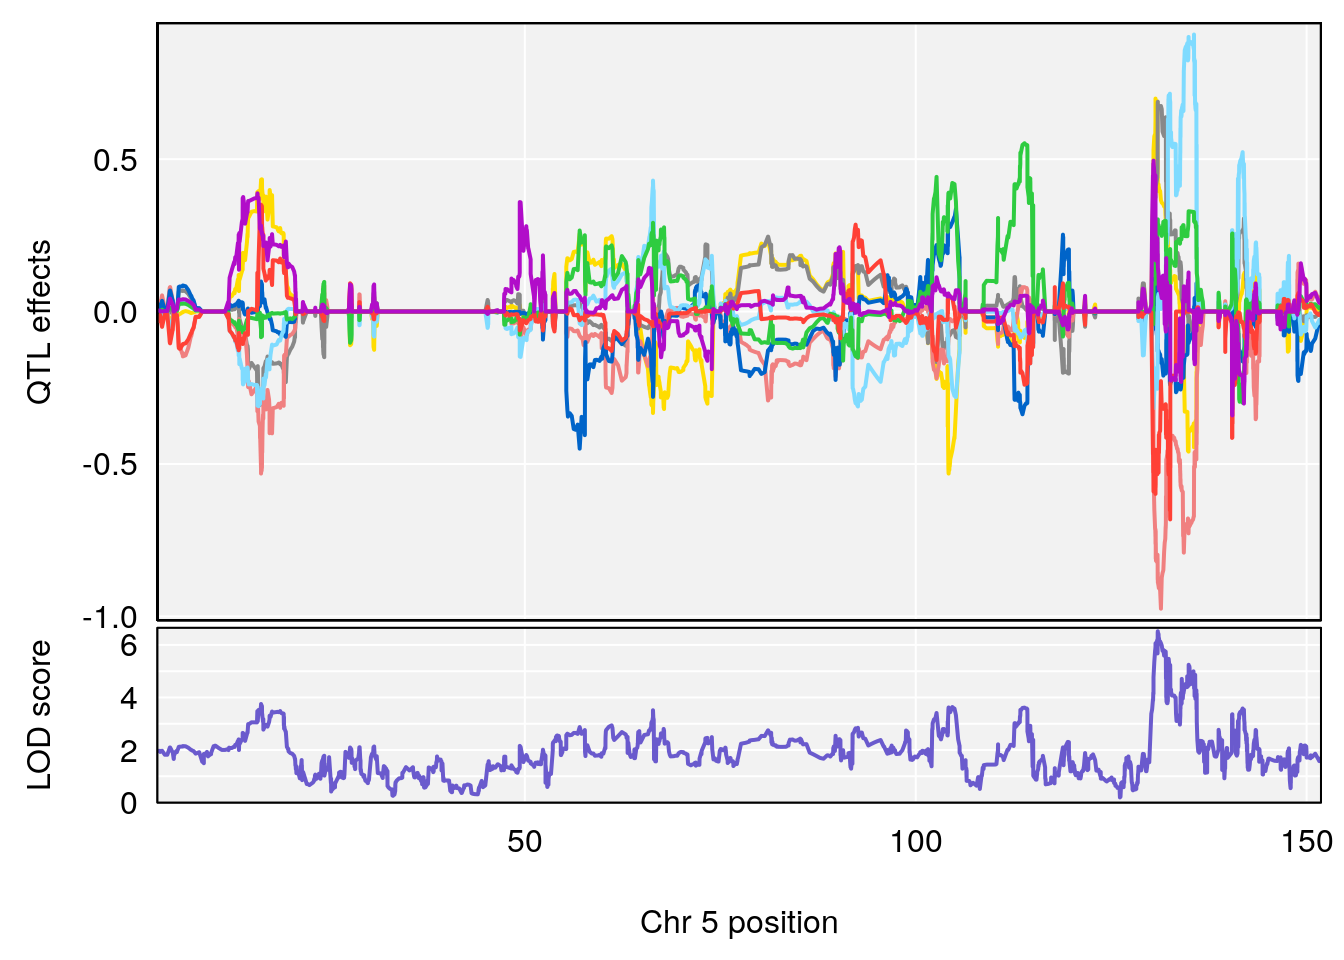
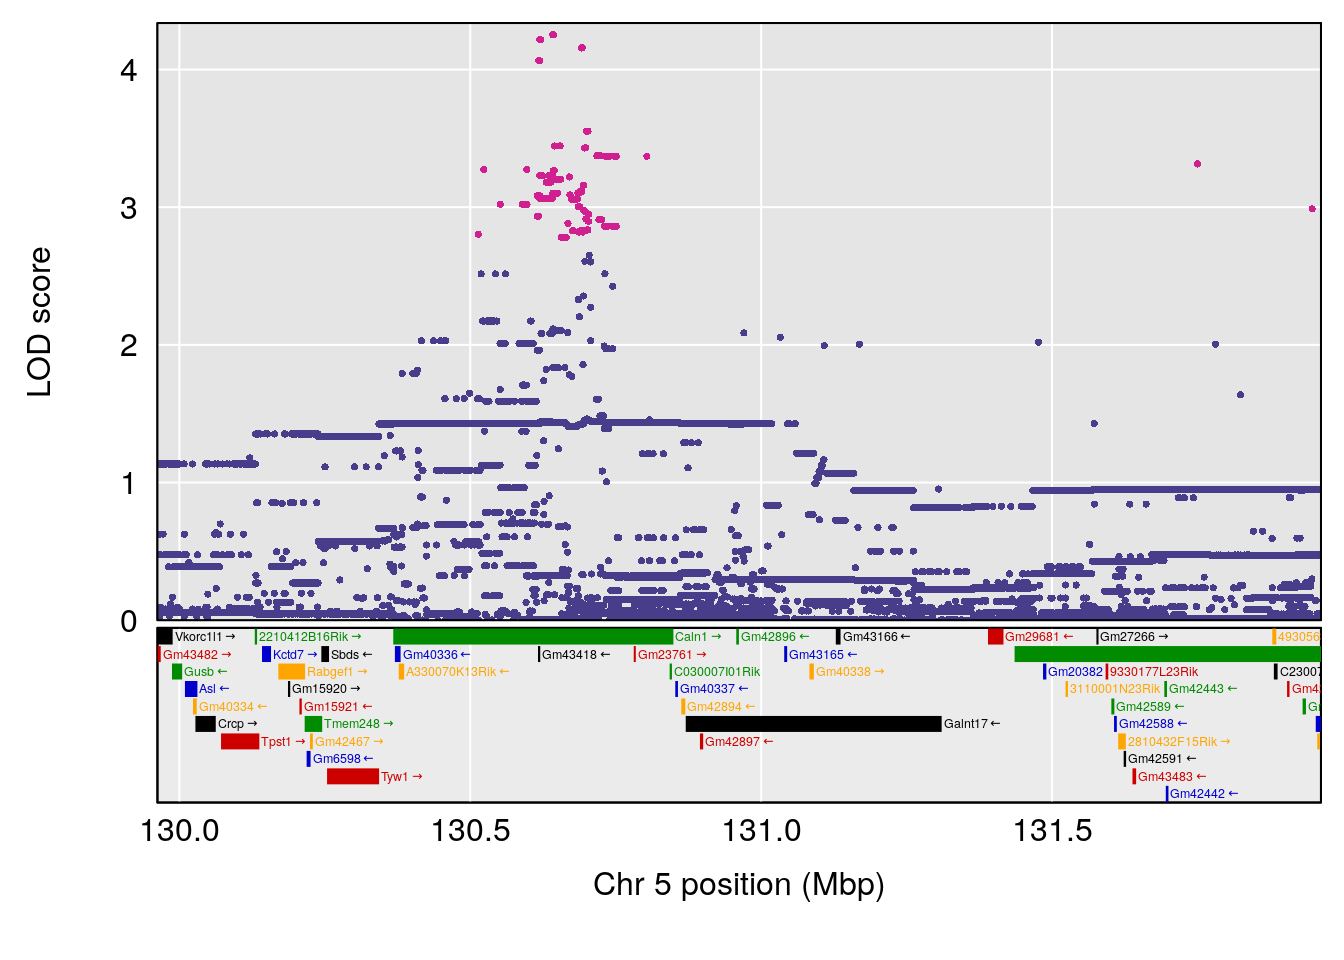
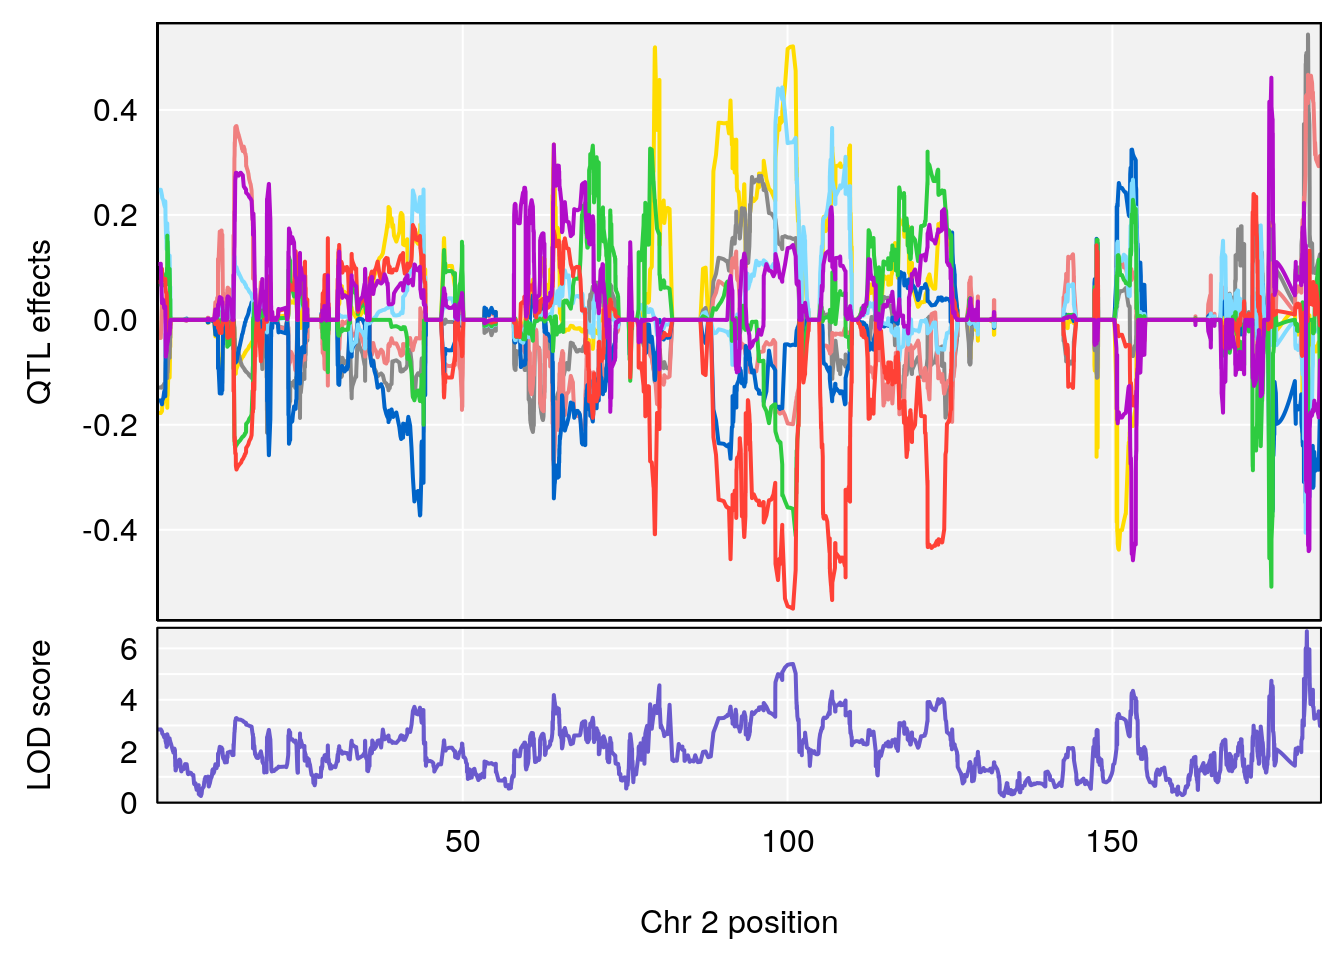
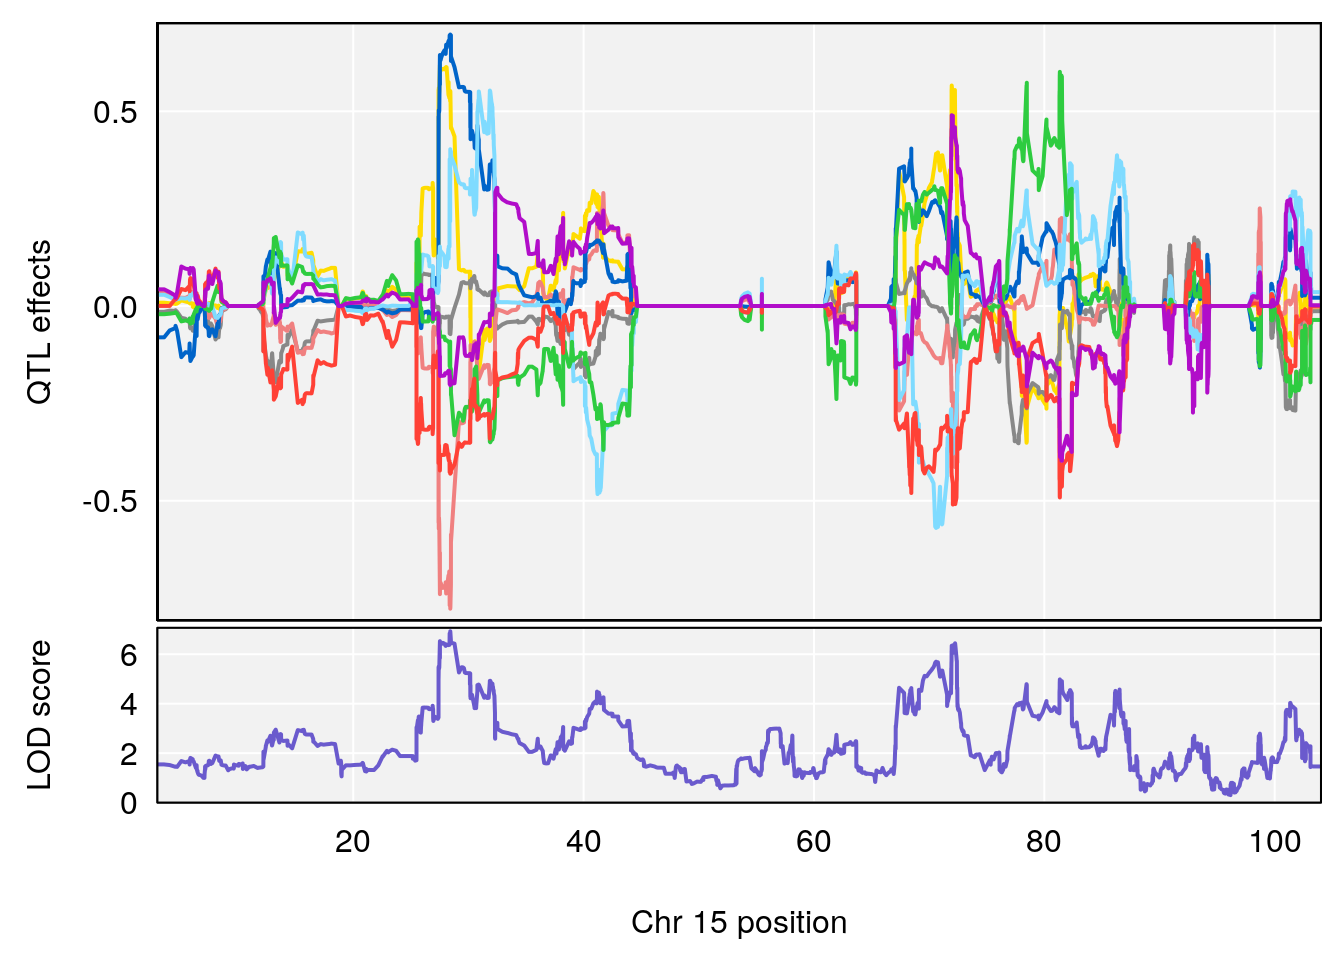
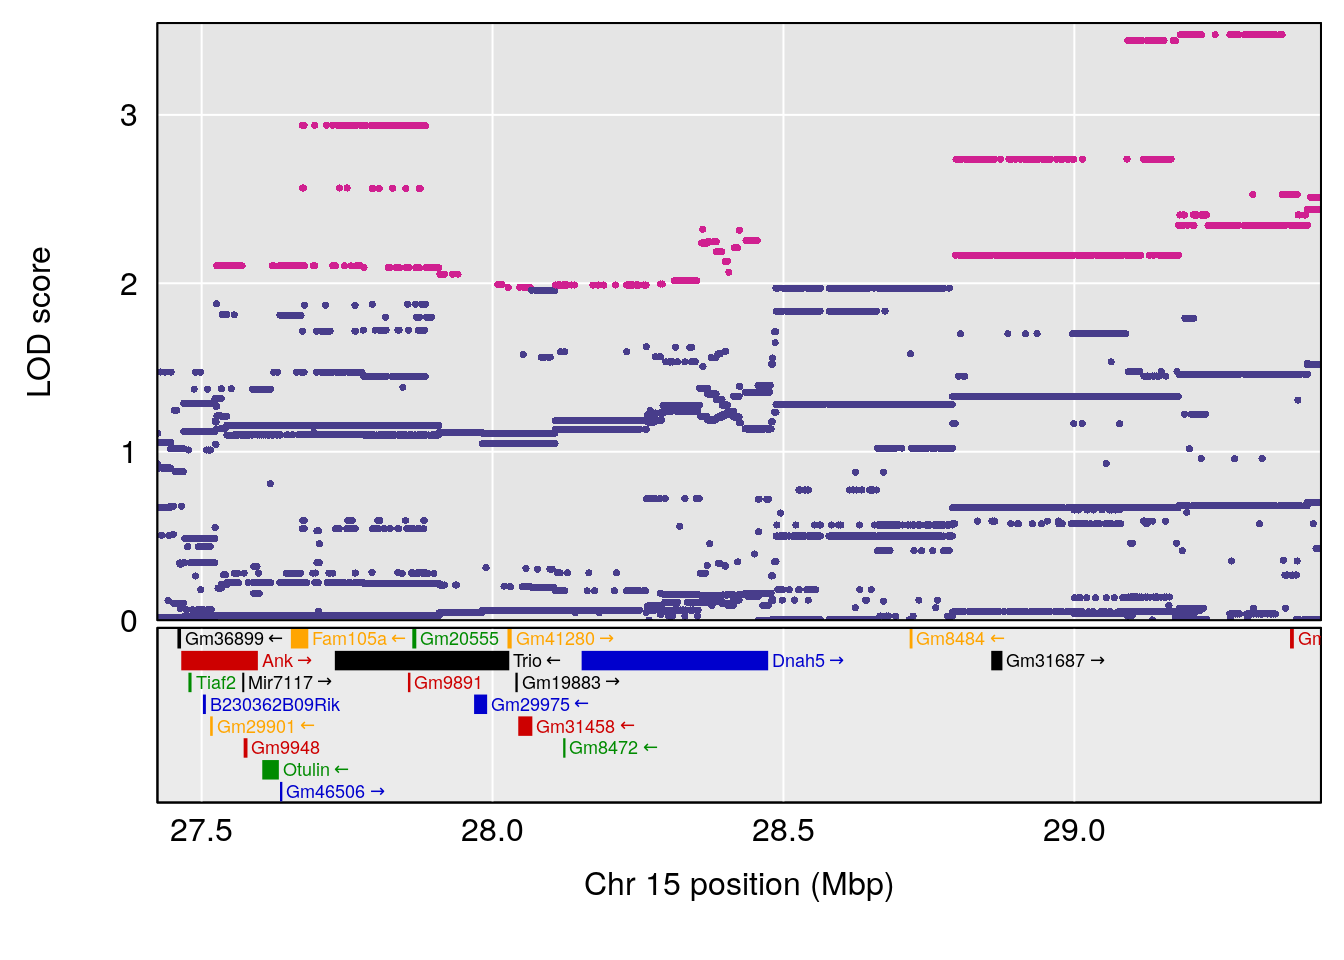
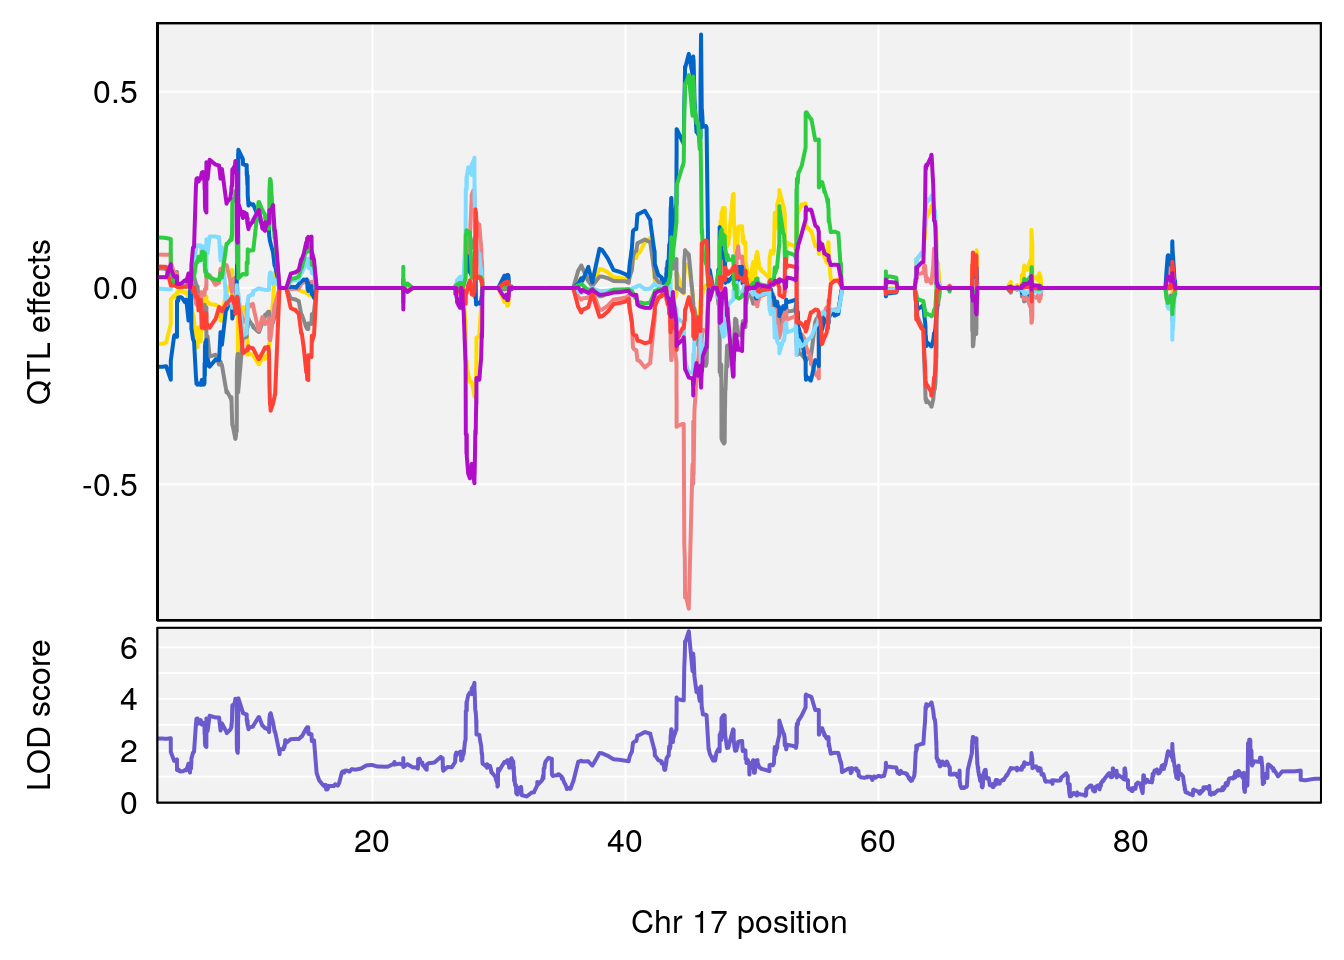
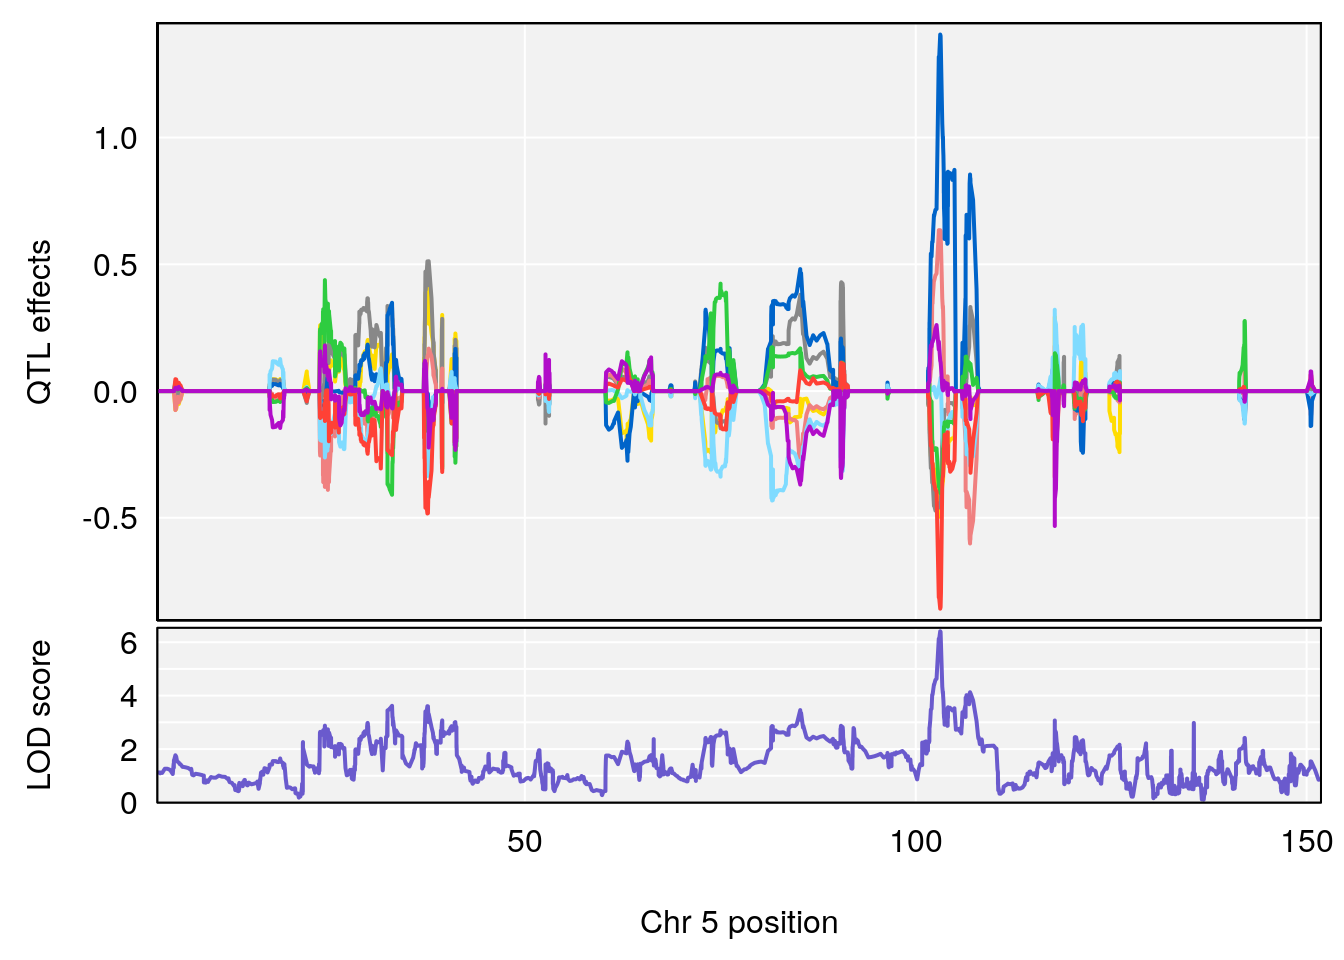
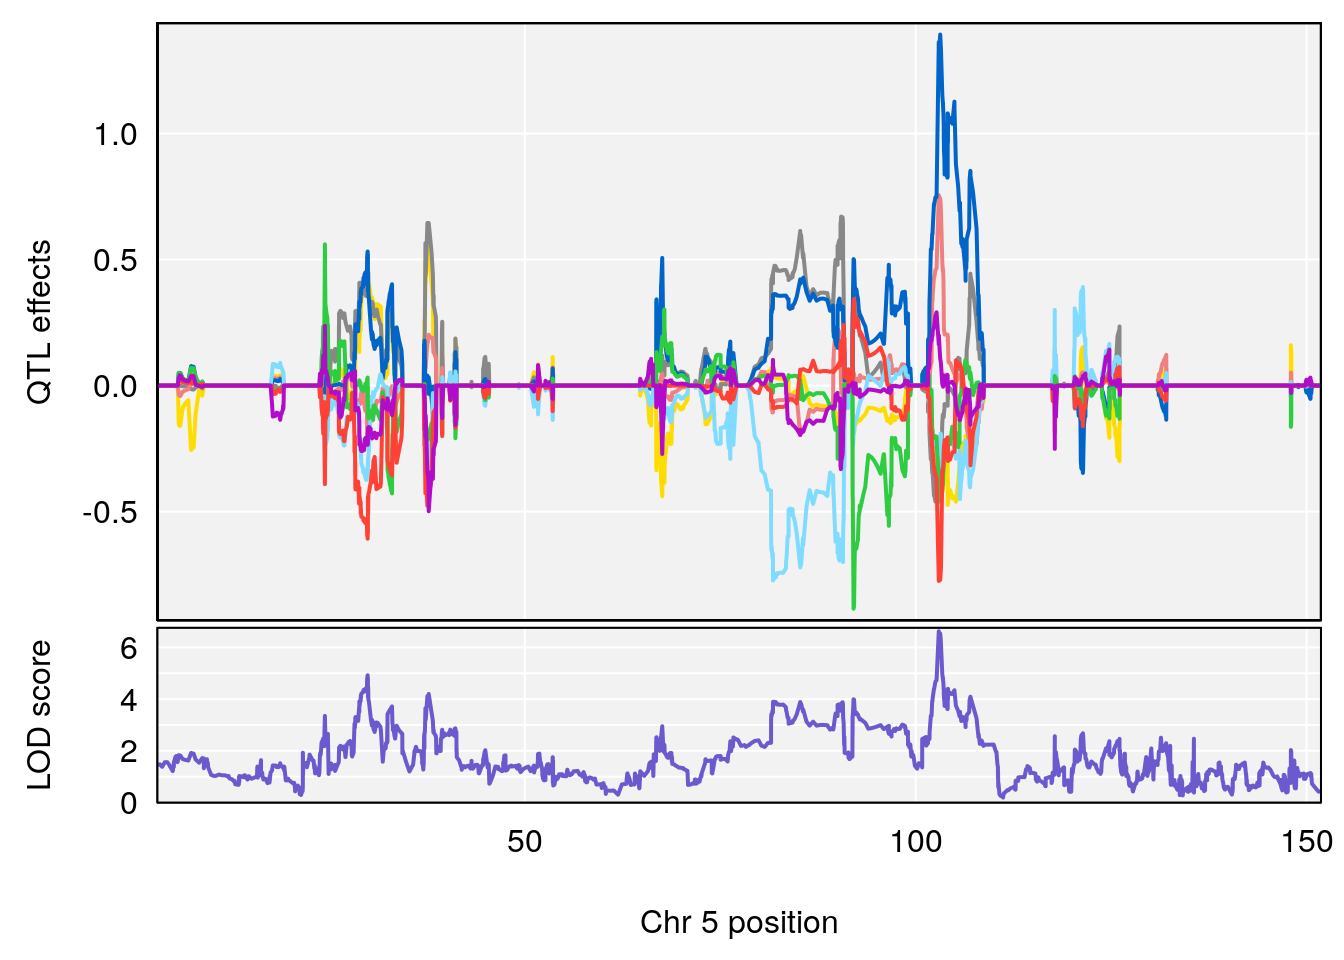
#peaks coeff plot
for(i in names(qtl.morphine.out)){
print(i)
peaks <- find_peaks(qtl.morphine.out[[i]], map=gm$pmap, threshold=6, drop=1.5)
print(peaks)
if(dim(peaks)[1] != 0){
for(p in 1:dim(peaks)[1]) {
print(p)
chr <-peaks[p,3]
#coeff plot
par(mar=c(4.1, 4.1, 0.6, 0.6))
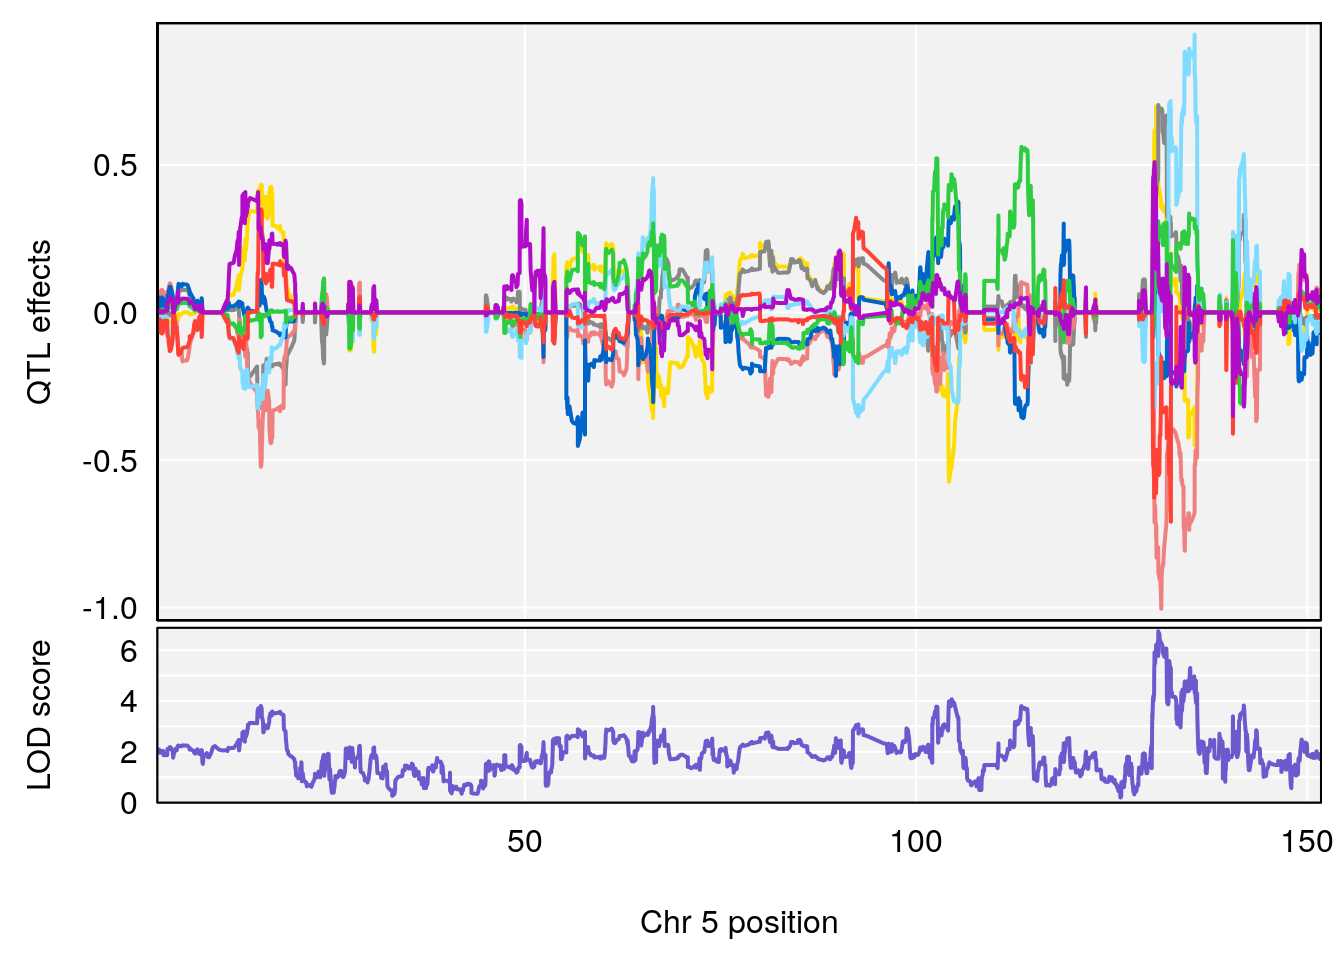
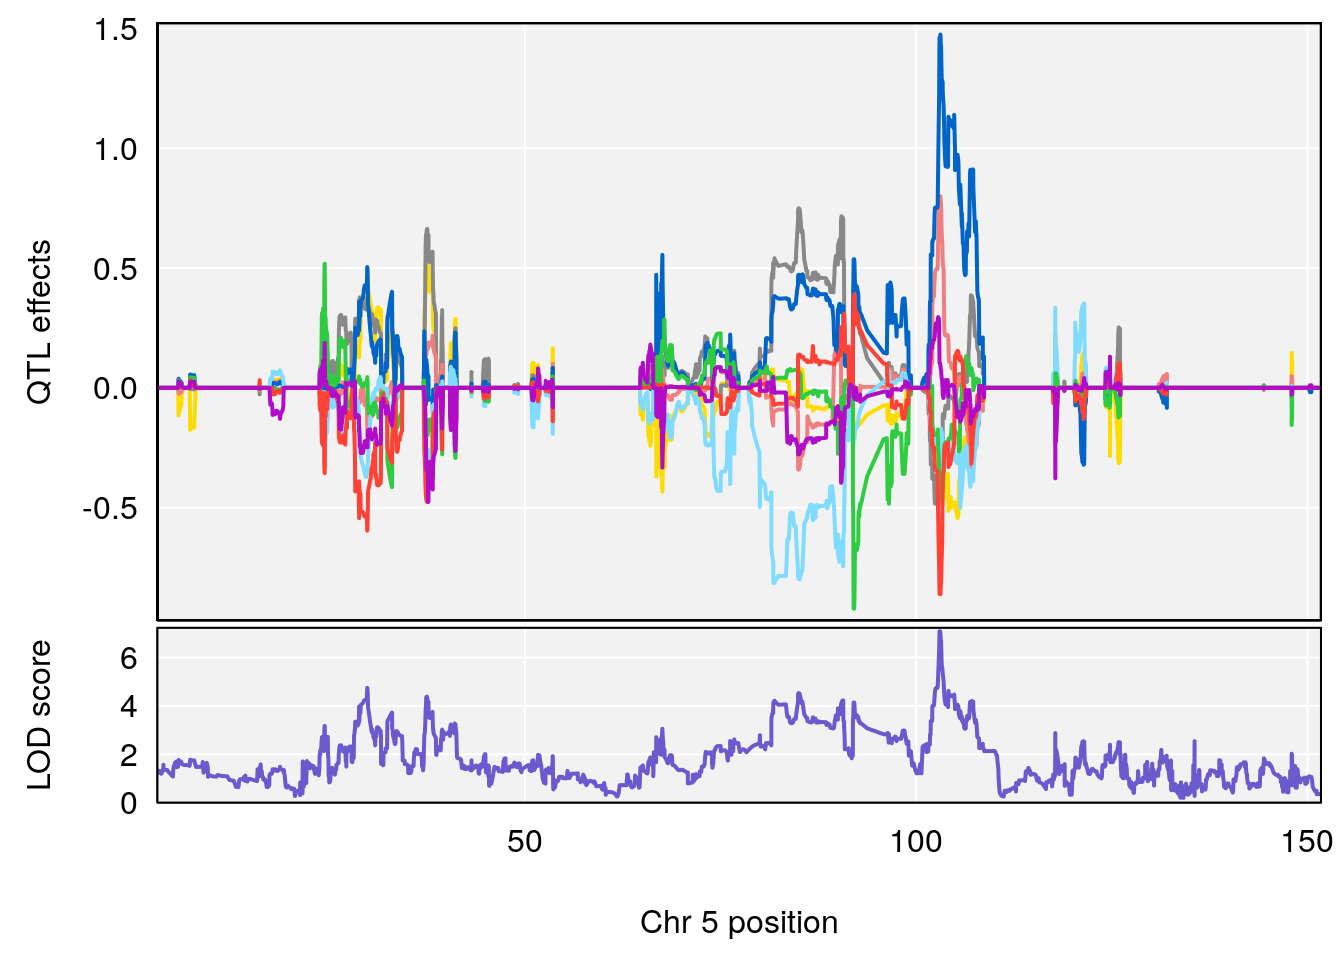
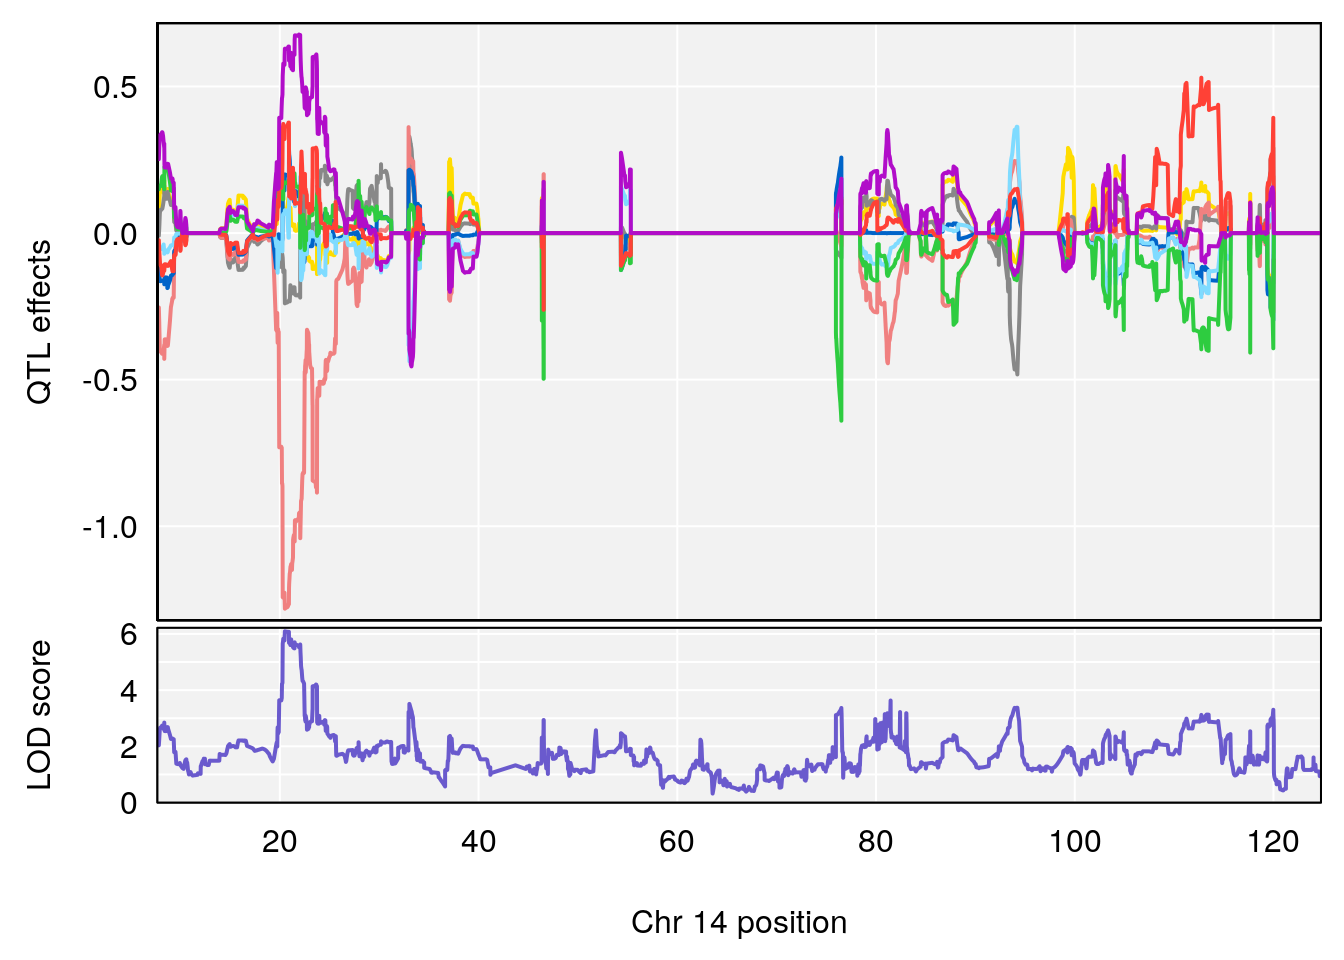
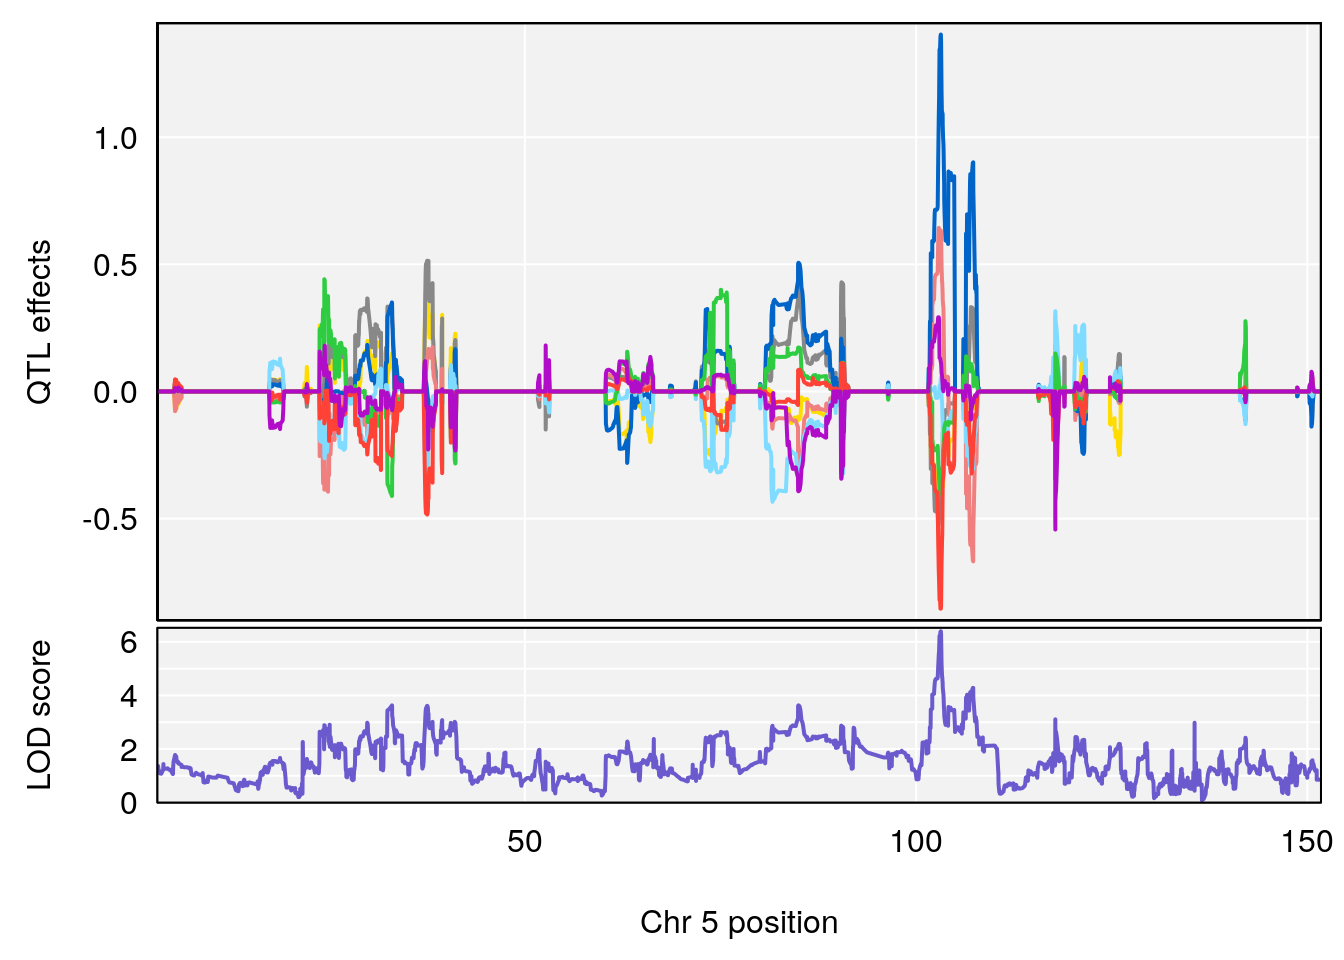
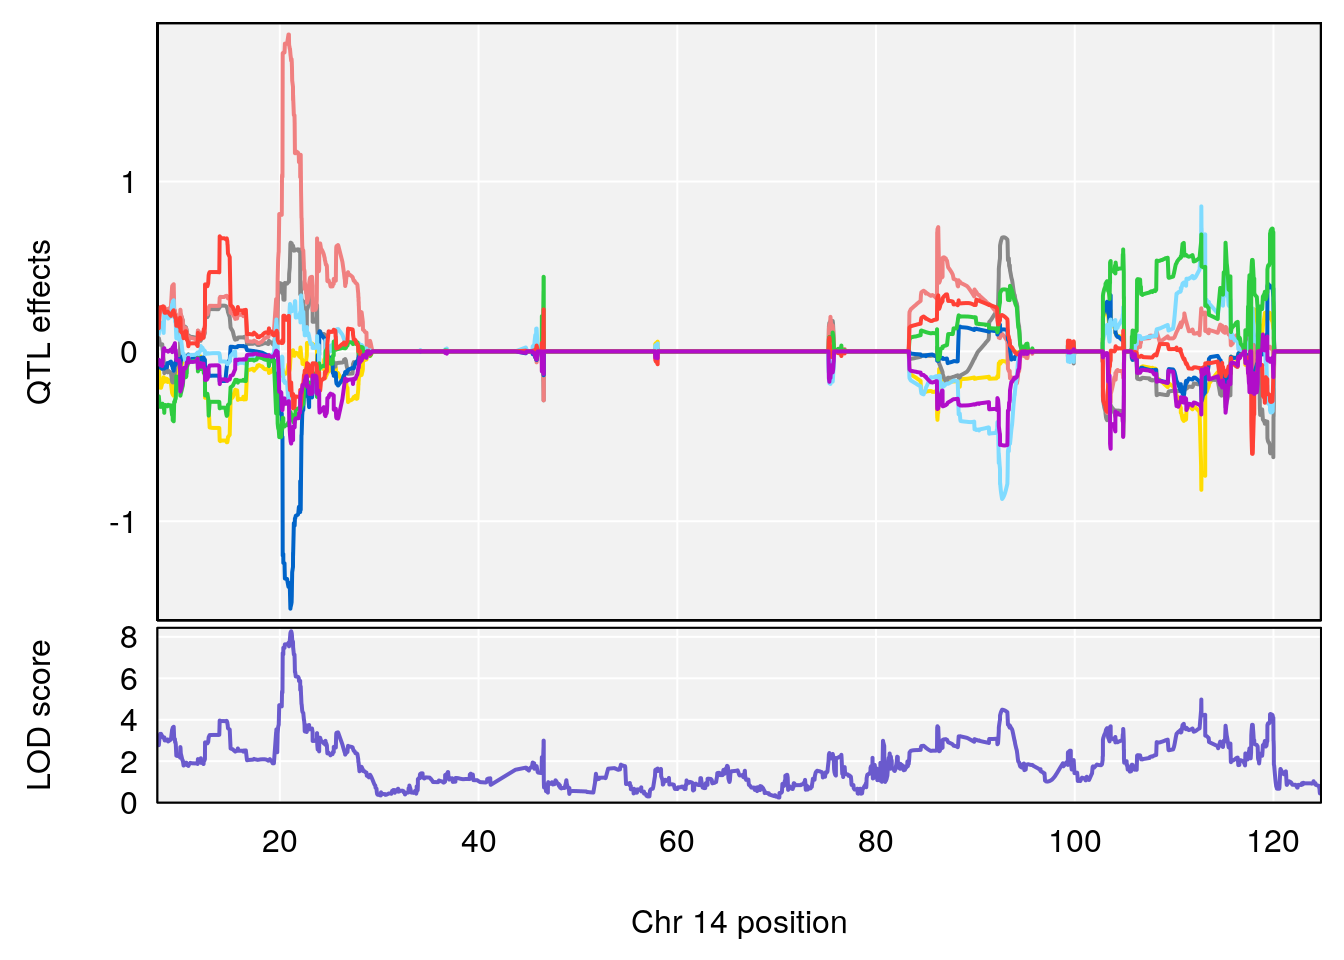
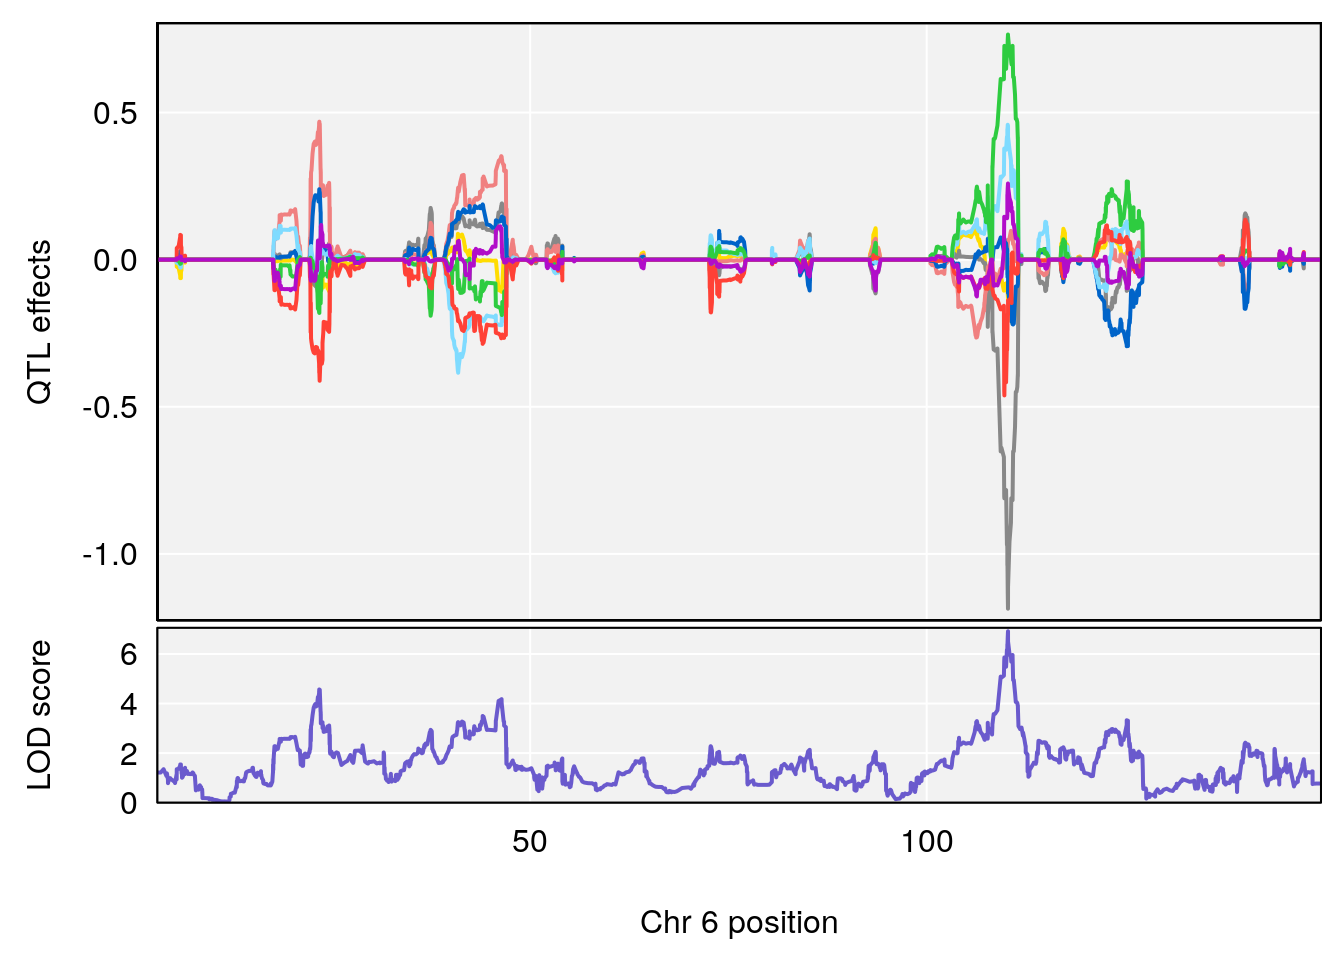
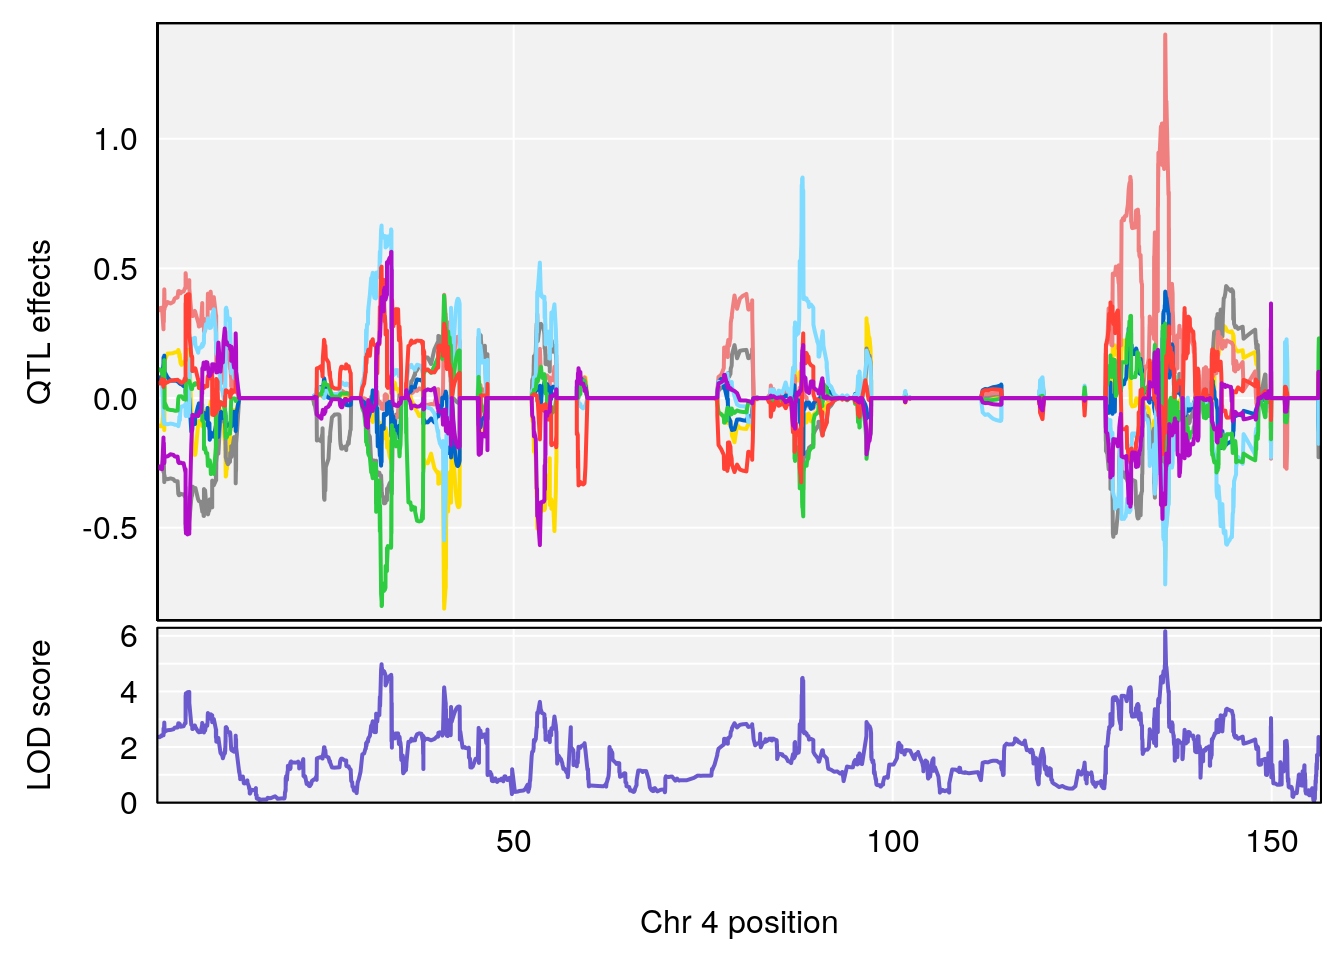
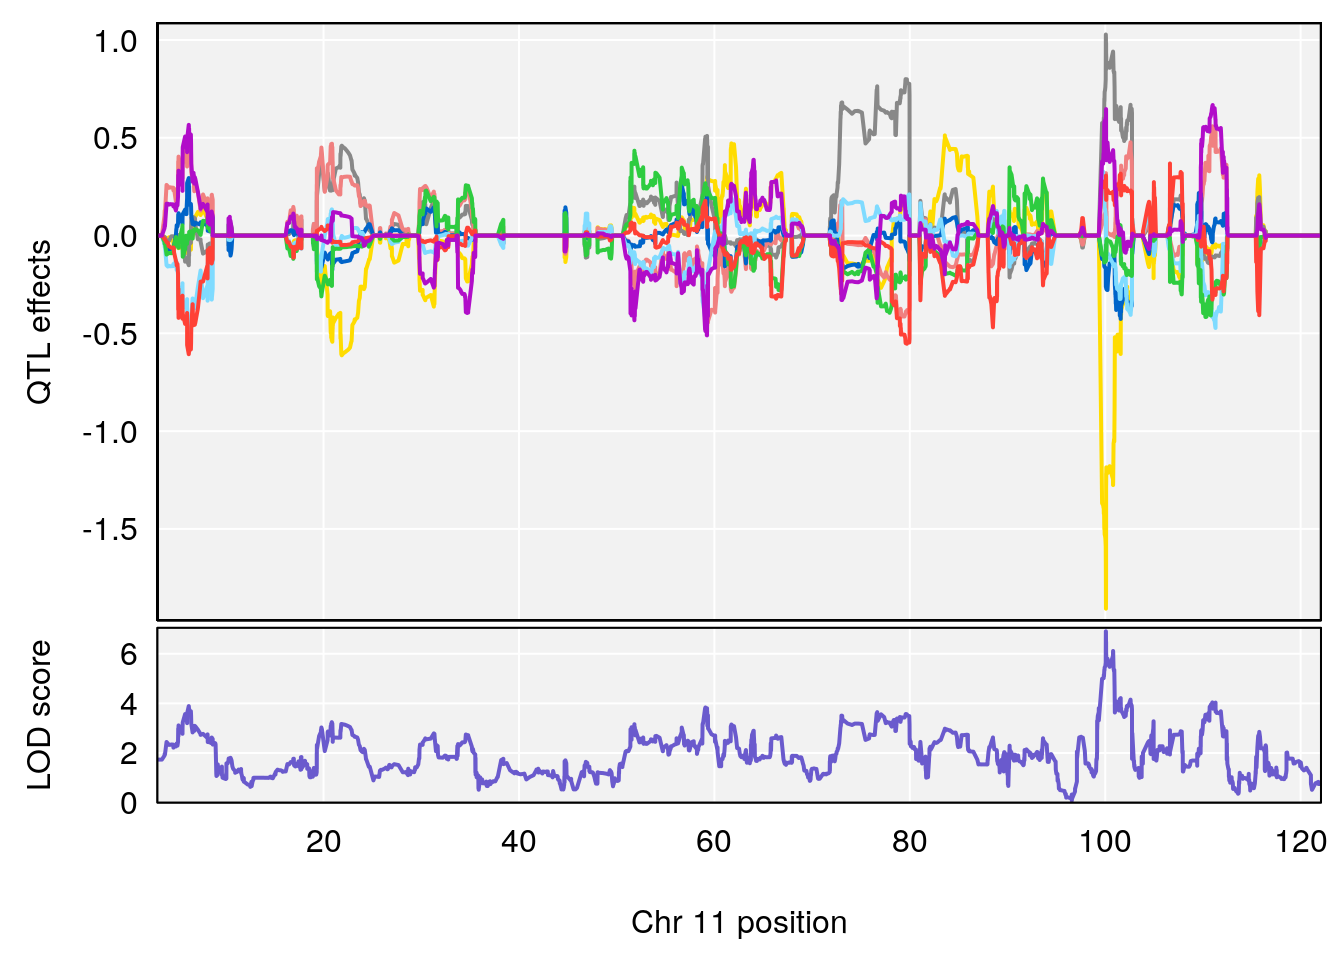
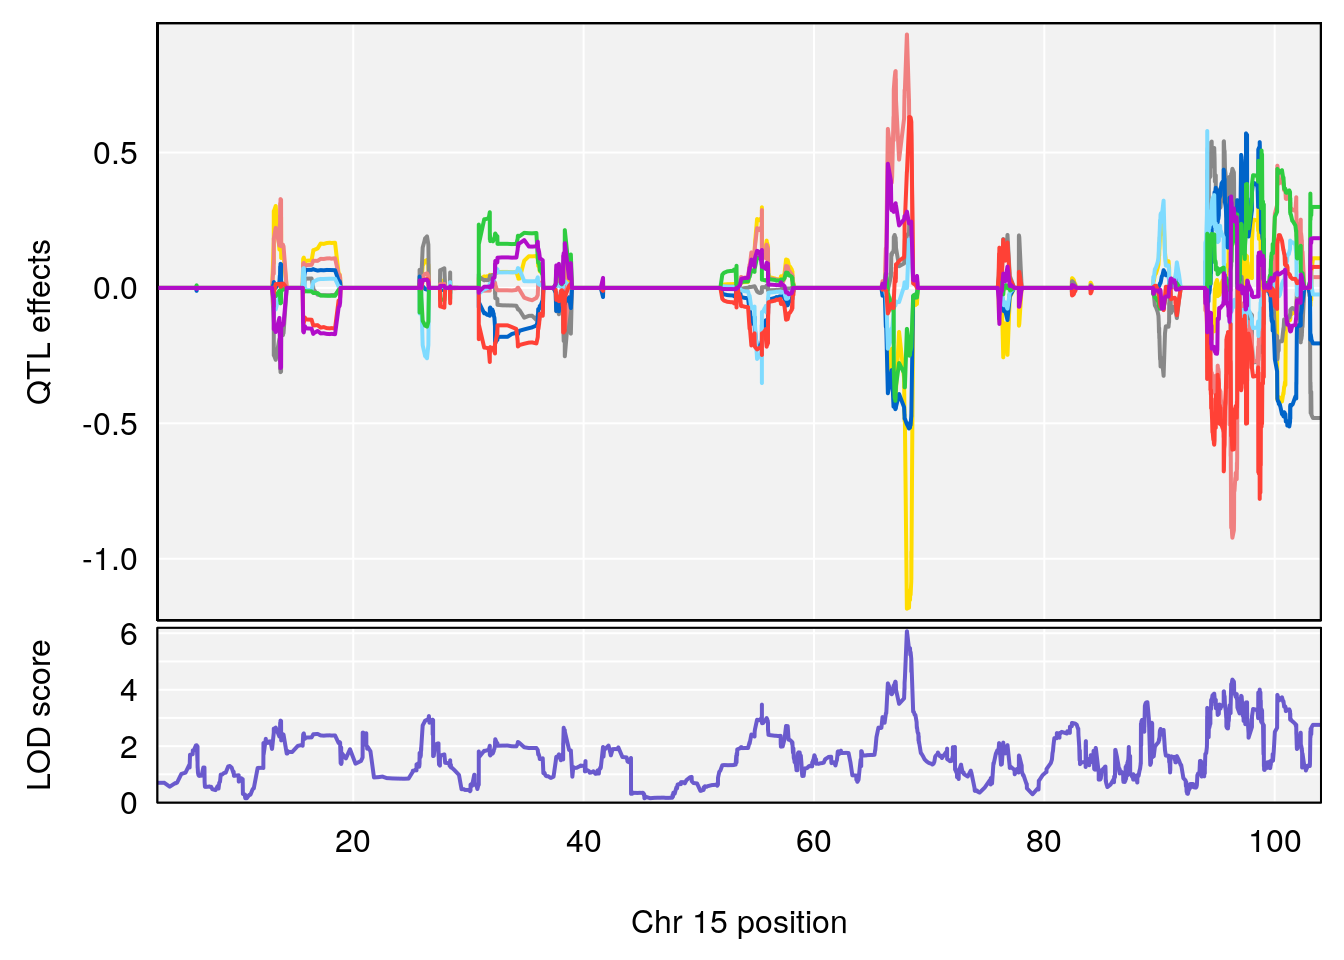
plot_coefCC(coef_c1[[i]][[p]], gm$pmap[chr], scan1_output=qtl.morphine.out[[i]], bgcolor="gray95", legend=NULL)
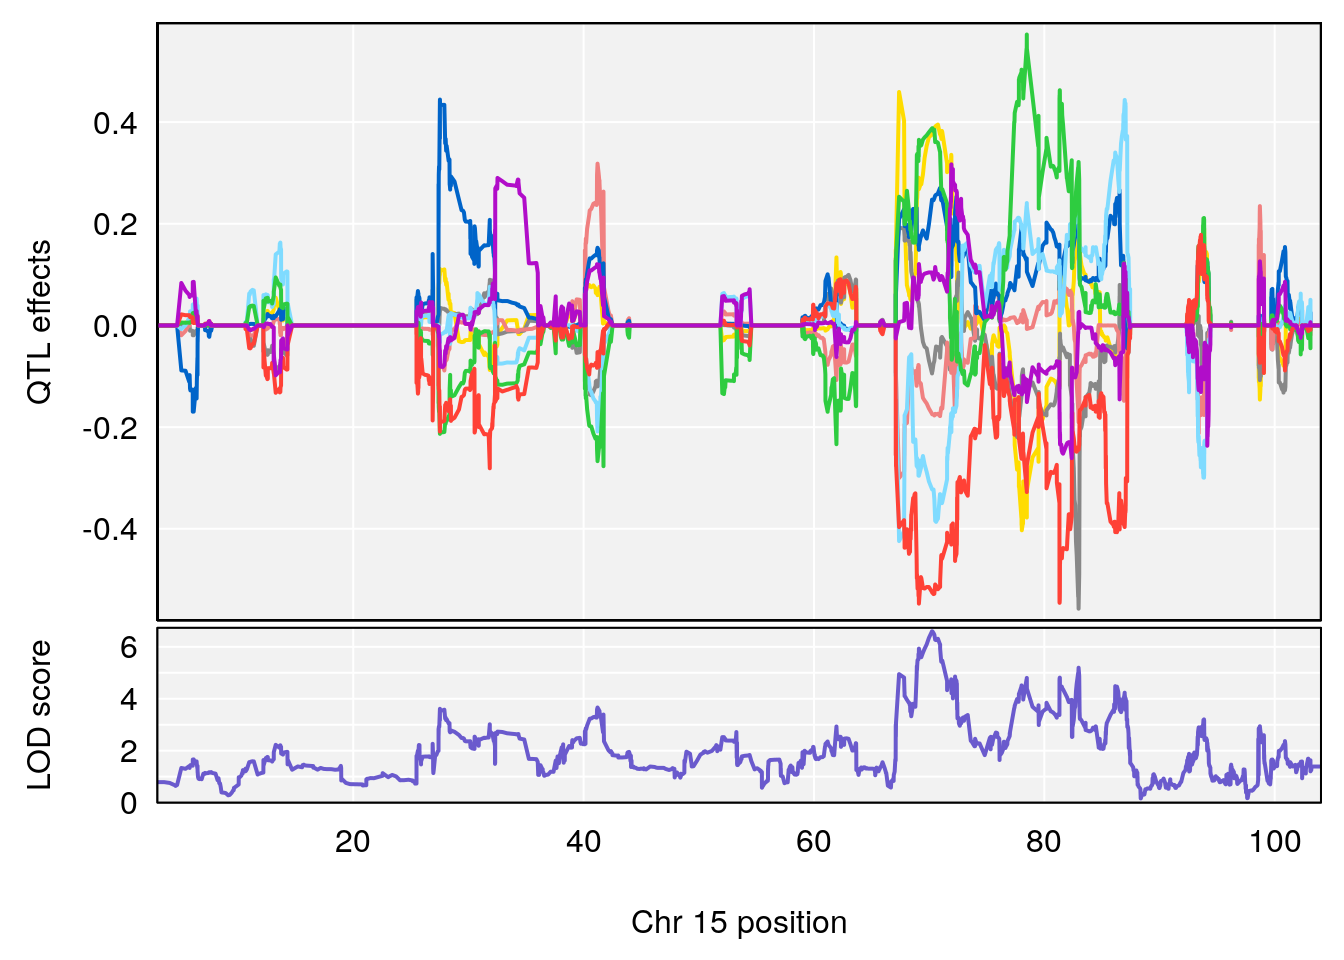
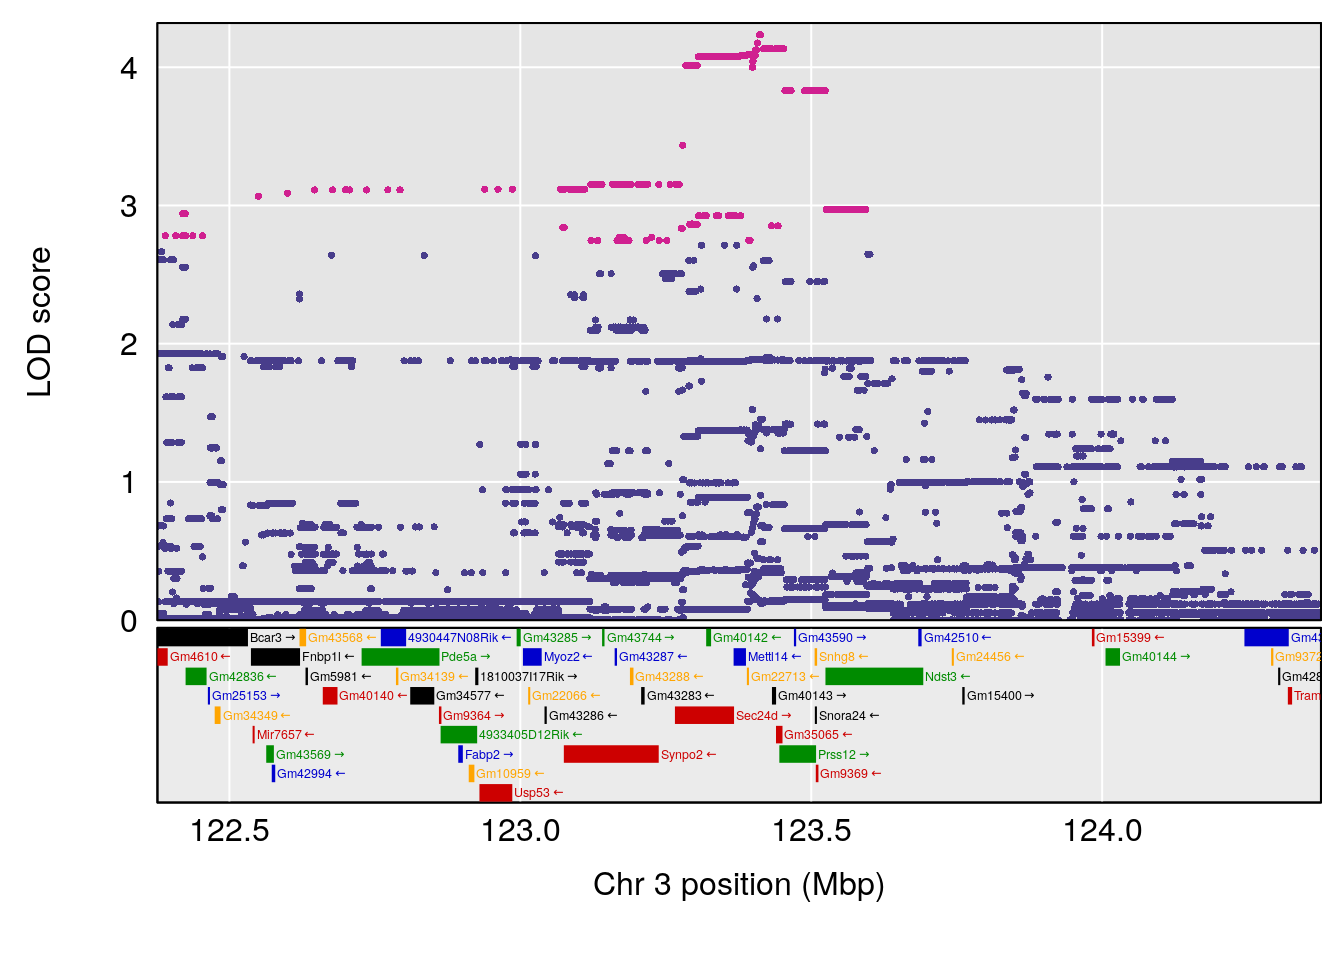
plot_coefCC(coef_c2[[i]][[p]], gm$pmap[chr], scan1_output=qtl.morphine.out[[i]], bgcolor="gray95", legend=NULL)
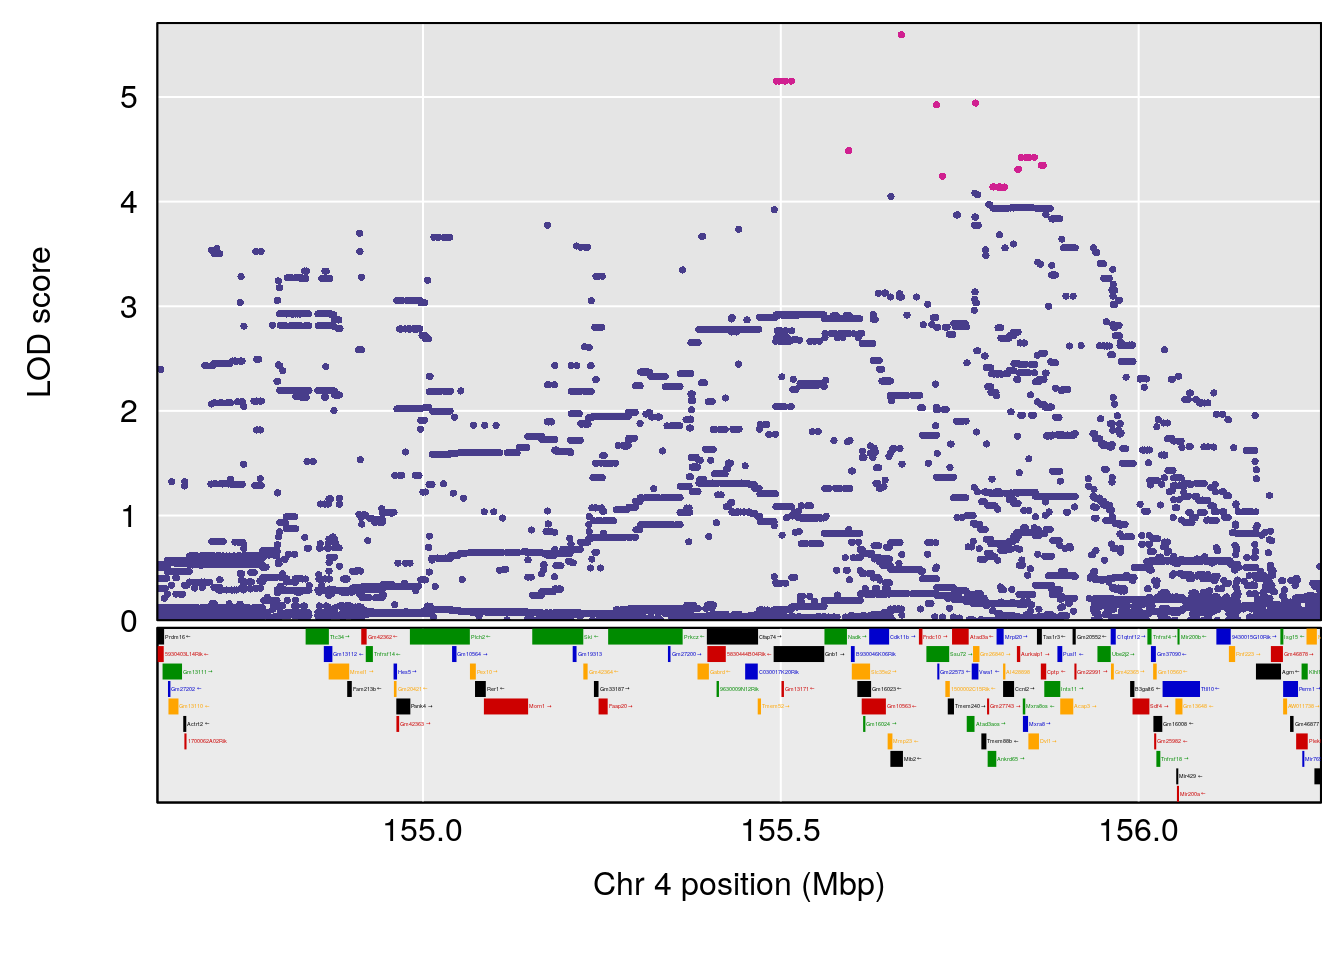
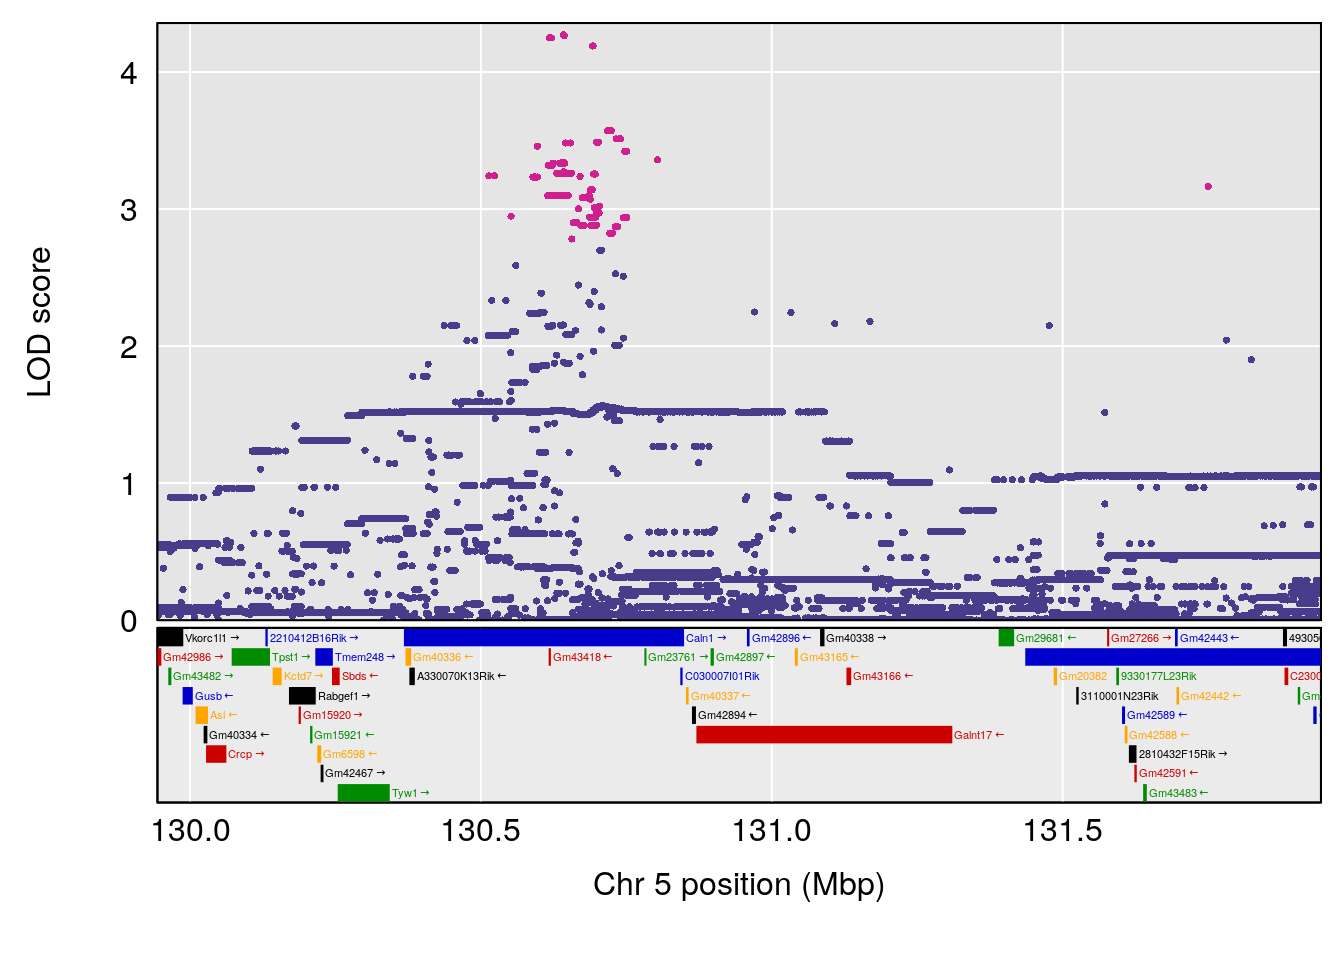
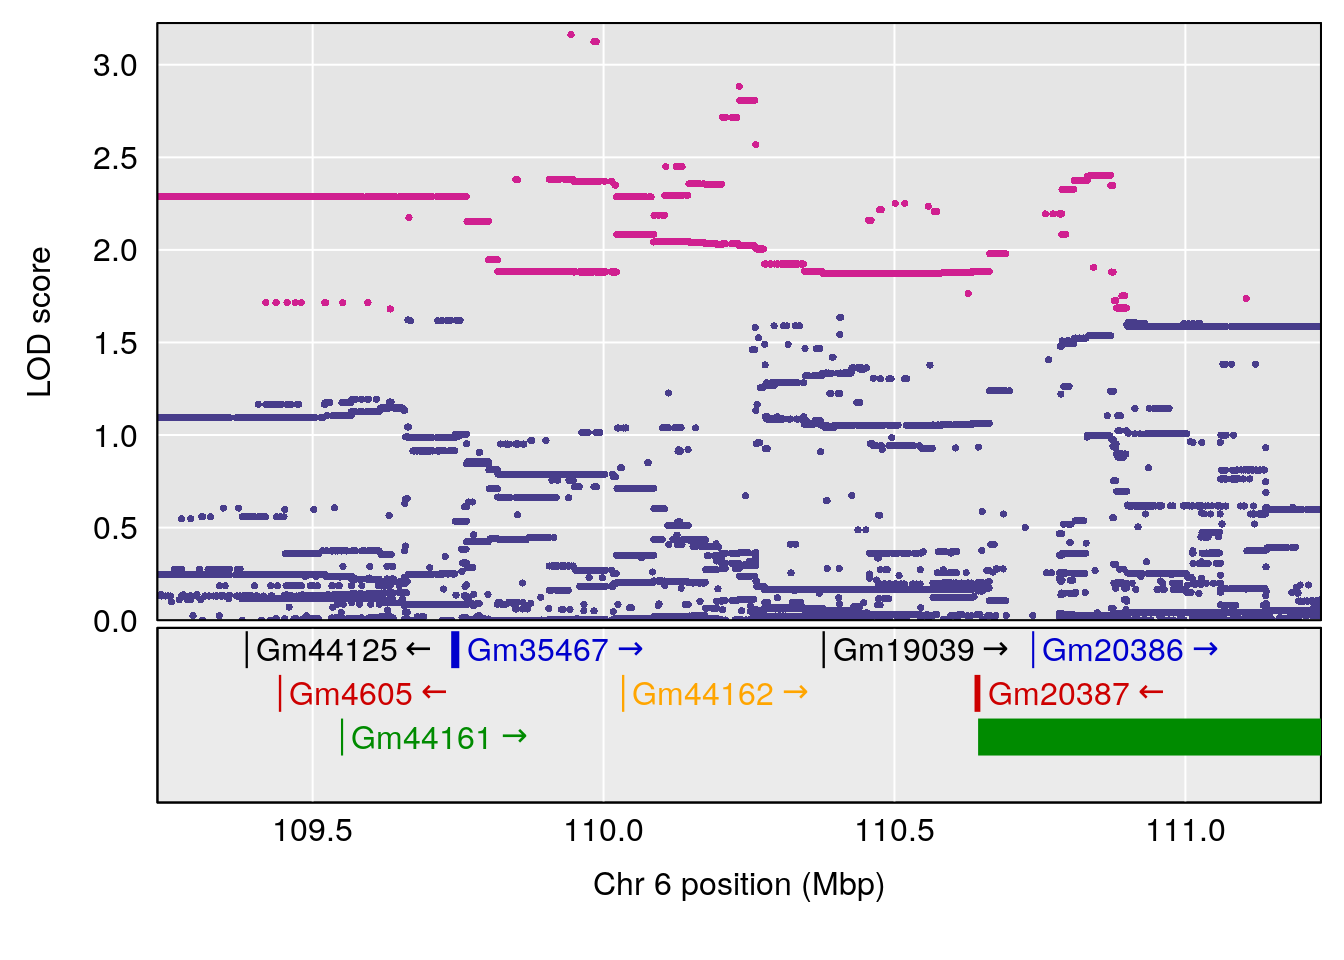
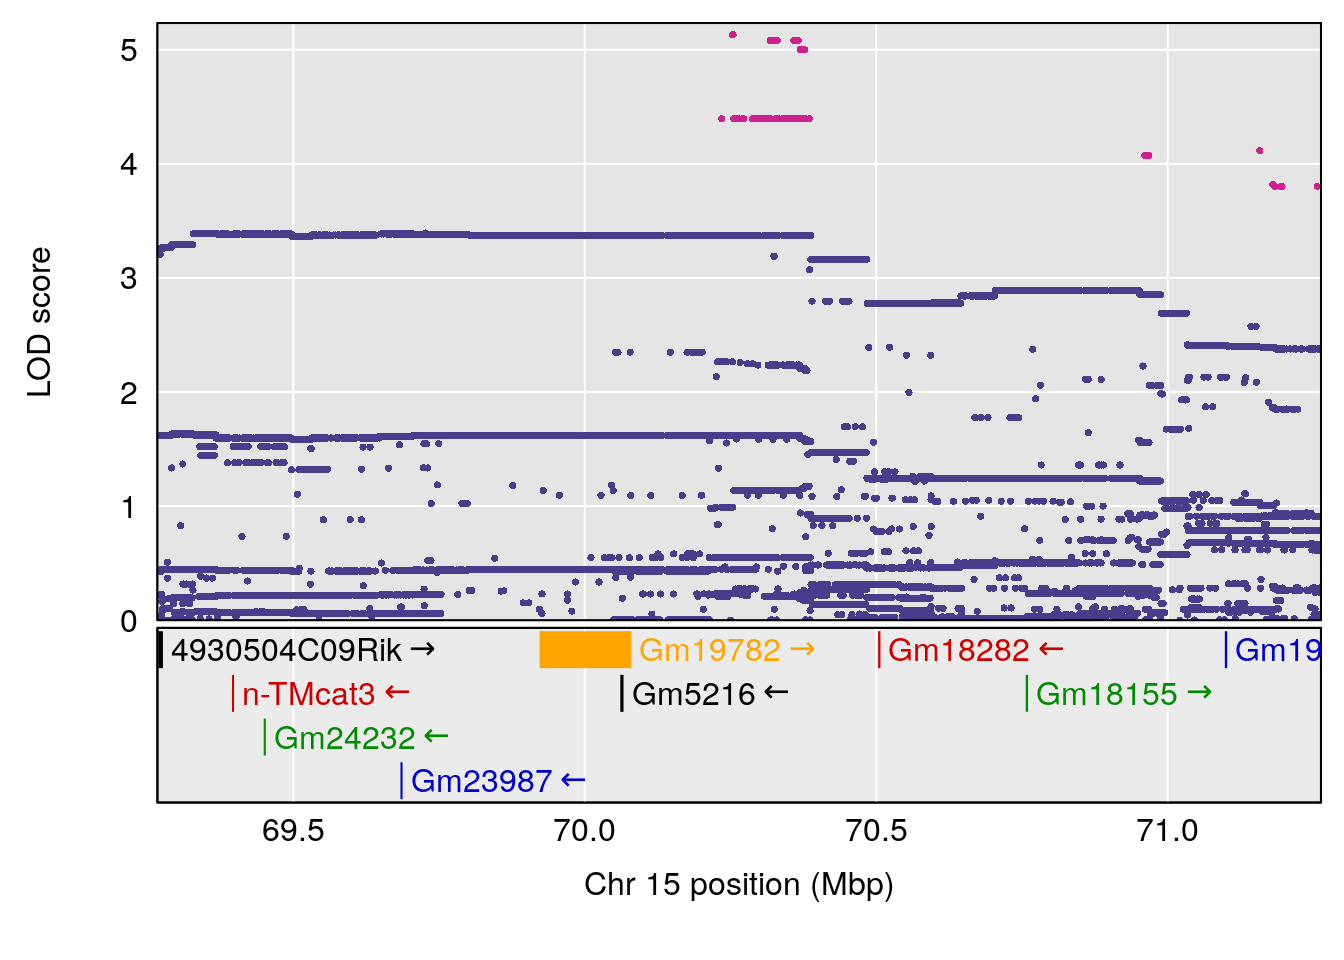
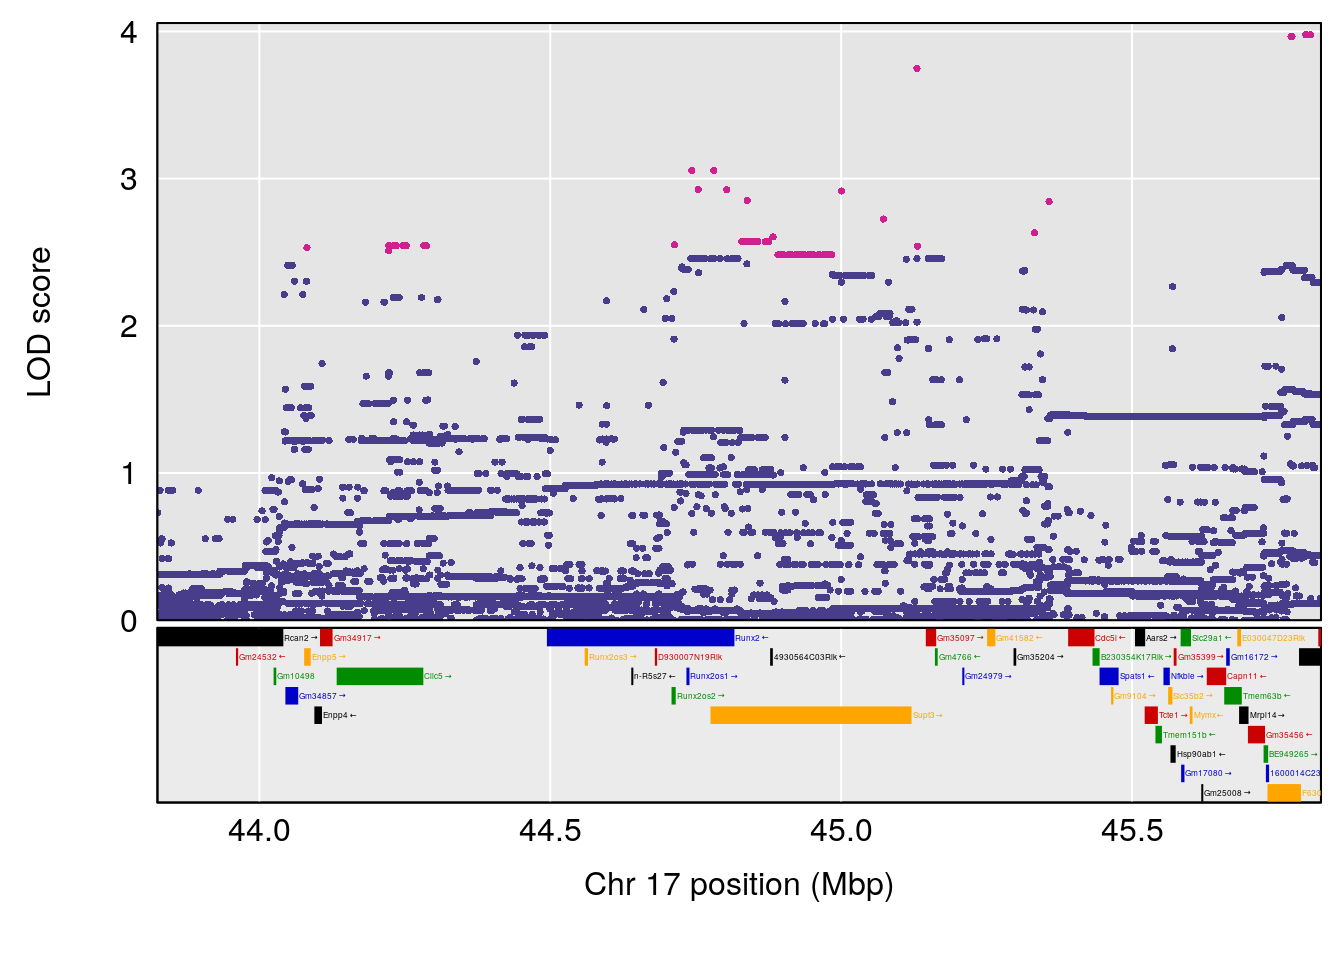
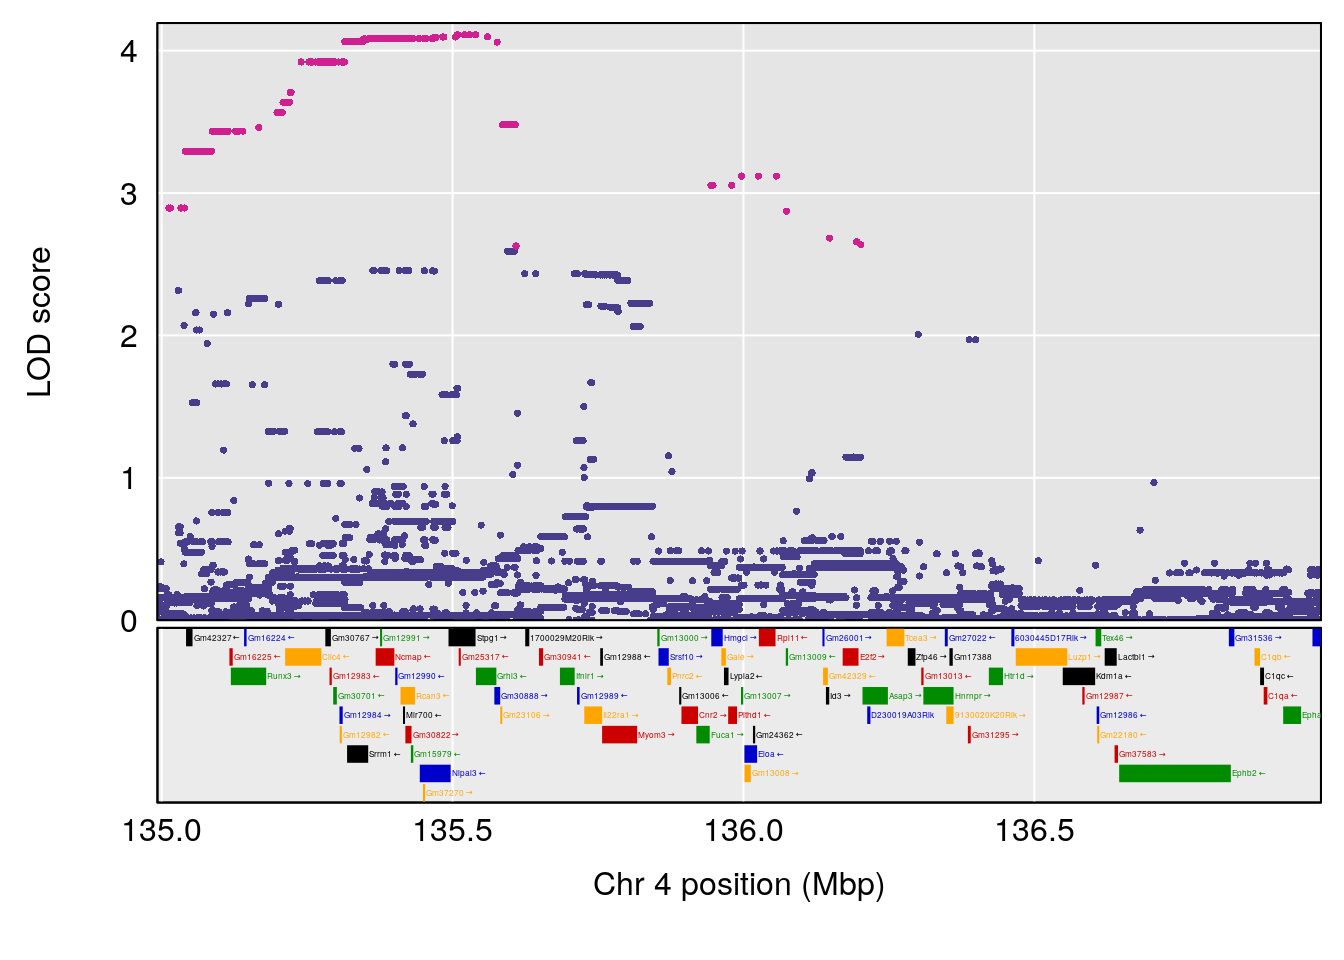
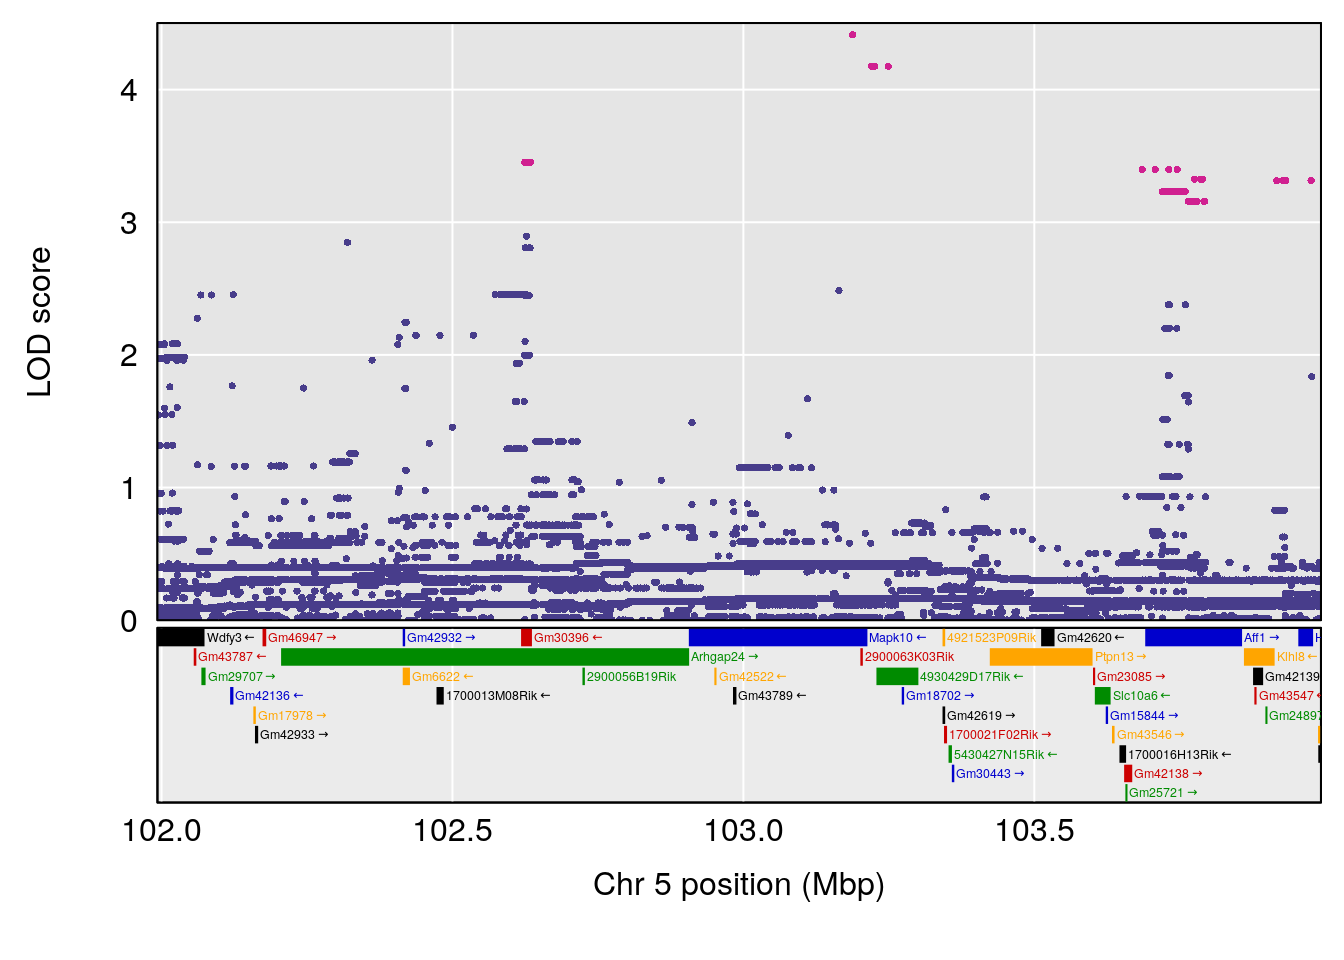
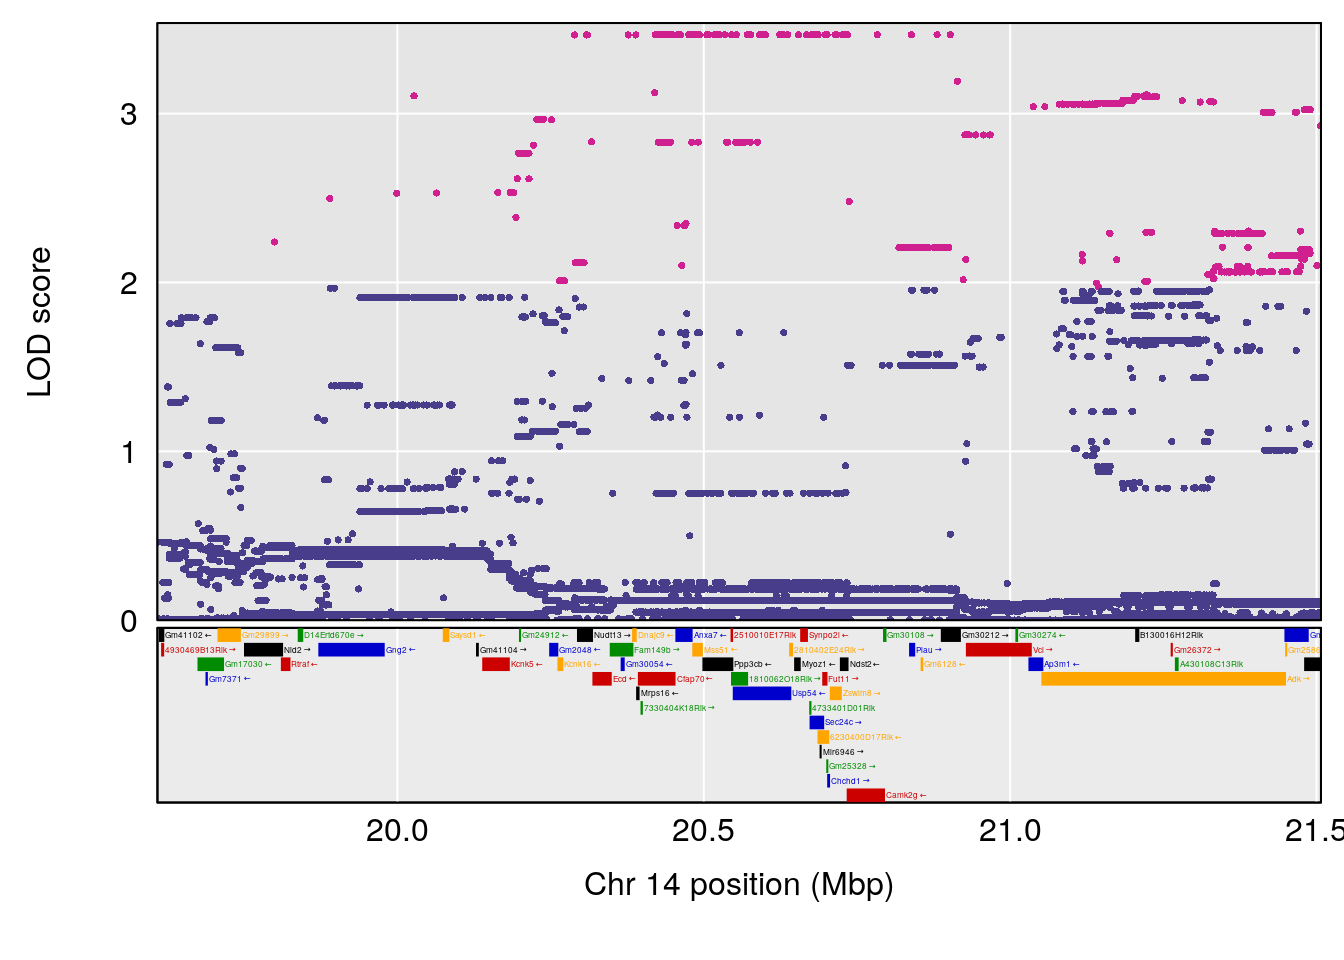
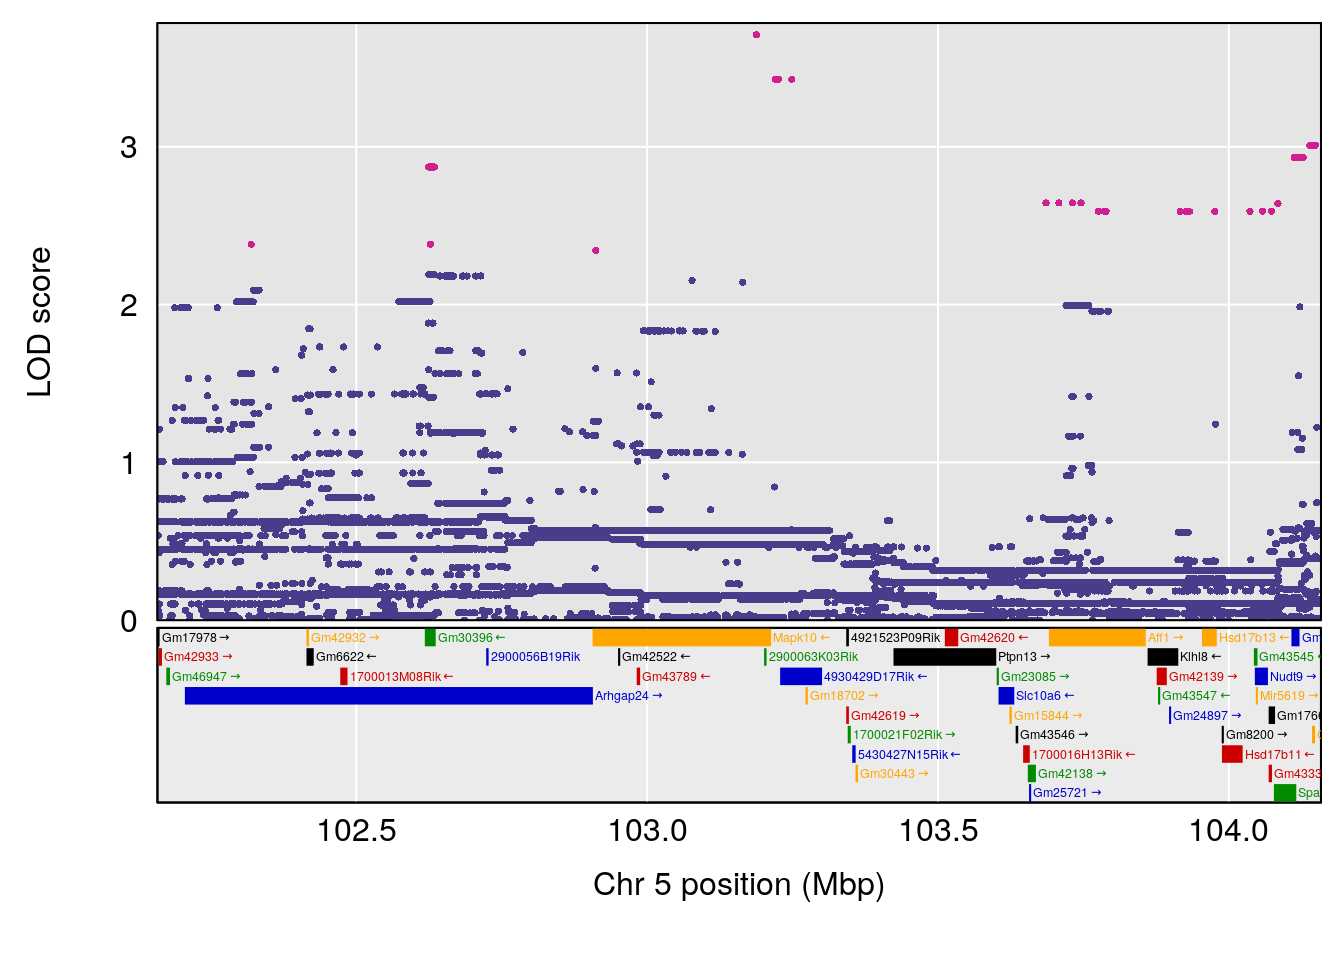
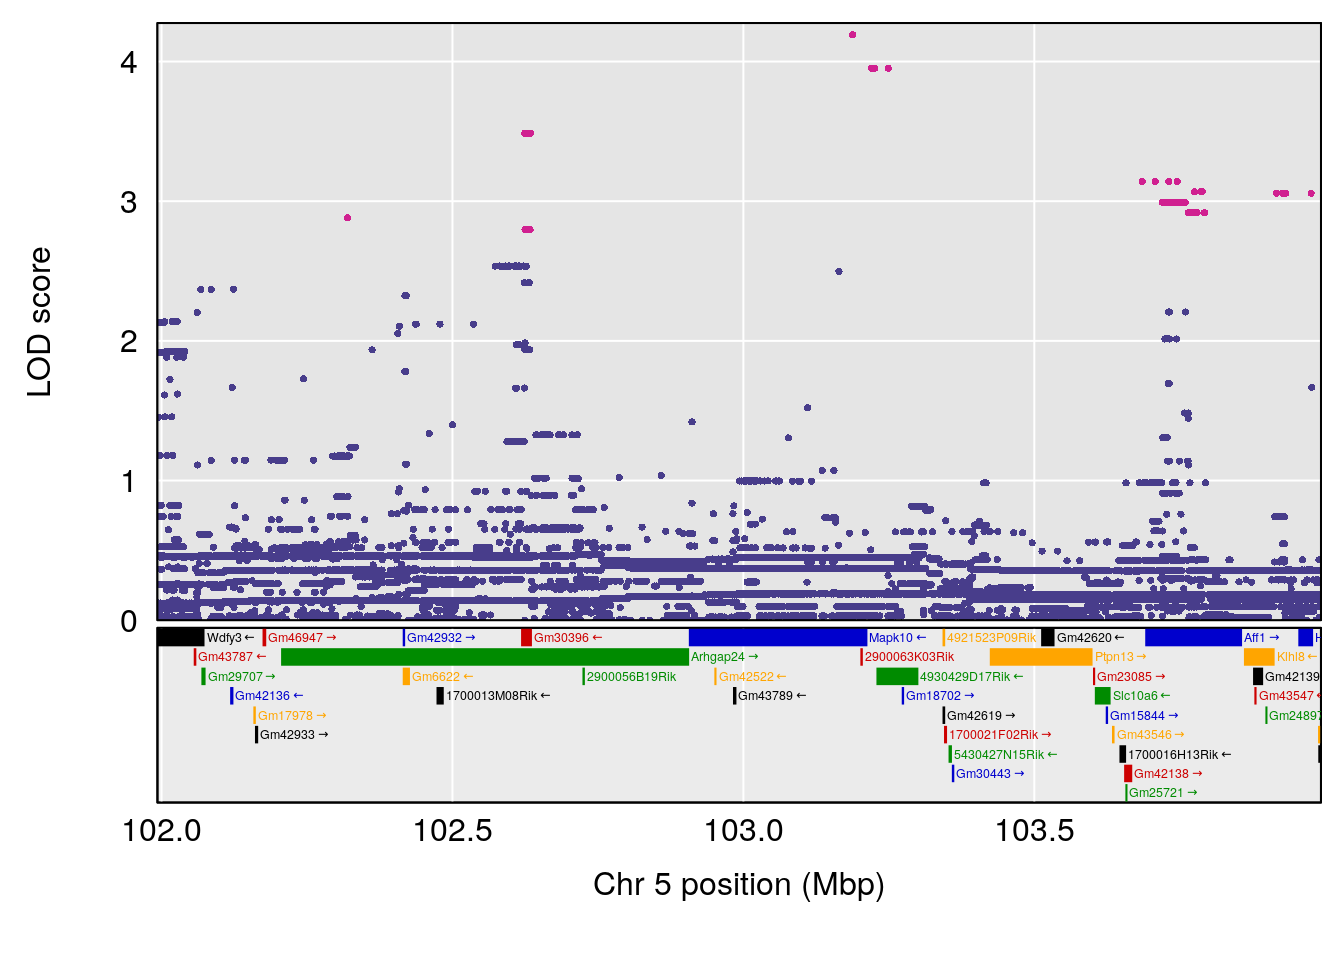
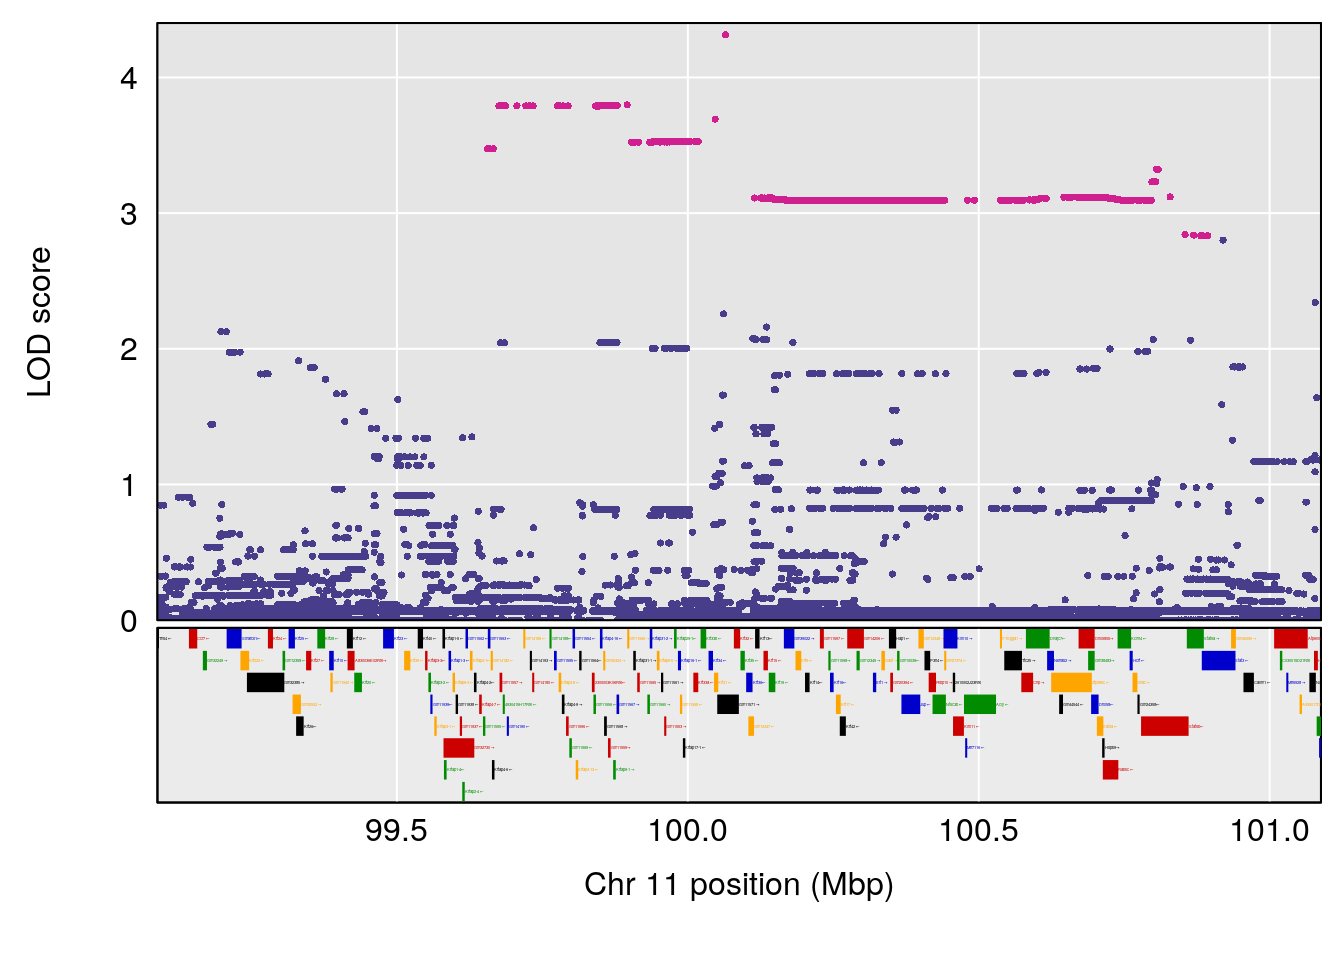
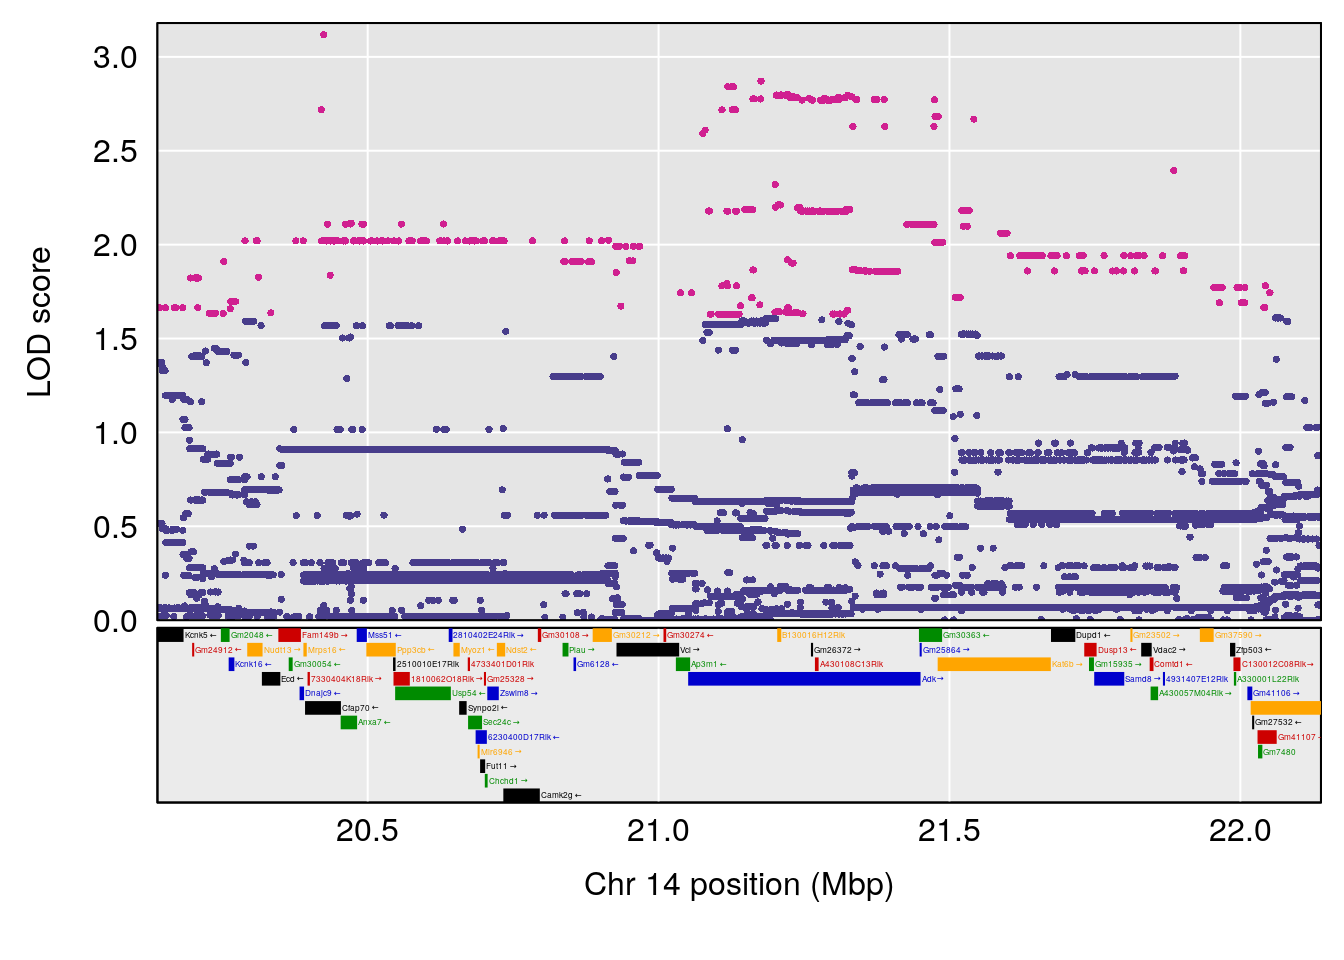
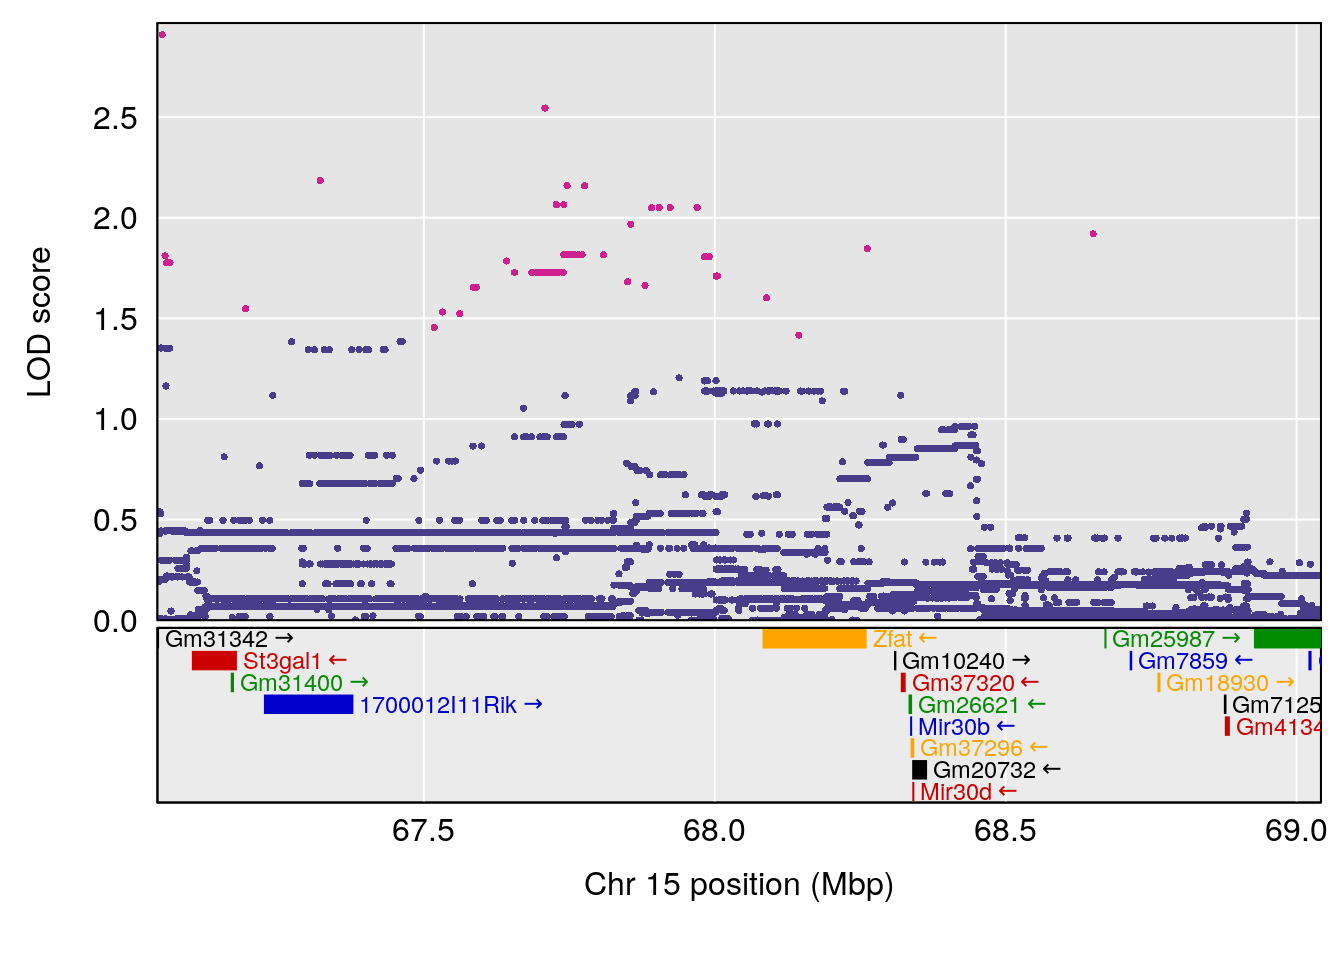
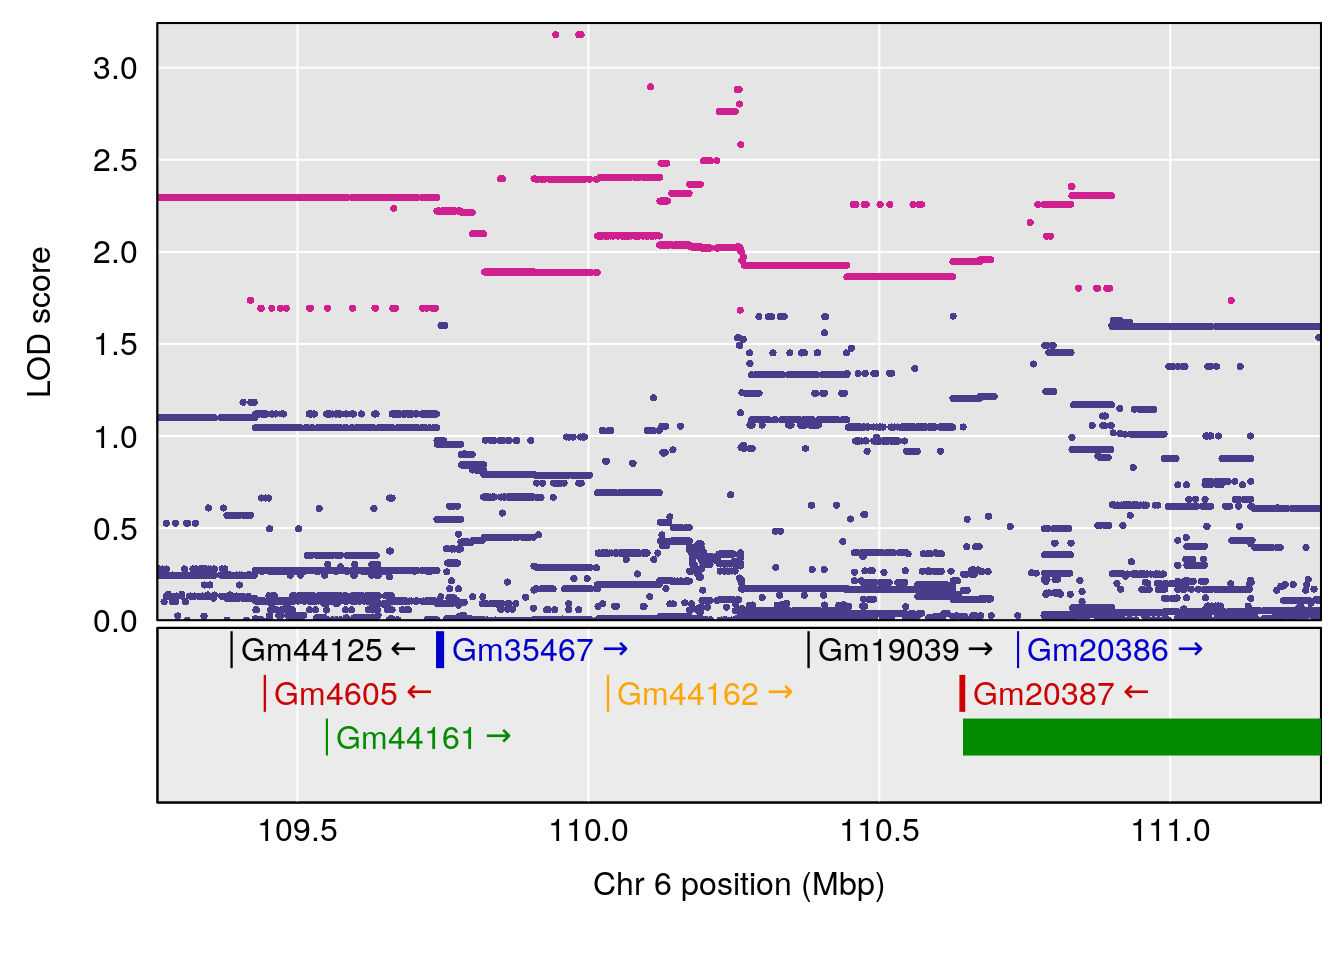
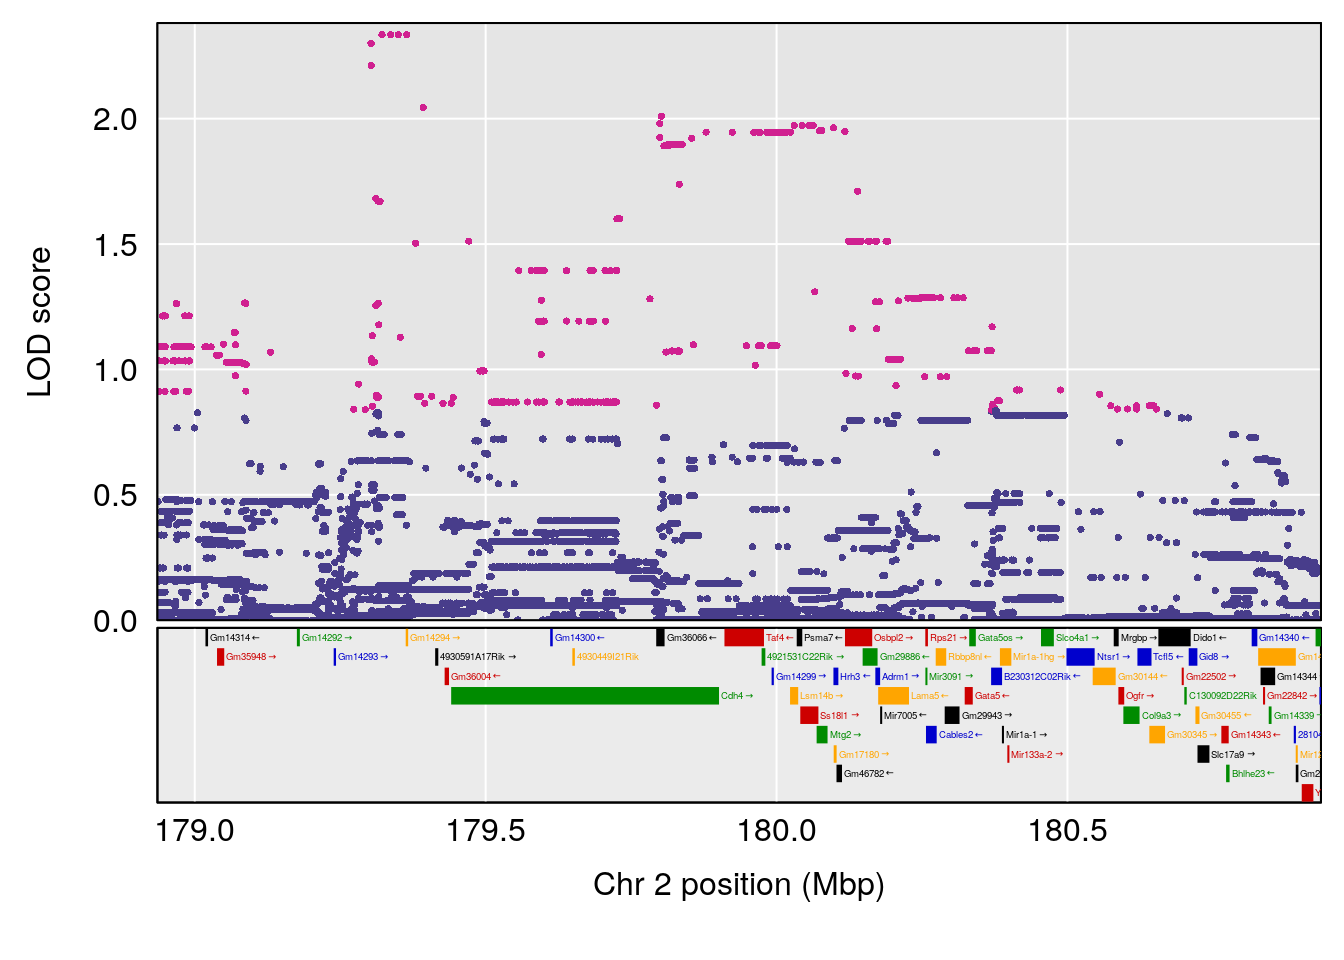
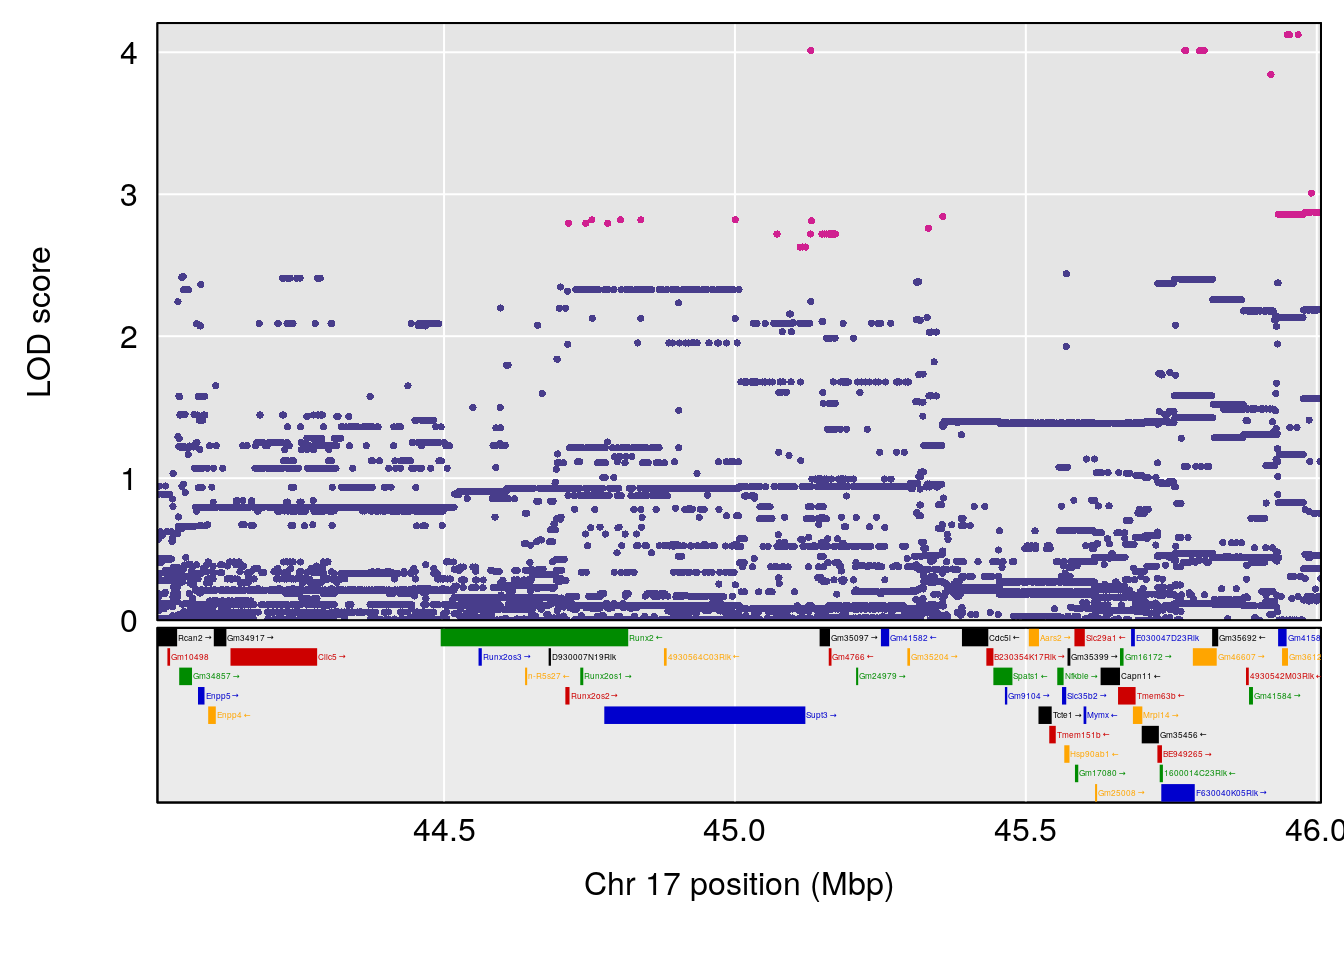
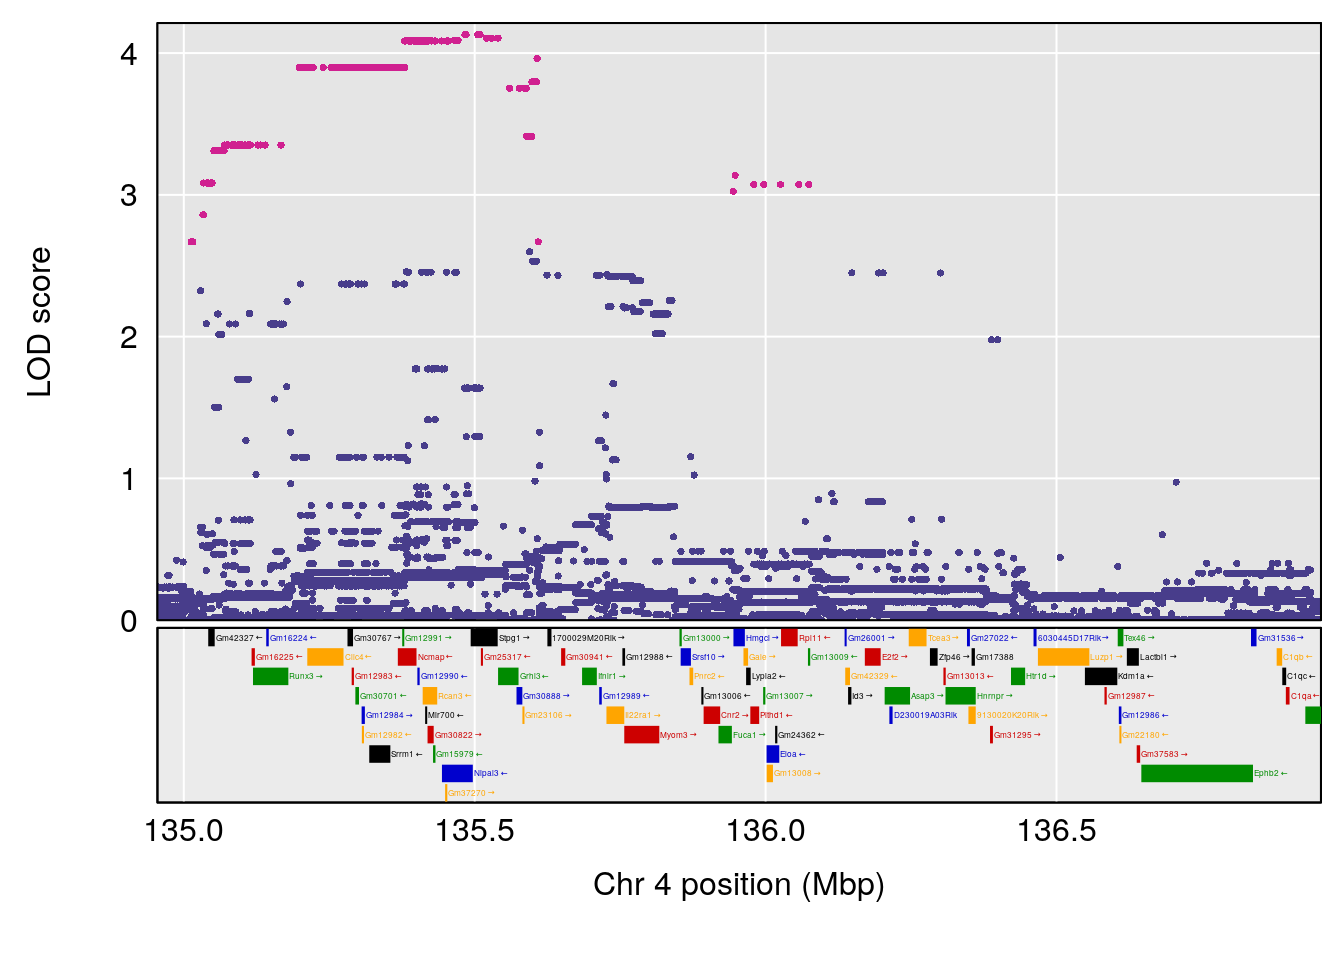
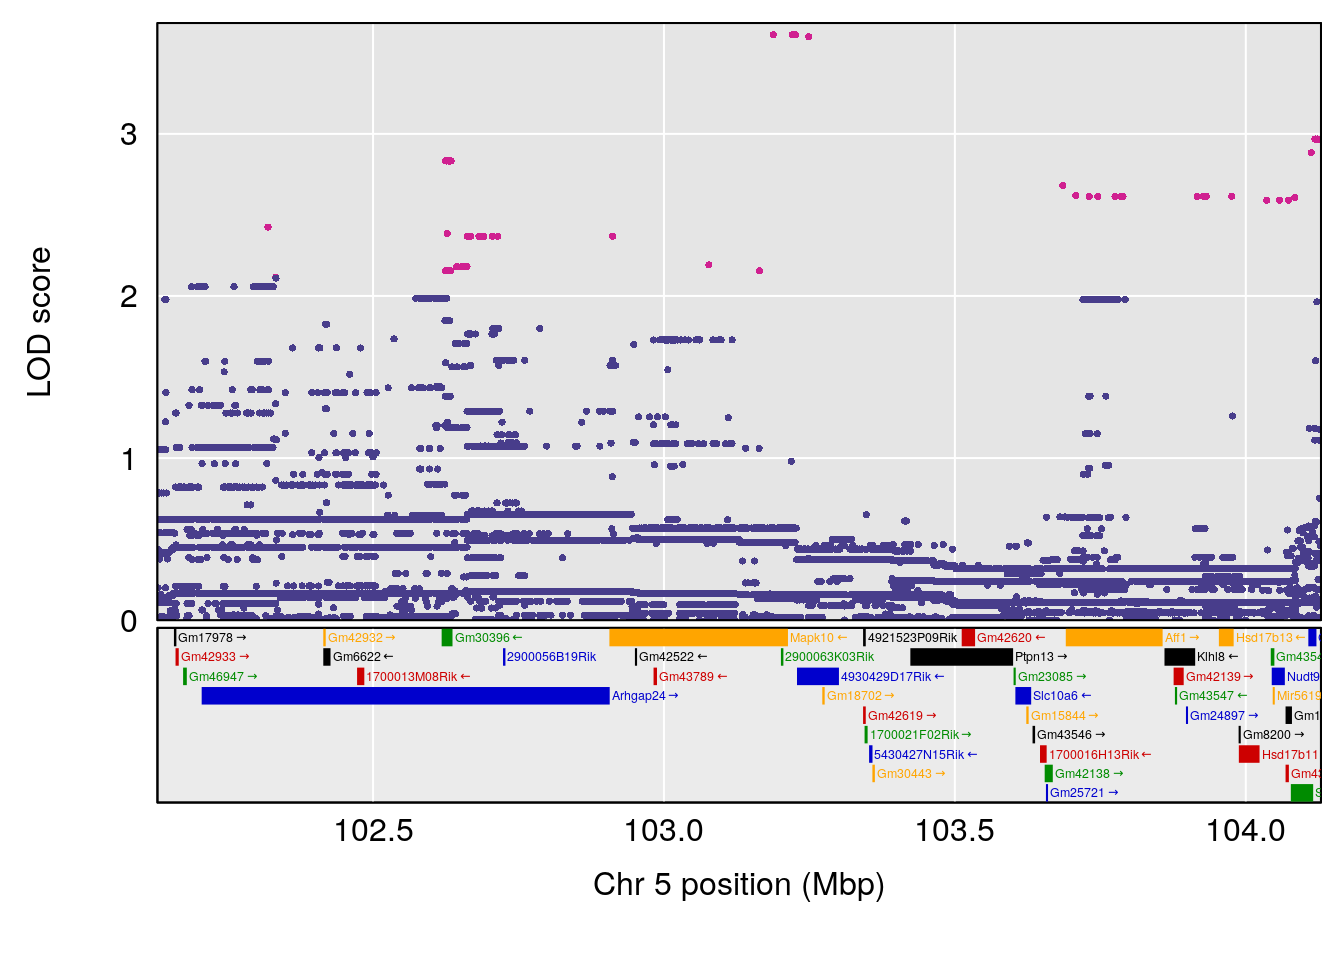
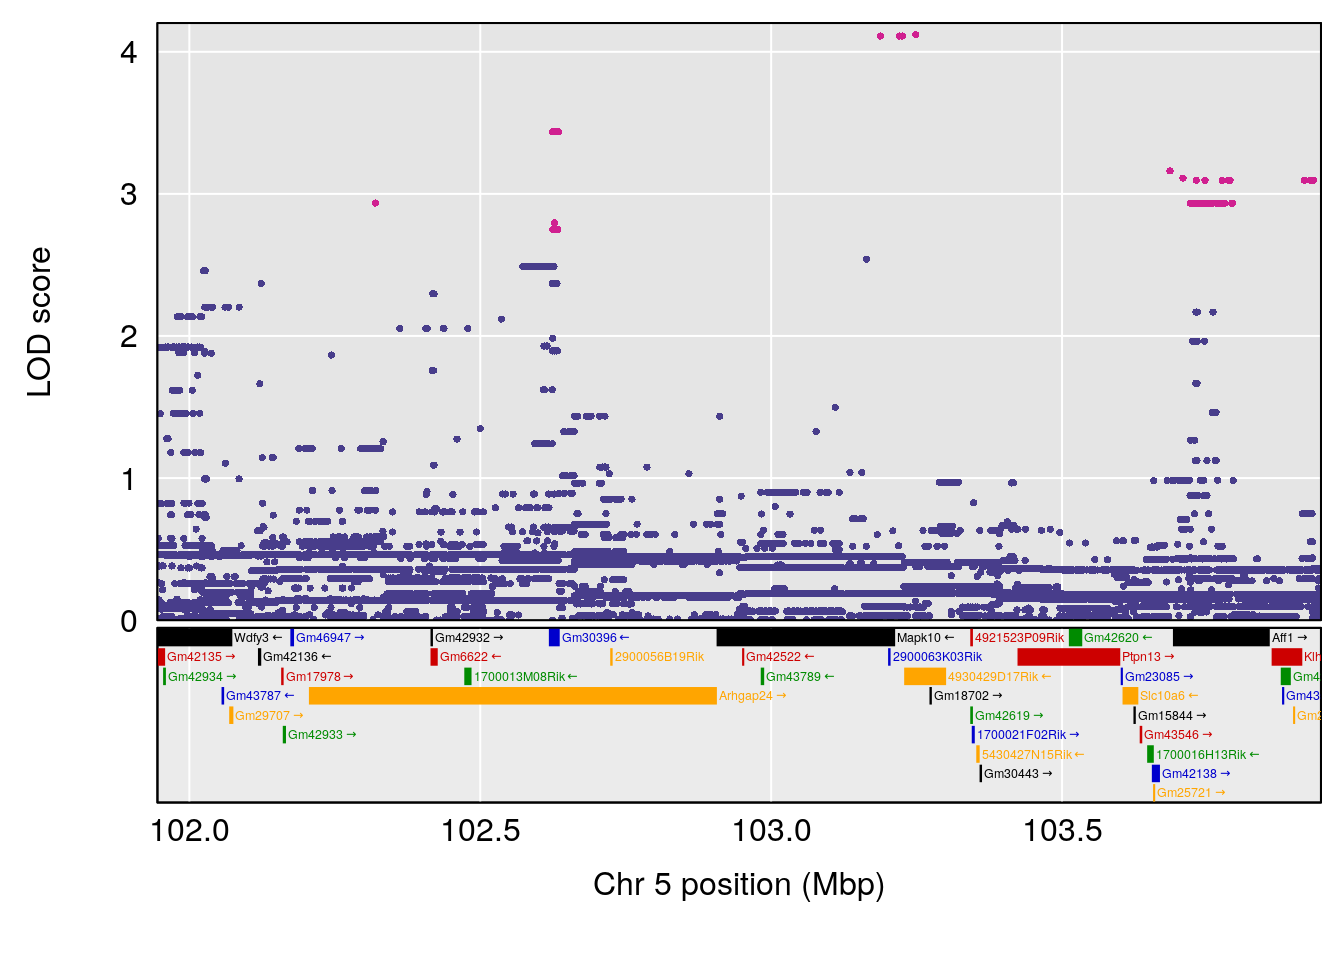
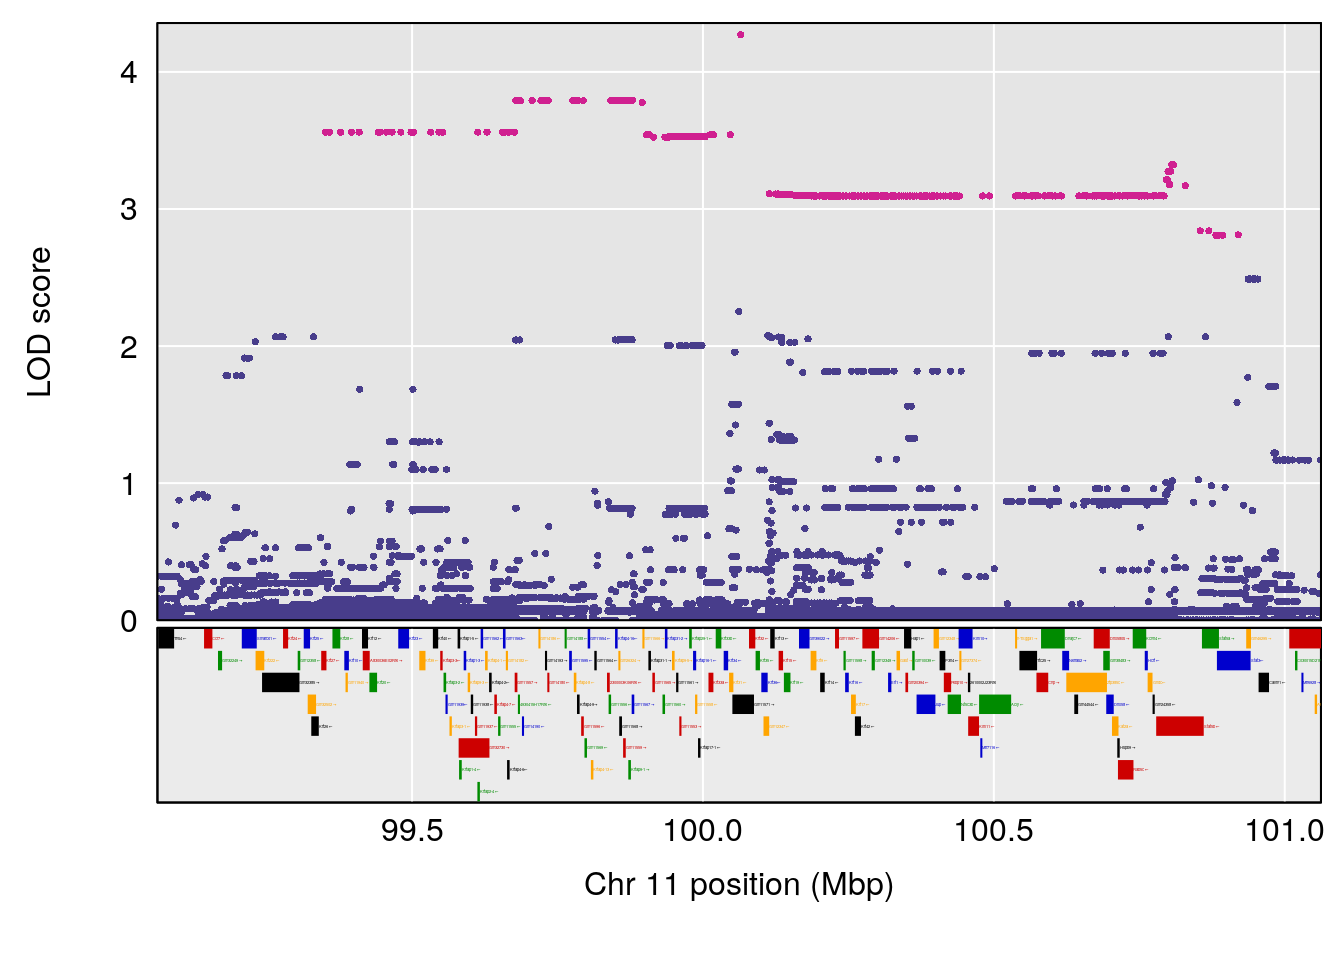
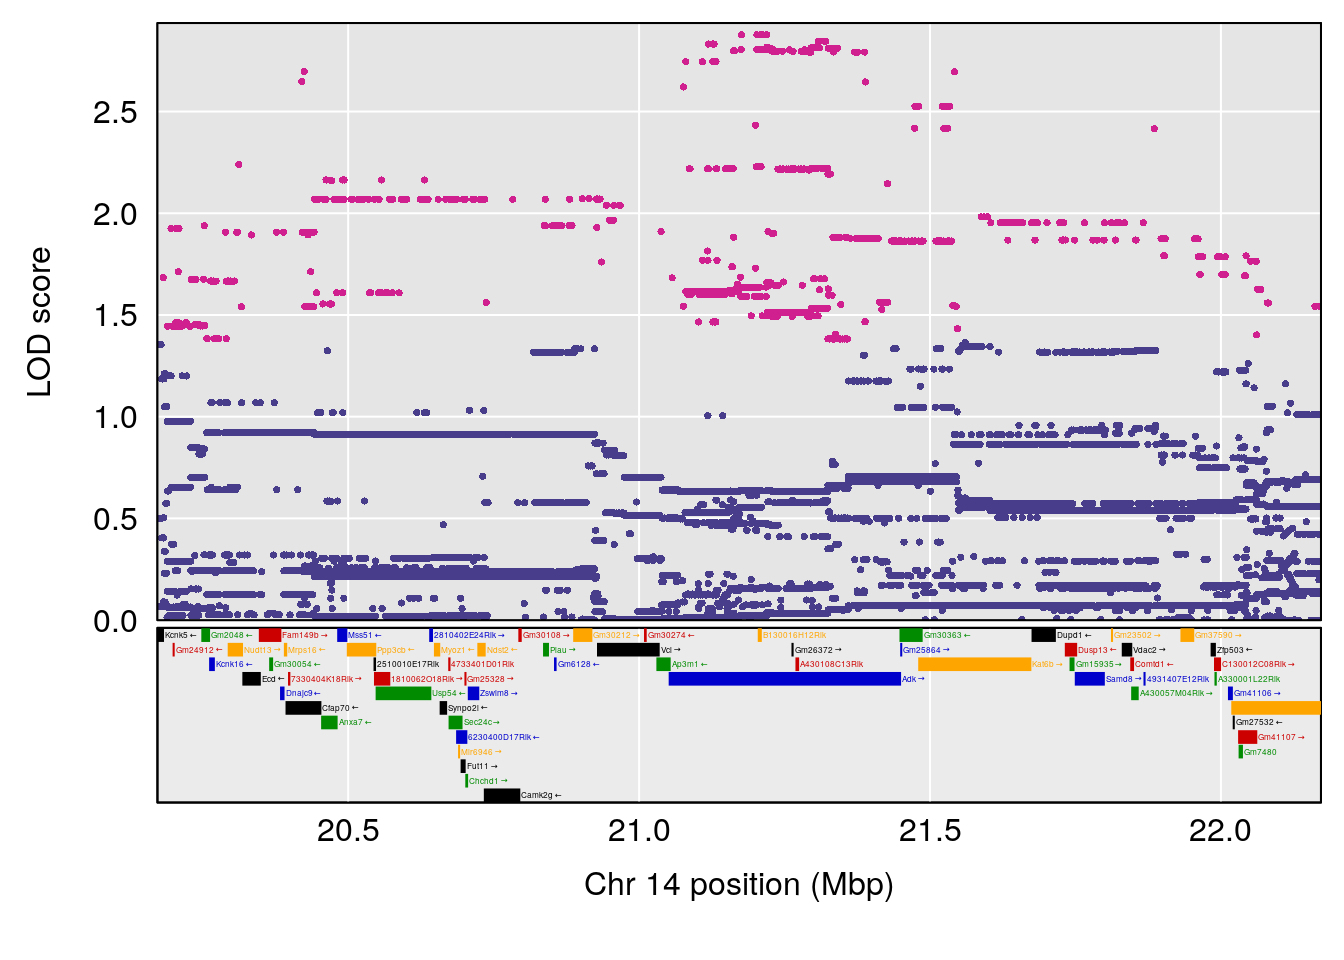
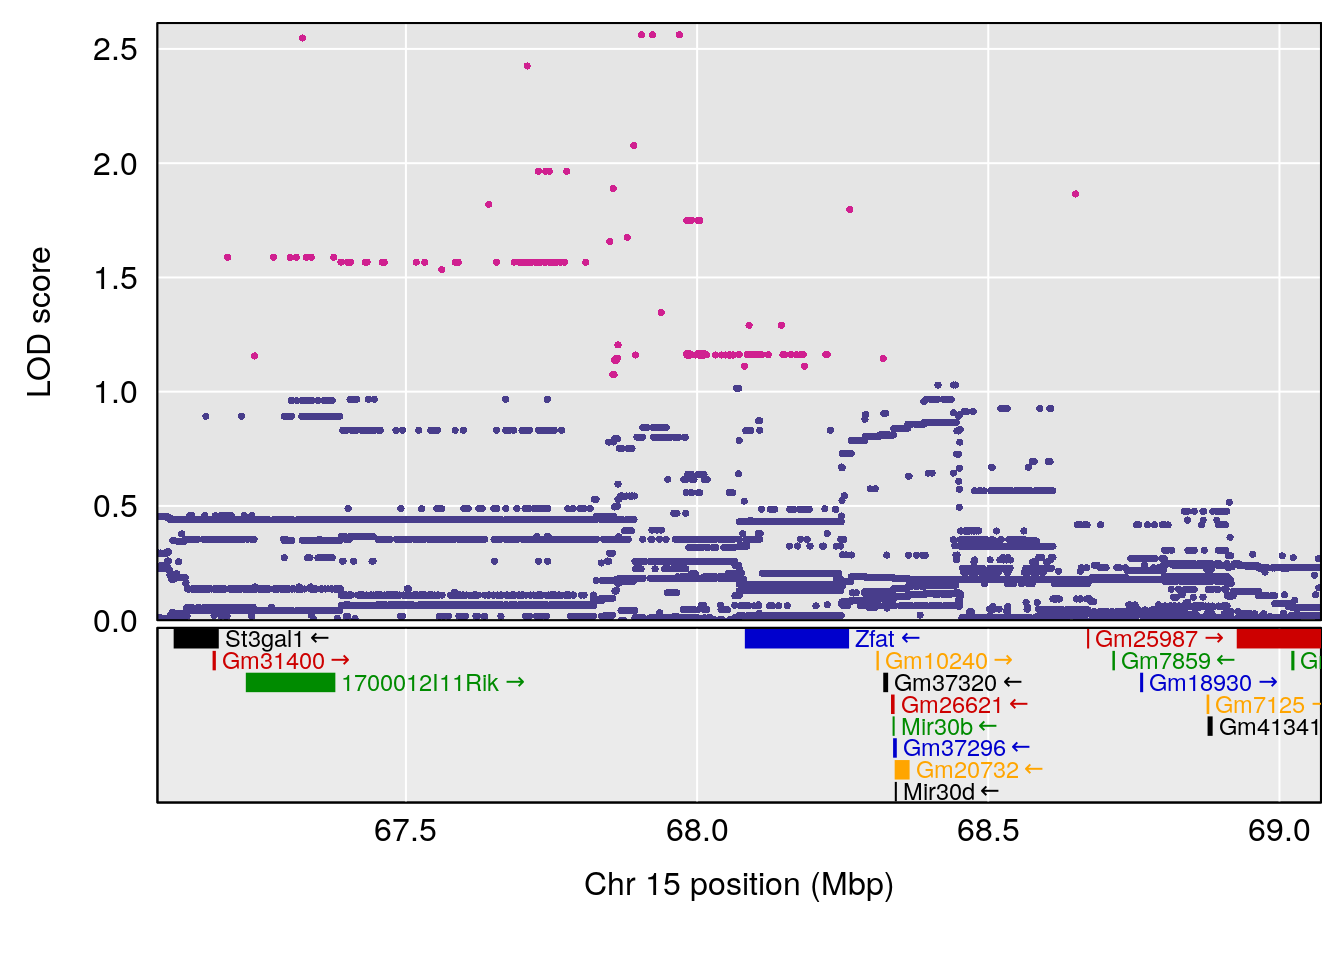
plot(out_snps[[i]][[p]]$lod, out_snps[[i]][[p]]$snpinfo, drop_hilit=1.5, genes=out_genes[[i]][[p]])
}
}
}
# [1] "Time.to.Dead.Hr"
# lodindex lodcolumn chr pos lod ci_lo ci_hi
# 1 1 pheno1 4 155.6289 7.273047 24.82559 155.8786
# 2 1 pheno1 5 130.9439 6.743946 130.42272 135.0373
# [1] 1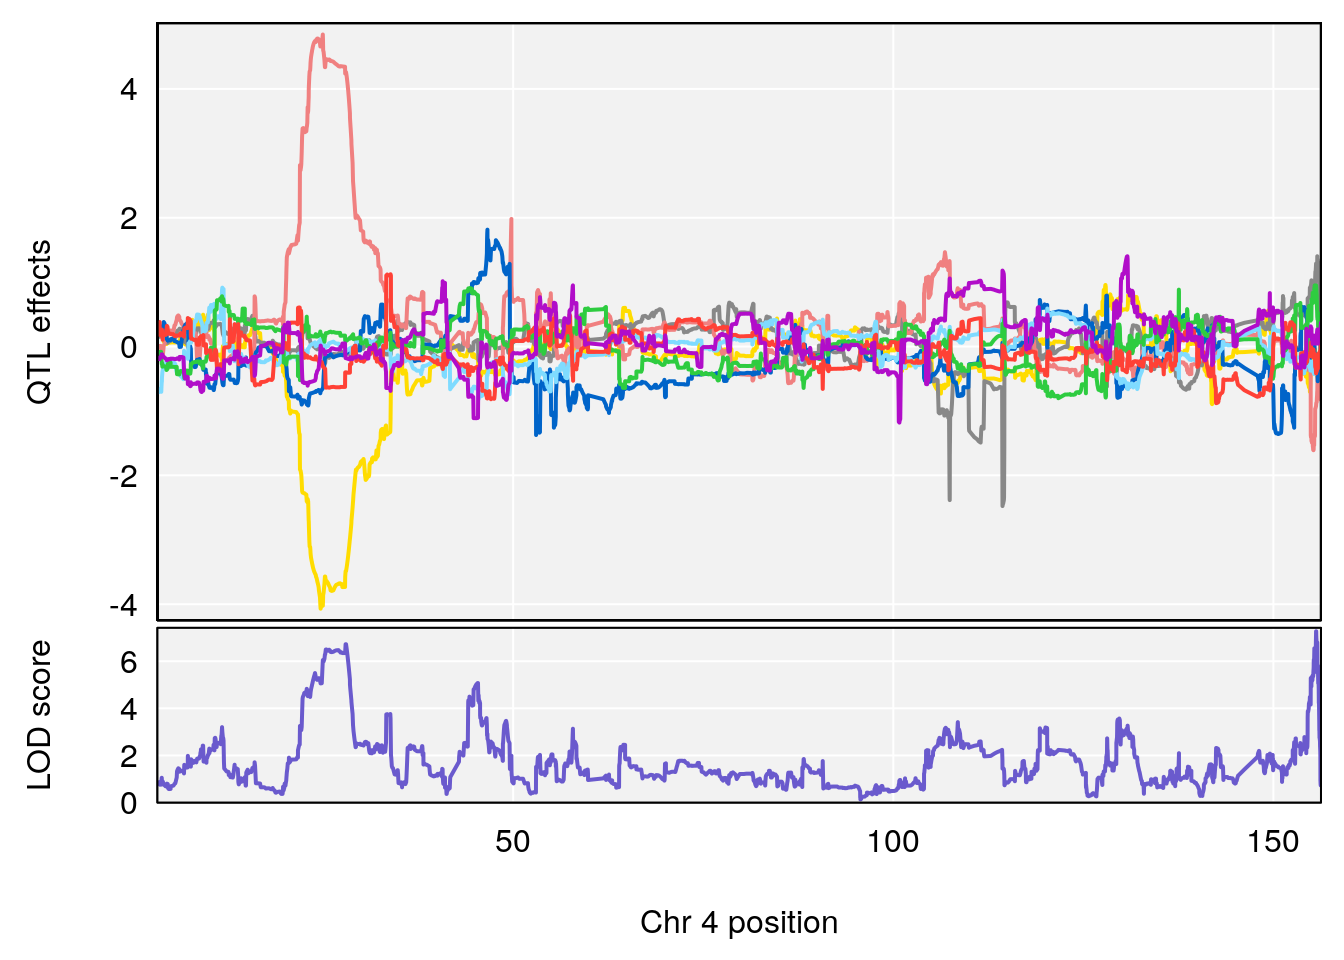
# [1] 2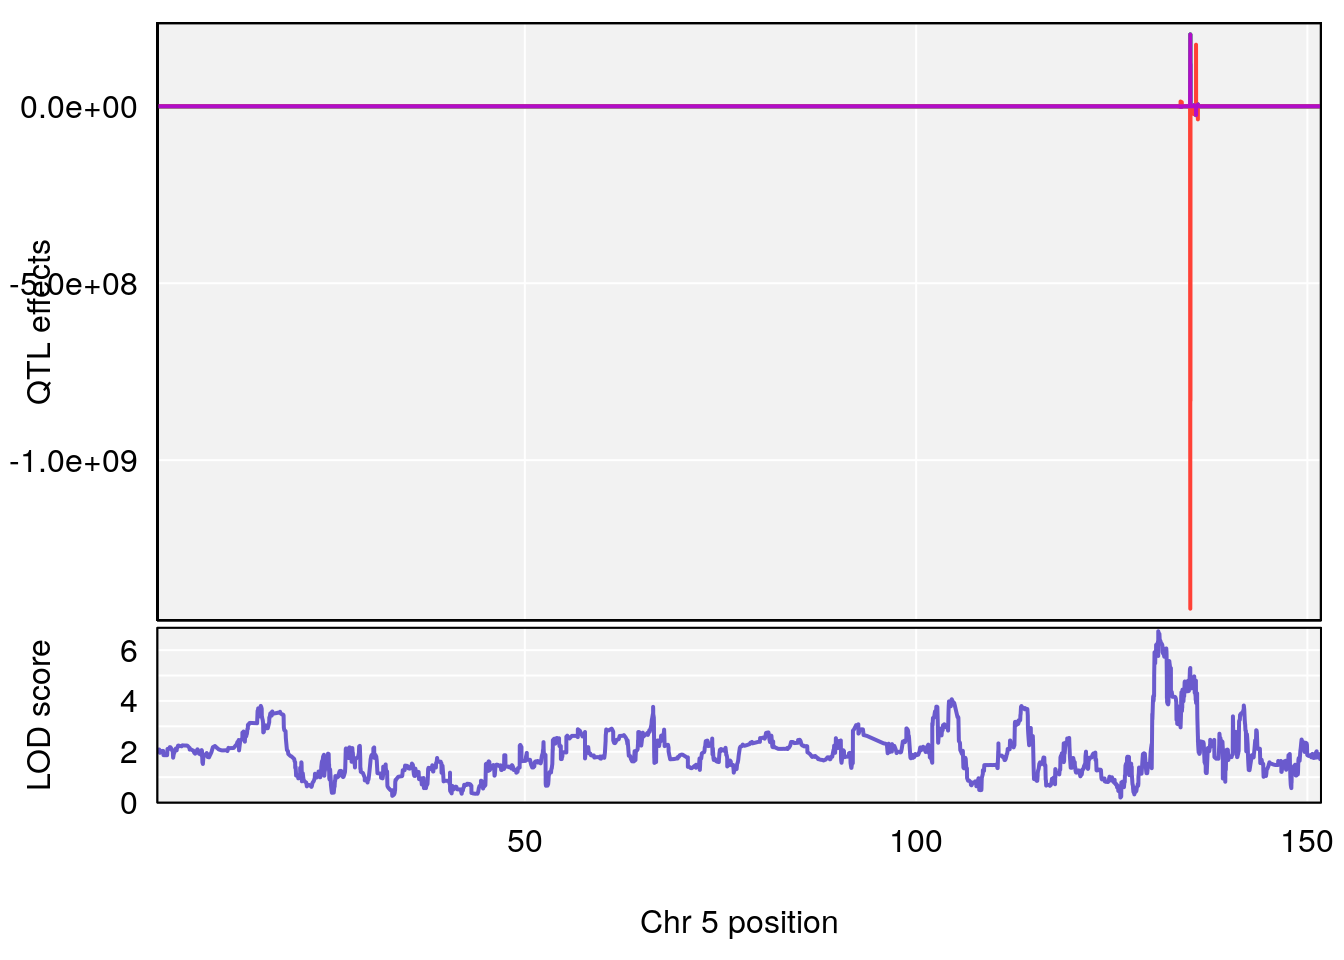
# [1] "RR.Depression.Rate.Hr"
# [1] lodindex  lodcolumn chr       pos       lod       ci_lo     ci_hi
# <0 rows> (or 0-length row.names)
# [1] "Time.to.Steady.RR.Depression.Hr"
# [1] lodindex  lodcolumn chr       pos       lod       ci_lo     ci_hi
# <0 rows> (or 0-length row.names)
# [1] "Min.Depression.RR"
#   lodindex lodcolumn chr       pos      lod     ci_lo     ci_hi
# 1        1    pheno1   6 110.23309 6.891327 109.74468 110.89903
# 2        1    pheno1  15  70.26574 6.600987  68.92851  82.99412
# [1] 1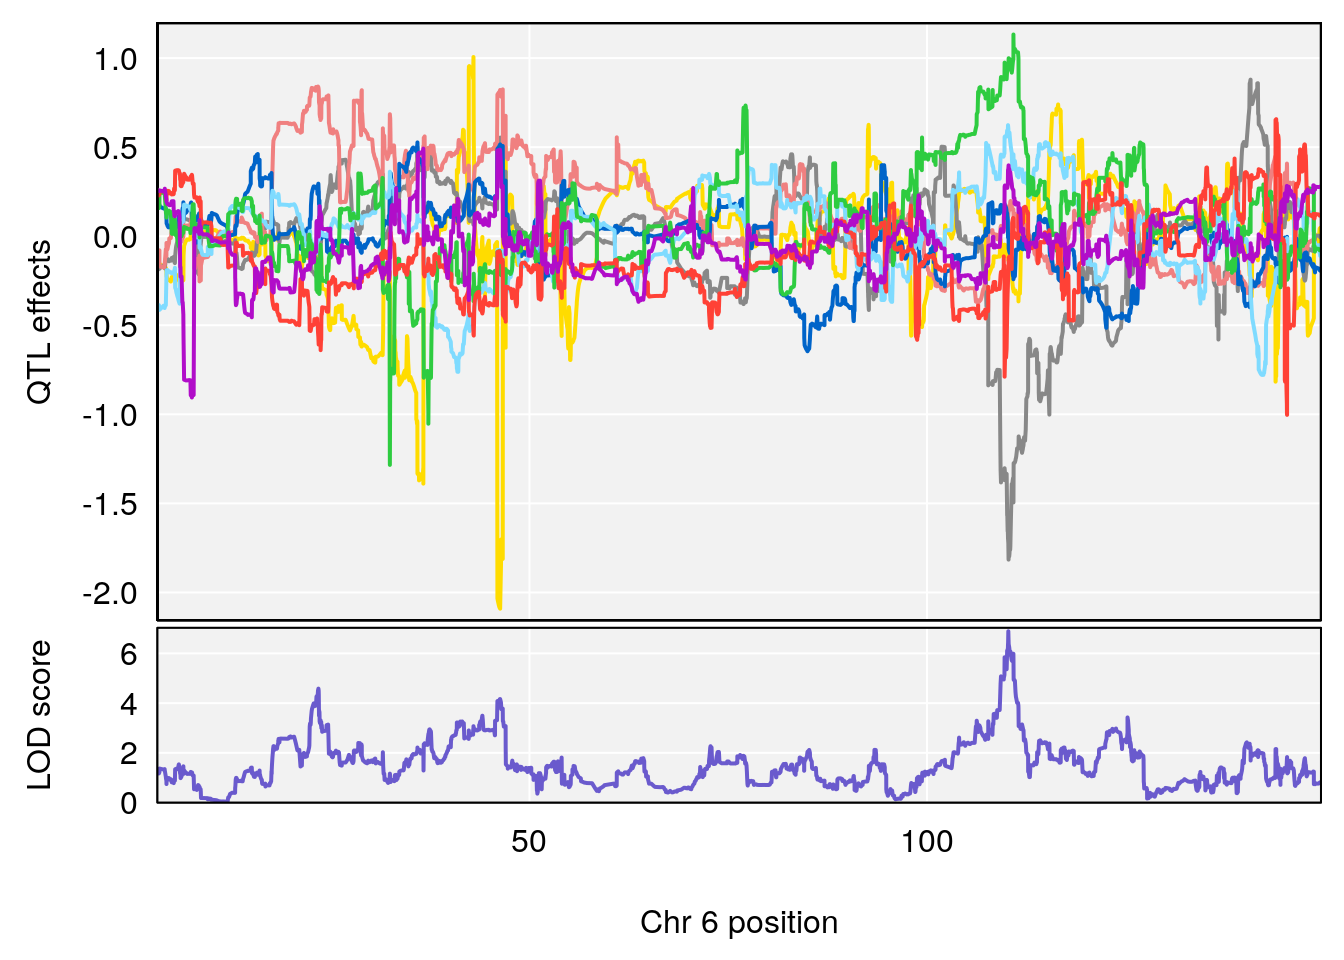

# [1] 2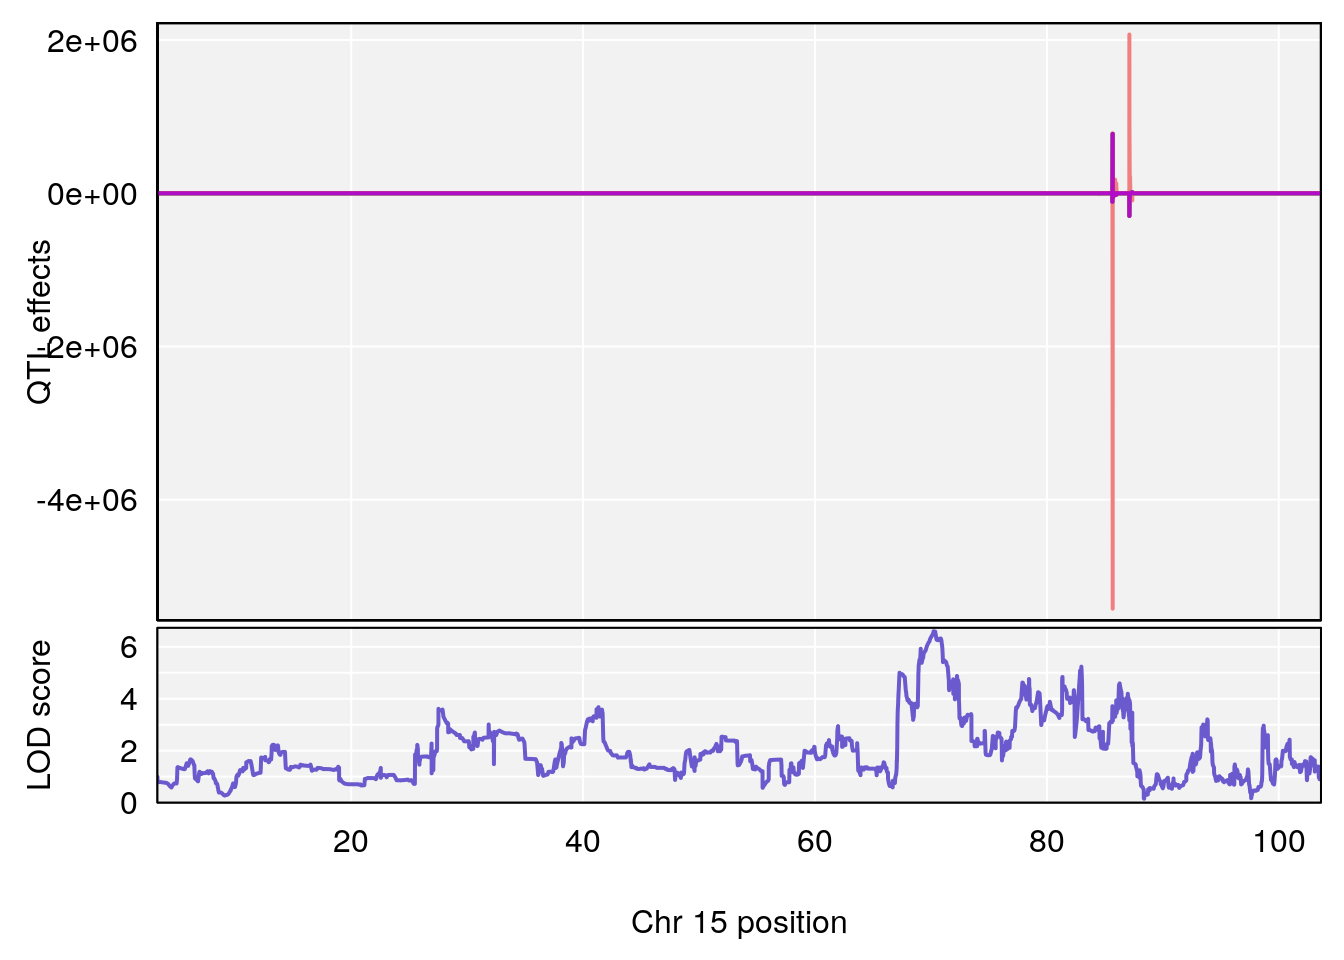
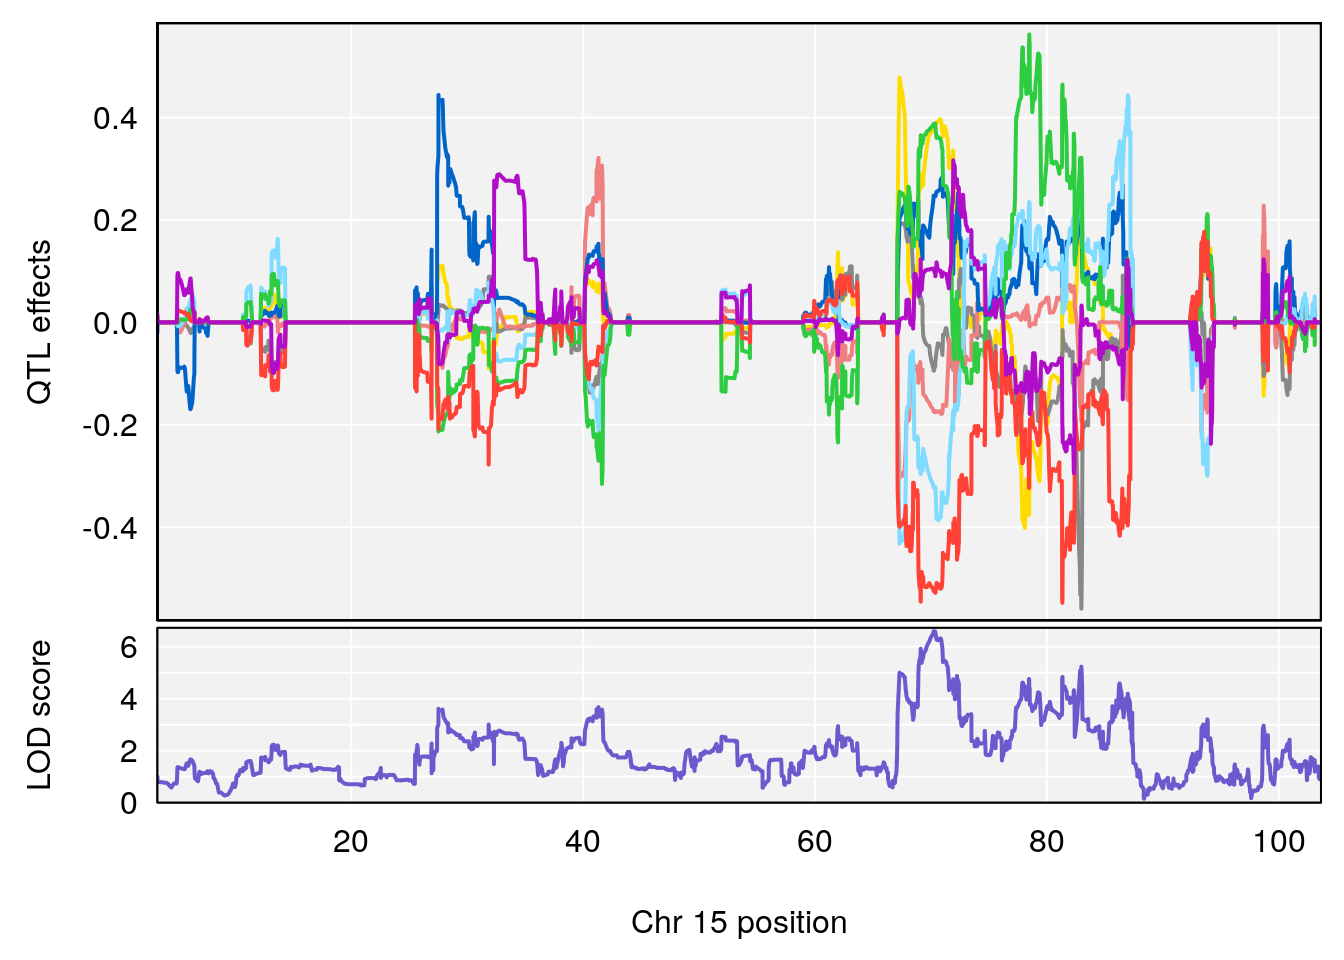
# [1] "Mean.Depression.BR"
#   lodindex lodcolumn chr       pos      lod    ci_lo     ci_hi
# 1        1    pheno1   2 179.93697 6.667862 99.48509 180.36898
# 2        1    pheno1  15  28.43474 6.963138 27.40518  72.41165
# 3        1    pheno1  17  44.82475 6.772433 44.68776  45.38912
# [1] 1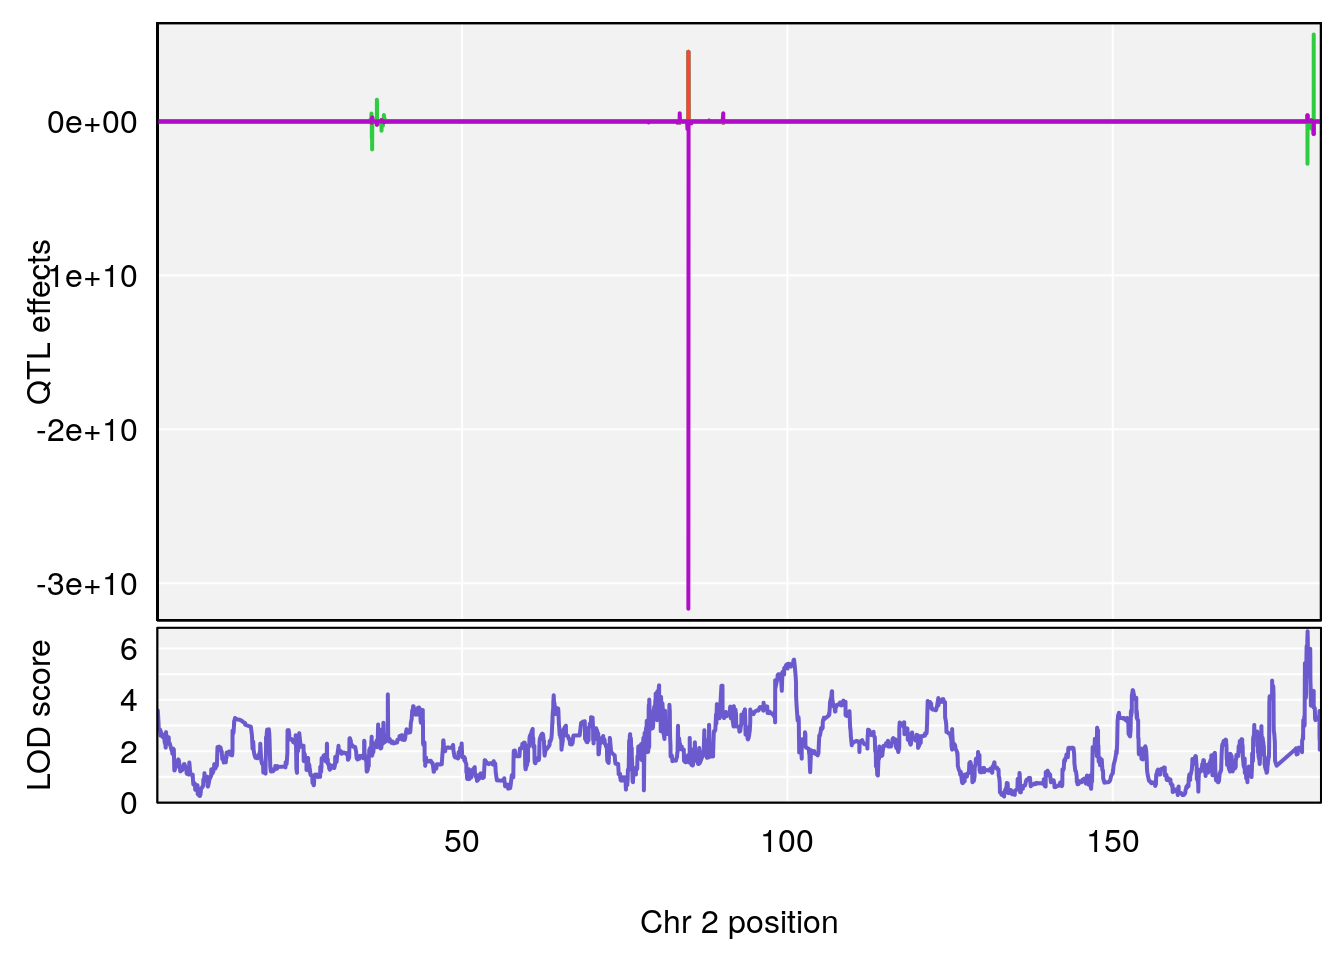
# [1] 2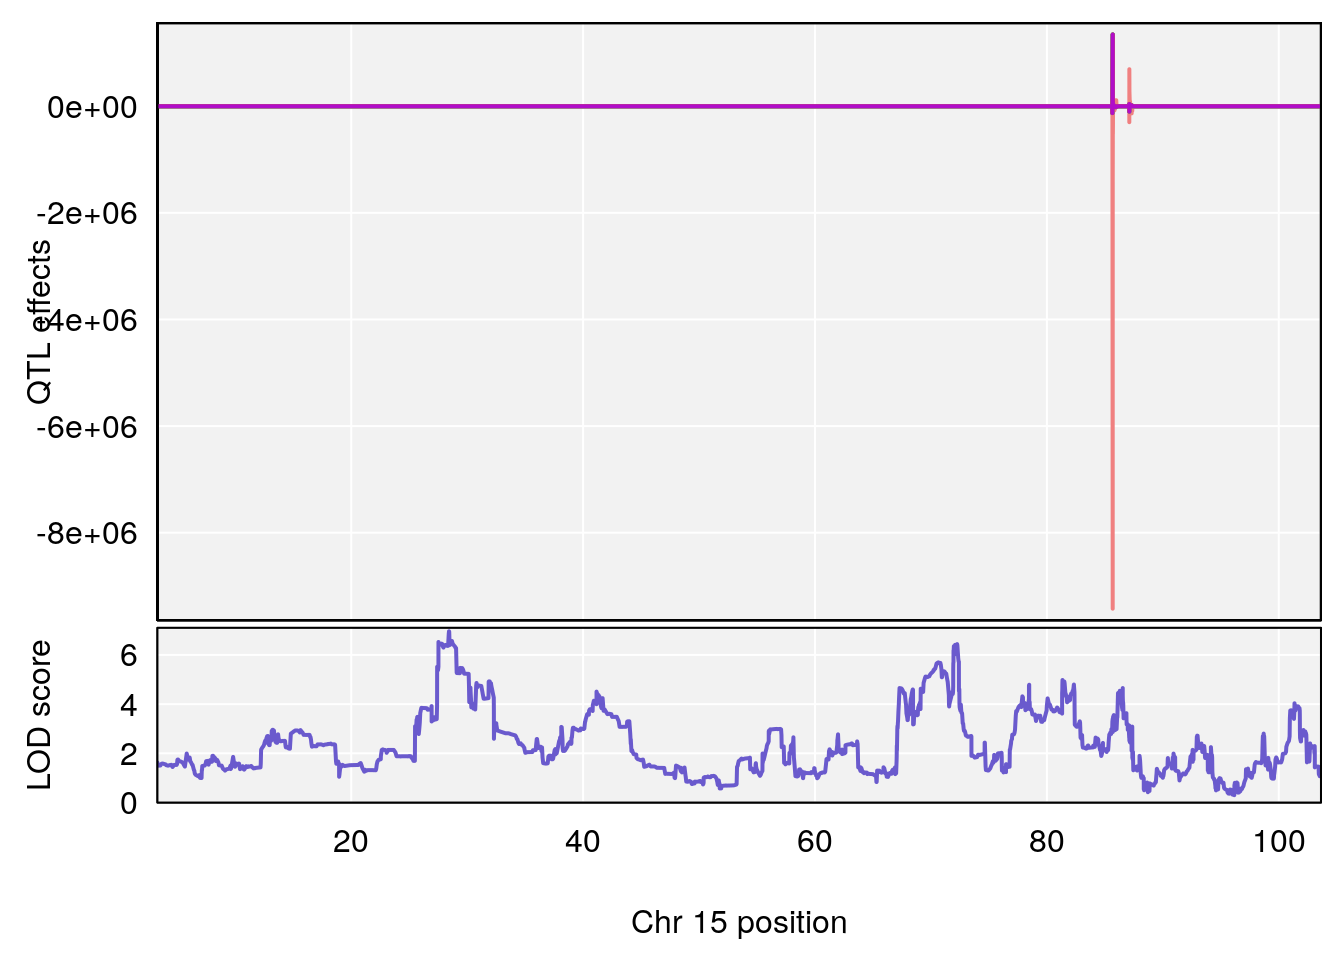


# [1] 3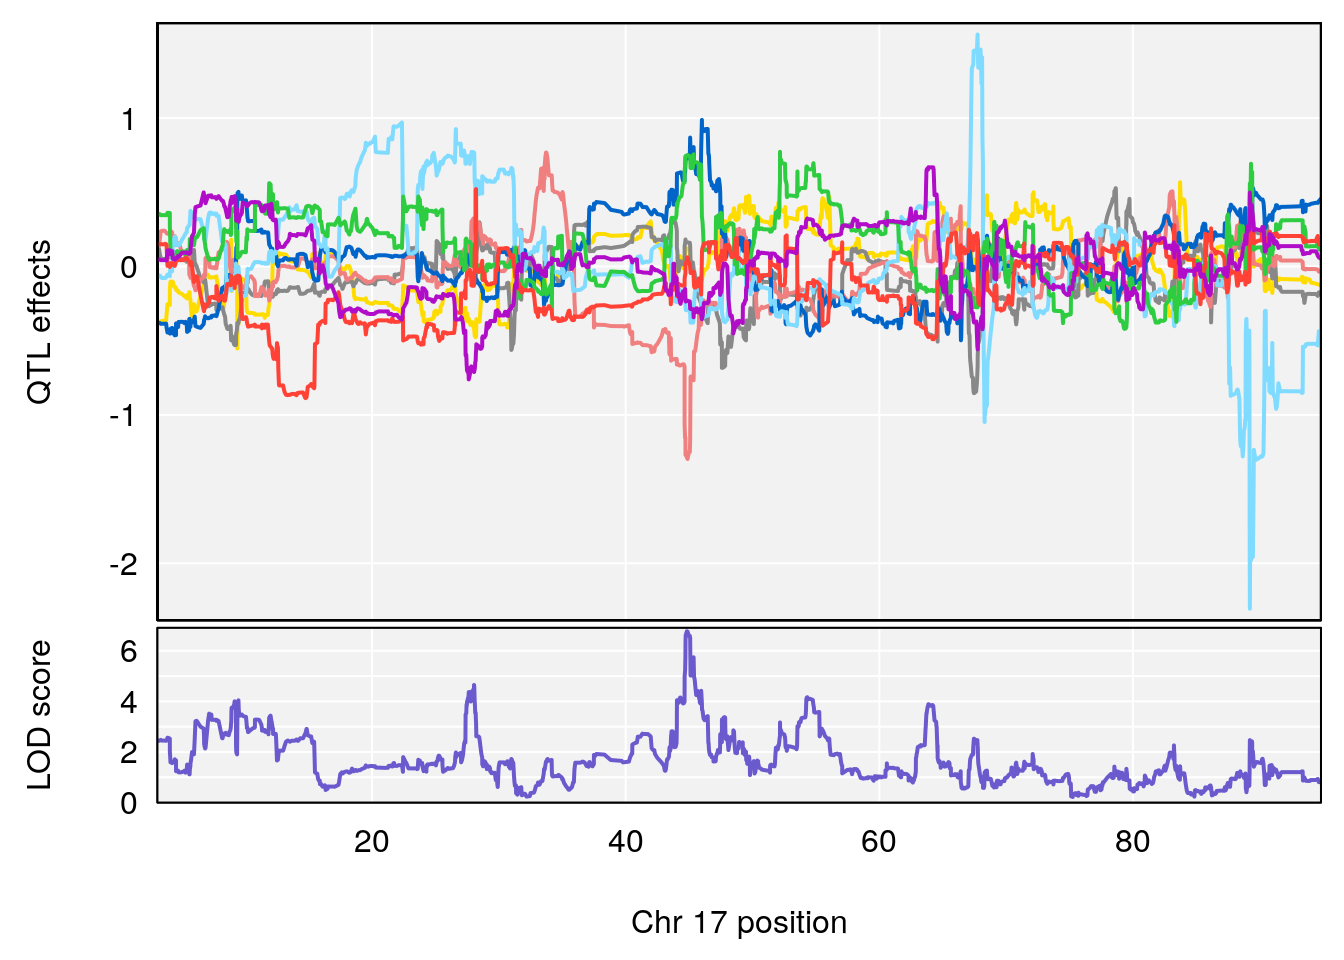
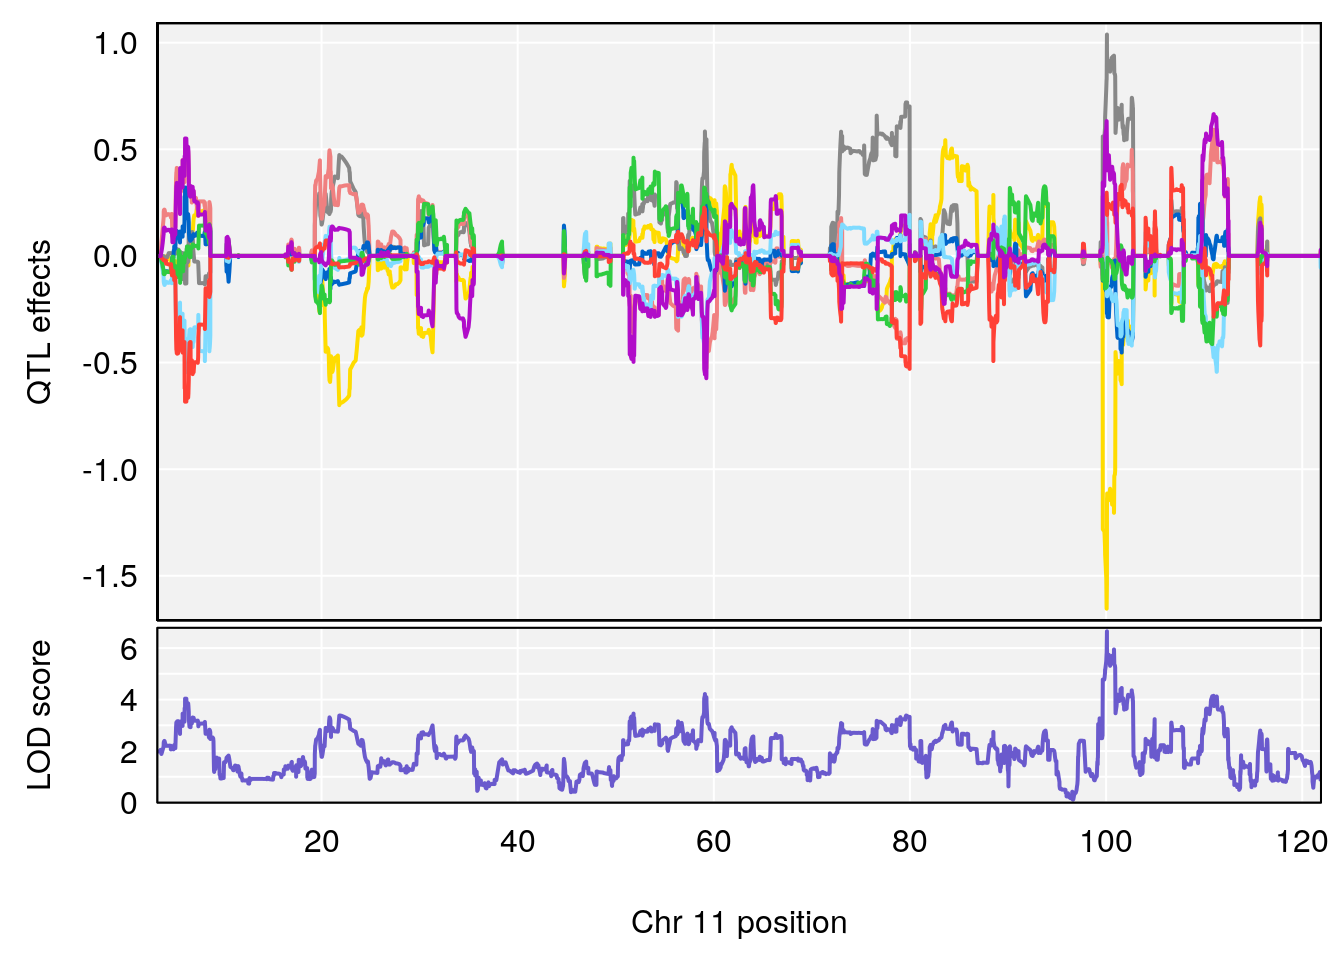
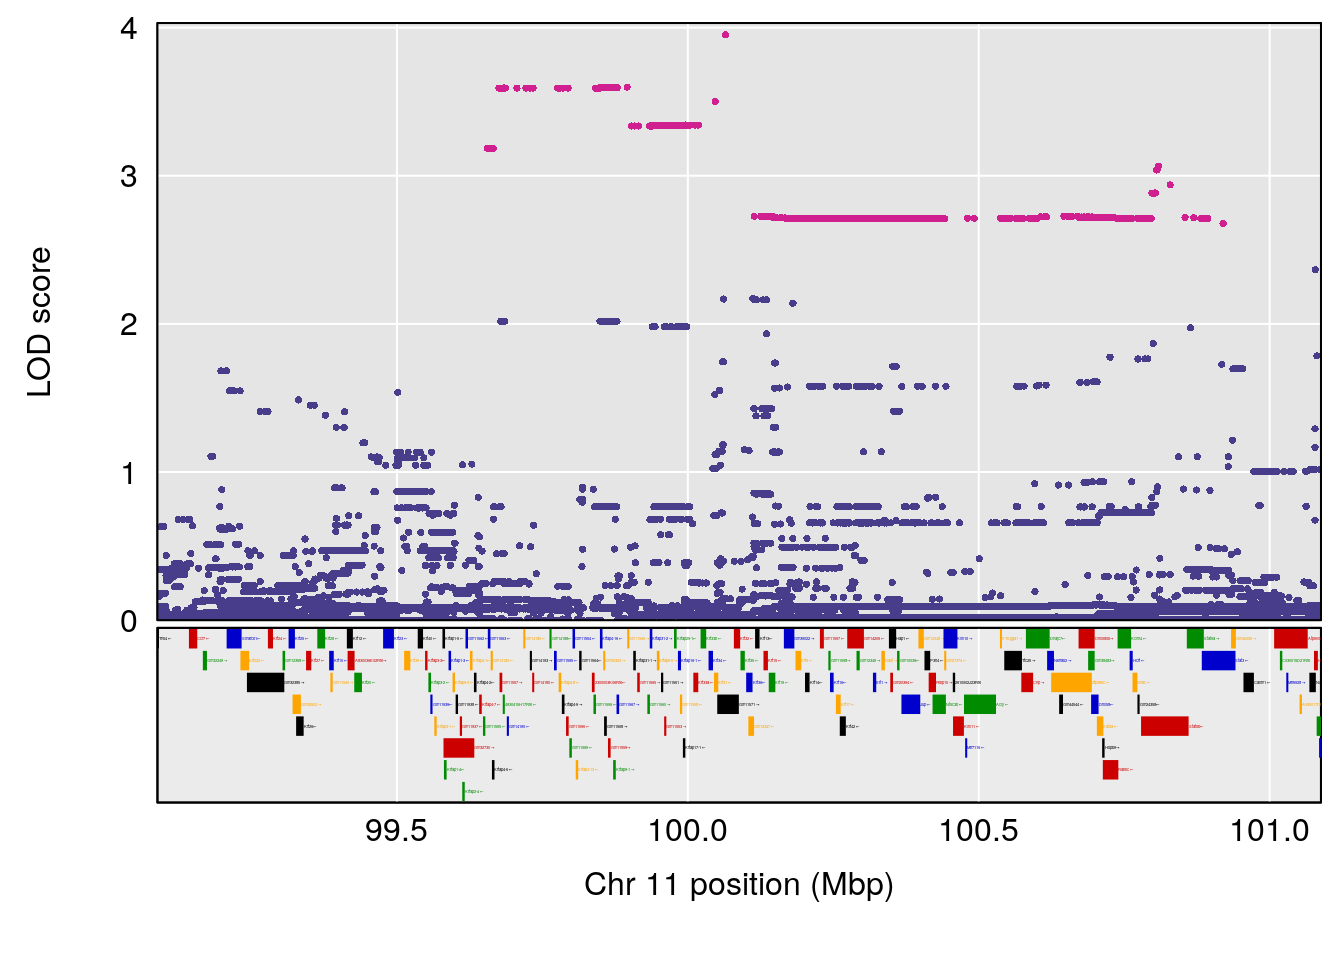
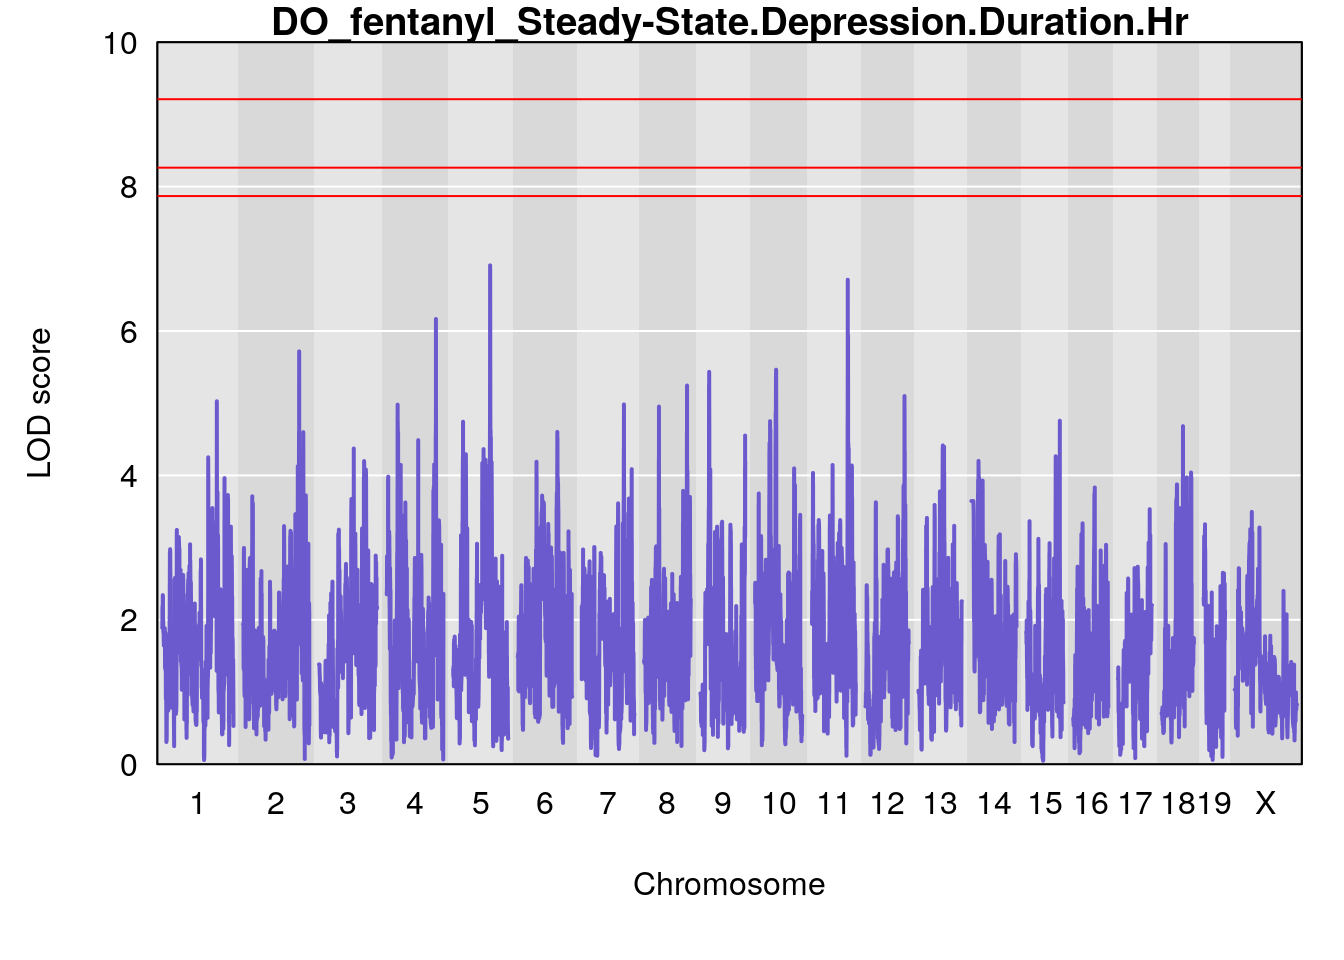
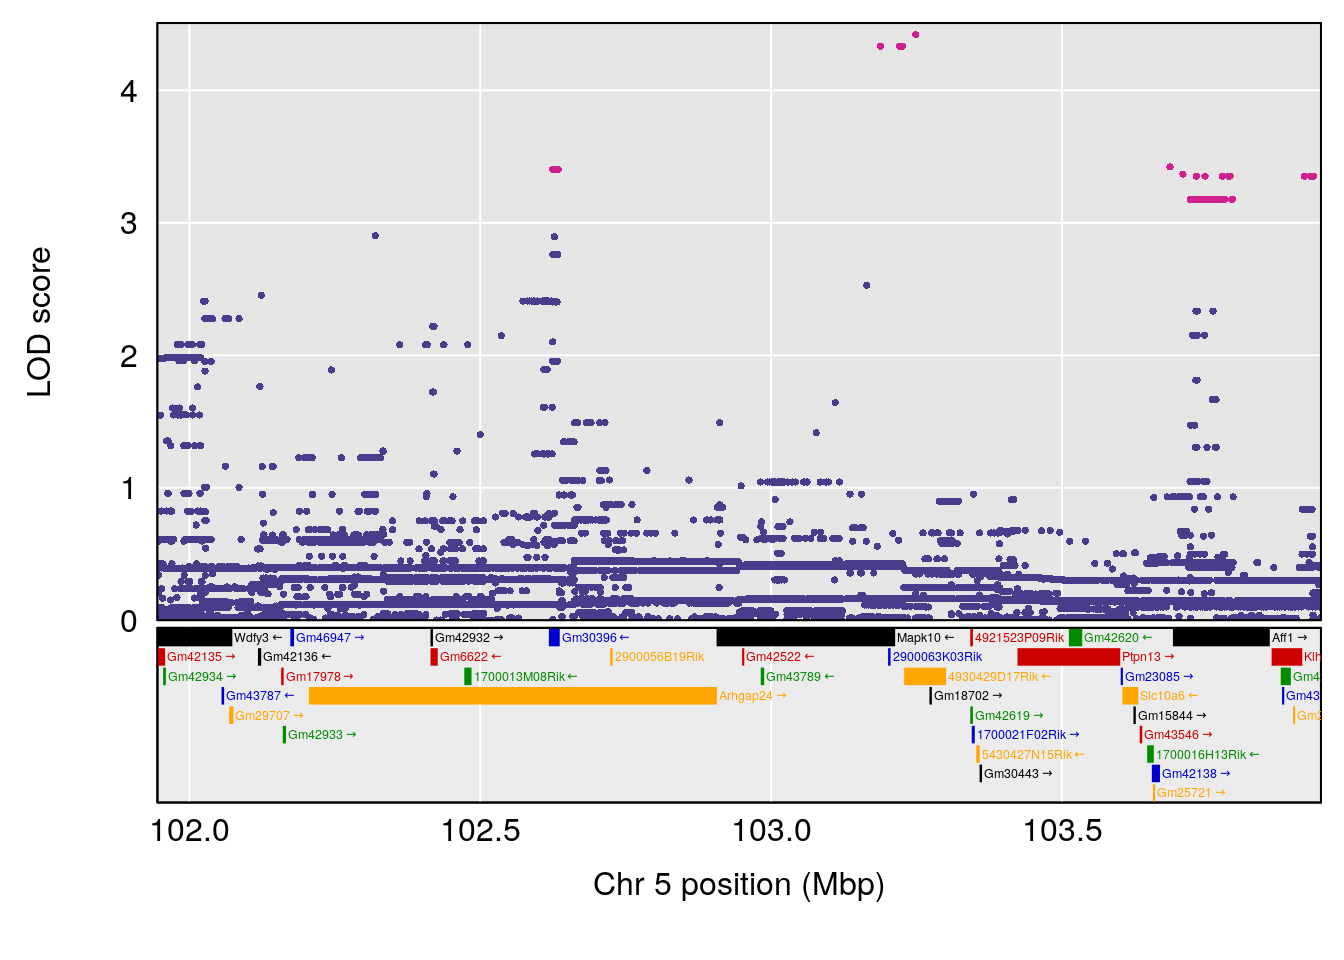
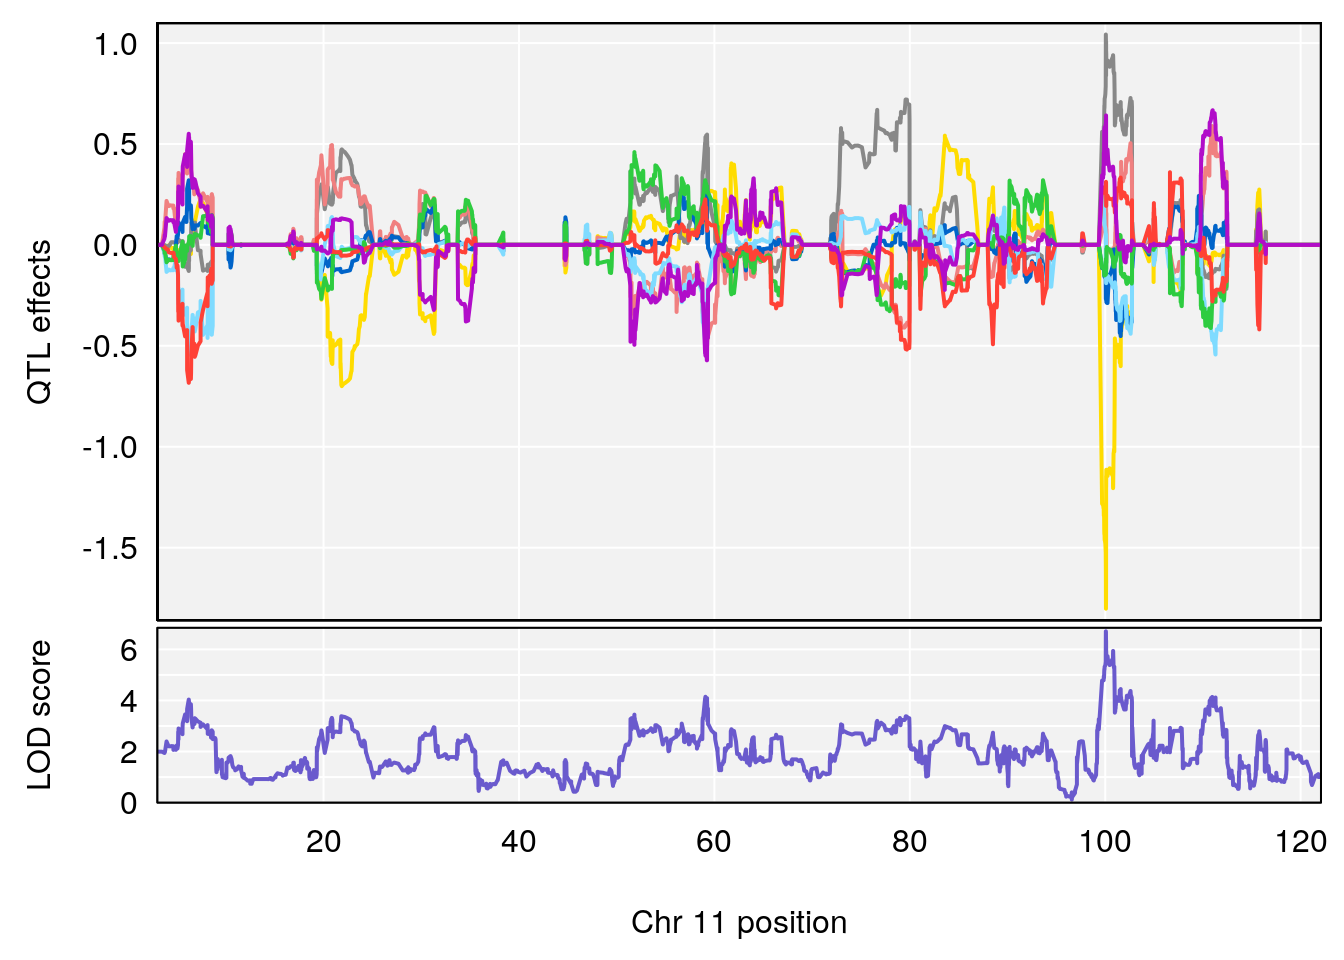
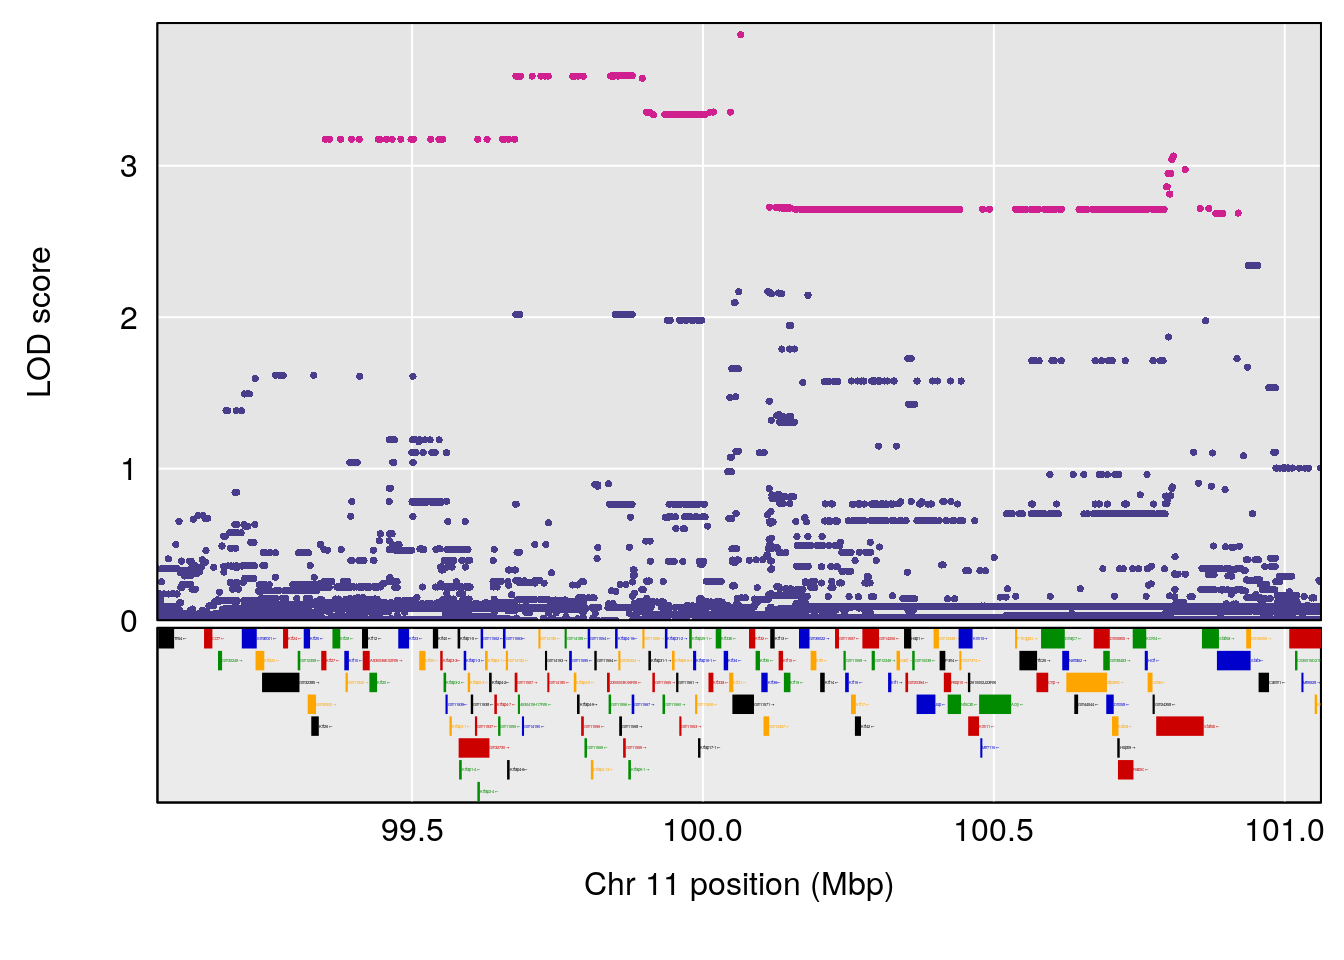
# [1] "Steady-State.Depression.Duration.Hr"
#   lodindex lodcolumn chr      pos      lod     ci_lo    ci_hi
# 1        1    pheno1   4 135.9927 6.107796  32.37530 136.1999
# 2        1    pheno1   5 102.9928 7.087202 102.81969 103.3132
# 3        1    pheno1  11 100.0882 6.652753  99.89319 100.9355
# [1] 1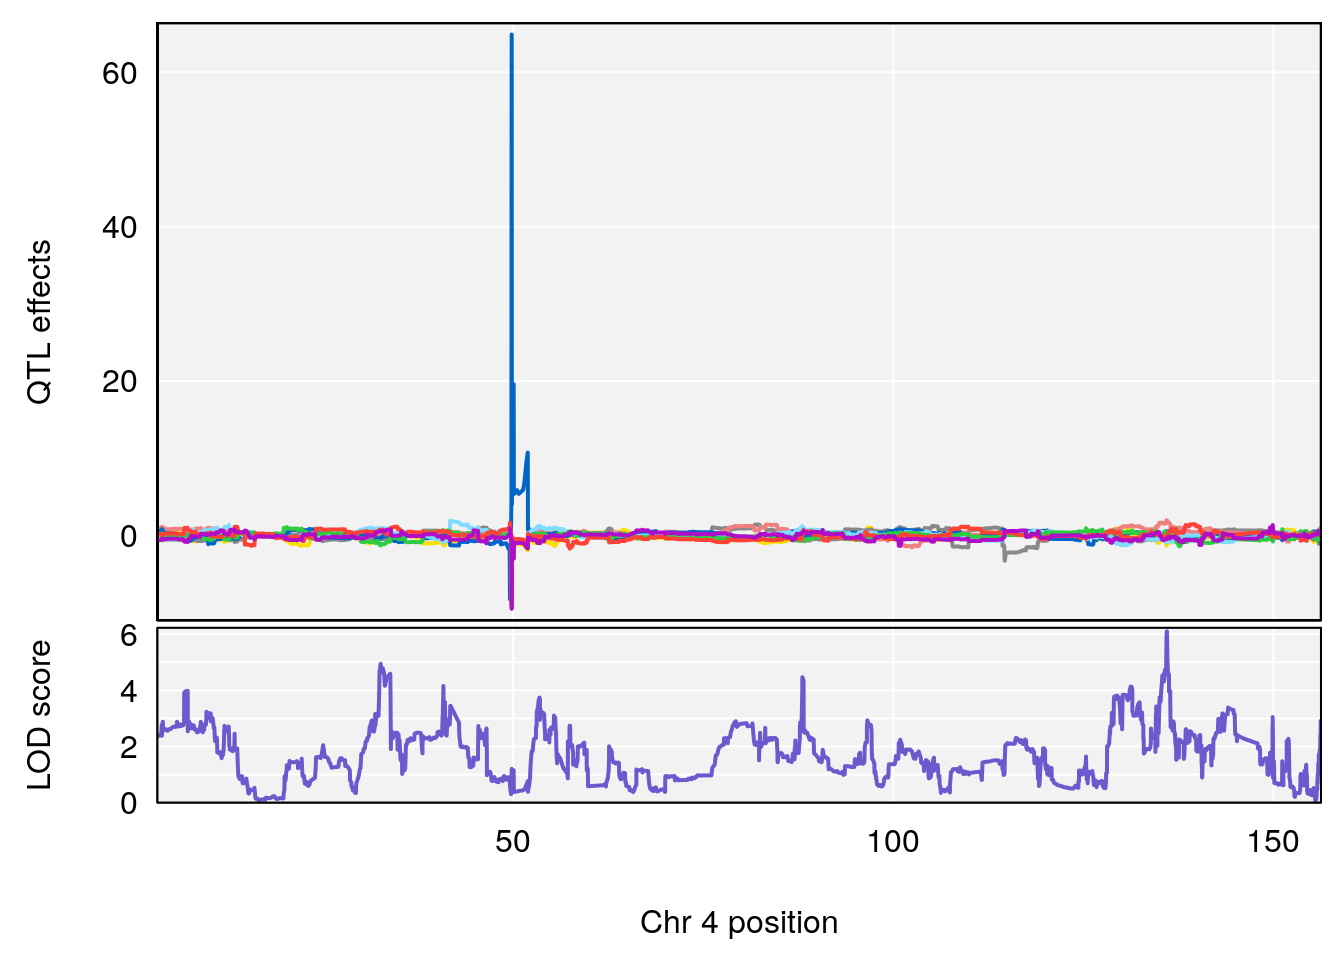
# [1] 2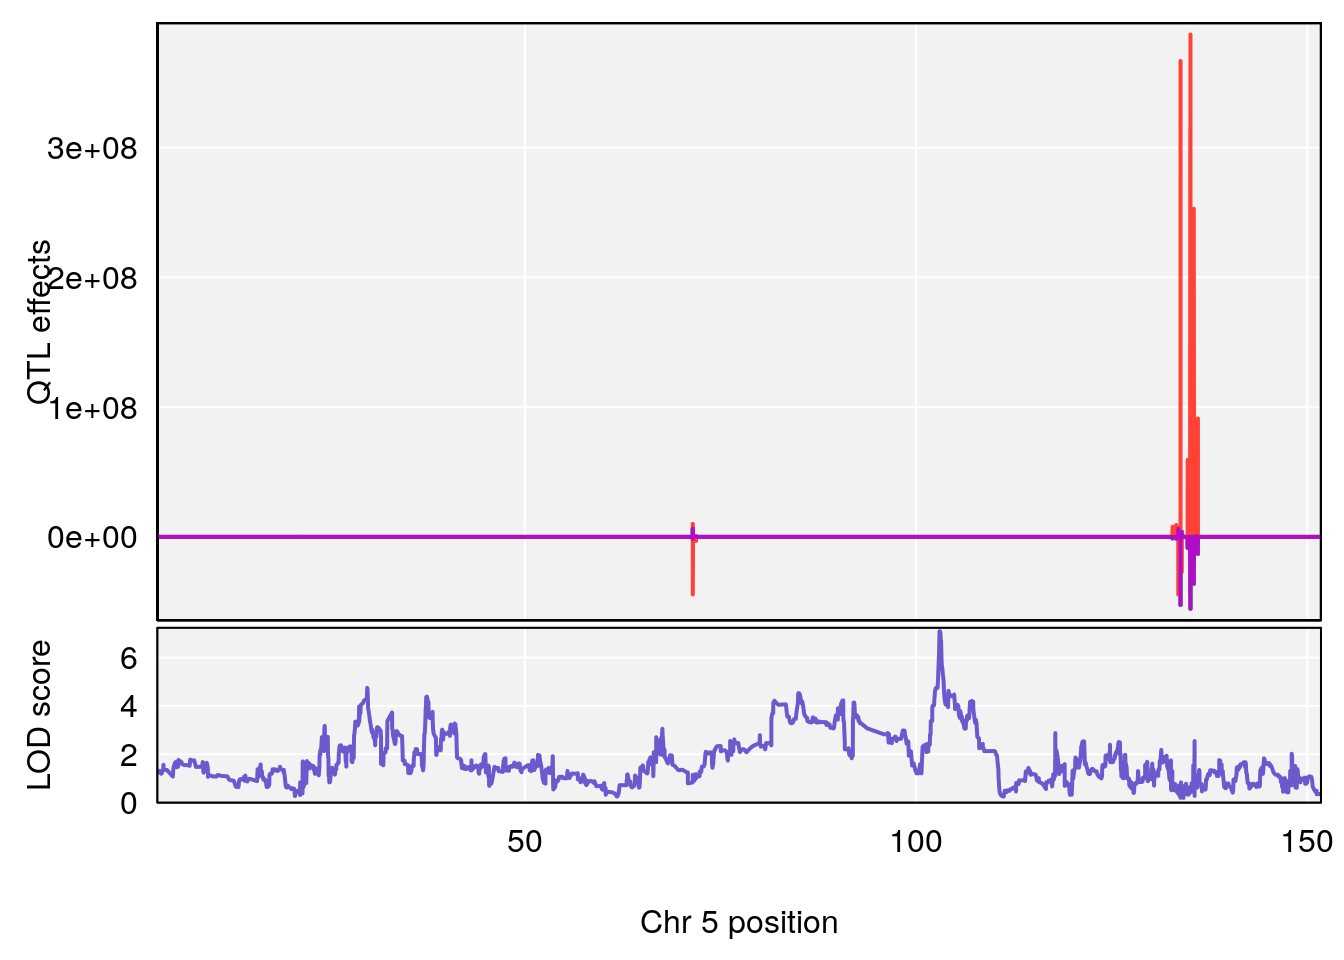
# [1] 3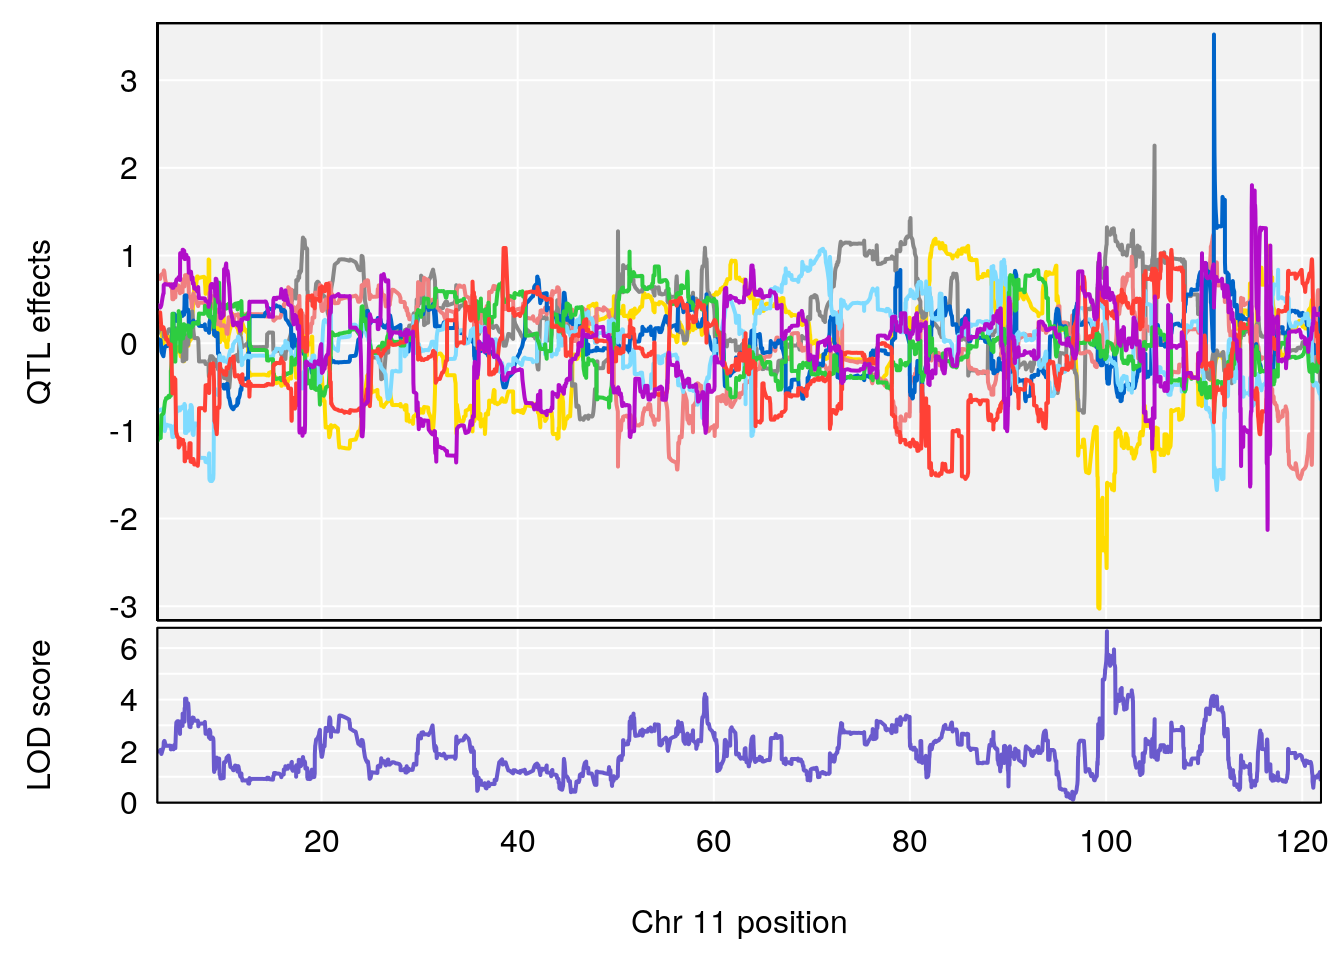
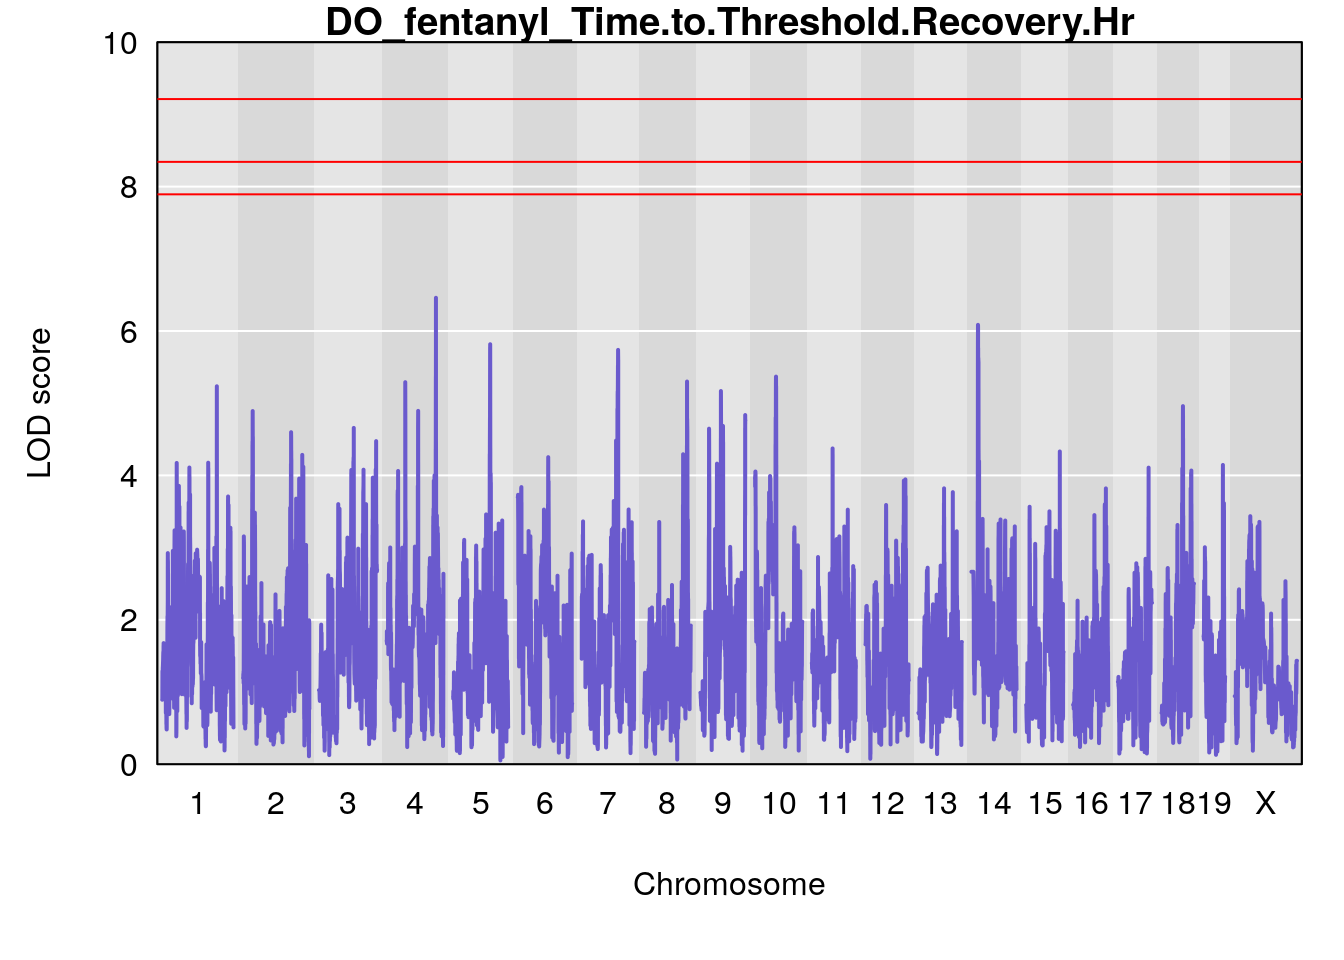
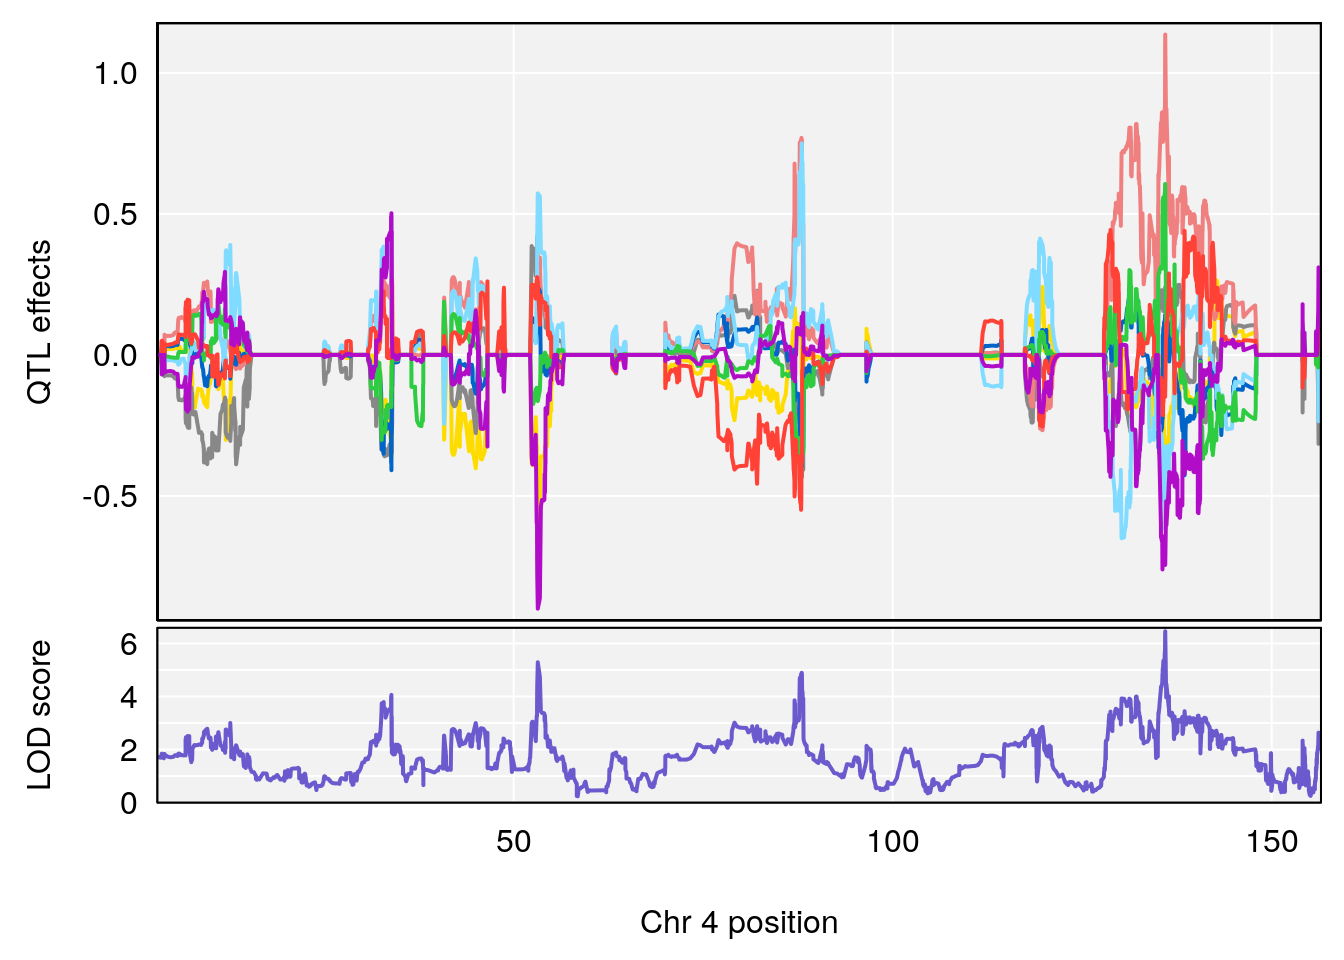
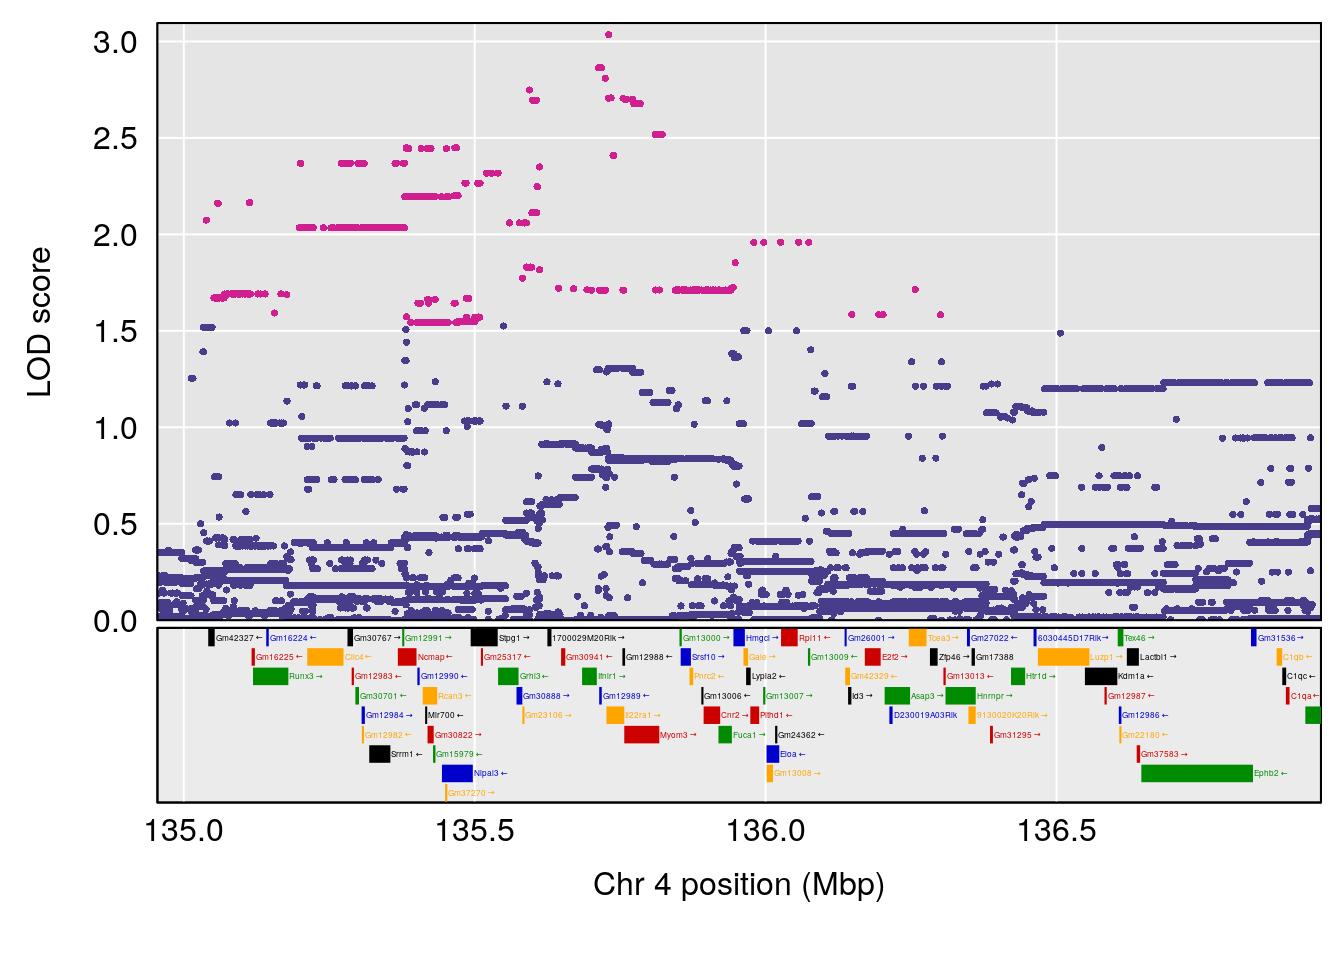
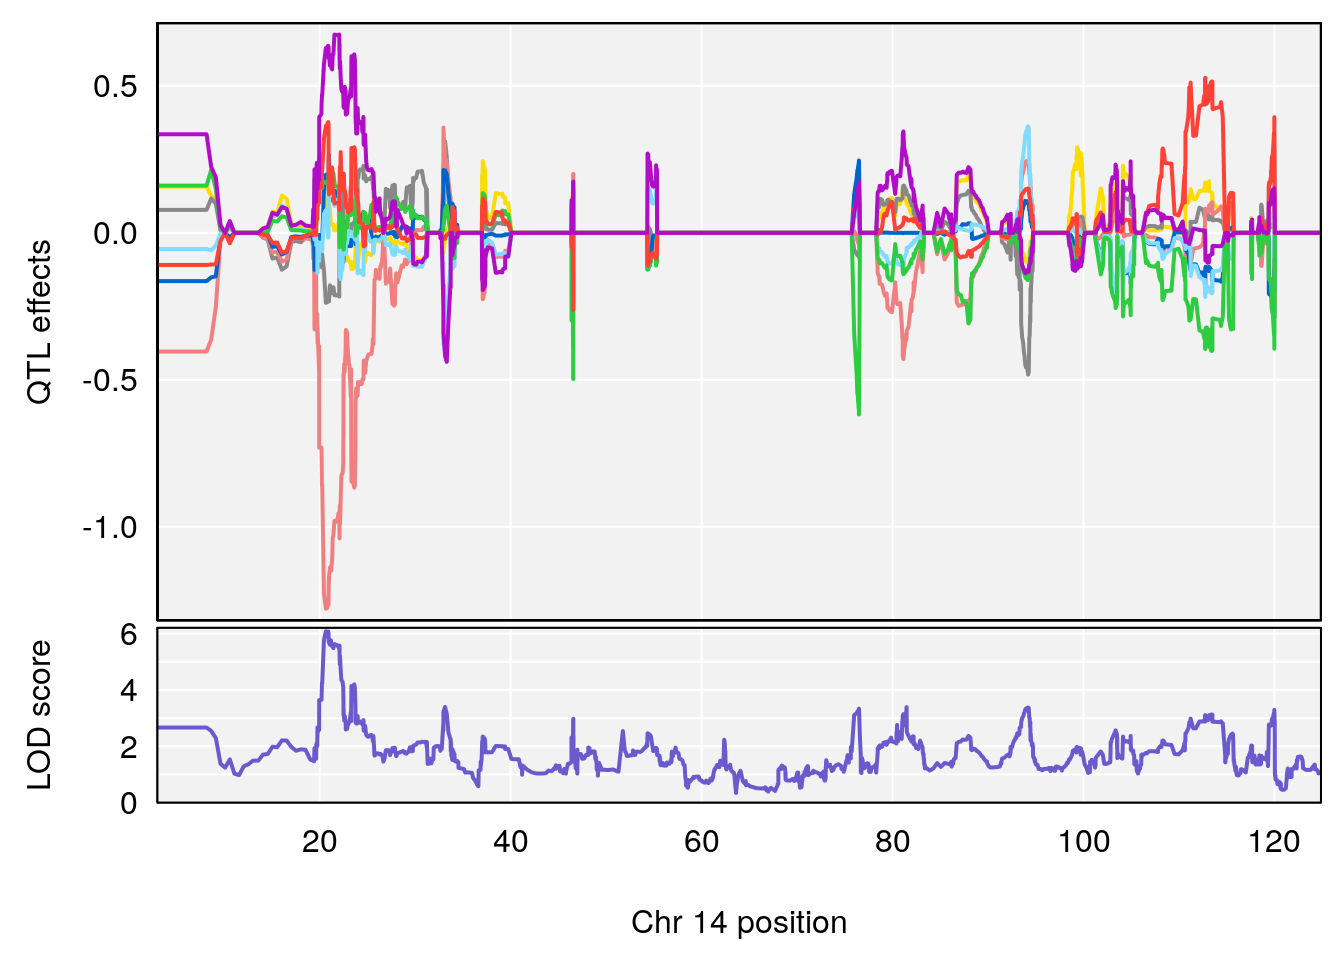
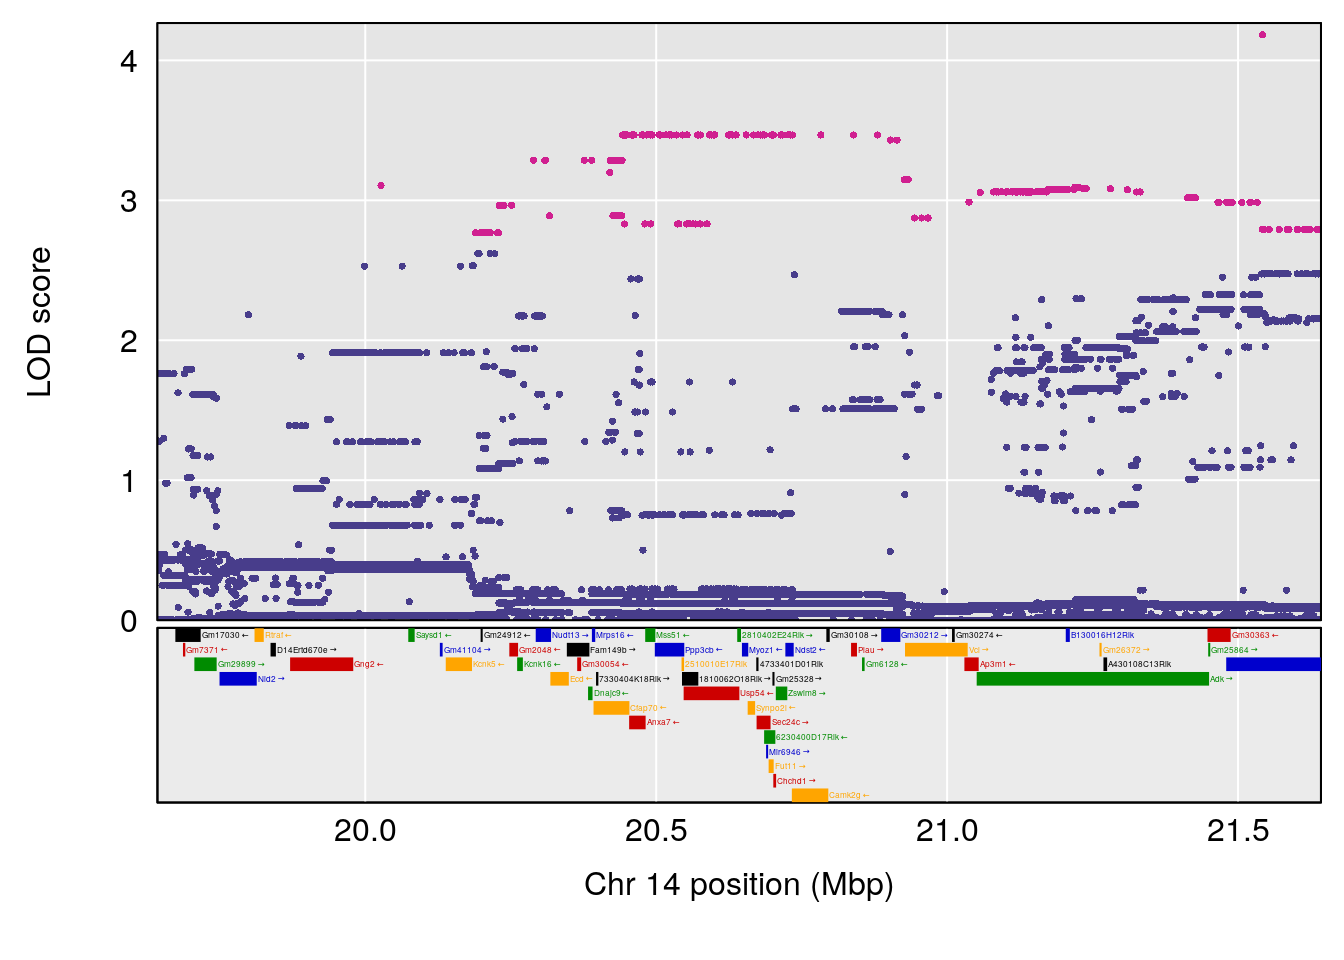
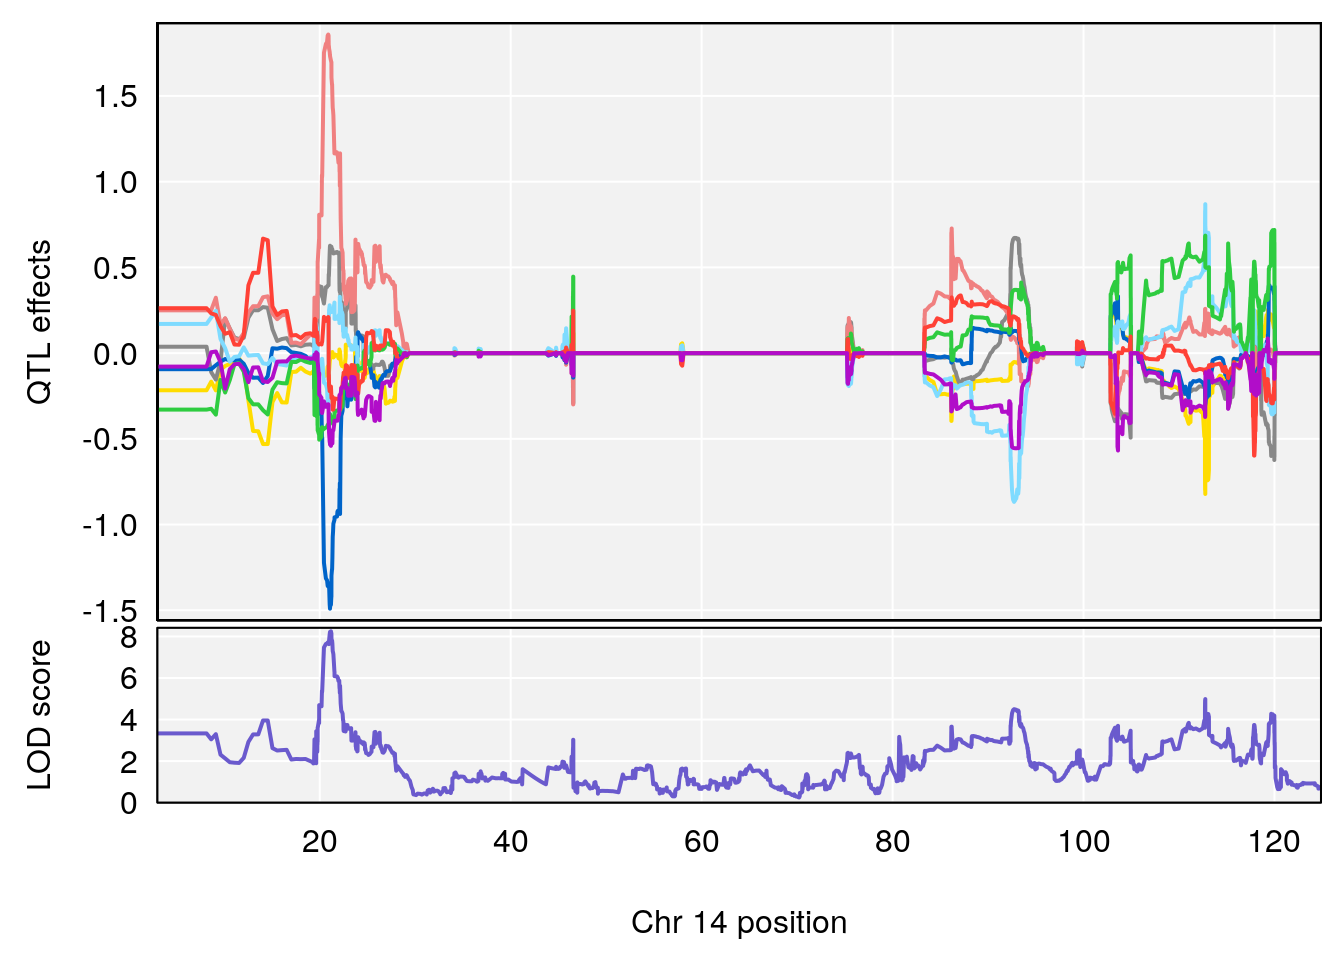
# [1] "Time.to.Threshold.Recovery.Hr"
#   lodindex lodcolumn chr       pos      lod    ci_lo     ci_hi
# 1        1    pheno1   4 135.94204 6.415931 53.10764 136.06715
# 2        1    pheno1  14  20.50752 6.094258 20.26372  22.25158
# [1] 1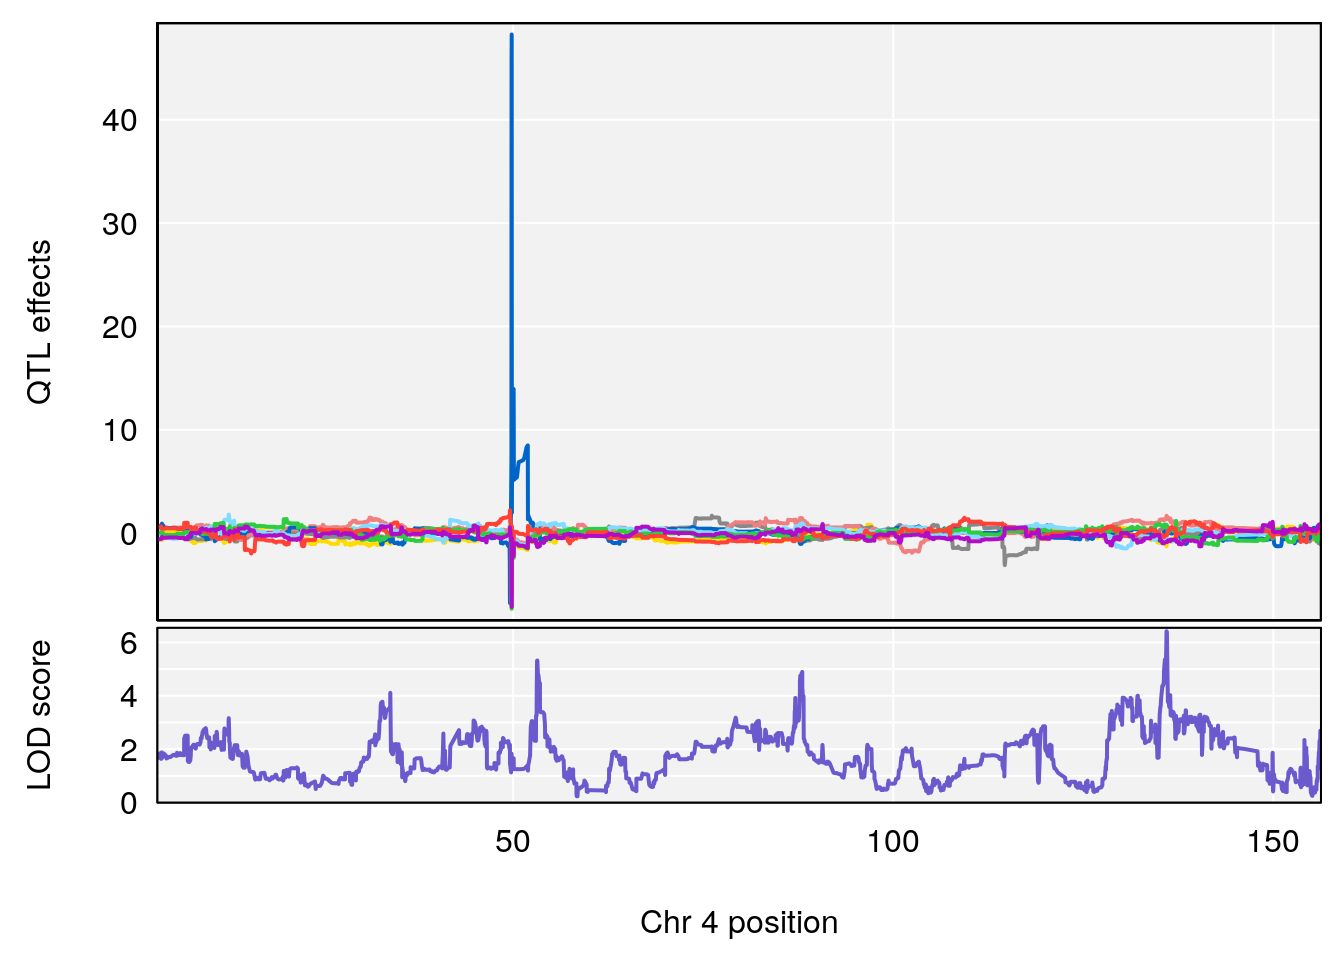
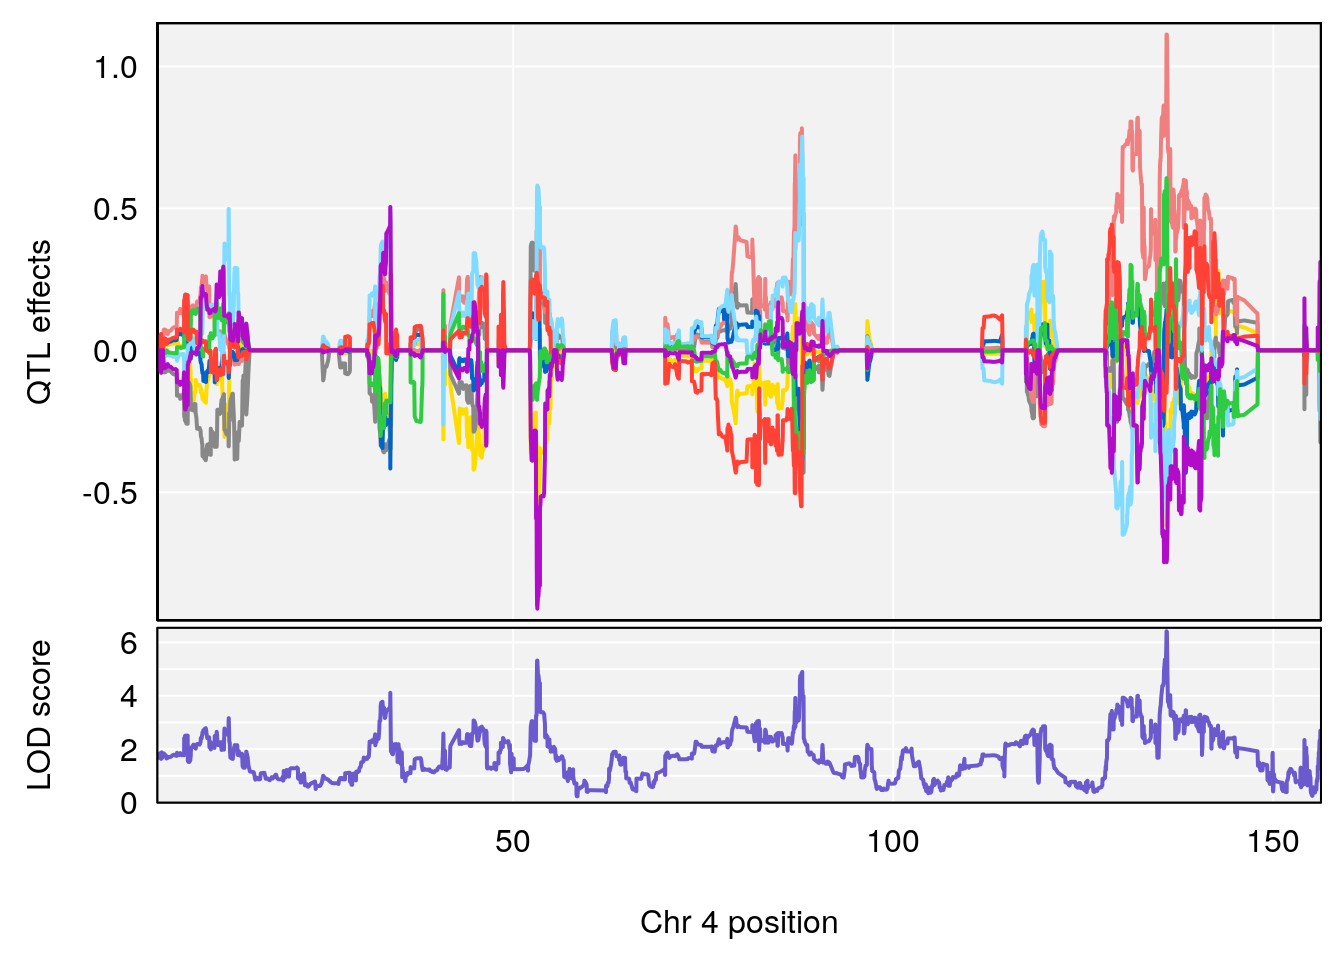
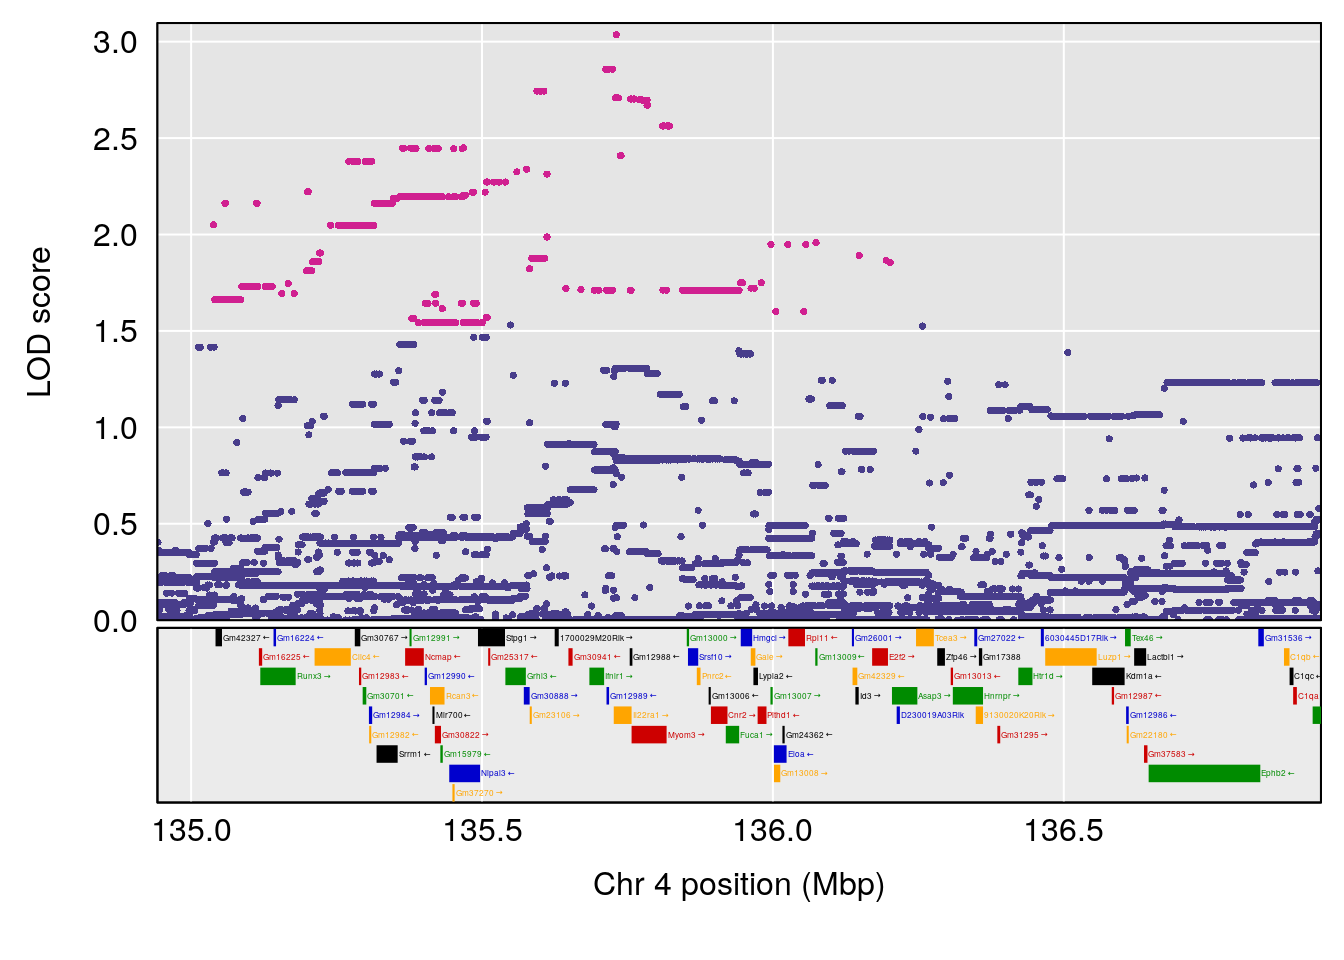
# [1] 2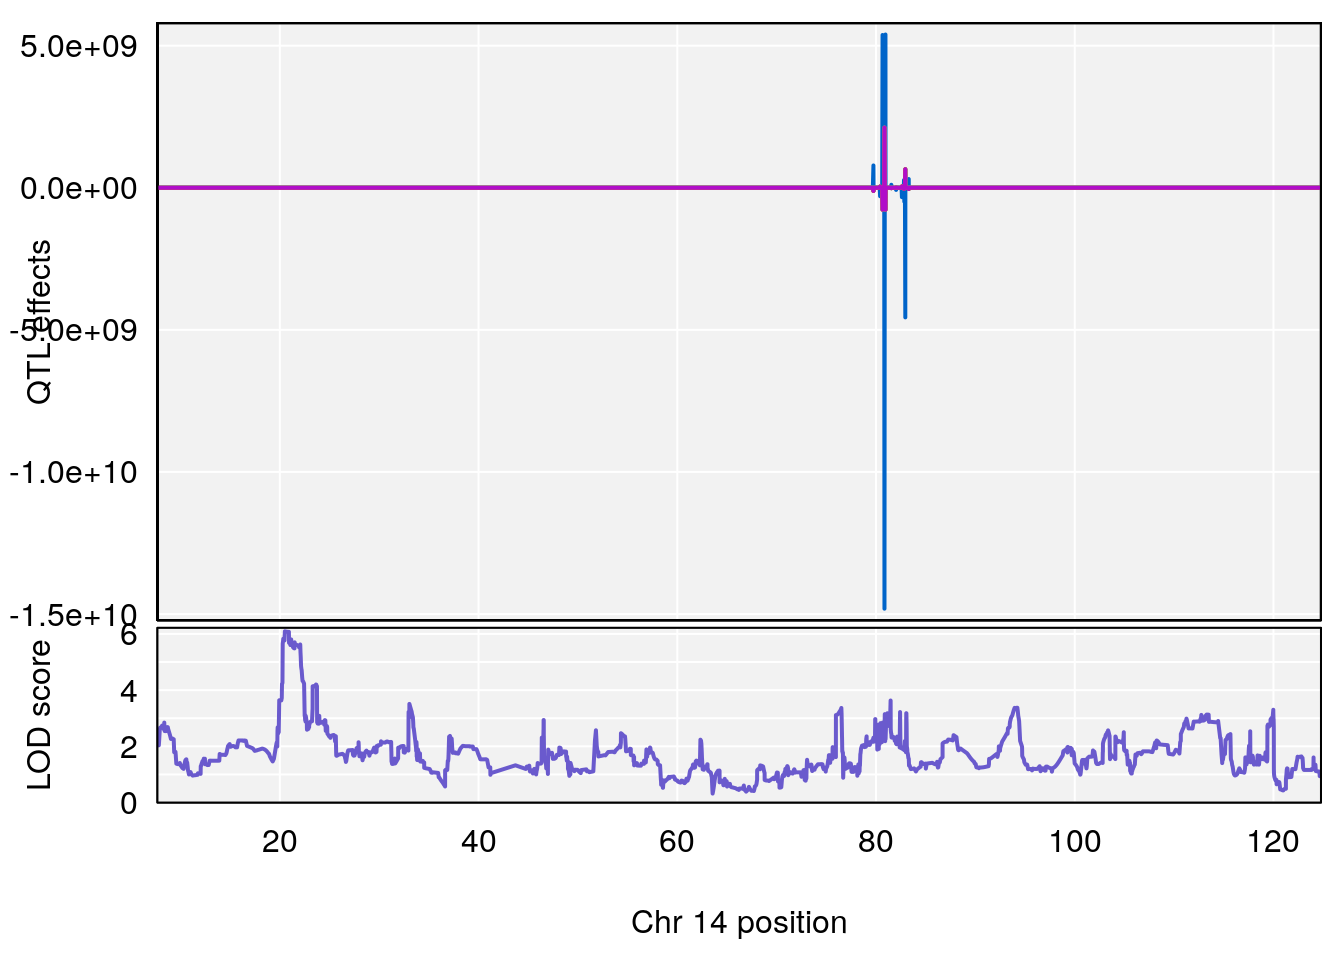
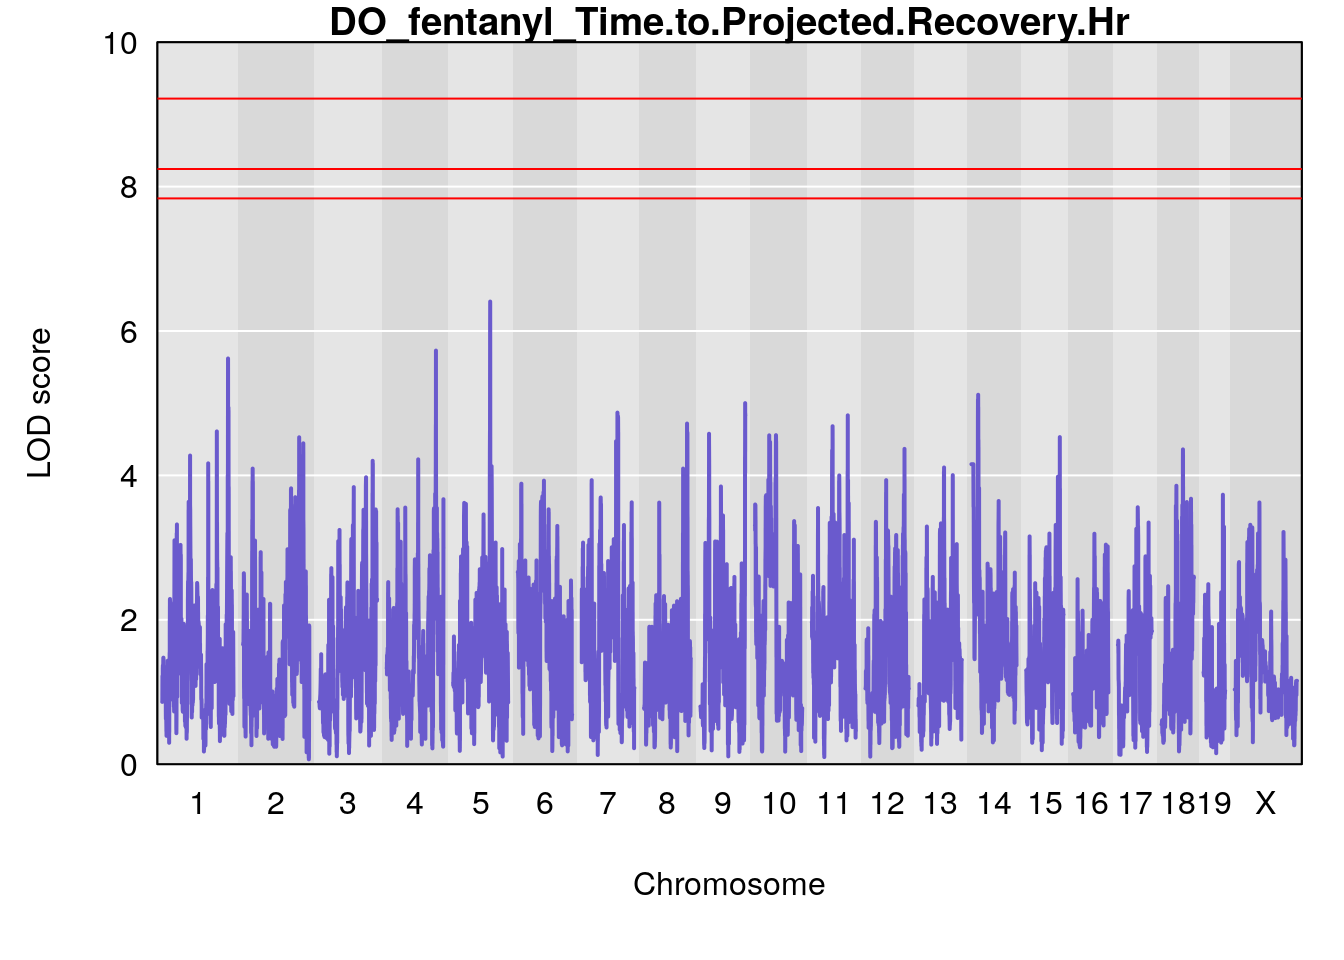
# [1] "Time.to.Projected.Recovery.Hr"
#   lodindex lodcolumn chr      pos      lod   ci_lo    ci_hi
# 1        1    pheno1   5 103.1582 6.396816 102.756 103.3132
# [1] 1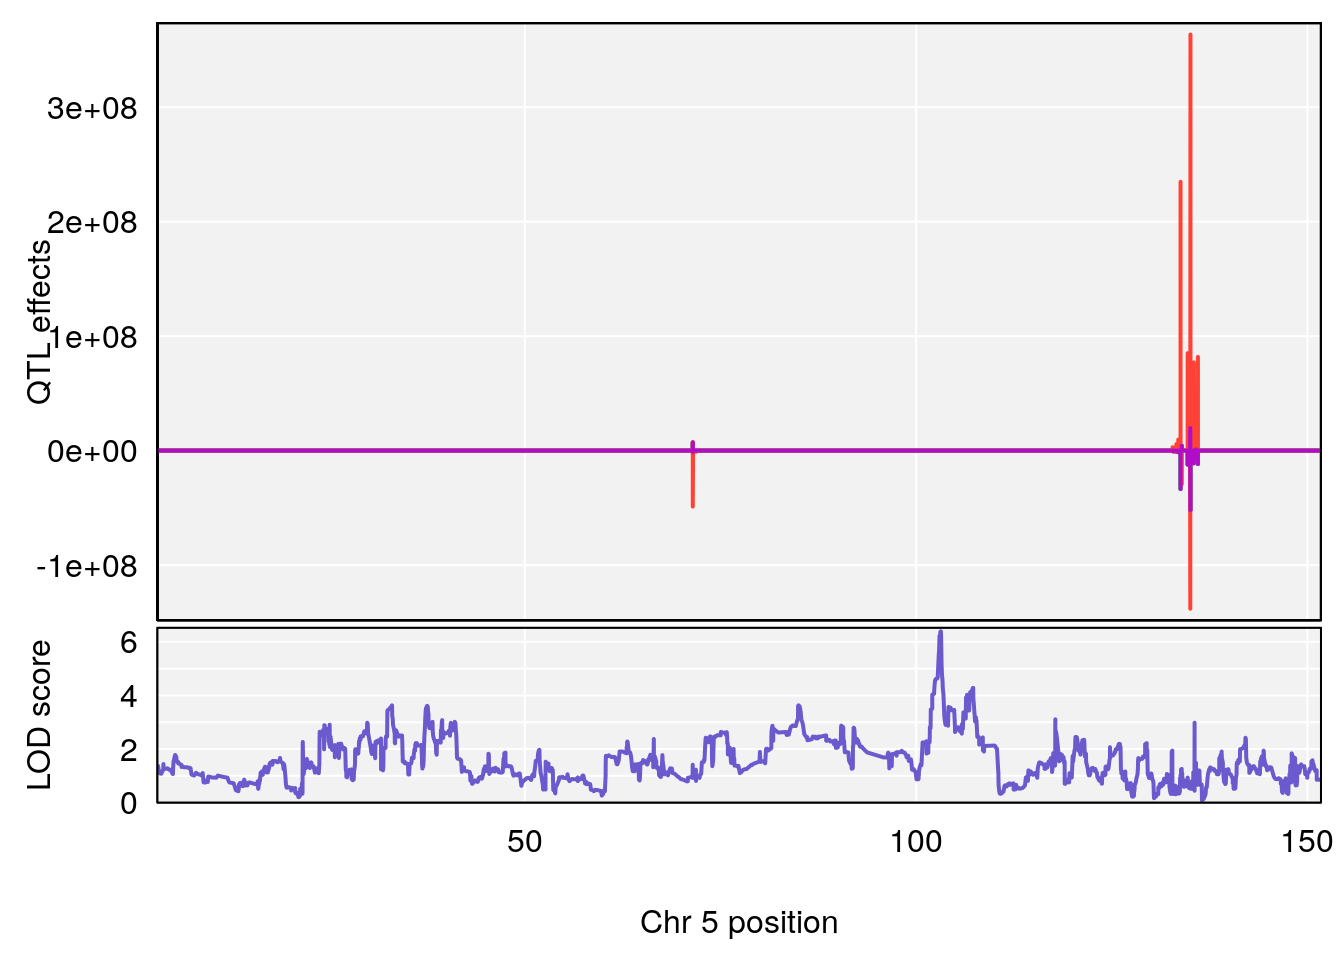
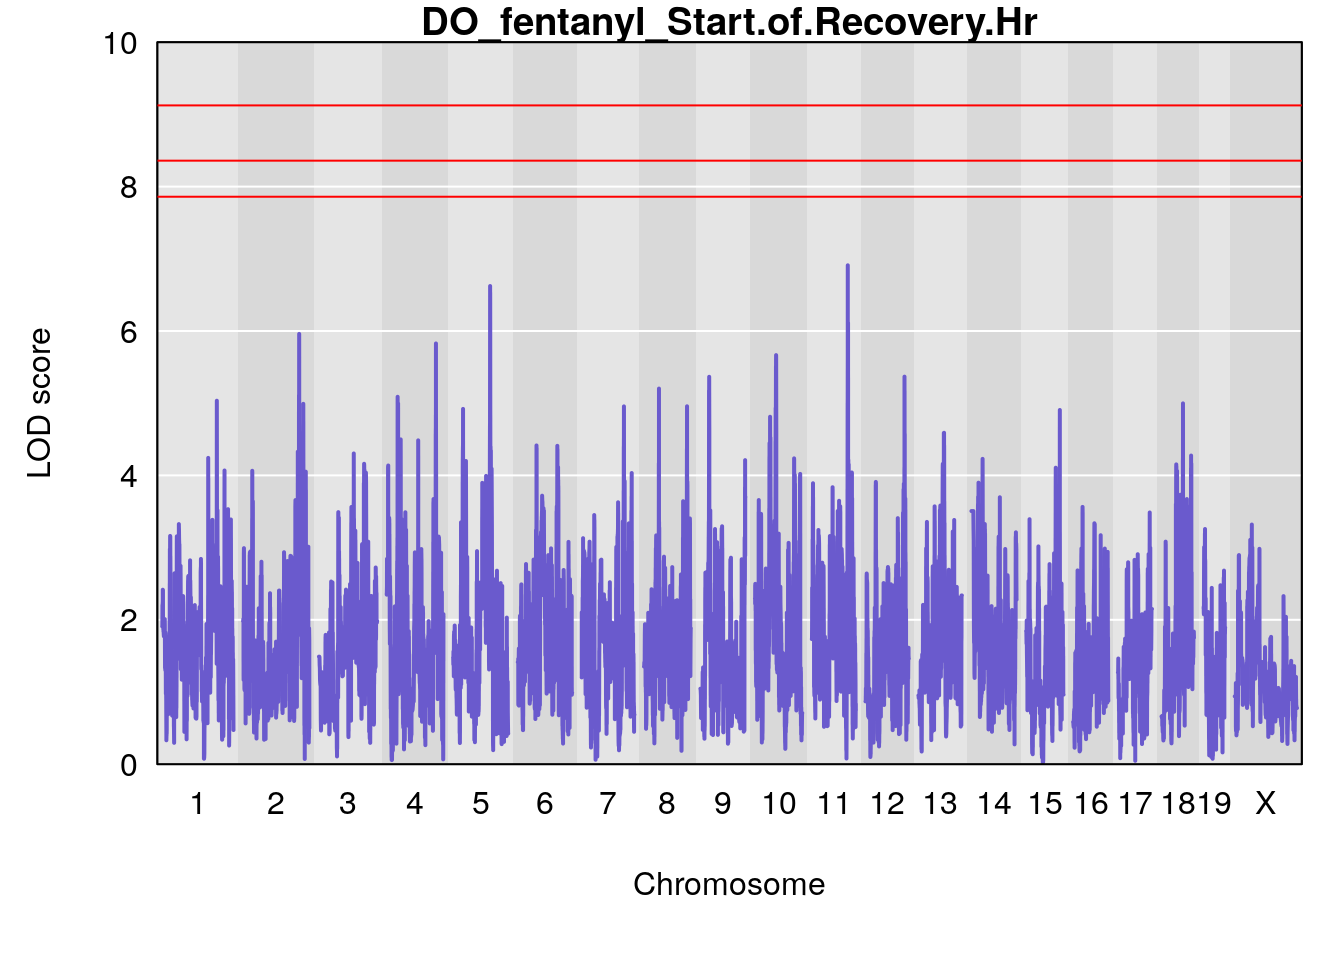
# [1] "Start.of.Recovery.Hr"
#   lodindex lodcolumn chr      pos      lod     ci_lo    ci_hi
# 1        1    pheno1   5 102.9928 6.785795 102.81969 103.3132
# 2        1    pheno1  11 100.0882 6.838855  99.91068 100.9290
# [1] 1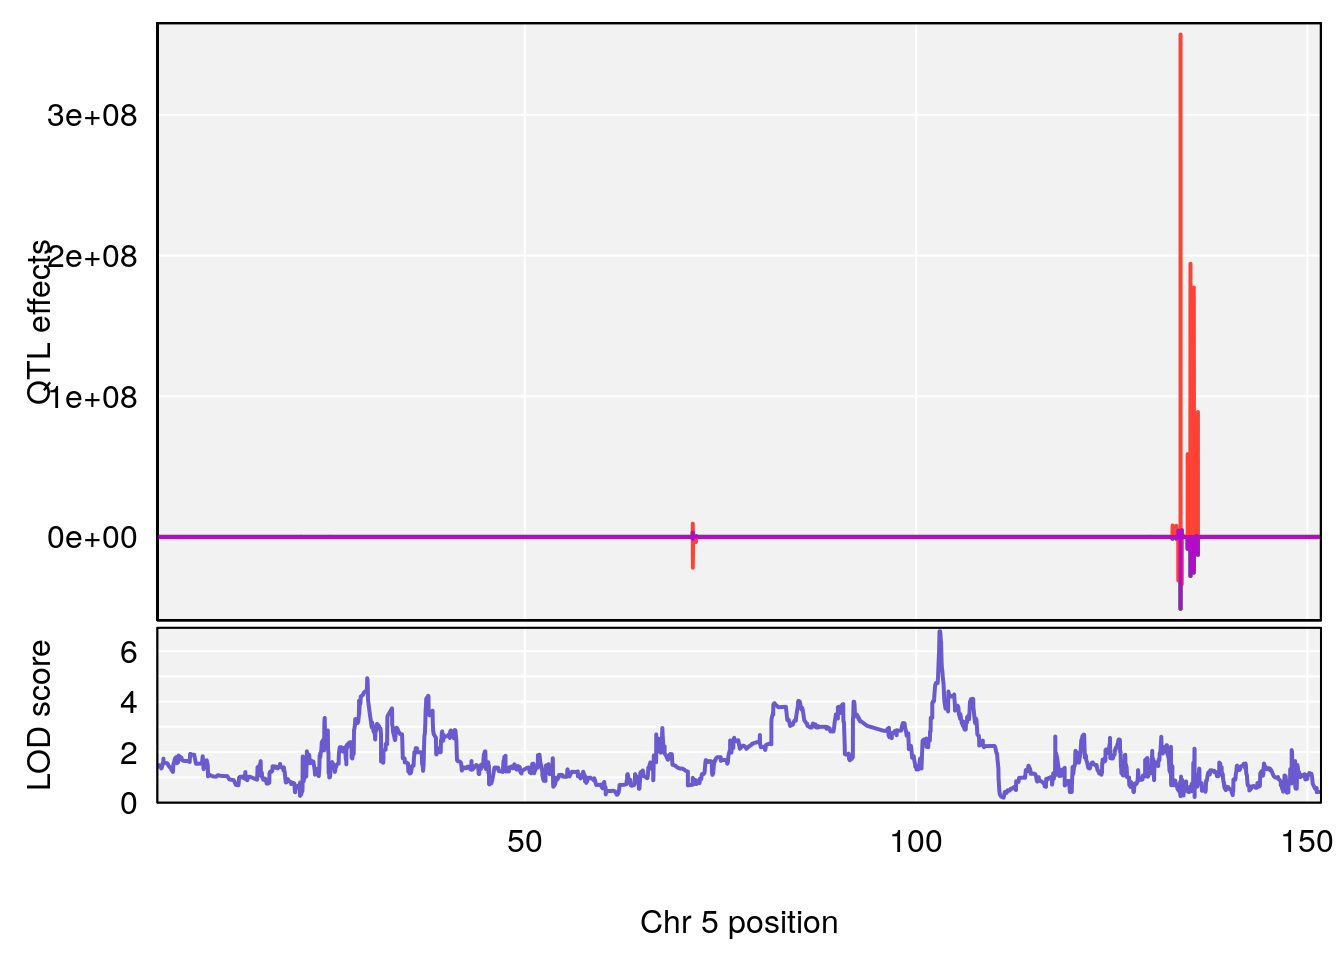
# [1] 2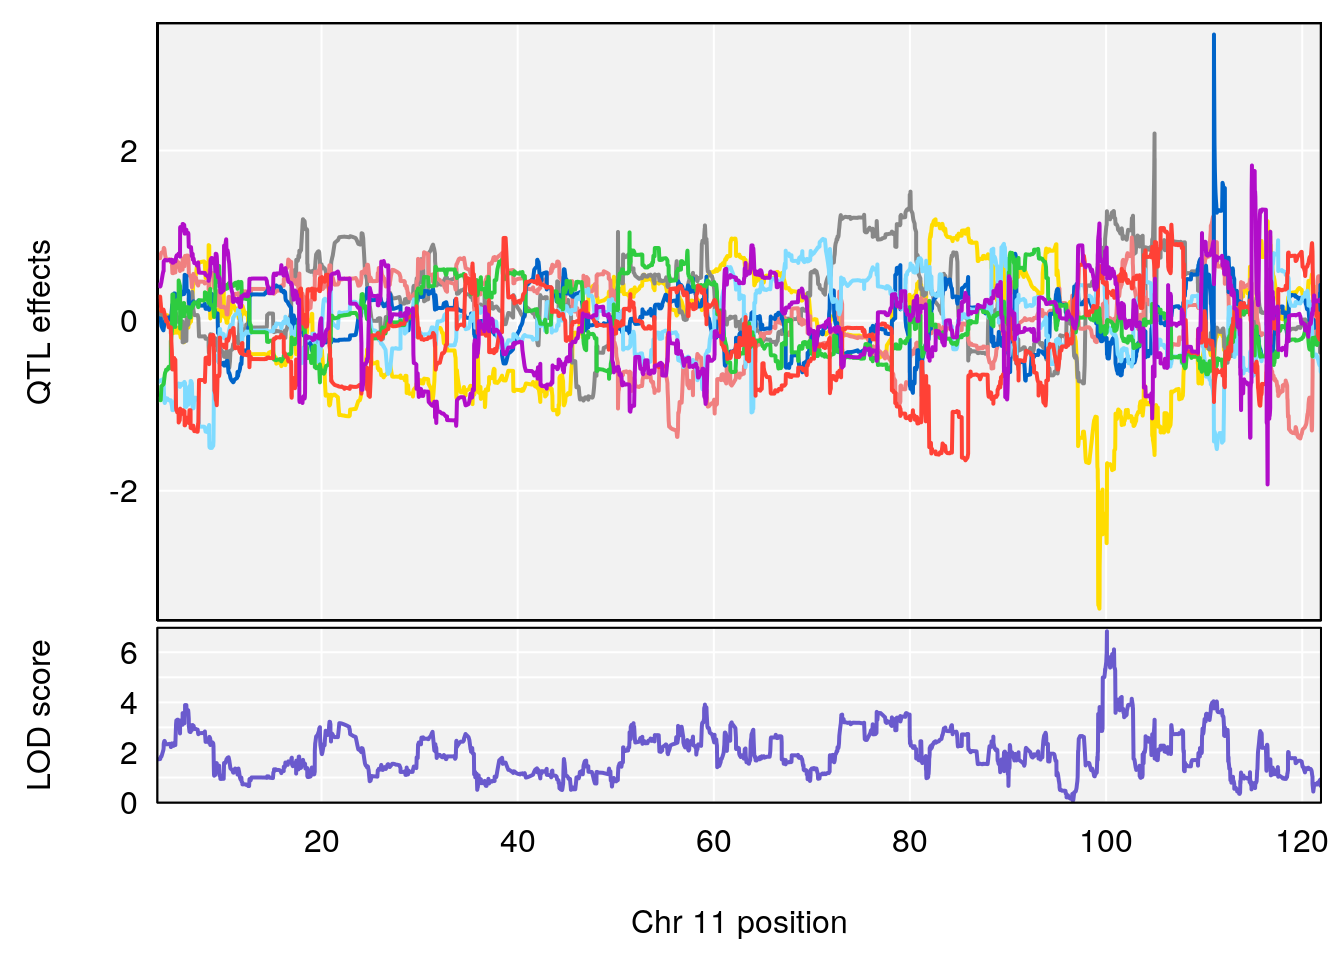
# [1] "RR.Recovery.Rate.Hr"
#   lodindex lodcolumn chr       pos      lod     ci_lo     ci_hi
# 1        1    pheno1   3 123.39203 6.459037 122.42195 131.46627
# 2        1    pheno1  14  21.13855 8.271971  20.26372  21.51874
# 3        1    pheno1  15  68.04193 6.058226  68.00208  68.45217
# [1] 1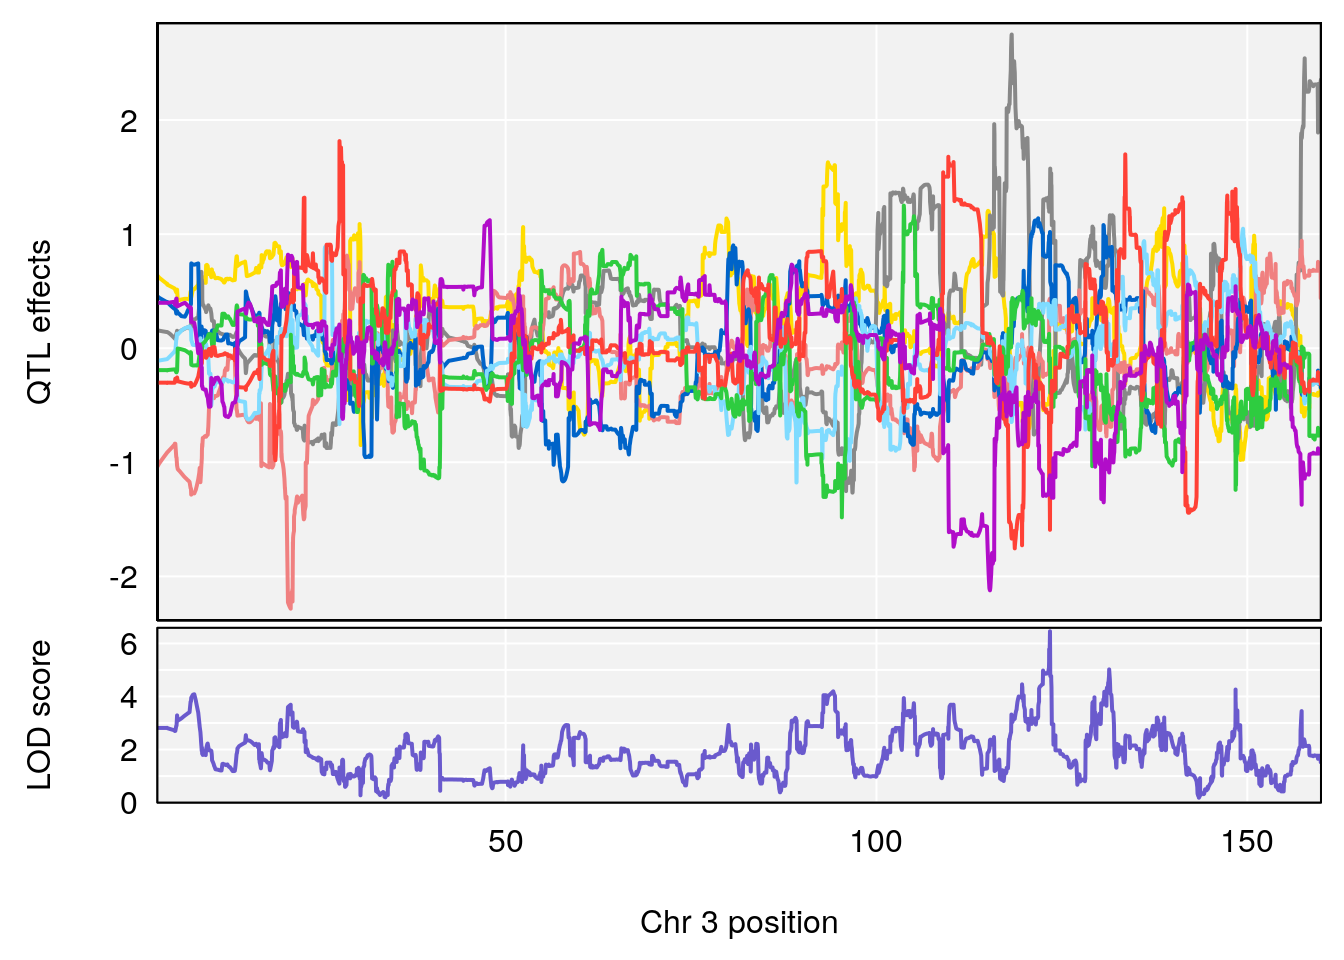
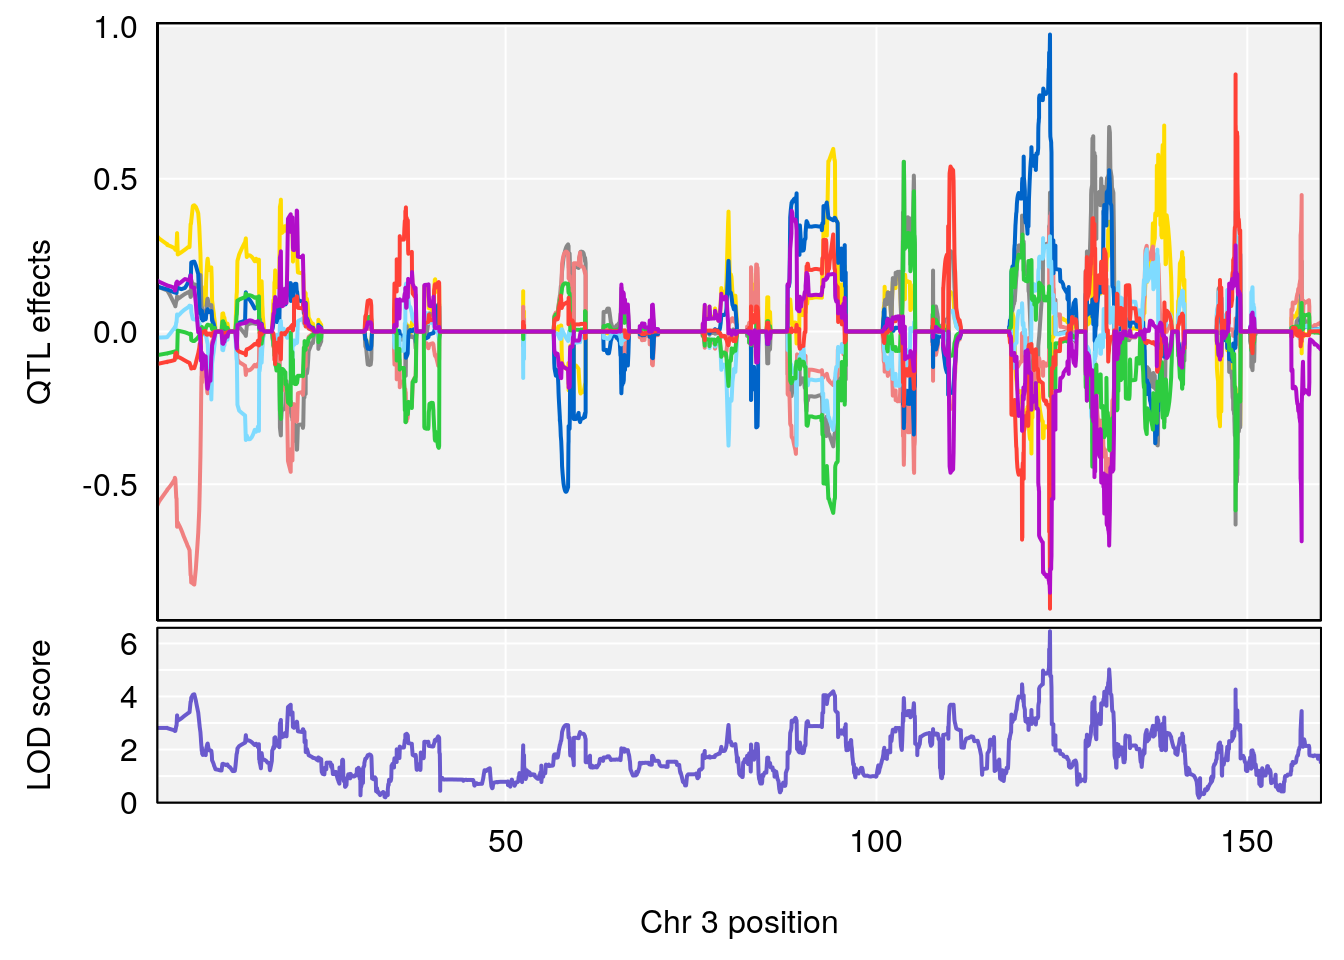
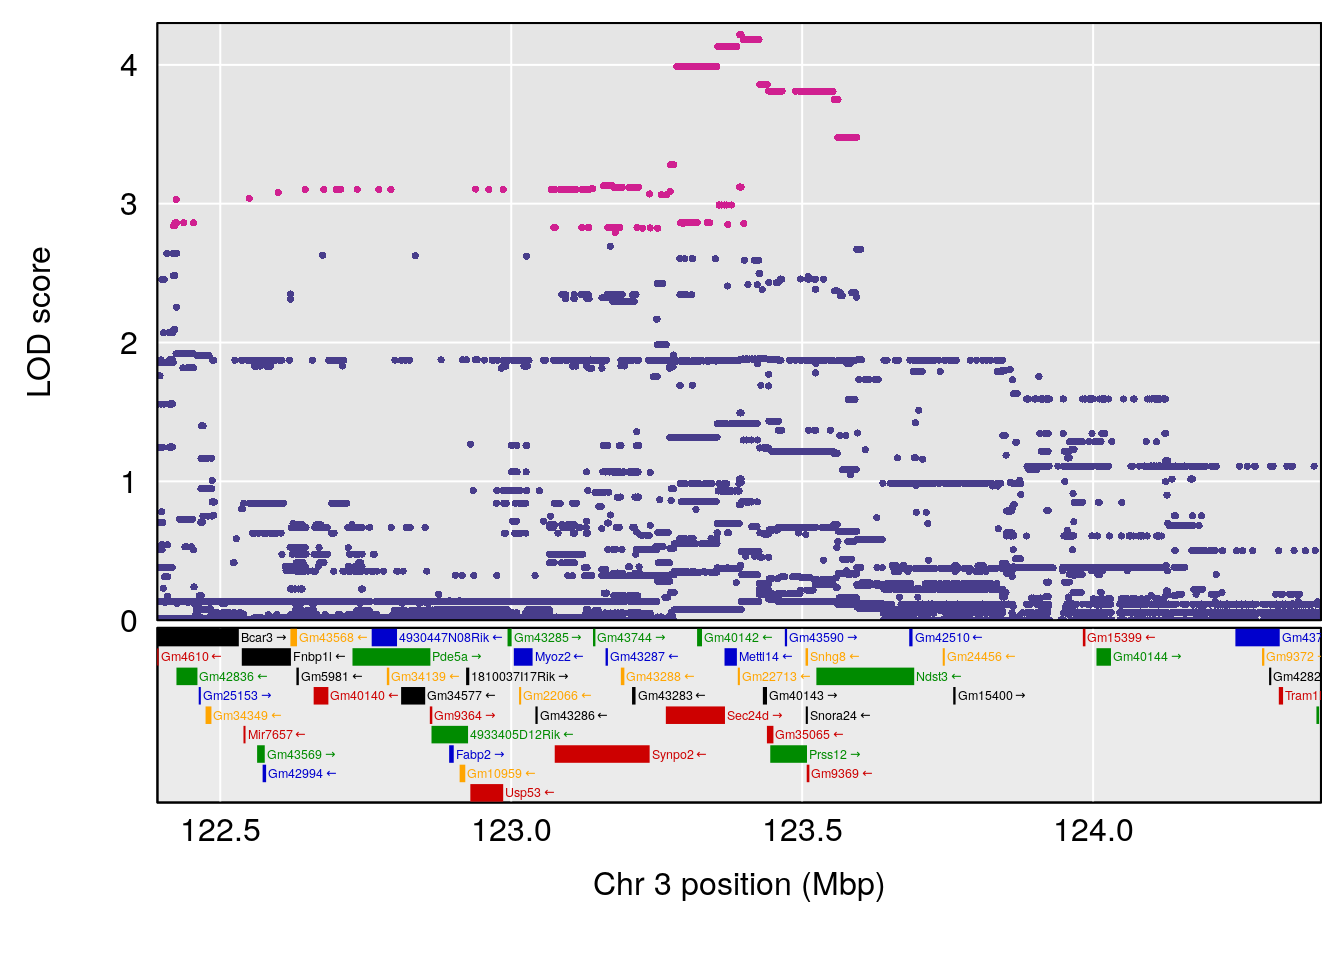
# [1] 2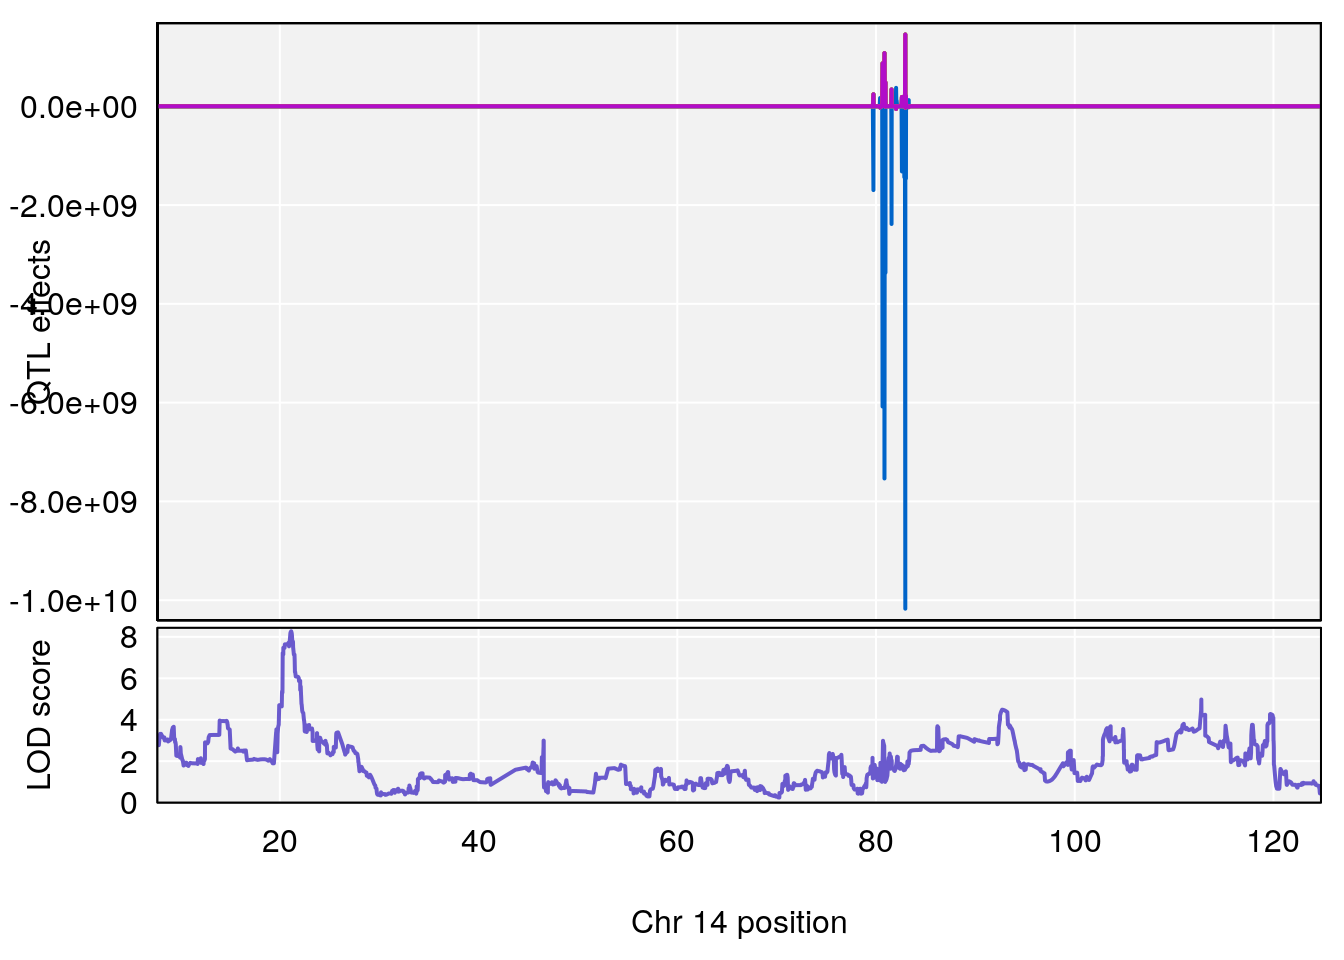
# [1] 3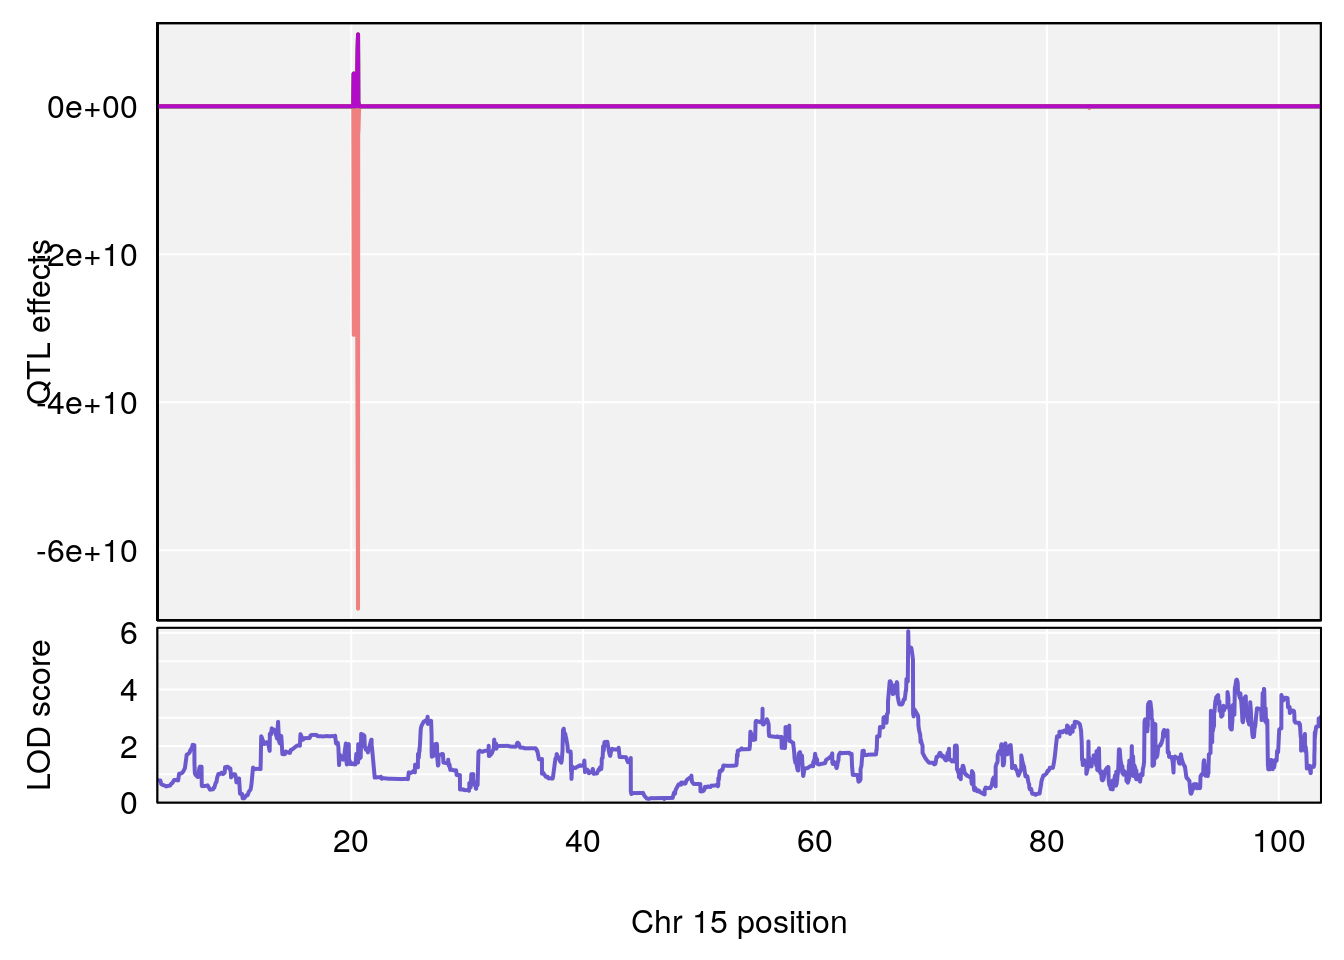
#save peaks coeff plot
for(i in names(qtl.morphine.out)){
  print(i)
  peaks <- find_peaks(qtl.morphine.out[[i]], map=gm$pmap, threshold=6, drop=1.5)
  fname <- paste("output/Fentanyl/DO_fentanyl_array_alternate_metrics_",i,"_coefplot.pdf",sep="")
  pdf(file = fname, width = 16, height =8)
  if(dim(peaks)[1] != 0){
    for(p in 1:dim(peaks)[1]) {
      print(p)
      chr <-peaks[p,3]
      #coeff plot
      par(mar=c(4.1, 4.1, 0.6, 0.6))
      plot_coefCC(coef_c1[[i]][[p]], gm$pmap[chr], scan1_output=qtl.morphine.out[[i]], bgcolor="gray95", legend=NULL)
      plot_coefCC(coef_c2[[i]][[p]], gm$pmap[chr], scan1_output=qtl.morphine.out[[i]], bgcolor="gray95", legend=NULL)
      plot(out_snps[[i]][[p]]$lod, out_snps[[i]][[p]]$snpinfo, drop_hilit=1.5, genes=out_genes[[i]][[p]])
    }
  }
  dev.off()
}
# [1] "Time.to.Dead.Hr"
# [1] 1
# [1] 2
# [1] "RR.Depression.Rate.Hr"
# [1] "Time.to.Steady.RR.Depression.Hr"
# [1] "Min.Depression.RR"
# [1] 1
# [1] 2
# [1] "Mean.Depression.BR"
# [1] 1
# [1] 2
# [1] 3
# [1] "Steady-State.Depression.Duration.Hr"
# [1] 1
# [1] 2
# [1] 3
# [1] "Time.to.Threshold.Recovery.Hr"
# [1] 1
# [1] 2
# [1] "Time.to.Projected.Recovery.Hr"
# [1] 1
# [1] "Start.of.Recovery.Hr"
# [1] 1
# [1] 2
# [1] "RR.Recovery.Rate.Hr"
# [1] 1
# [1] 2
# [1] 3

#save peaks coeff blup plot
for(i in names(qtl.morphine.out)){
  print(i)
  peaks <- find_peaks(qtl.morphine.out[[i]], map=gm$pmap, threshold=6, drop=1.5)
  fname <- paste("output/Fentanyl/DO_fentanyl_array_alternate_metrics_",i,"_coefplot_blup.pdf",sep="")
  pdf(file = fname, width = 16, height =8)
    if(dim(peaks)[1] != 0){
      for(p in 1:dim(peaks)[1]) {
        print(p)
        chr <-peaks[p,3]
        #coeff plot
        par(mar=c(4.1, 4.1, 0.6, 0.6))
        plot_coefCC(coef_c1[[i]][[p]], gm$pmap[chr], scan1_output=qtl.morphine.out[[i]], bgcolor="gray95", legend=NULL)
        plot_coefCC(coef_c2[[i]][[p]], gm$pmap[chr], scan1_output=qtl.morphine.out[[i]], bgcolor="gray95", legend=NULL)
        plot(out_snps[[i]][[p]]$lod, out_snps[[i]][[p]]$snpinfo, drop_hilit=1.5, genes=out_genes[[i]][[p]])
    }
  }
  dev.off()
}
# [1] "Time.to.Dead.Hr"
# [1] 1
# [1] 2
# [1] "RR.Depression.Rate.Hr"
# [1] "Time.to.Steady.RR.Depression.Hr"
# [1] "Min.Depression.RR"
# [1] 1
# [1] 2
# [1] "Mean.Depression.BR"
# [1] 1
# [1] 2
# [1] 3
# [1] "Steady-State.Depression.Duration.Hr"
# [1] 1
# [1] 2
# [1] 3
# [1] "Time.to.Threshold.Recovery.Hr"
# [1] 1
# [1] 2
# [1] "Time.to.Projected.Recovery.Hr"
# [1] 1
# [1] "Start.of.Recovery.Hr"
# [1] 1
# [1] 2
# [1] "RR.Recovery.Rate.Hr"
# [1] 1
# [1] 2
# [1] 3
###Plot qtl mapping on 69K
load("output/Fentanyl/qtl.fentanyl.69k.alternate.metrics.out.RData")
#pmap and gmap
load("data/69k_grid_pgmap.RData")
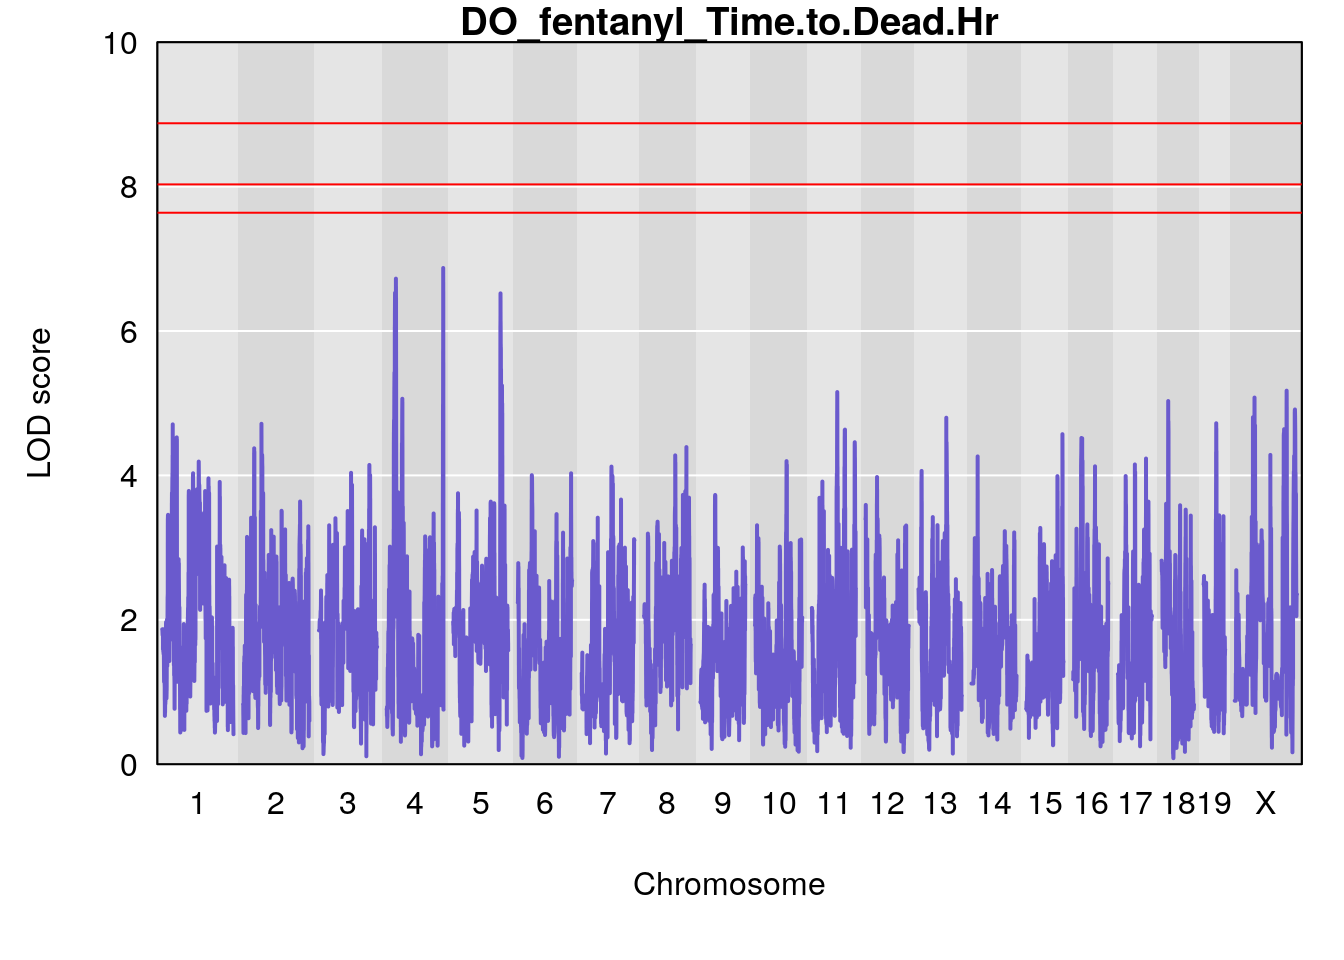
#genome-wide plot
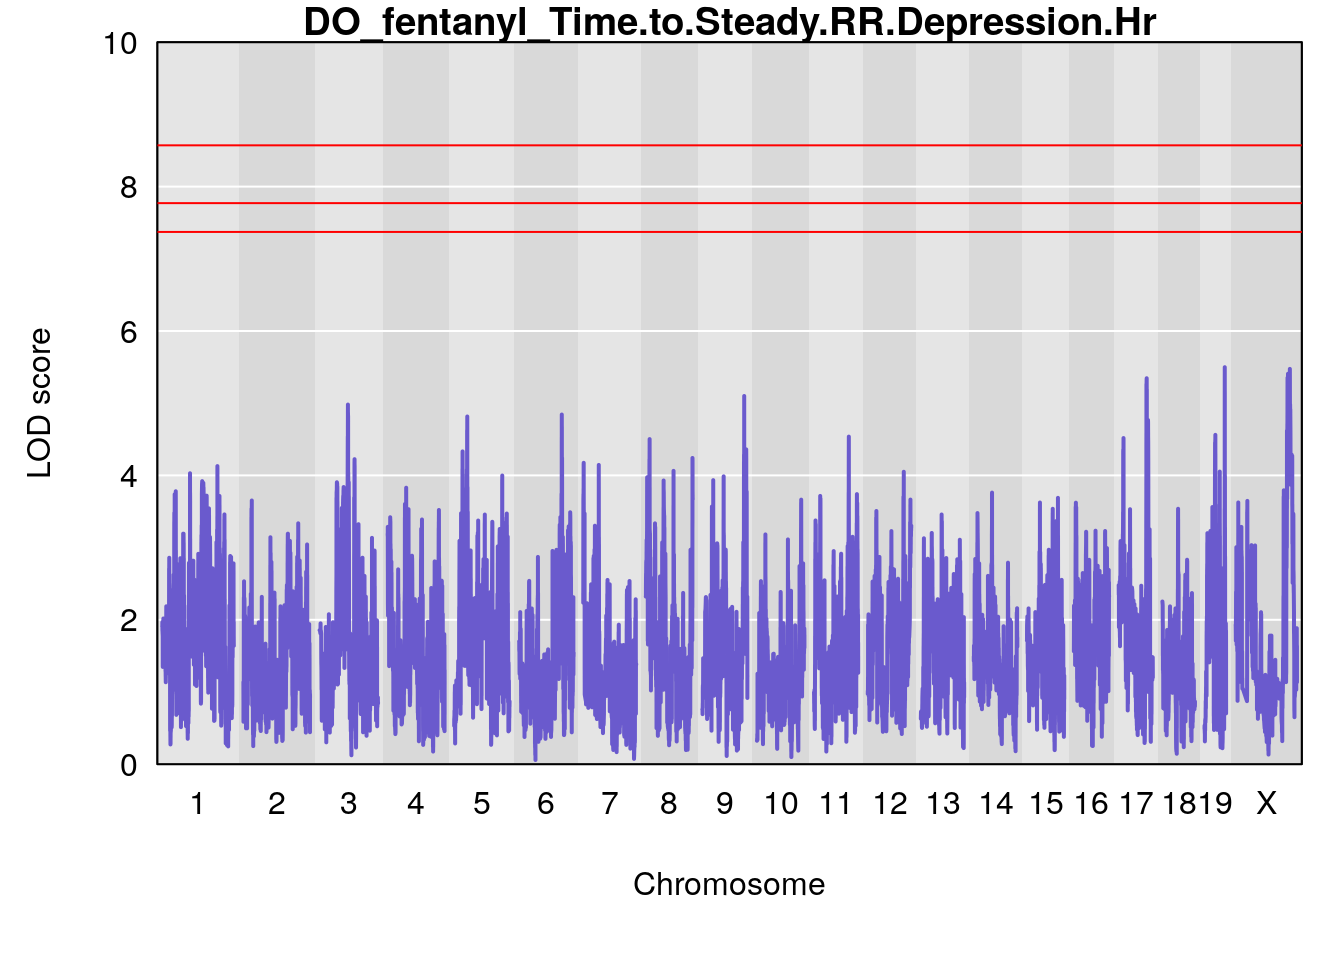
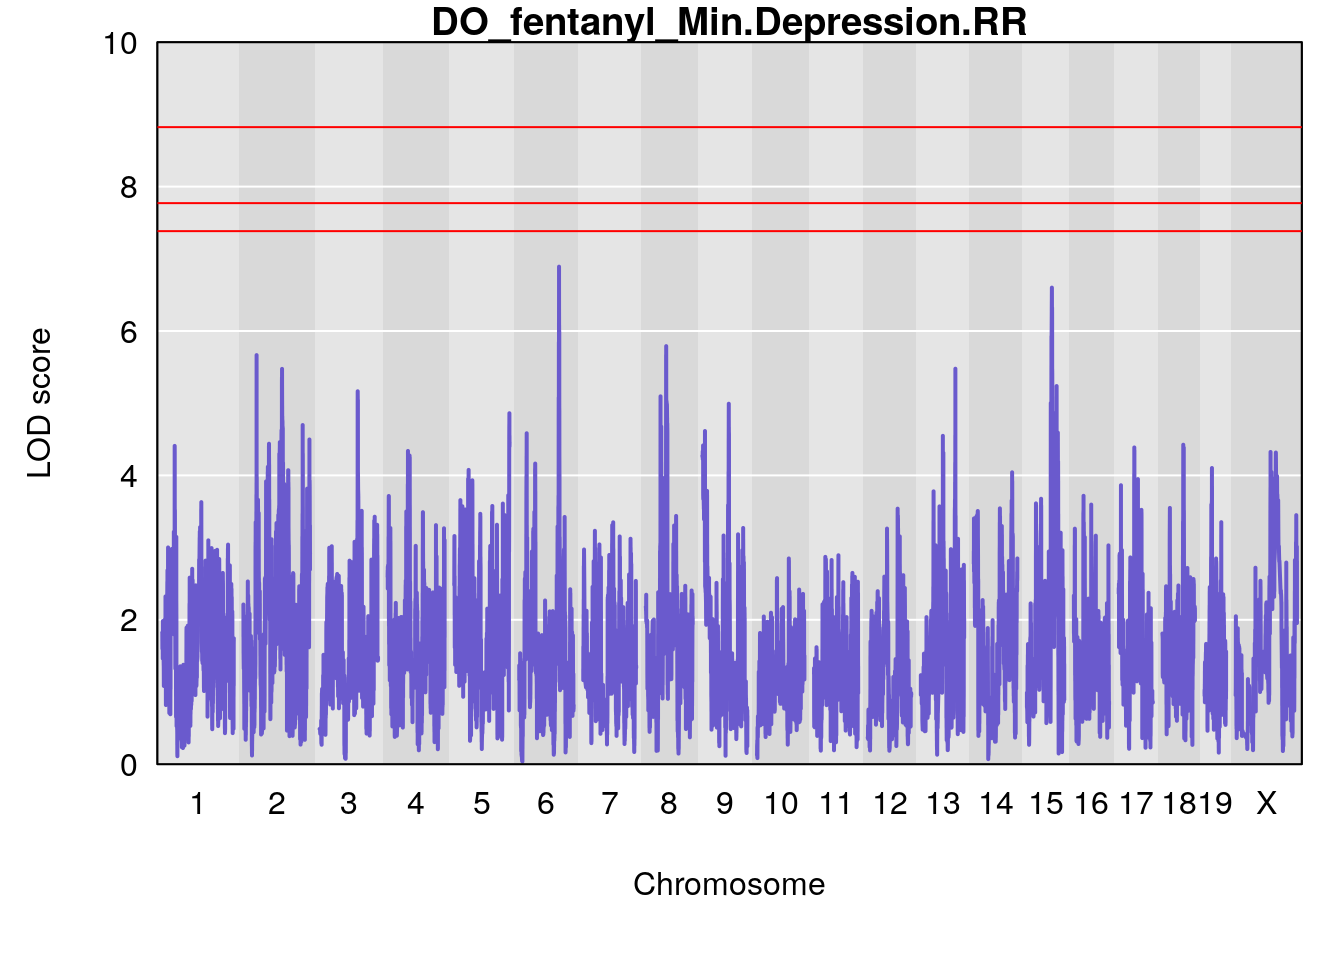
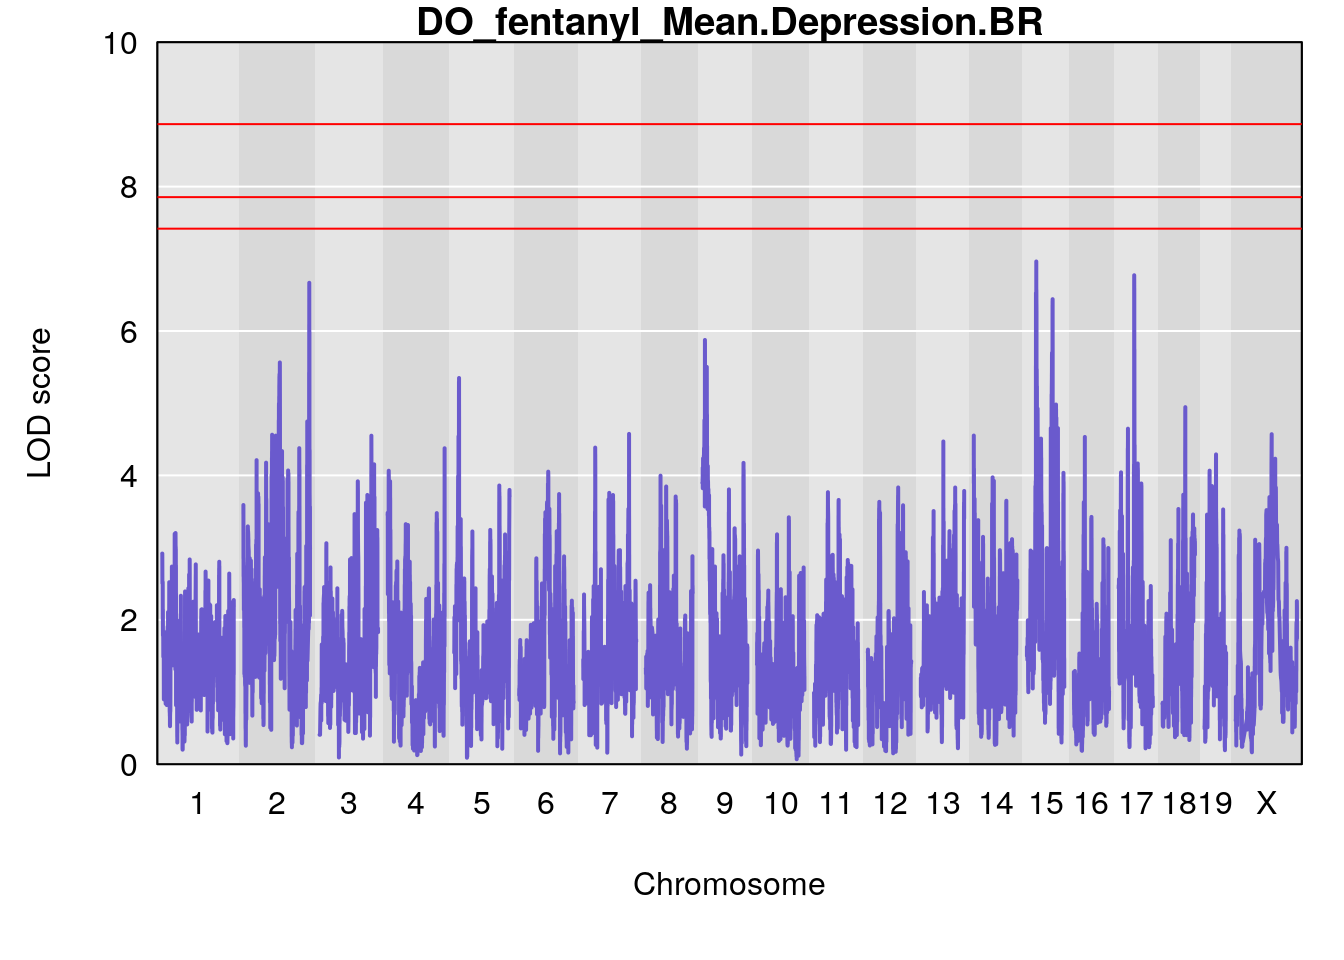
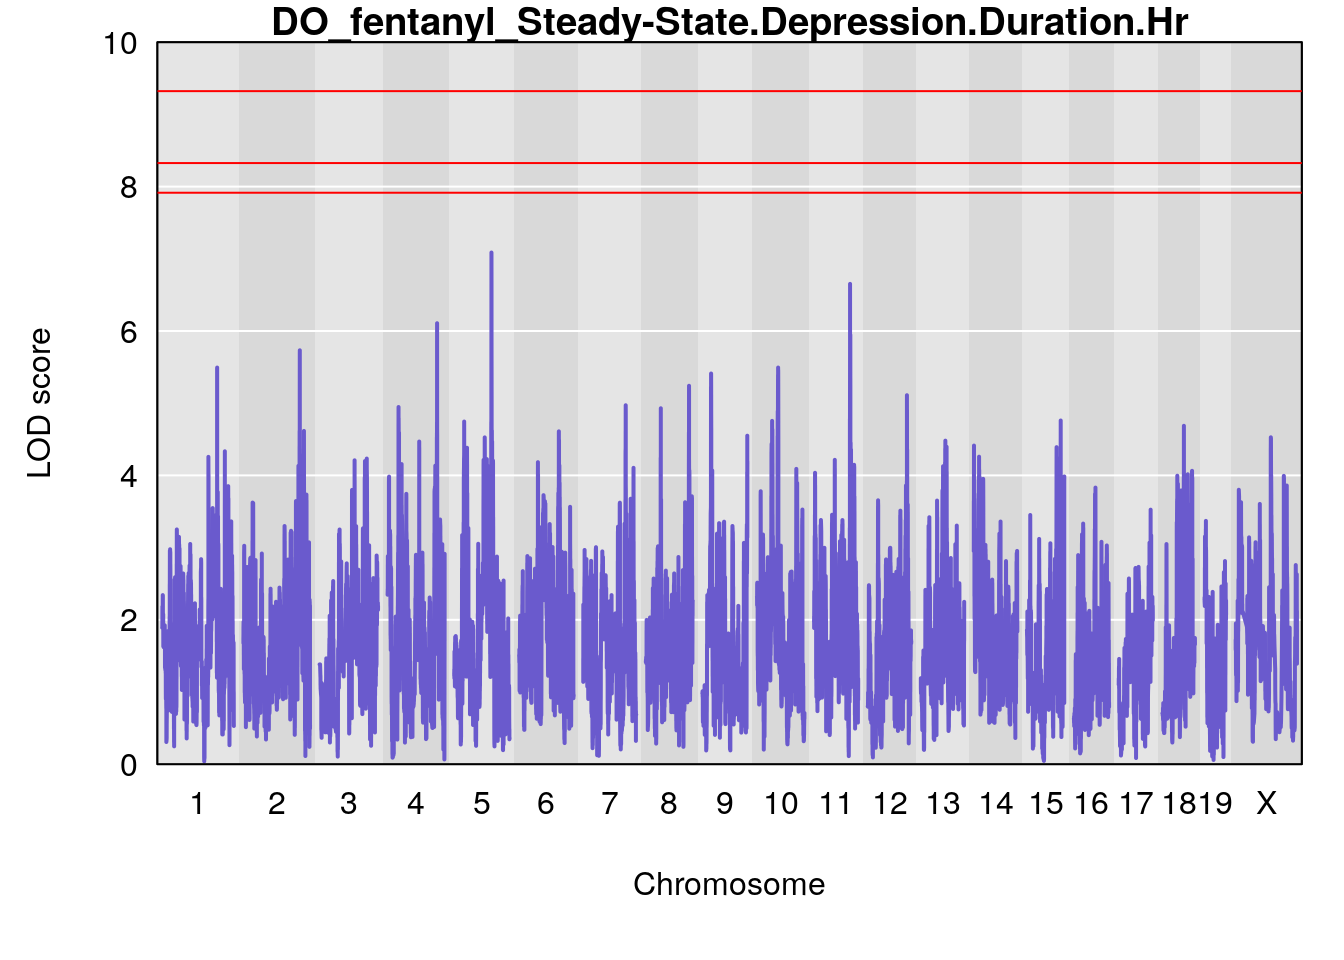
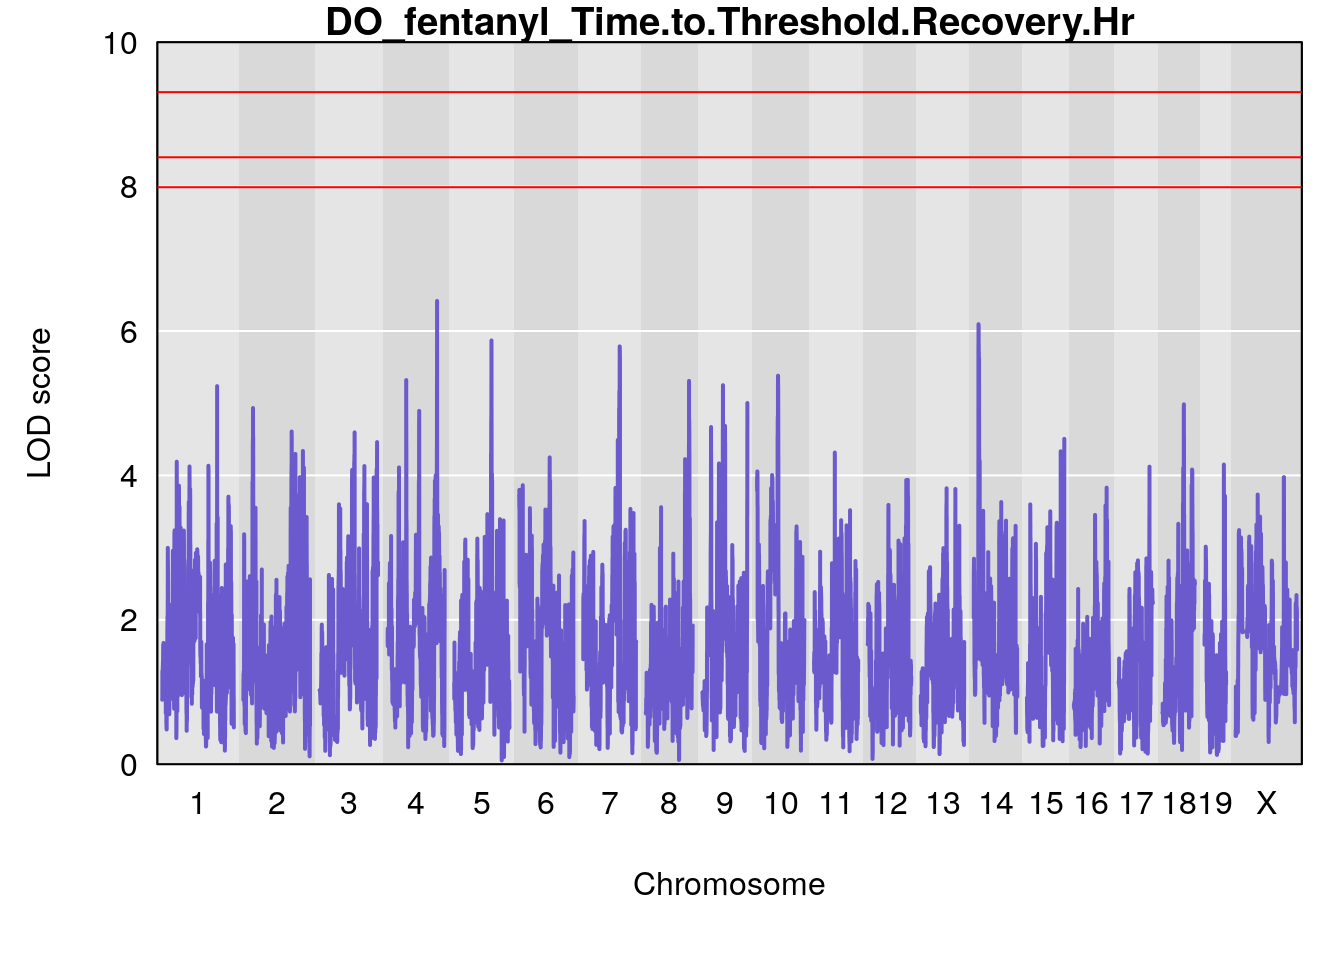
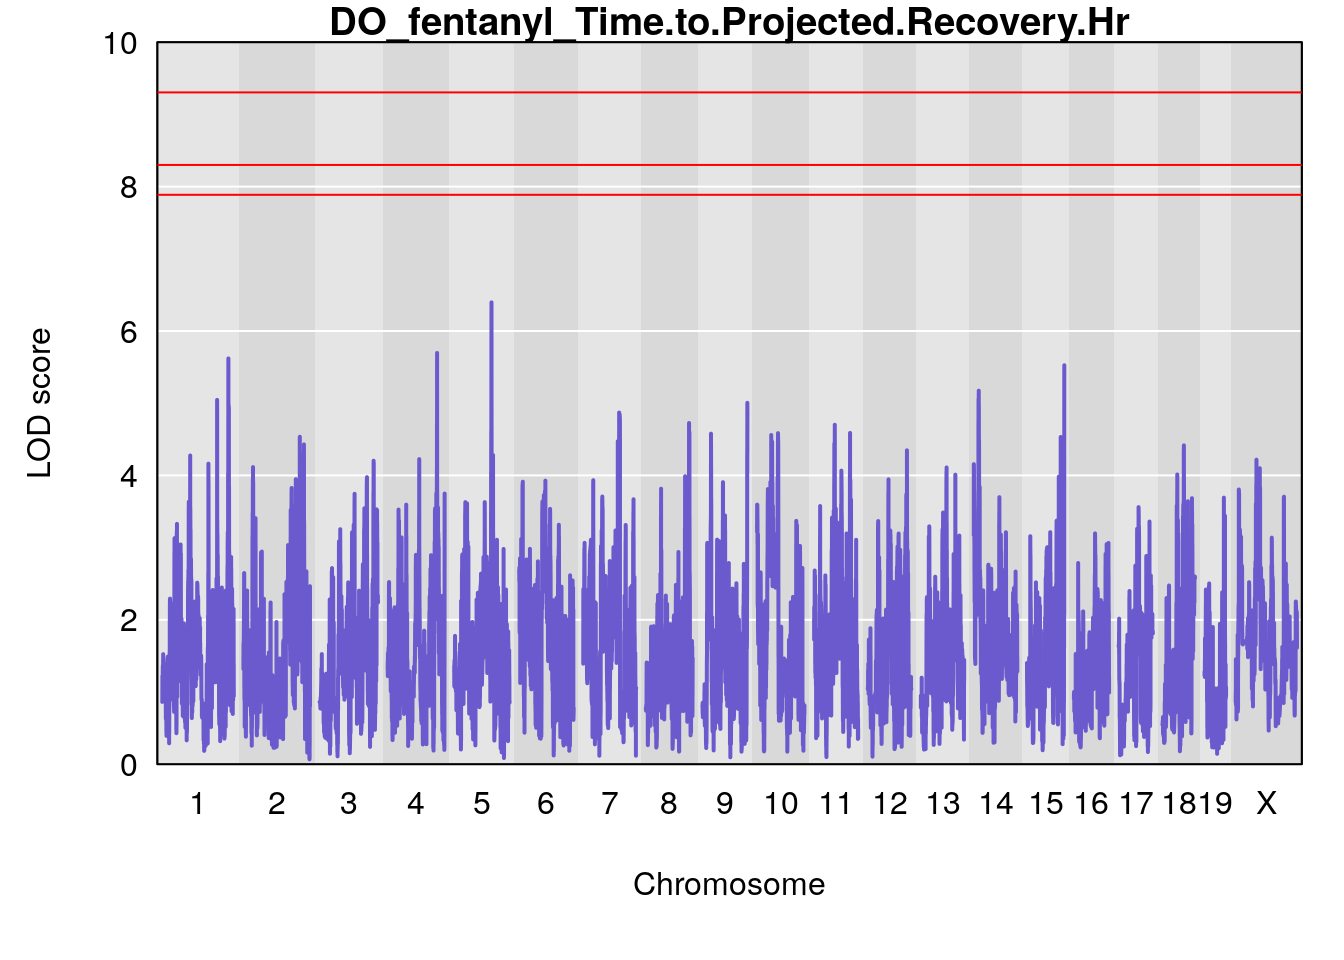
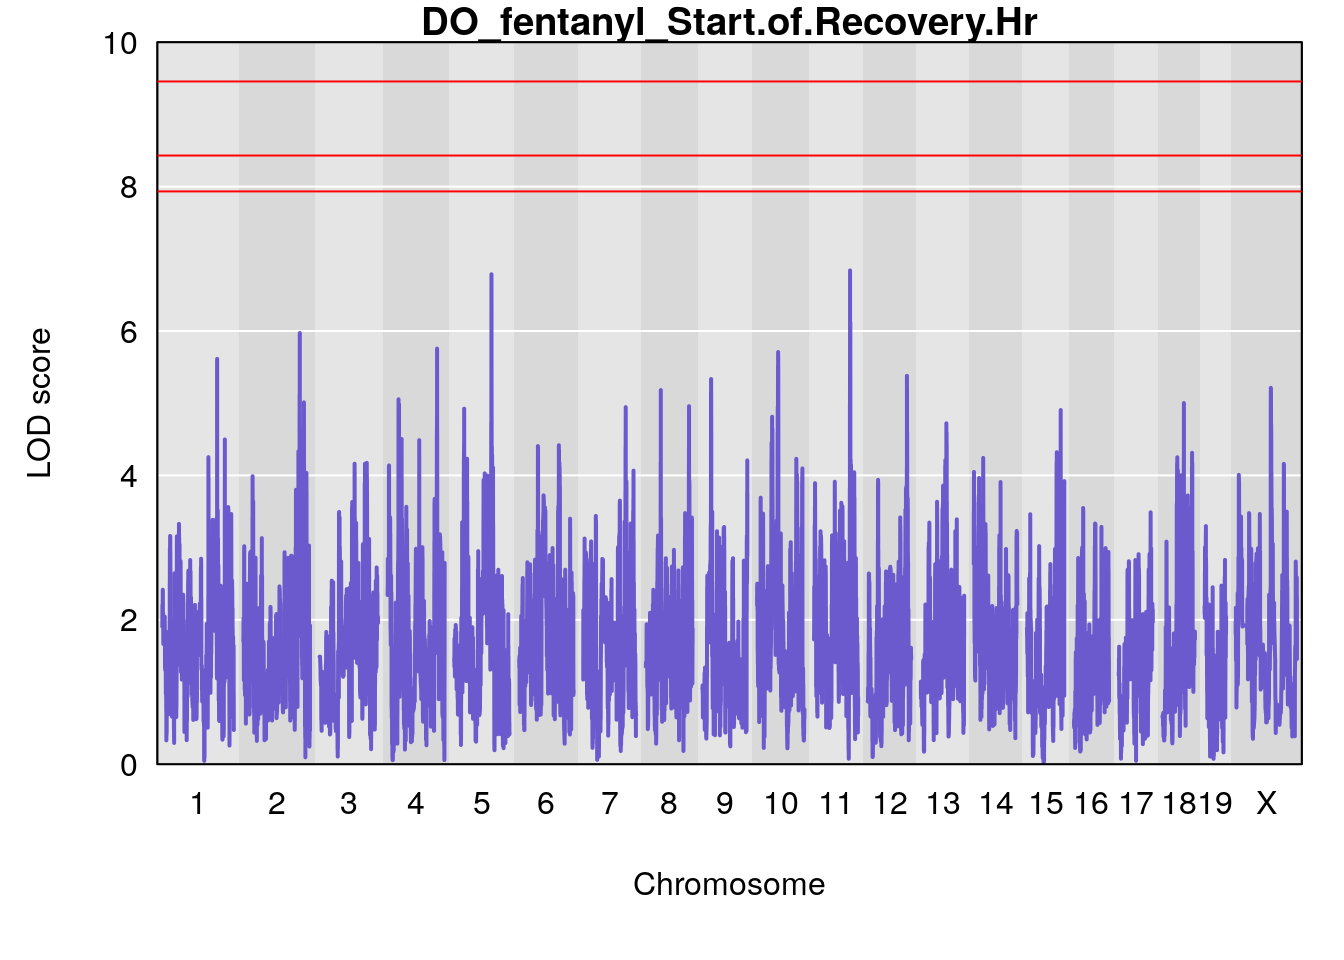
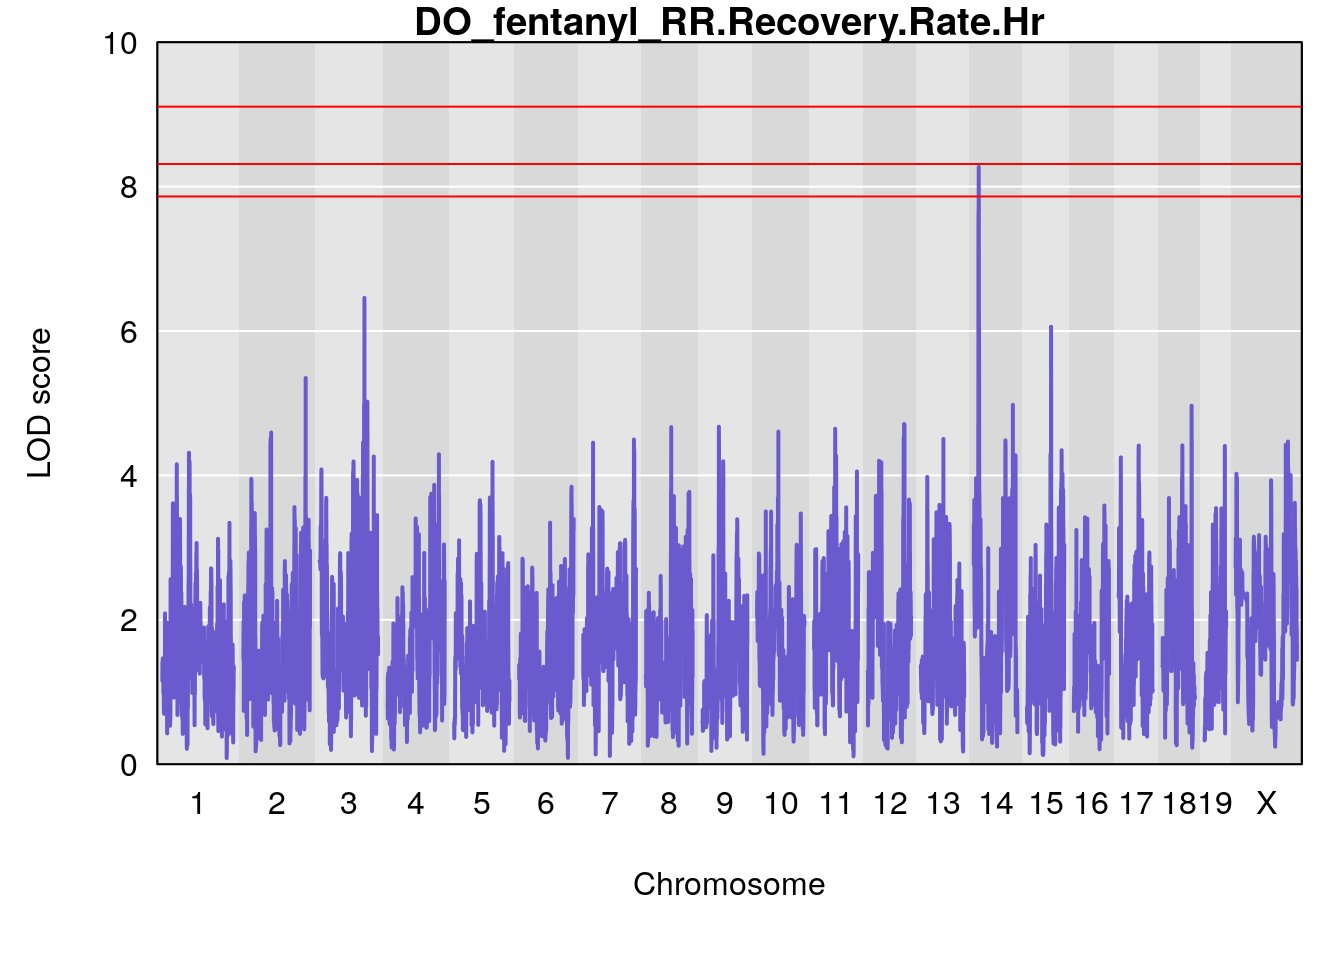
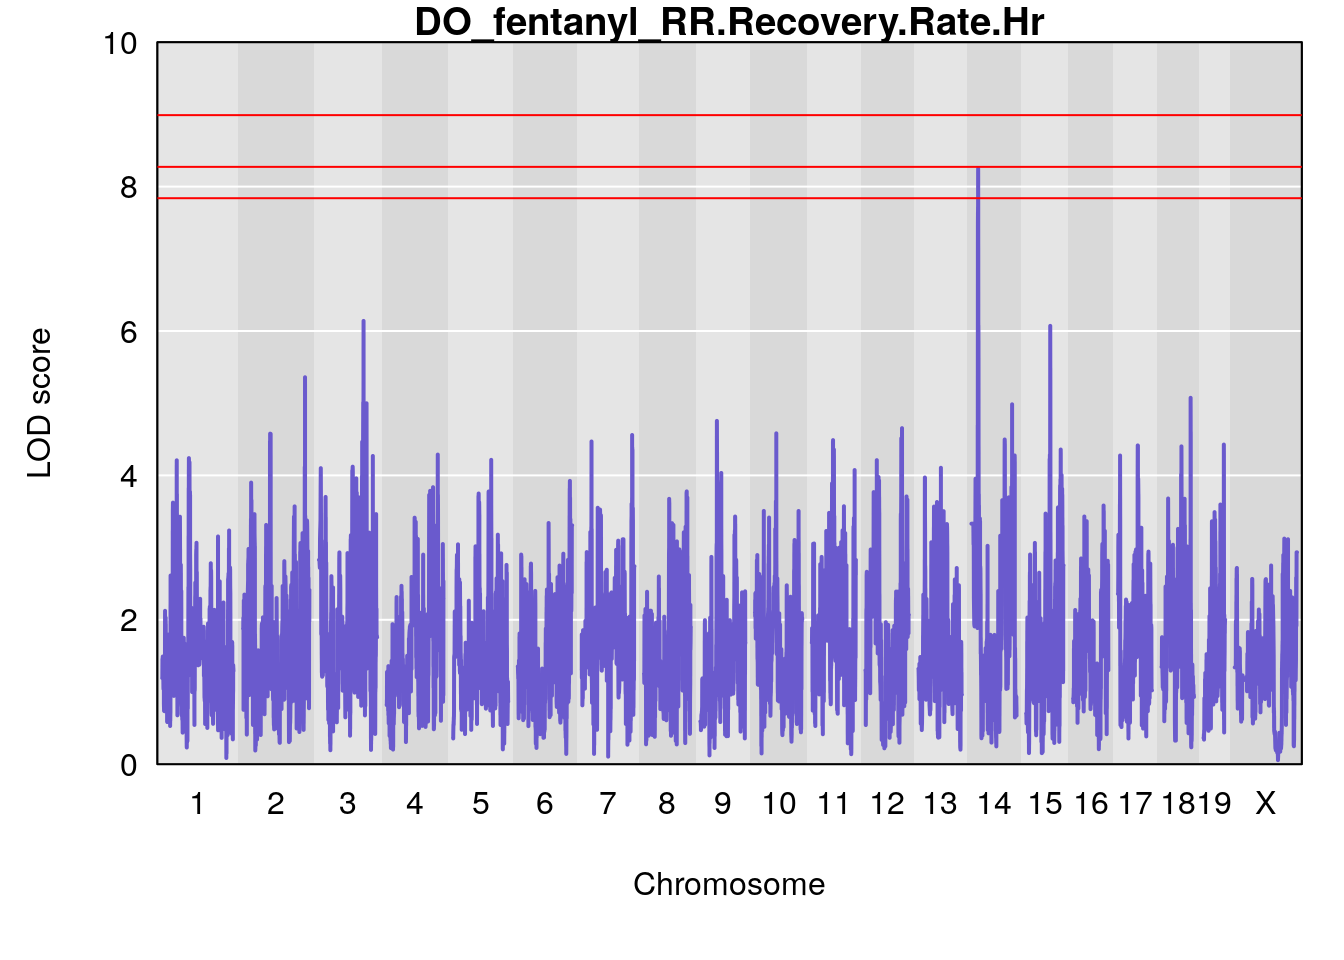
for(i in names(qtl.morphine.out)){
par(mar=c(5.1, 4.1, 1.1, 1.1))
ymx <- maxlod(qtl.morphine.out[[i]]) # overall maximum LOD score
plot(qtl.morphine.out[[i]], map=pmap, lodcolumn=1, col="slateblue", ylim=c(0, 10))
abline(h=summary(qtl.morphine.operm[[i]], alpha=c(0.10, 0.05, 0.01))[[1]], col="red")
abline(h=summary(qtl.morphine.operm[[i]], alpha=c(0.10, 0.05, 0.01))[[2]], col="red")
abline(h=summary(qtl.morphine.operm[[i]], alpha=c(0.10, 0.05, 0.01))[[3]], col="red")
title(main = paste0("DO_fentanyl_",i))
}
| Version | Author | Date |
|---|---|---|
| f412738 | xhyuo | 2021-12-20 |
| Version | Author | Date |
|---|---|---|
| f412738 | xhyuo | 2021-12-20 |
| Version | Author | Date |
|---|---|---|
| f412738 | xhyuo | 2021-12-20 |
| Version | Author | Date |
|---|---|---|
| f412738 | xhyuo | 2021-12-20 |
| Version | Author | Date |
|---|---|---|
| f412738 | xhyuo | 2021-12-20 |
| Version | Author | Date |
|---|---|---|
| f412738 | xhyuo | 2021-12-20 |
| Version | Author | Date |
|---|---|---|
| f412738 | xhyuo | 2021-12-20 |
| Version | Author | Date |
|---|---|---|
| f412738 | xhyuo | 2021-12-20 |
| Version | Author | Date |
|---|---|---|
| f412738 | xhyuo | 2021-12-20 |
| Version | Author | Date |
|---|---|---|
| f412738 | xhyuo | 2021-12-20 |
#save genome-wide plot
for(i in names(qtl.morphine.out)){
png(file = paste0("output/Fentanyl/DO_fentanyl_69k_alternate_metrics_", i, ".png"), width = 16, height =8, res=300, units = "in")
par(mar=c(5.1, 4.1, 1.1, 1.1))
ymx <- maxlod(qtl.morphine.out[[i]]) # overall maximum LOD score
plot(qtl.morphine.out[[i]], map=pmap, lodcolumn=1, col="slateblue", ylim=c(0, 10))
abline(h=summary(qtl.morphine.operm[[i]], alpha=c(0.10, 0.05, 0.01))[[1]], col="red")
abline(h=summary(qtl.morphine.operm[[i]], alpha=c(0.10, 0.05, 0.01))[[2]], col="red")
abline(h=summary(qtl.morphine.operm[[i]], alpha=c(0.10, 0.05, 0.01))[[3]], col="red")
title(main = paste0("DO_fentanyl_",i))
dev.off()
}
#peaks coeff plot
for(i in names(qtl.morphine.out)){
print(i)
peaks <- find_peaks(qtl.morphine.out[[i]], map=pmap, threshold=6, drop=1.5)
print(peaks)
if(dim(peaks)[1] != 0){
for(p in 1:dim(peaks)[1]) {
print(p)
chr <-peaks[p,3]
#coeff plot
par(mar=c(4.1, 4.1, 0.6, 0.6))
plot_coefCC(coef_c1[[i]][[p]], pmap[chr], scan1_output=qtl.morphine.out[[i]], bgcolor="gray95", legend=NULL)
plot_coefCC(coef_c2[[i]][[p]], pmap[chr], scan1_output=qtl.morphine.out[[i]], bgcolor="gray95", legend=NULL)
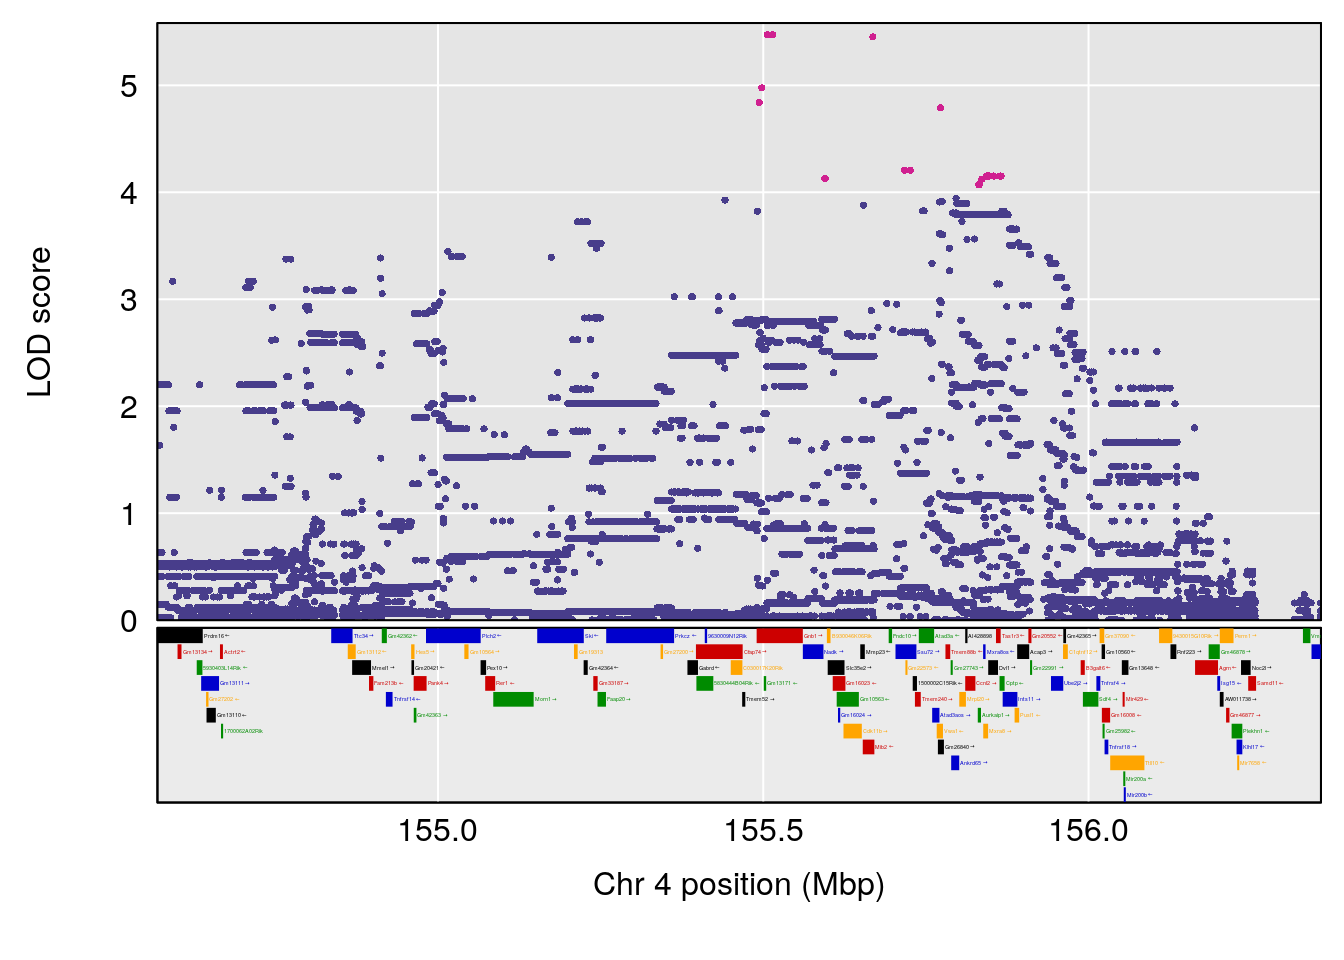
plot(out_snps[[i]][[p]]$lod, out_snps[[i]][[p]]$snpinfo, drop_hilit=1.5, genes=out_genes[[i]][[p]])
}
}
}
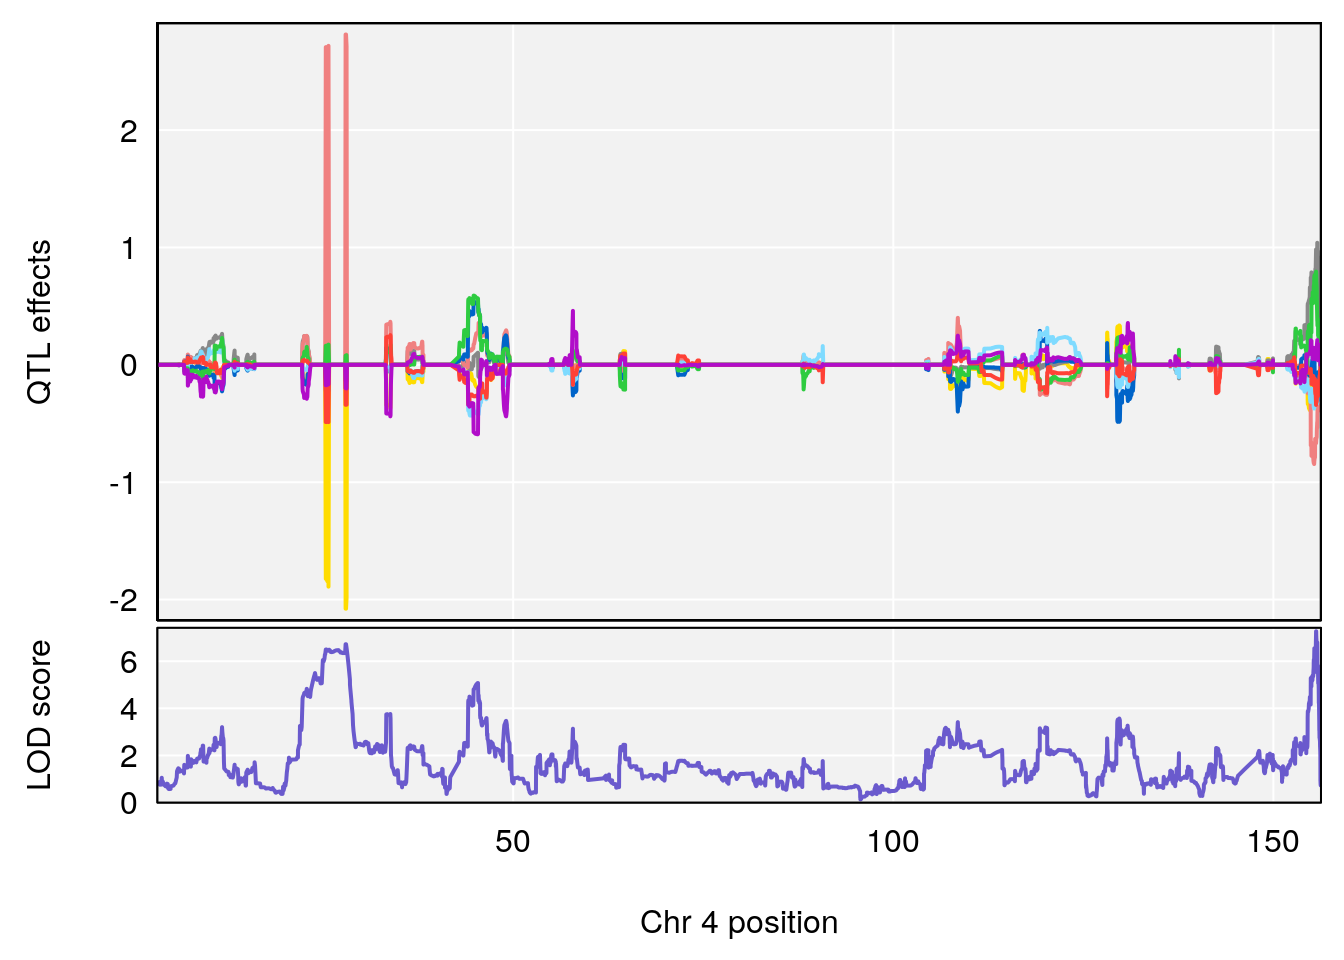
# [1] "Time.to.Dead.Hr"
# lodindex lodcolumn chr pos lod ci_lo ci_hi
# 1 1 pheno1 4 155.5686 6.872808 23.78901 155.8905
# 2 1 pheno1 5 130.9623 6.521364 130.41268 135.0559
# [1] 1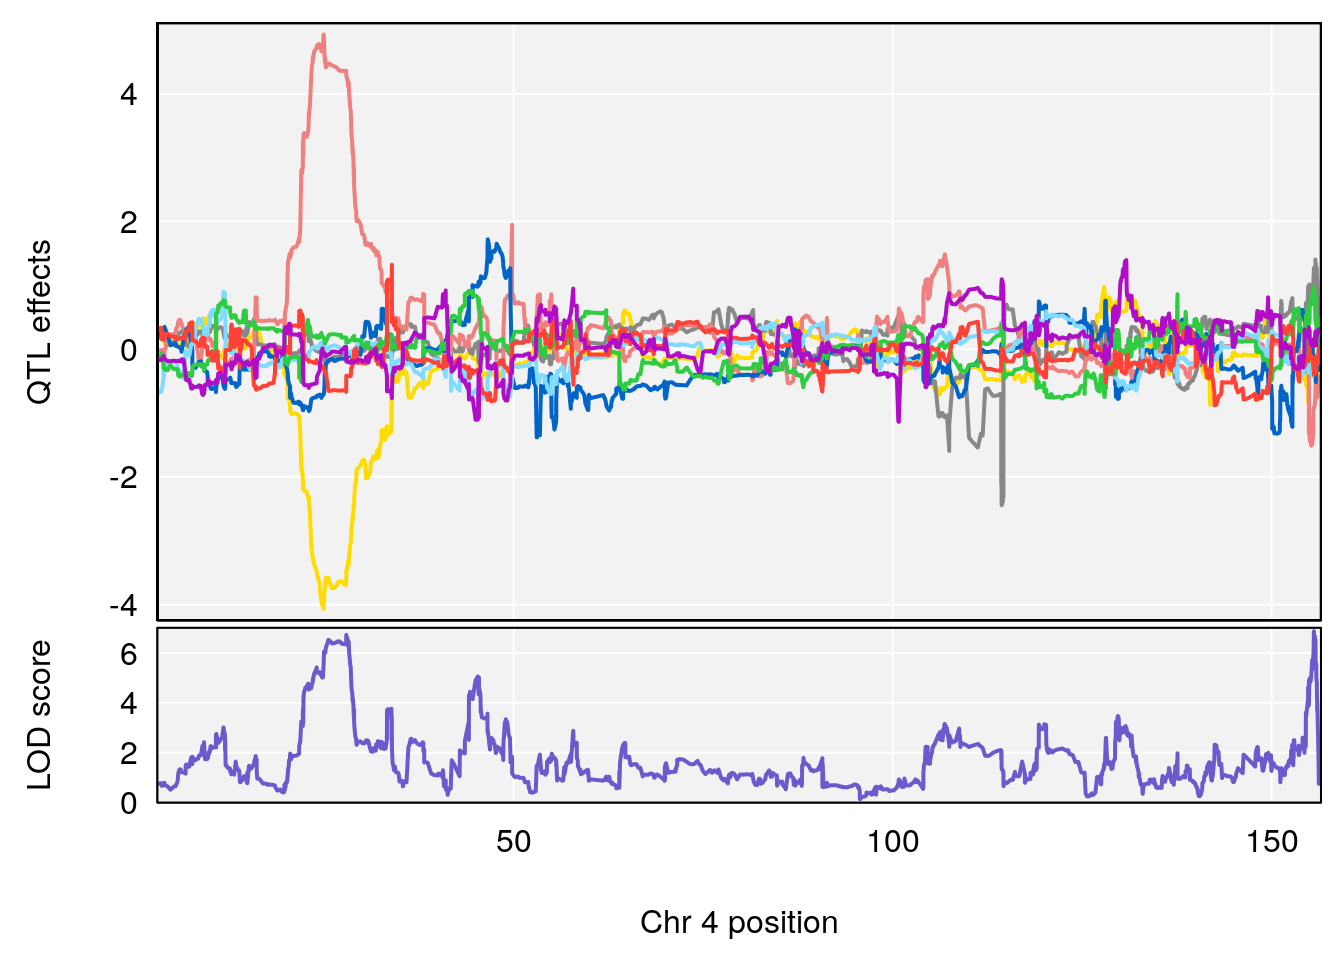
| Version | Author | Date |
|---|---|---|
| f412738 | xhyuo | 2021-12-20 |
| Version | Author | Date |
|---|---|---|
| f412738 | xhyuo | 2021-12-20 |
| Version | Author | Date |
|---|---|---|
| f412738 | xhyuo | 2021-12-20 |
# [1] 2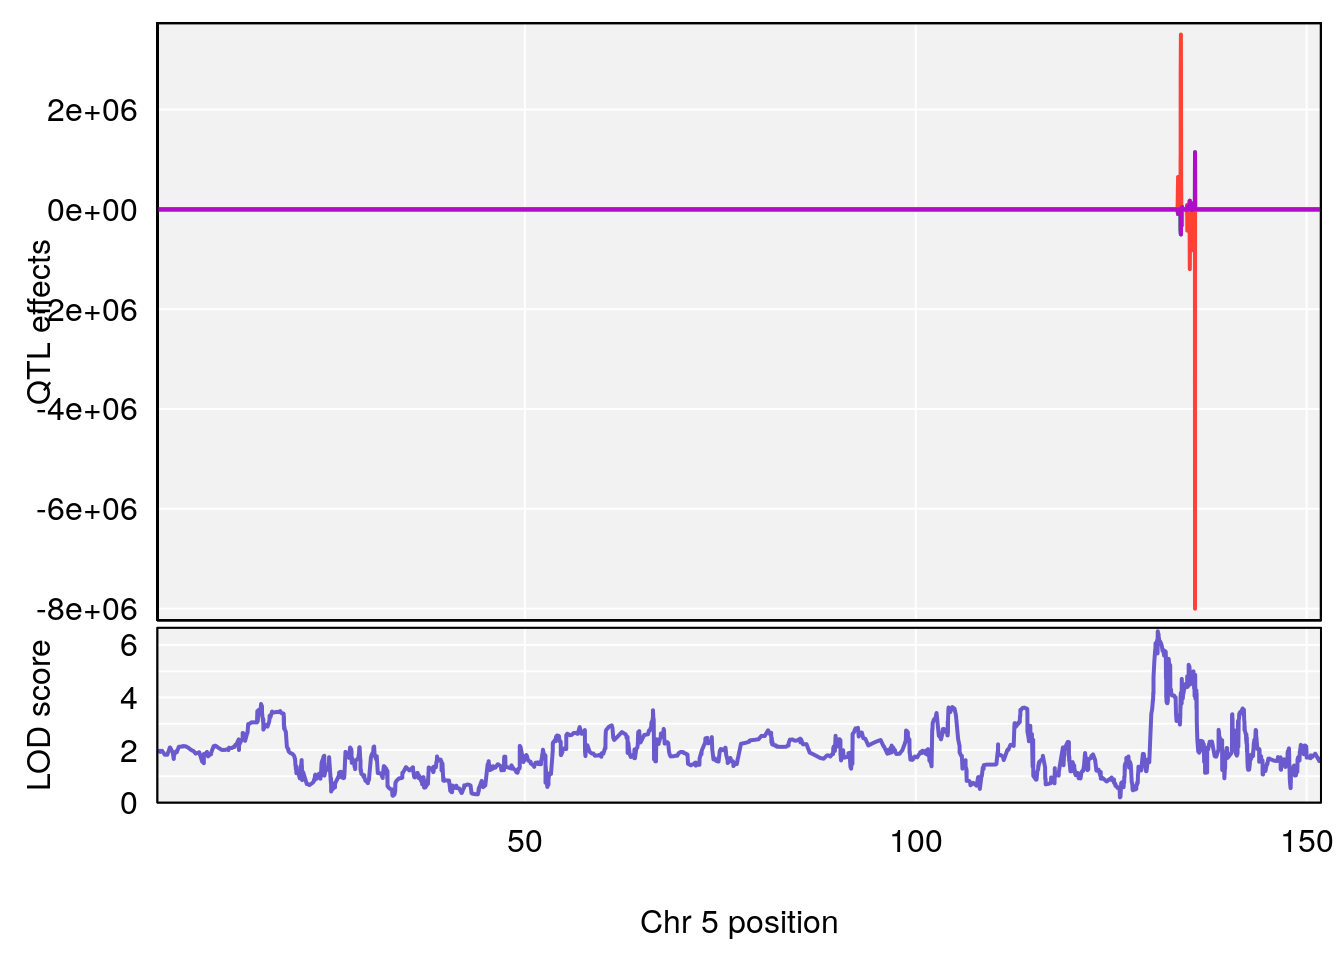
| Version | Author | Date |
|---|---|---|
| f412738 | xhyuo | 2021-12-20 |
| Version | Author | Date |
|---|---|---|
| f412738 | xhyuo | 2021-12-20 |
| Version | Author | Date |
|---|---|---|
| f412738 | xhyuo | 2021-12-20 |
# [1] "RR.Depression.Rate.Hr"
# [1] lodindex  lodcolumn chr       pos       lod       ci_lo     ci_hi
# <0 rows> (or 0-length row.names)
# [1] "Time.to.Steady.RR.Depression.Hr"
# [1] lodindex  lodcolumn chr       pos       lod       ci_lo     ci_hi
# <0 rows> (or 0-length row.names)
# [1] "Min.Depression.RR"
#   lodindex lodcolumn chr       pos      lod     ci_lo     ci_hi
# 1        1    pheno1   6 110.25926 6.917845 109.73966 110.89937
# 2        1    pheno1  15  70.24917 6.600987  68.92043  83.02844
# [1] 1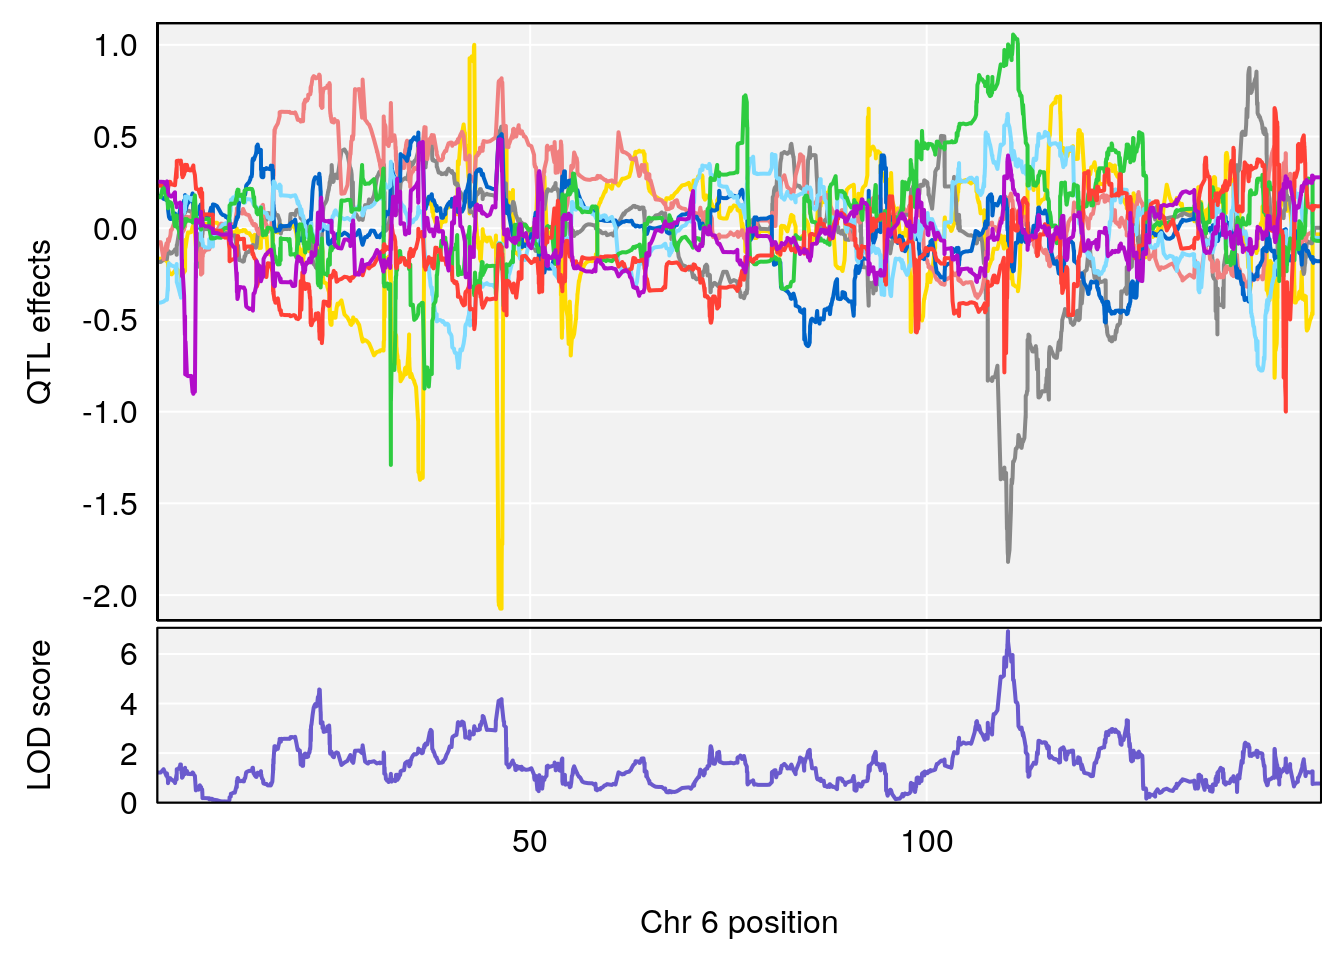
| Version | Author | Date |
|---|---|---|
| f412738 | xhyuo | 2021-12-20 |
| Version | Author | Date |
|---|---|---|
| f412738 | xhyuo | 2021-12-20 |
| Version | Author | Date |
|---|---|---|
| f412738 | xhyuo | 2021-12-20 |
# [1] 2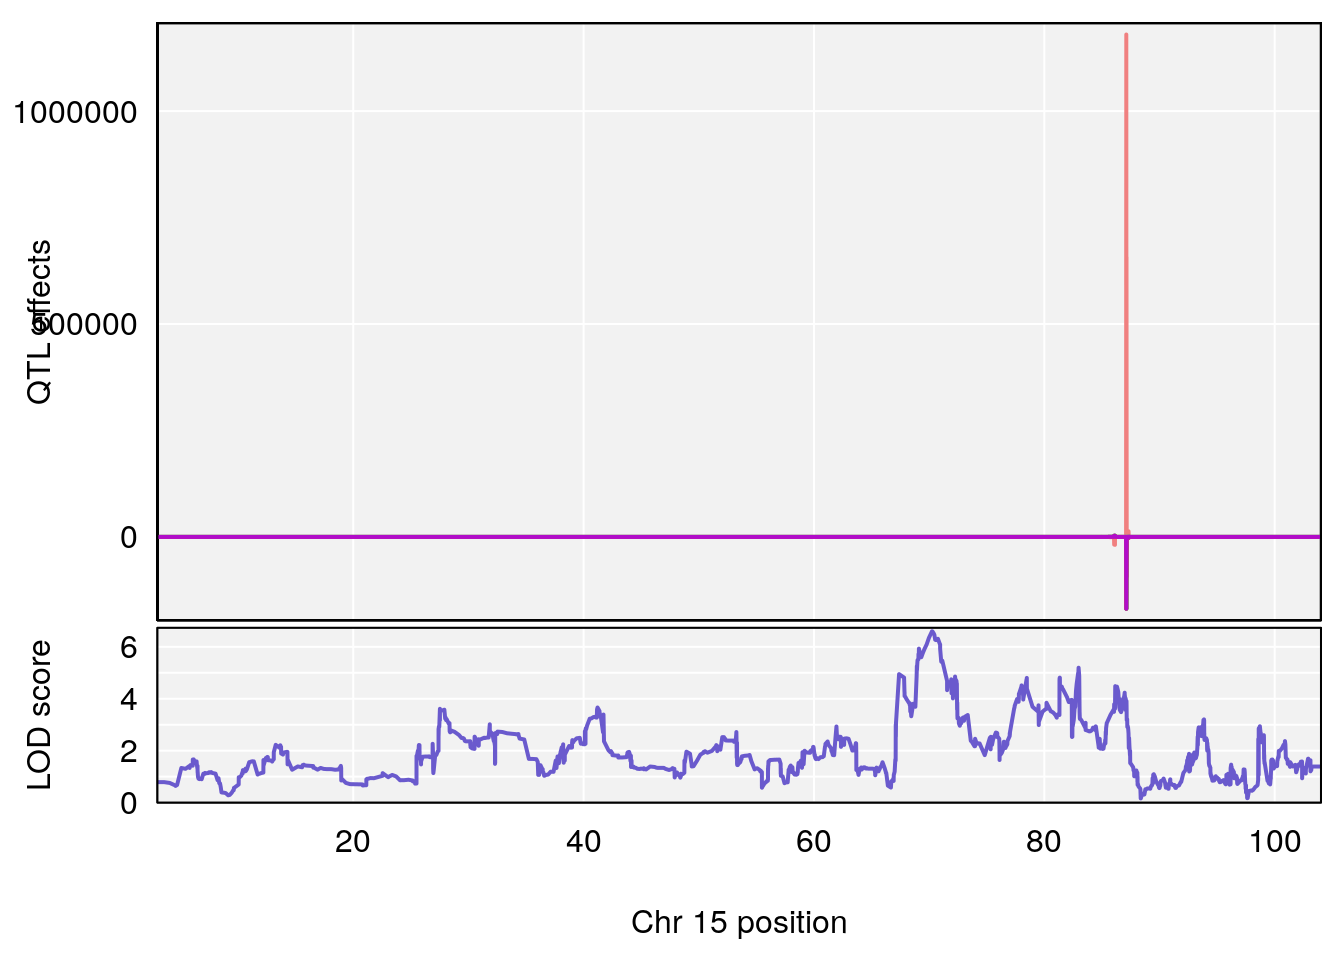
| Version | Author | Date |
|---|---|---|
| f412738 | xhyuo | 2021-12-20 |
| Version | Author | Date |
|---|---|---|
| f412738 | xhyuo | 2021-12-20 |

| Version | Author | Date |
|---|---|---|
| f412738 | xhyuo | 2021-12-20 |
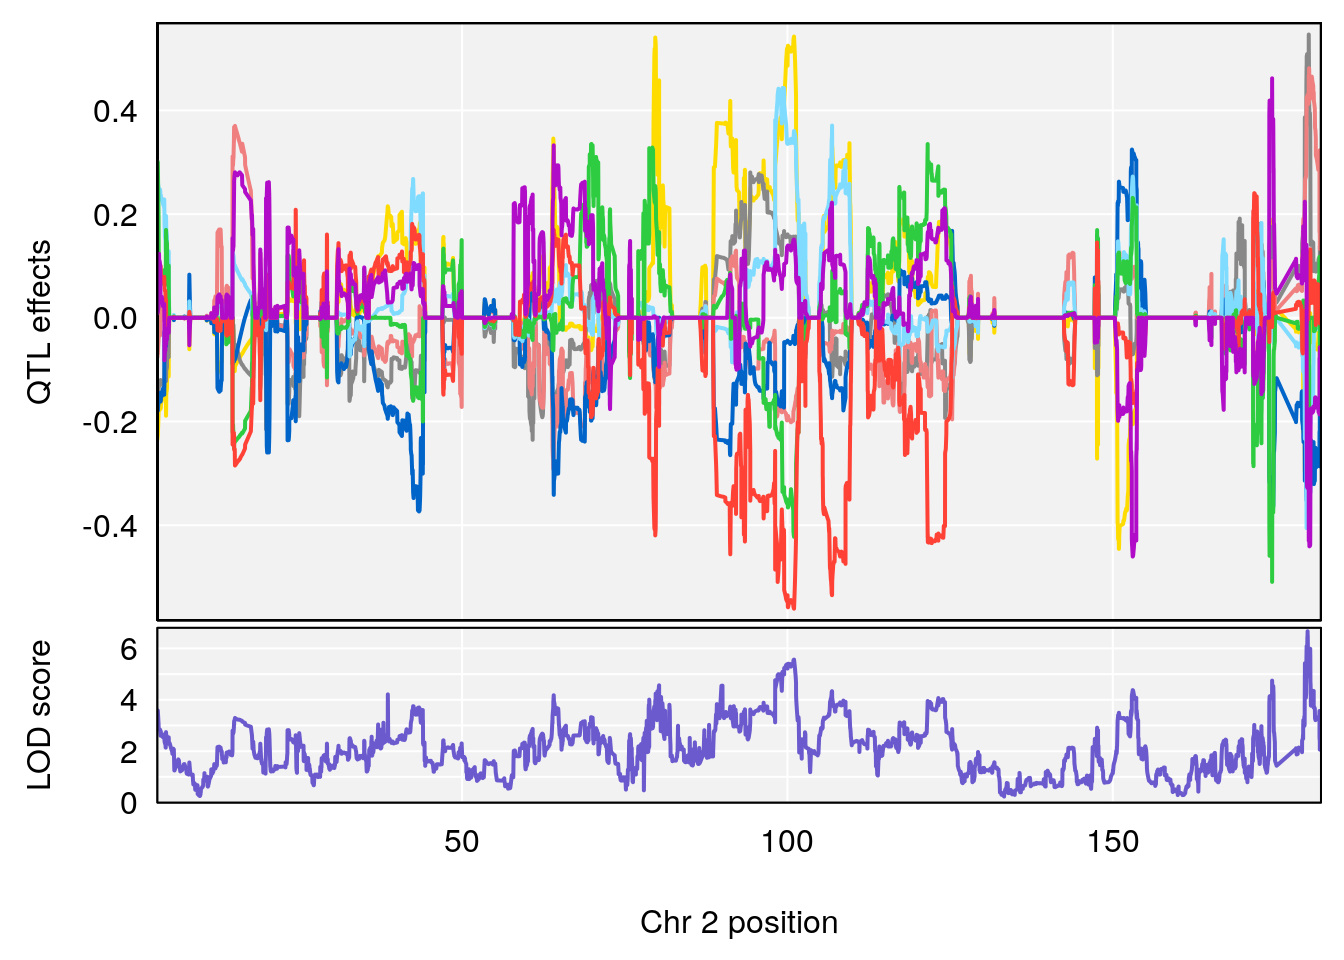
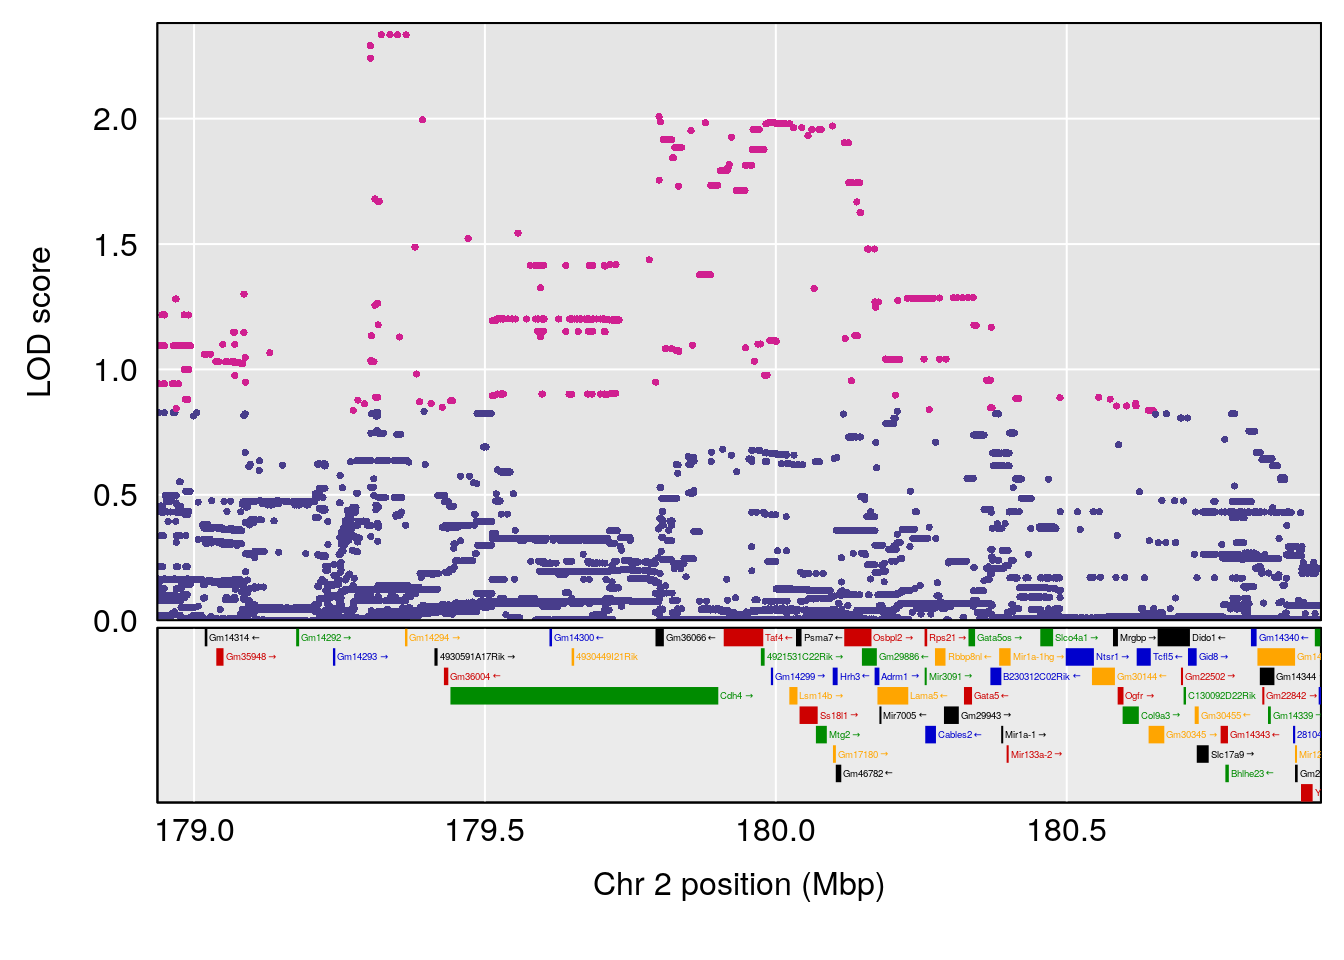
# [1] "Mean.Depression.BR"
#   lodindex lodcolumn chr       pos      lod    ci_lo     ci_hi
# 1        1    pheno1   2 179.93579 6.666801 99.18788 180.36934
# 2        1    pheno1  15  28.42395 6.928838 27.40287  72.41888
# 3        1    pheno1  17  45.00725 6.614011 44.60730  45.45418
# [1] 1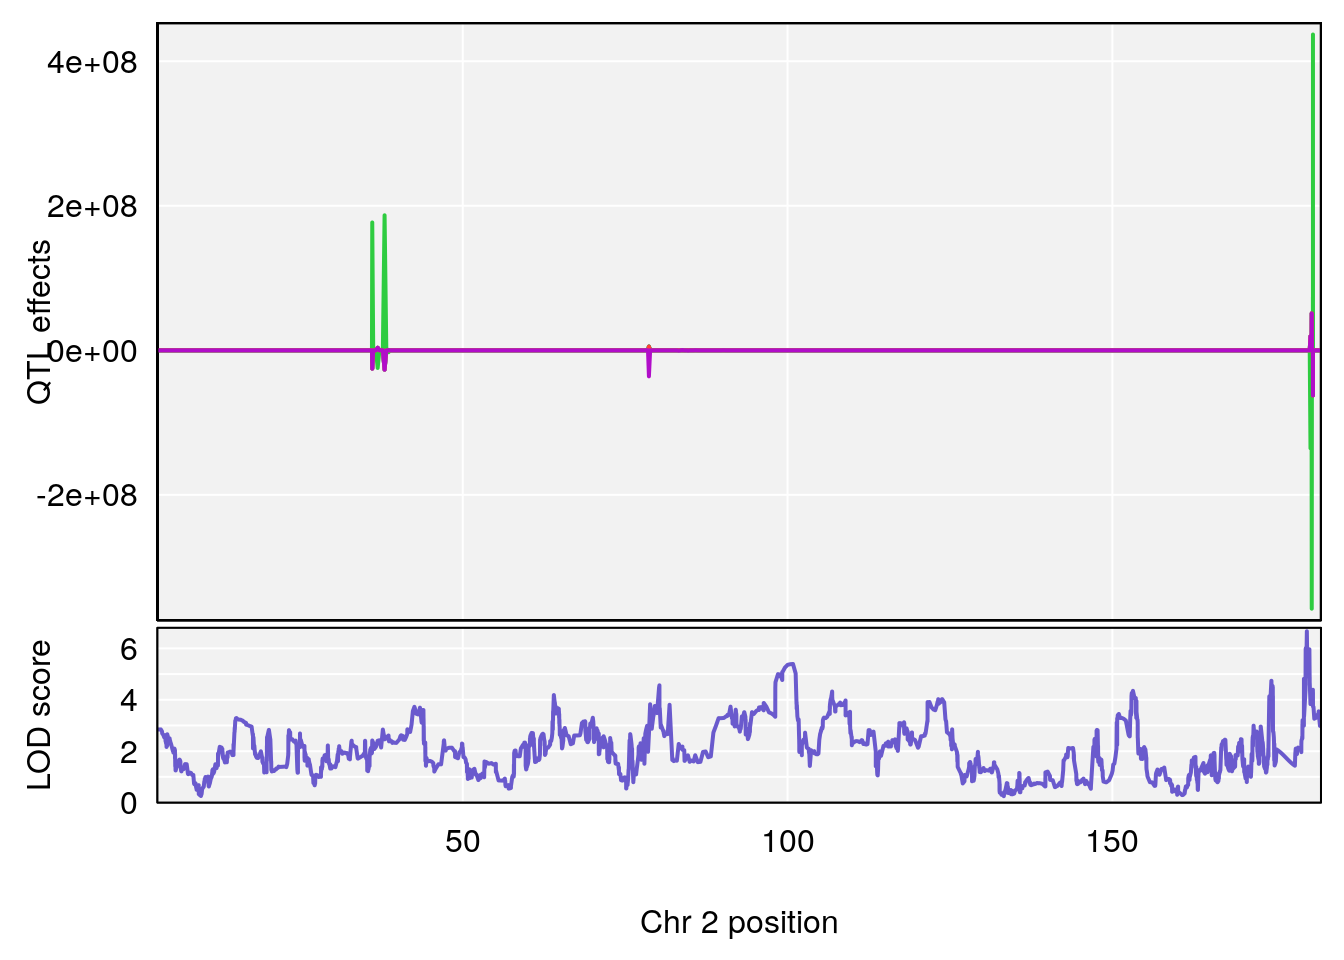
| Version | Author | Date |
|---|---|---|
| f412738 | xhyuo | 2021-12-20 |
| Version | Author | Date |
|---|---|---|
| f412738 | xhyuo | 2021-12-20 |
| Version | Author | Date |
|---|---|---|
| f412738 | xhyuo | 2021-12-20 |
# [1] 2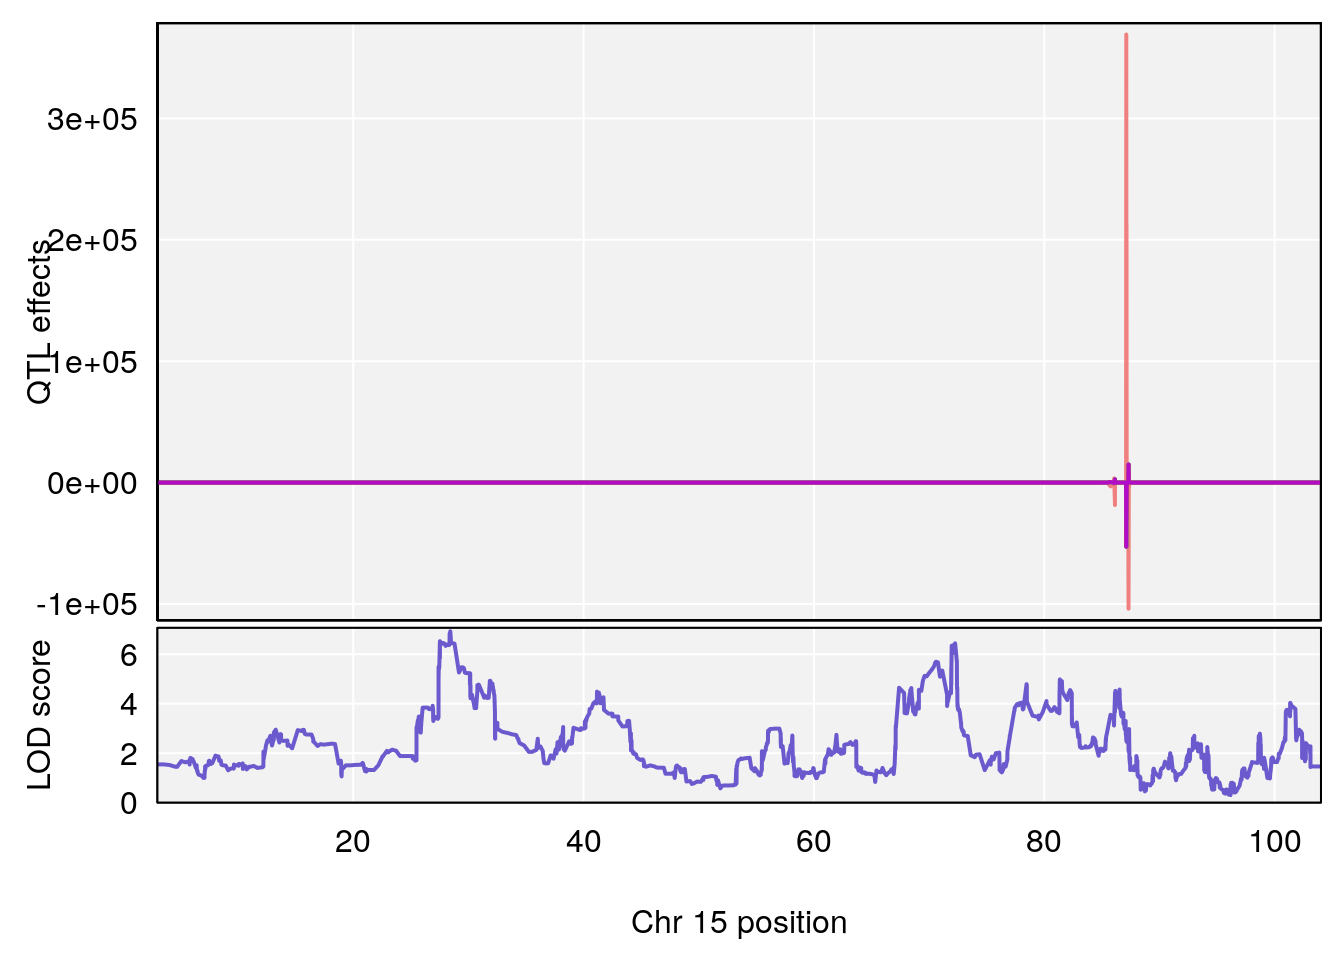
| Version | Author | Date |
|---|---|---|
| f412738 | xhyuo | 2021-12-20 |
| Version | Author | Date |
|---|---|---|
| f412738 | xhyuo | 2021-12-20 |
| Version | Author | Date |
|---|---|---|
| f412738 | xhyuo | 2021-12-20 |
# [1] 3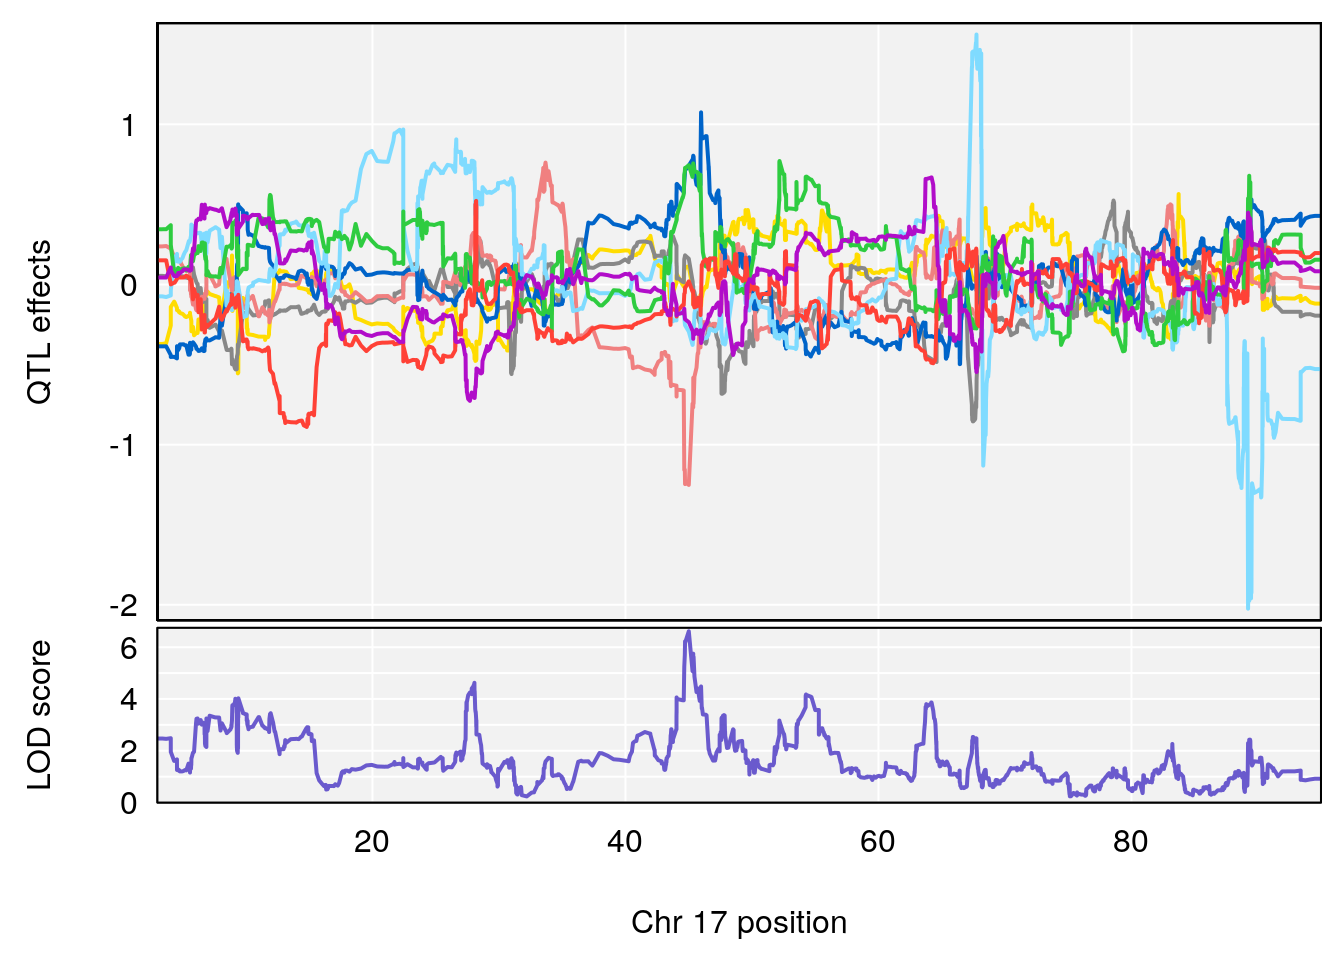
| Version | Author | Date |
|---|---|---|
| f412738 | xhyuo | 2021-12-20 |
| Version | Author | Date |
|---|---|---|
| f412738 | xhyuo | 2021-12-20 |
| Version | Author | Date |
|---|---|---|
| f412738 | xhyuo | 2021-12-20 |
# [1] "Steady-State.Depression.Duration.Hr"
#   lodindex lodcolumn chr      pos      lod     ci_lo    ci_hi
# 1        1    pheno1   4 135.9546 6.166319  32.37278 136.3792
# 2        1    pheno1   5 102.9451 6.909370 102.66155 103.3928
# 3        1    pheno1  11 100.0623 6.710383  99.90022 100.9337
# [1] 1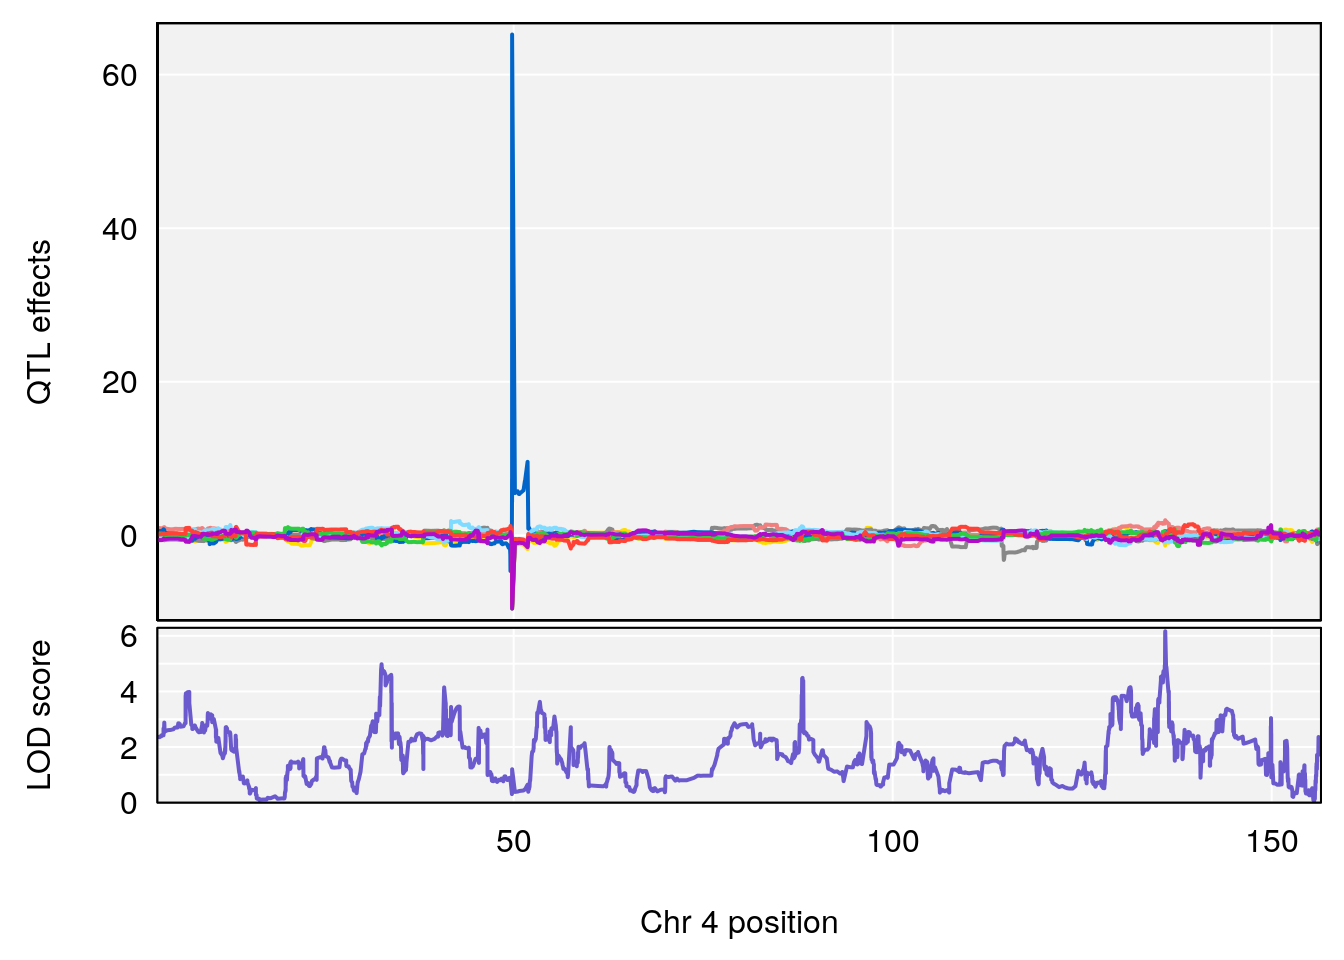
| Version | Author | Date |
|---|---|---|
| f412738 | xhyuo | 2021-12-20 |
| Version | Author | Date |
|---|---|---|
| f412738 | xhyuo | 2021-12-20 |
| Version | Author | Date |
|---|---|---|
| f412738 | xhyuo | 2021-12-20 |
# [1] 2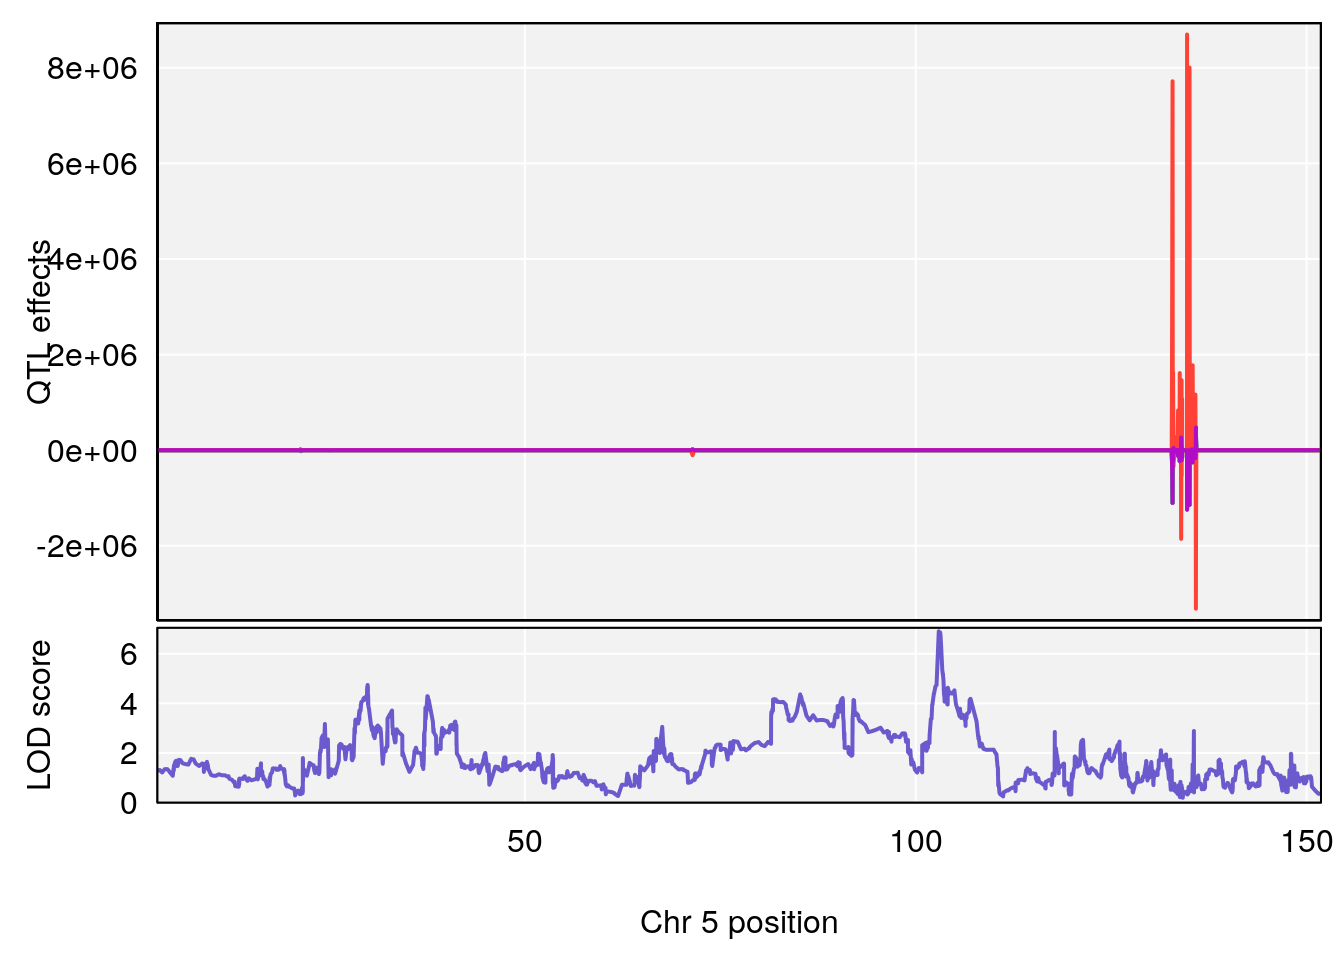
| Version | Author | Date |
|---|---|---|
| f412738 | xhyuo | 2021-12-20 |

| Version | Author | Date |
|---|---|---|
| f412738 | xhyuo | 2021-12-20 |
| Version | Author | Date |
|---|---|---|
| f412738 | xhyuo | 2021-12-20 |
# [1] 3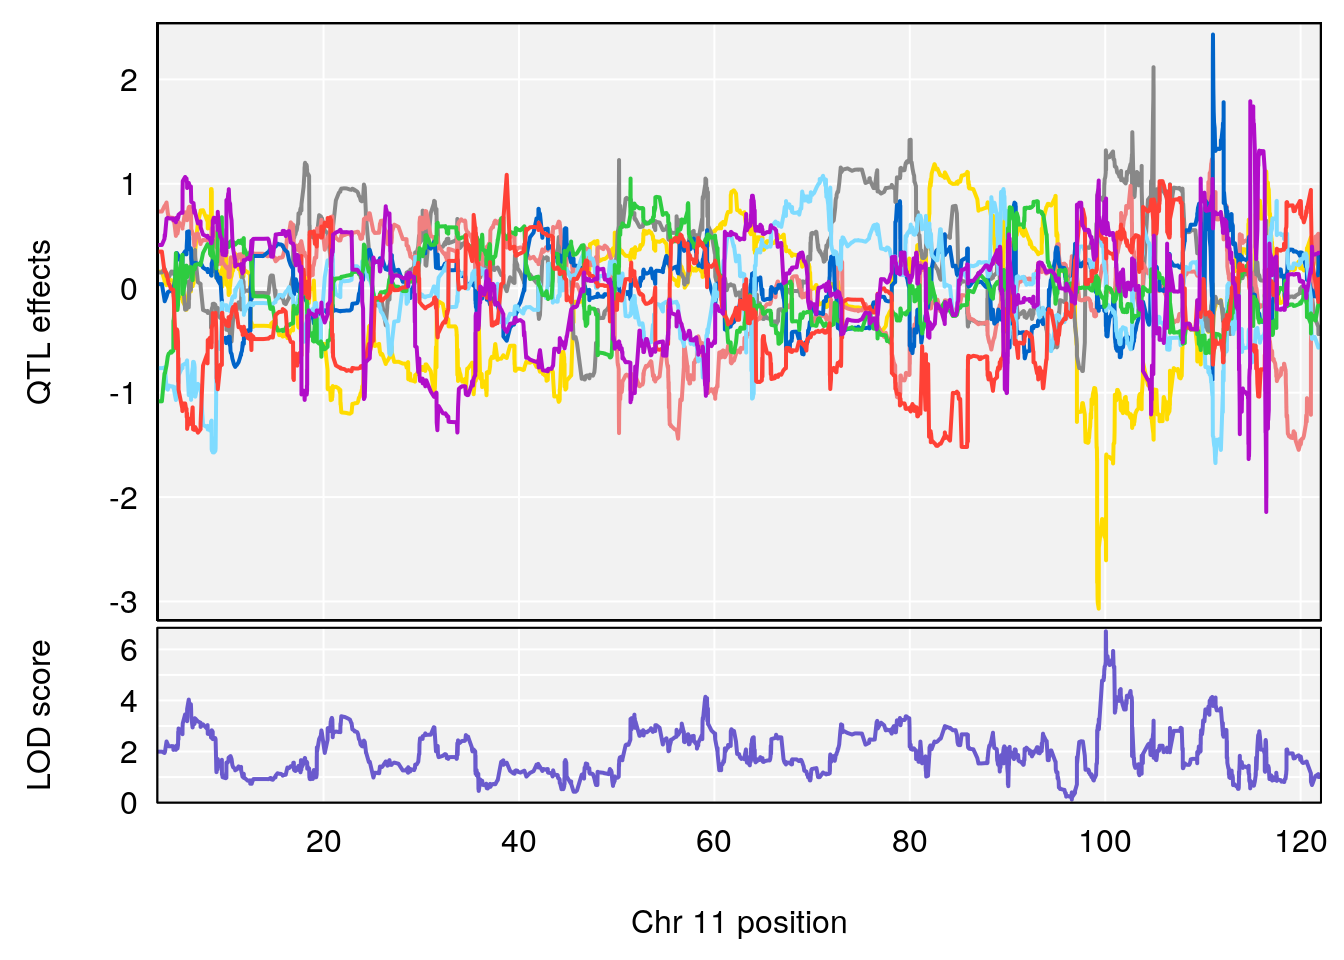
| Version | Author | Date |
|---|---|---|
| f412738 | xhyuo | 2021-12-20 |
| Version | Author | Date |
|---|---|---|
| f412738 | xhyuo | 2021-12-20 |
| Version | Author | Date |
|---|---|---|
| f412738 | xhyuo | 2021-12-20 |
# [1] "Time.to.Threshold.Recovery.Hr"
#   lodindex lodcolumn chr      pos      lod    ci_lo     ci_hi
# 1        1    pheno1   4 135.9546 6.459910 53.10543 136.07892
# 2        1    pheno1  14  20.6426 6.085256 20.25692  22.26143
# [1] 1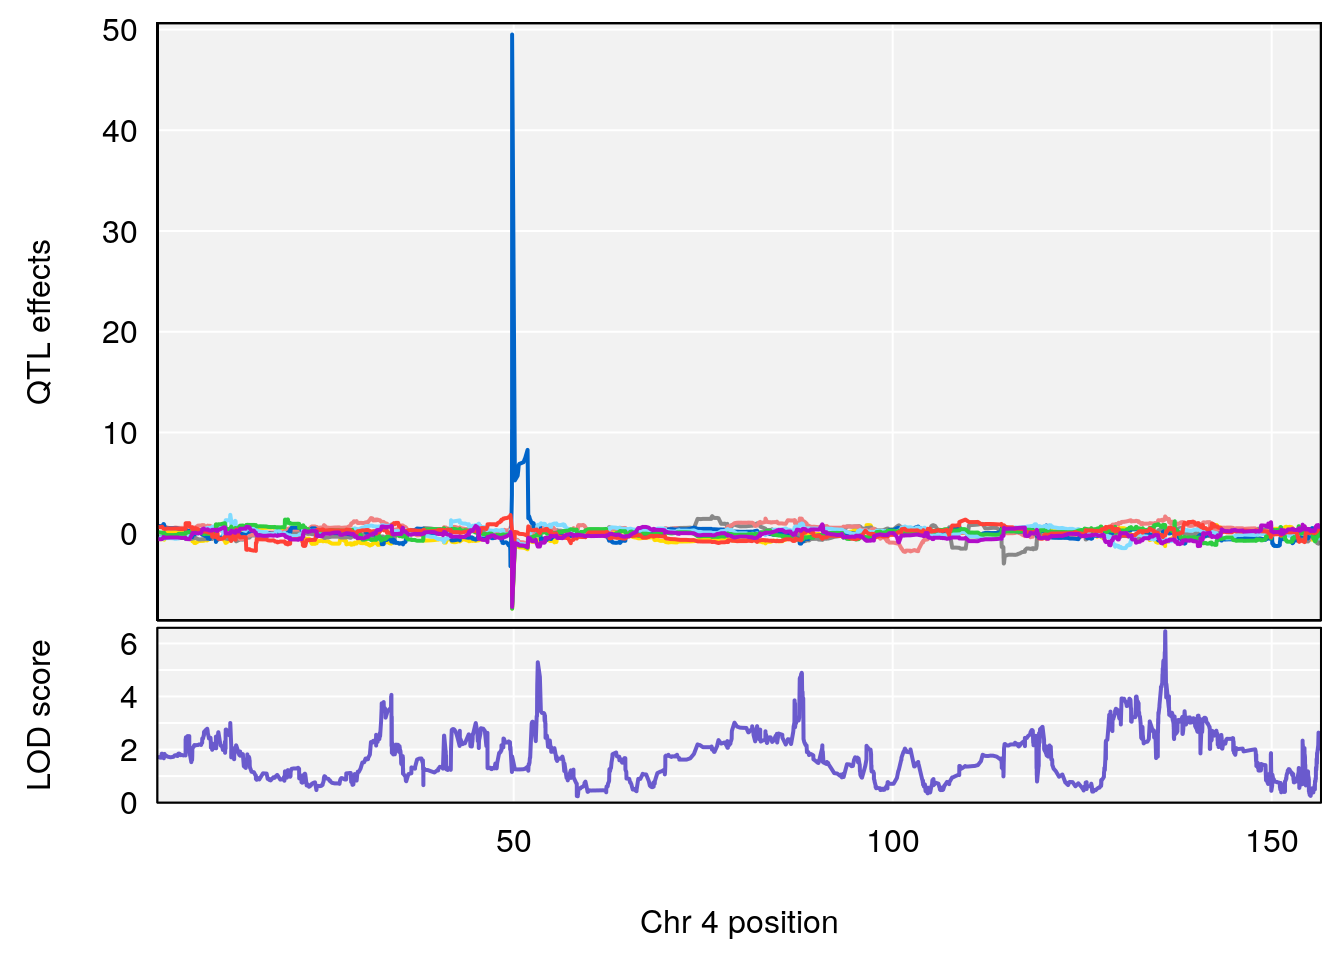
| Version | Author | Date |
|---|---|---|
| f412738 | xhyuo | 2021-12-20 |
| Version | Author | Date |
|---|---|---|
| f412738 | xhyuo | 2021-12-20 |
| Version | Author | Date |
|---|---|---|
| f412738 | xhyuo | 2021-12-20 |
# [1] 2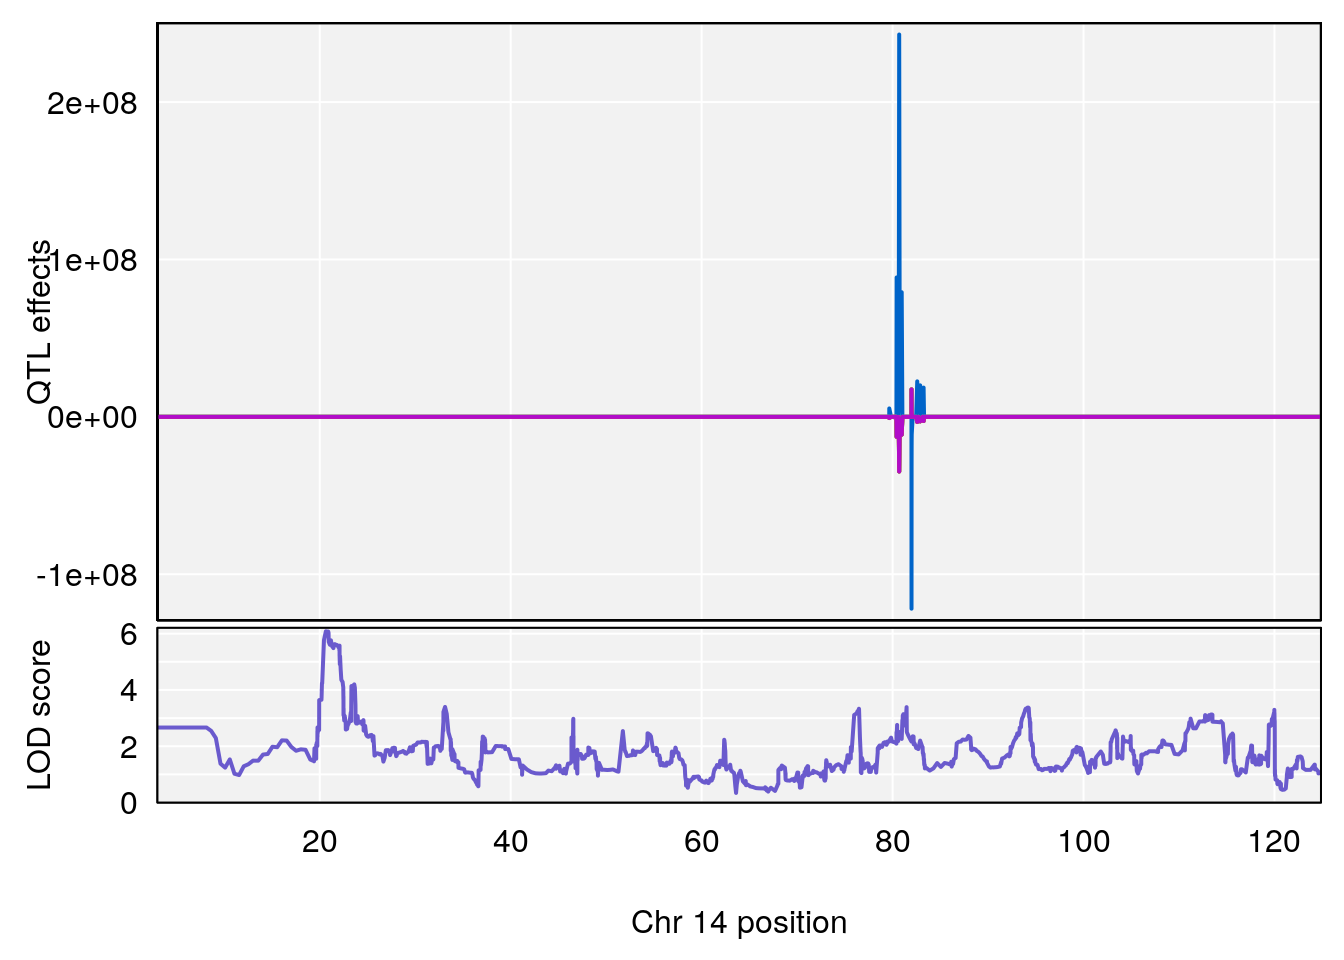
| Version | Author | Date |
|---|---|---|
| f412738 | xhyuo | 2021-12-20 |
| Version | Author | Date |
|---|---|---|
| f412738 | xhyuo | 2021-12-20 |
| Version | Author | Date |
|---|---|---|
| f412738 | xhyuo | 2021-12-20 |
# [1] "Time.to.Projected.Recovery.Hr"
#   lodindex lodcolumn chr      pos      lod    ci_lo    ci_hi
# 1        1    pheno1   5 103.1294 6.407867 102.6616 103.3928
# [1] 1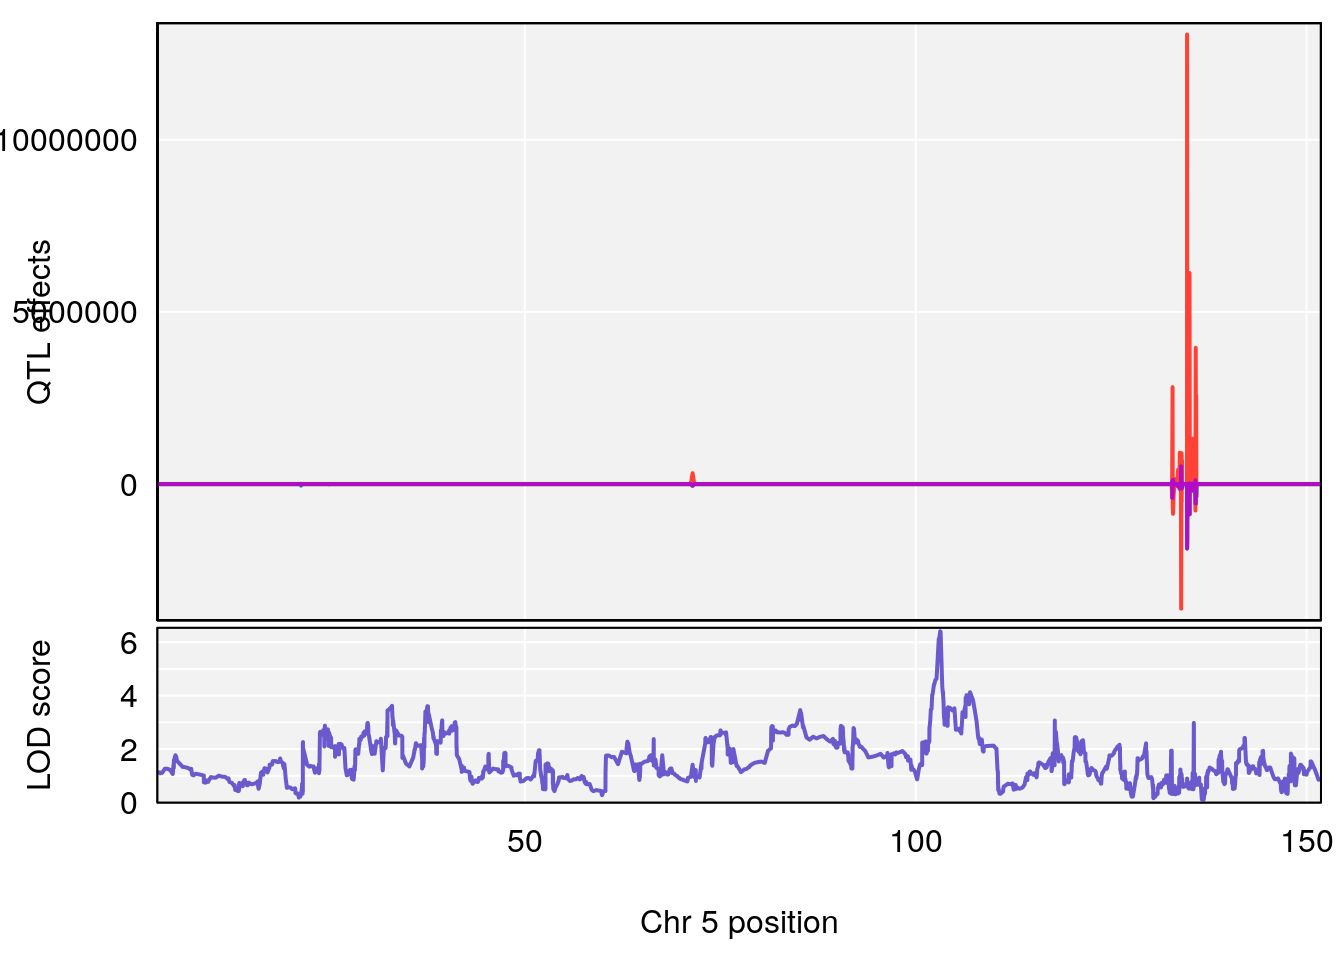
| Version | Author | Date |
|---|---|---|
| f412738 | xhyuo | 2021-12-20 |
| Version | Author | Date |
|---|---|---|
| f412738 | xhyuo | 2021-12-20 |
| Version | Author | Date |
|---|---|---|
| f412738 | xhyuo | 2021-12-20 |
# [1] "Start.of.Recovery.Hr"
#   lodindex lodcolumn chr      pos      lod     ci_lo    ci_hi
# 1        1    pheno1   5 102.9451 6.622891 102.66155 103.3928
# 2        1    pheno1  11 100.0623 6.910074  99.92203 100.8526
# [1] 1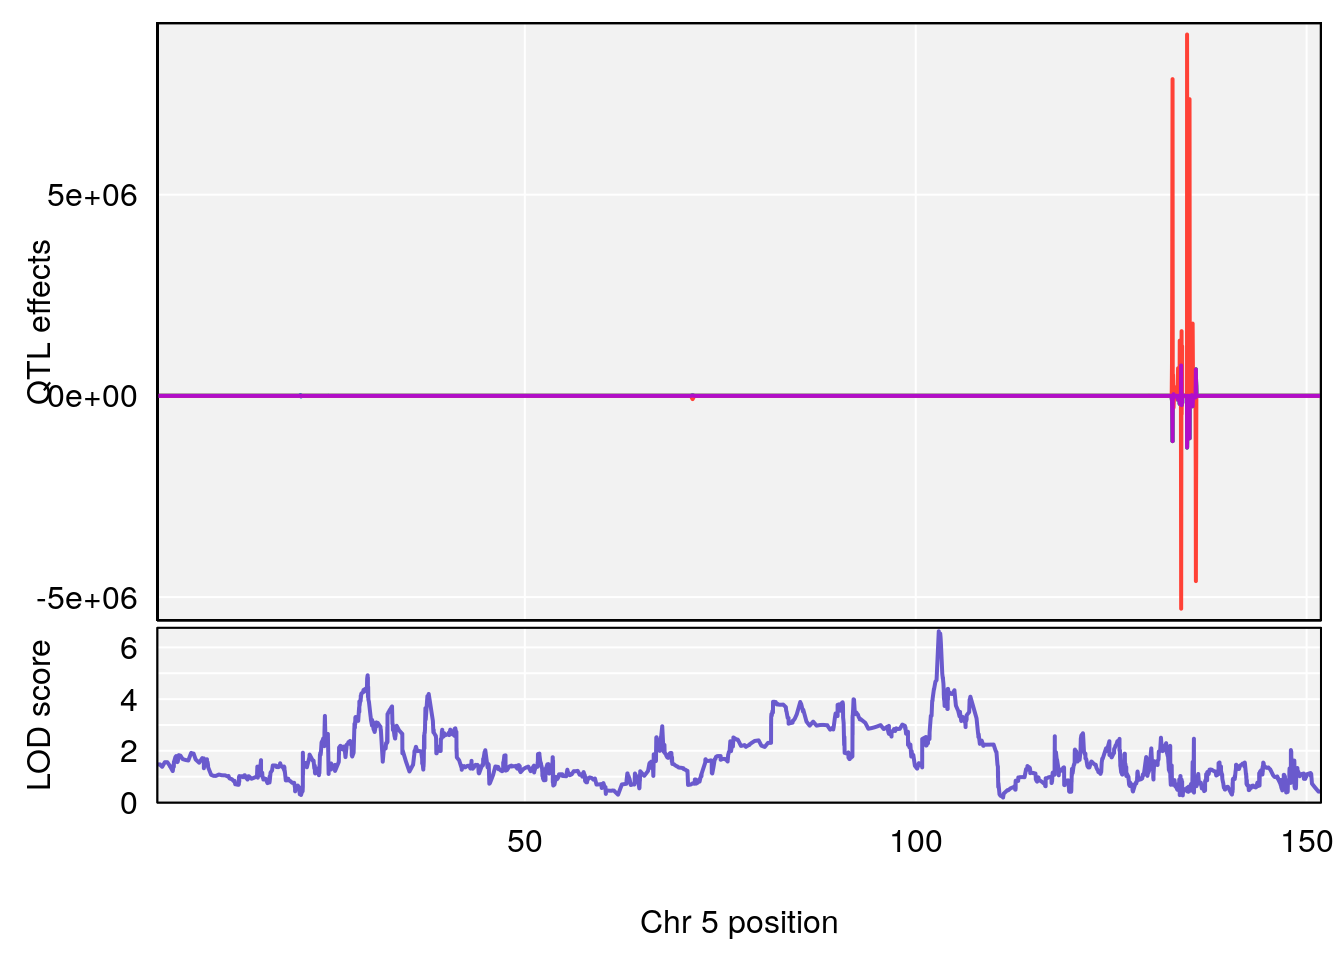
| Version | Author | Date |
|---|---|---|
| f412738 | xhyuo | 2021-12-20 |
| Version | Author | Date |
|---|---|---|
| f412738 | xhyuo | 2021-12-20 |
| Version | Author | Date |
|---|---|---|
| f412738 | xhyuo | 2021-12-20 |
# [1] 2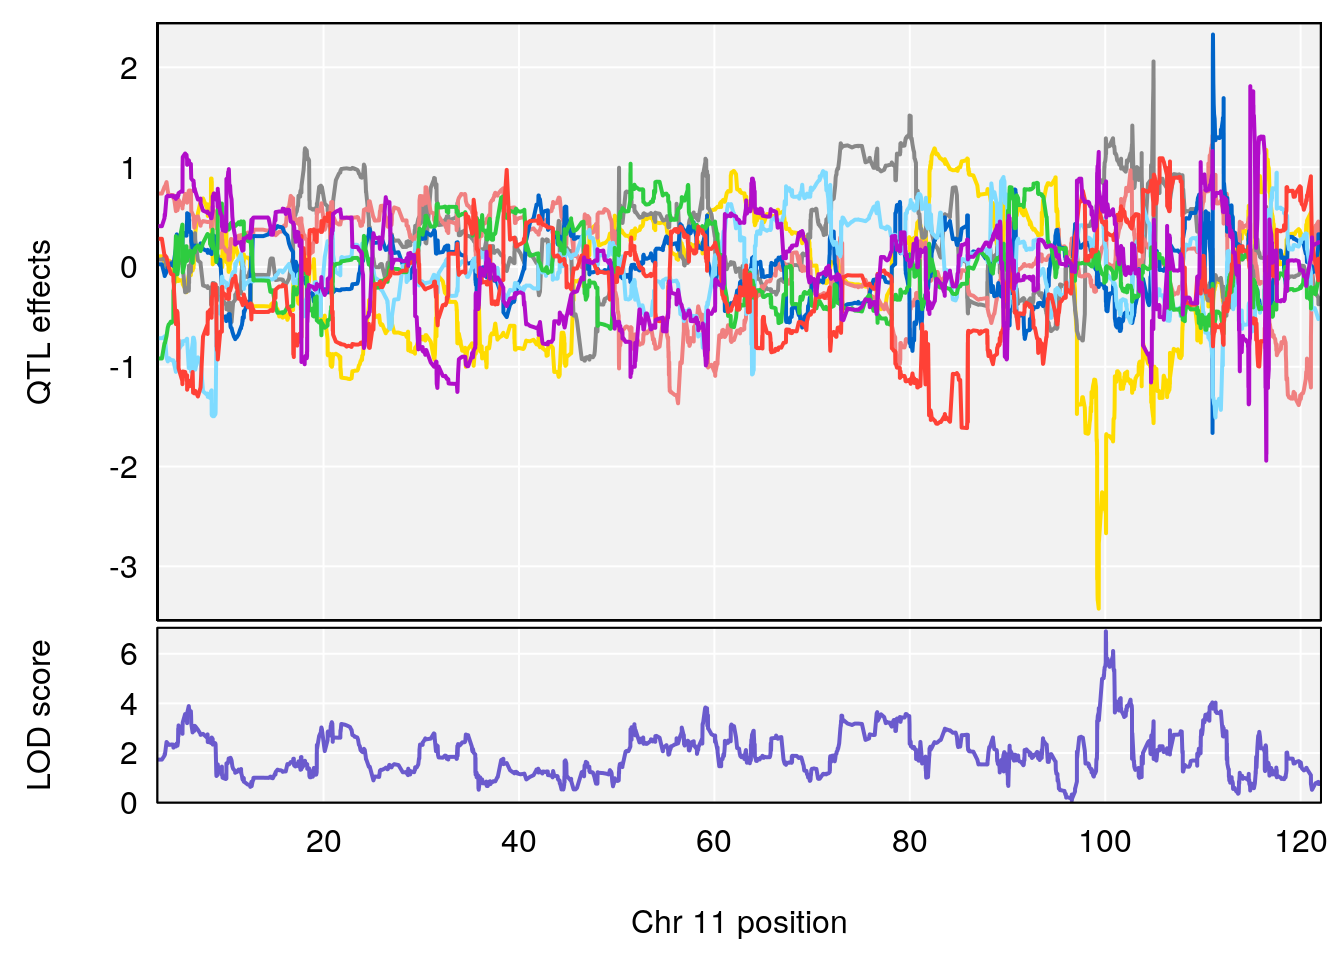
| Version | Author | Date |
|---|---|---|
| f412738 | xhyuo | 2021-12-20 |
| Version | Author | Date |
|---|---|---|
| f412738 | xhyuo | 2021-12-20 |
| Version | Author | Date |
|---|---|---|
| f412738 | xhyuo | 2021-12-20 |
# [1] "RR.Recovery.Rate.Hr"
#   lodindex lodcolumn chr       pos      lod     ci_lo     ci_hi
# 1        1    pheno1   3 123.37631 6.139661 122.02872 131.78356
# 2        1    pheno1  14  21.17214 8.250728  20.25692  21.53839
# 3        1    pheno1  15  68.07208 6.071145  67.89315  68.61110
# [1] 1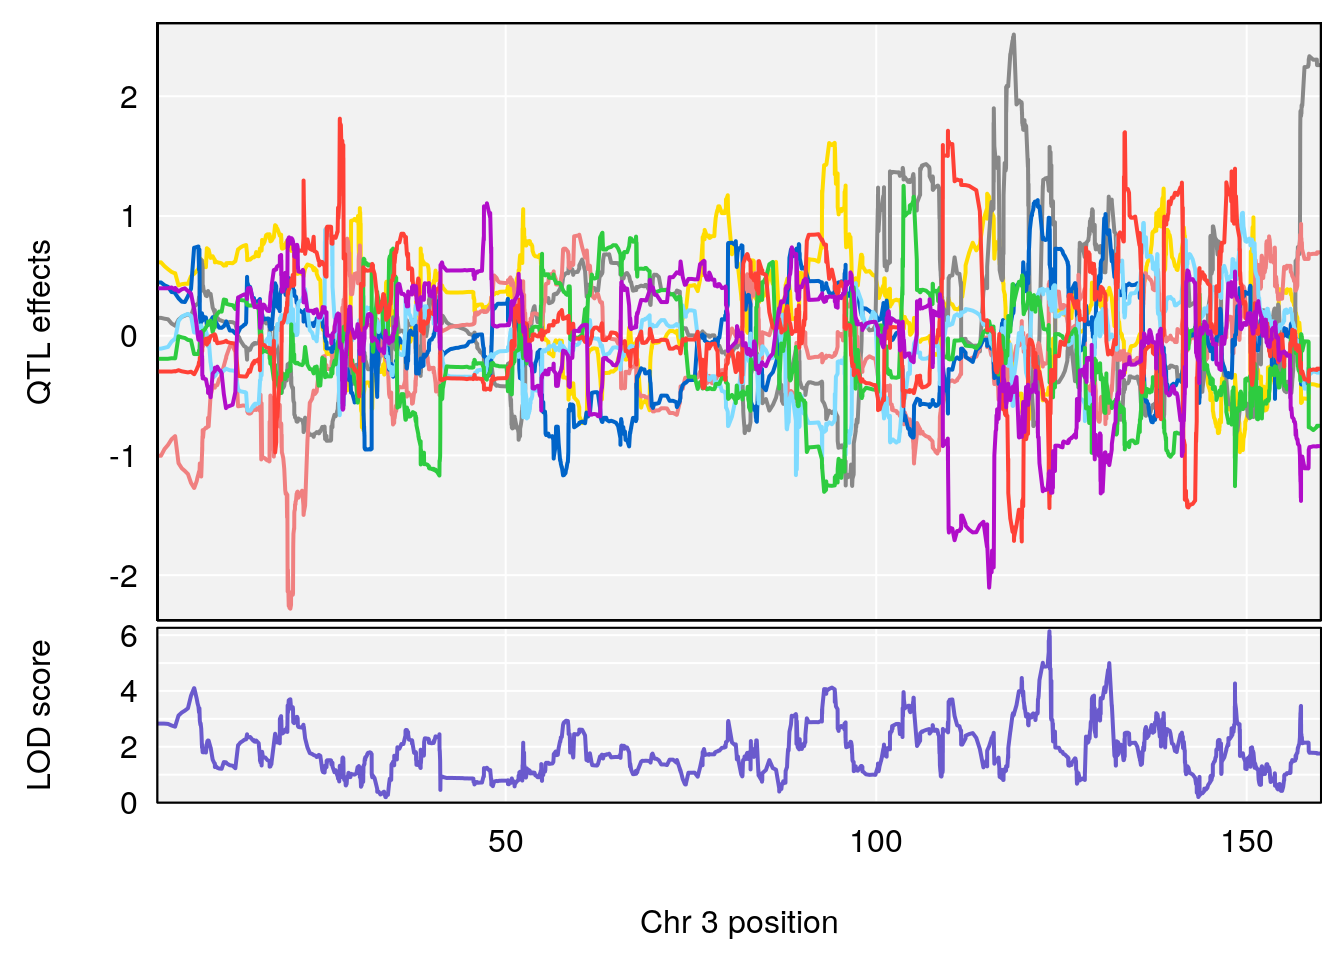
| Version | Author | Date |
|---|---|---|
| f412738 | xhyuo | 2021-12-20 |

| Version | Author | Date |
|---|---|---|
| f412738 | xhyuo | 2021-12-20 |
| Version | Author | Date |
|---|---|---|
| f412738 | xhyuo | 2021-12-20 |
# [1] 2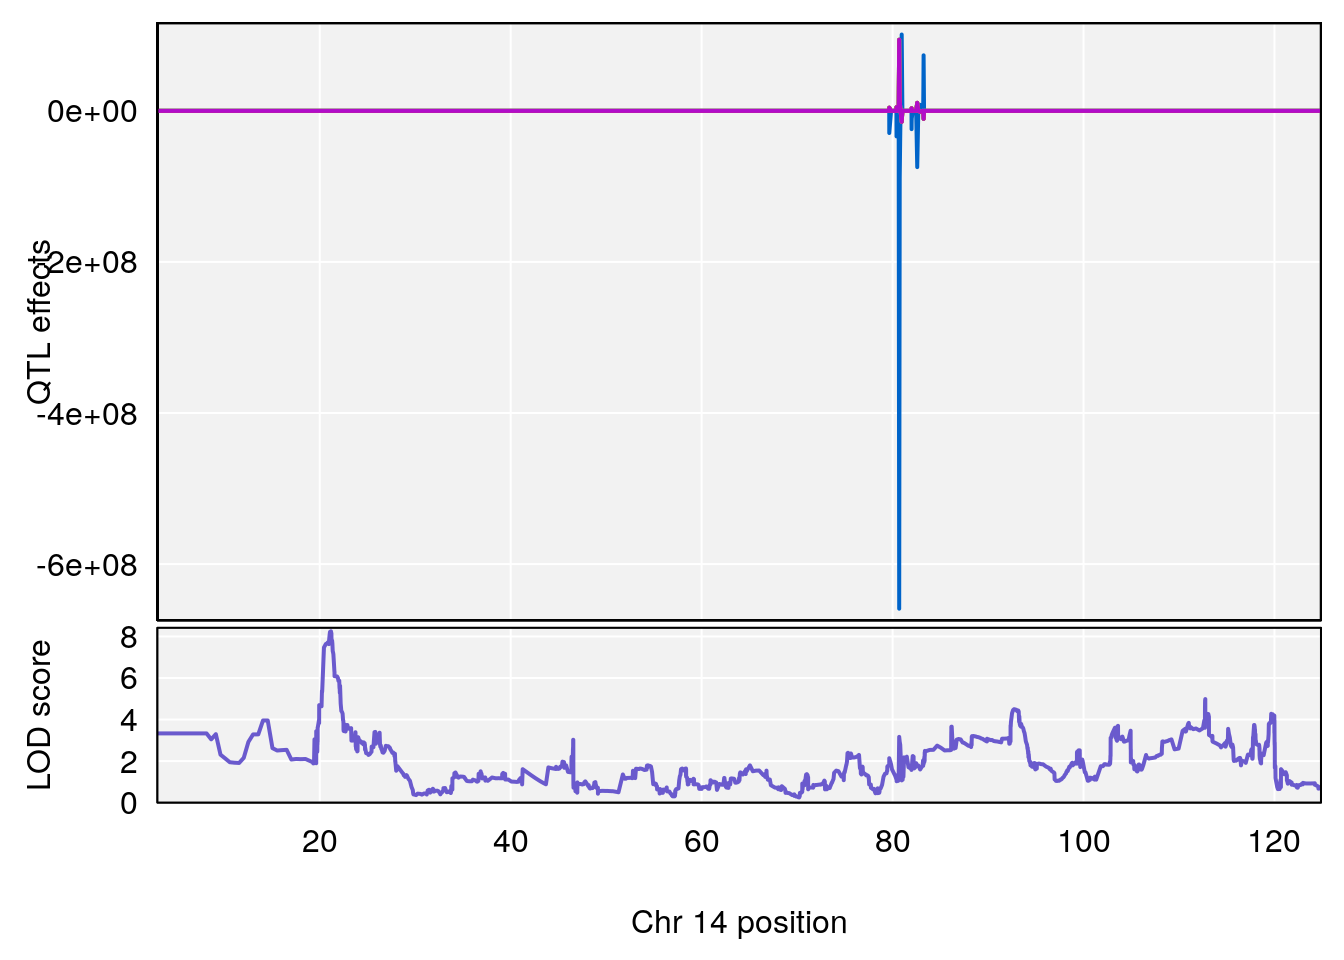
| Version | Author | Date |
|---|---|---|
| f412738 | xhyuo | 2021-12-20 |
| Version | Author | Date |
|---|---|---|
| f412738 | xhyuo | 2021-12-20 |
| Version | Author | Date |
|---|---|---|
| f412738 | xhyuo | 2021-12-20 |
# [1] 3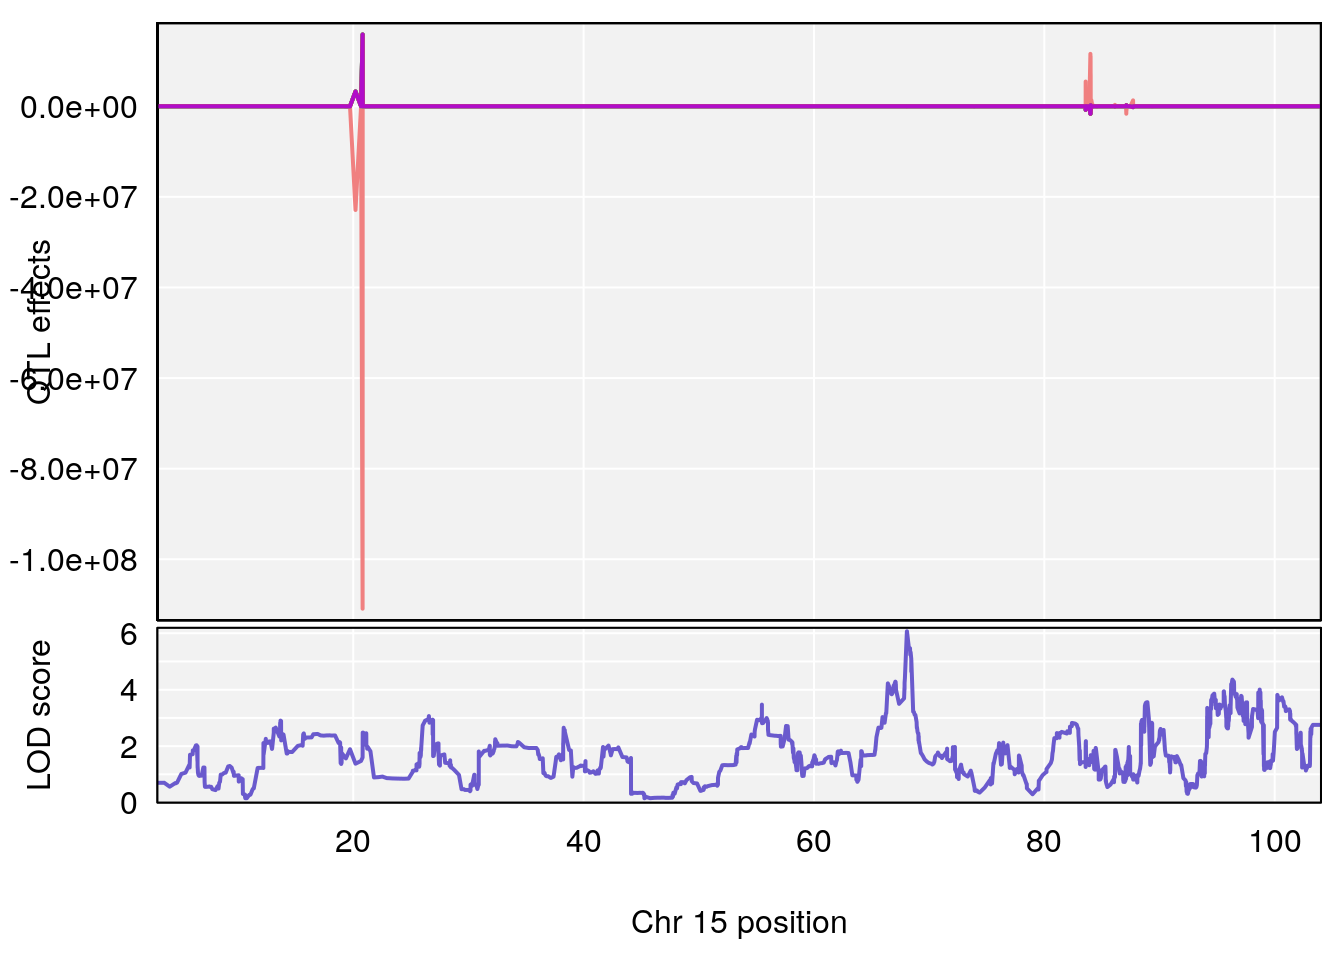
| Version | Author | Date |
|---|---|---|
| f412738 | xhyuo | 2021-12-20 |
| Version | Author | Date |
|---|---|---|
| f412738 | xhyuo | 2021-12-20 |
| Version | Author | Date |
|---|---|---|
| f412738 | xhyuo | 2021-12-20 |
#save peaks coeff plot
for(i in names(qtl.morphine.out)){
print(i)
peaks <- find_peaks(qtl.morphine.out[[i]], map=pmap, threshold=6, drop=1.5)
fname <- paste("output/Fentanyl/DO_fentanyl_69k_alternate_metrics_",i,"_coefplot.pdf",sep="")
pdf(file = fname, width = 16, height =8)
if(dim(peaks)[1] != 0){
for(p in 1:dim(peaks)[1]) {
print(p)
chr <-peaks[p,3]
#coeff plot
par(mar=c(4.1, 4.1, 0.6, 0.6))
plot_coefCC(coef_c1[[i]][[p]], pmap[chr], scan1_output=qtl.morphine.out[[i]], bgcolor="gray95", legend=NULL)
plot(out_snps[[i]][[p]]$lod, out_snps[[i]][[p]]$snpinfo, drop_hilit=1.5, genes=out_genes[[i]][[p]])
}
}
dev.off()
}
# [1] "Time.to.Dead.Hr"
# [1] 1
# [1] 2
# [1] "RR.Depression.Rate.Hr"
# [1] "Time.to.Steady.RR.Depression.Hr"
# [1] "Min.Depression.RR"
# [1] 1
# [1] 2
# [1] "Mean.Depression.BR"
# [1] 1
# [1] 2
# [1] 3
# [1] "Steady-State.Depression.Duration.Hr"
# [1] 1
# [1] 2
# [1] 3
# [1] "Time.to.Threshold.Recovery.Hr"
# [1] 1
# [1] 2
# [1] "Time.to.Projected.Recovery.Hr"
# [1] 1
# [1] "Start.of.Recovery.Hr"
# [1] 1
# [1] 2
# [1] "RR.Recovery.Rate.Hr"
# [1] 1
# [1] 2
# [1] 3
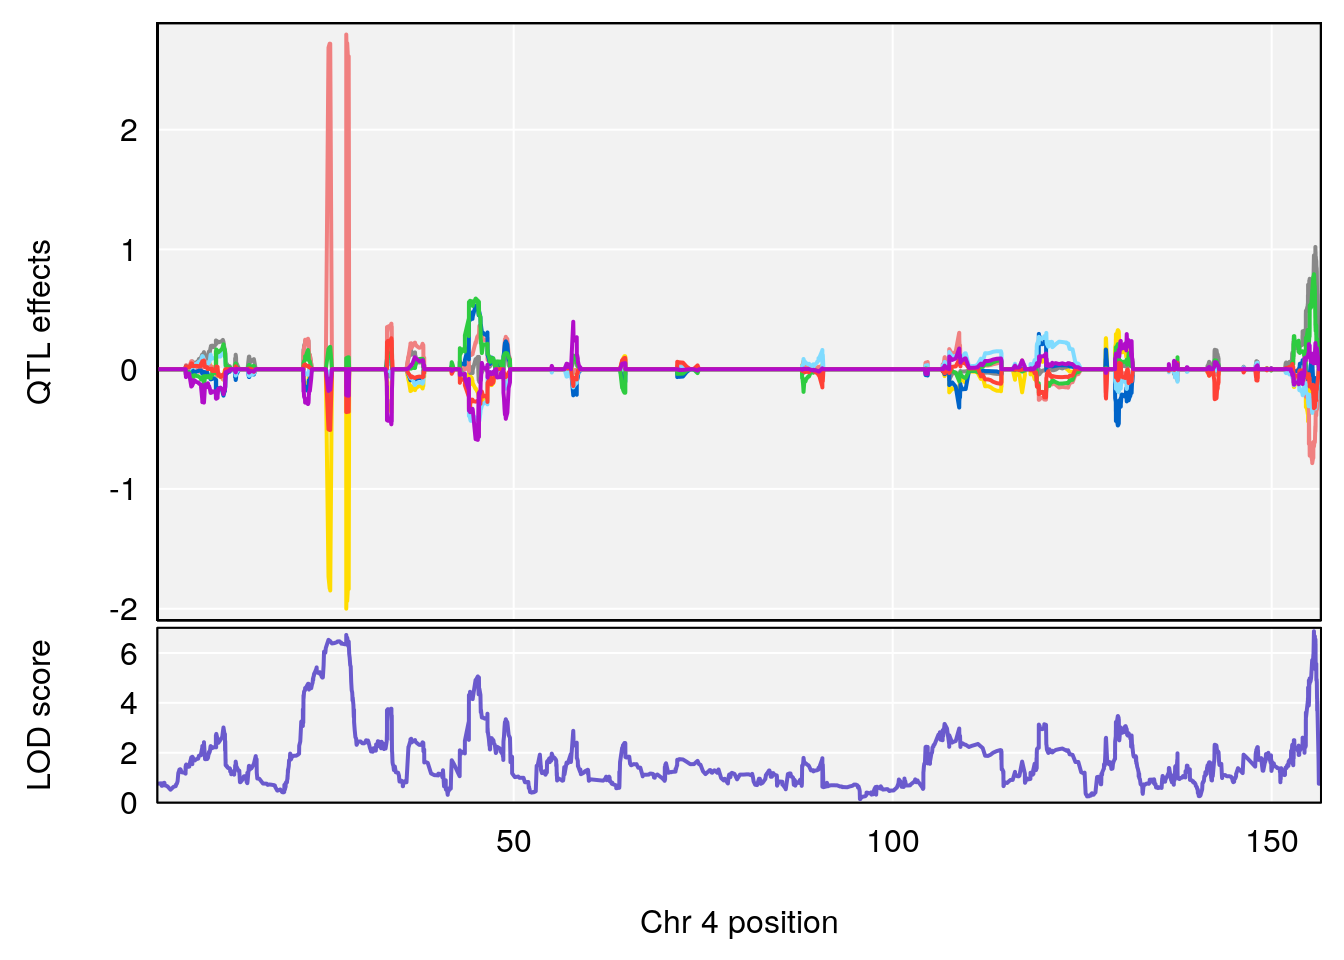
#save peaks coeff blup plot
for(i in names(qtl.morphine.out)){
print(i)
peaks <- find_peaks(qtl.morphine.out[[i]], map=pmap, threshold=6, drop=1.5)
fname <- paste("output/Fentanyl/DO_fentanyl_69k_alternate_metrics_",i,"_coefplot_blup.pdf",sep="")
pdf(file = fname, width = 16, height =8)
if(dim(peaks)[1] != 0){
for(p in 1:dim(peaks)[1]) {
print(p)
chr <-peaks[p,3]
#coeff plot
par(mar=c(4.1, 4.1, 0.6, 0.6))
plot_coefCC(coef_c2[[i]][[p]], pmap[chr], scan1_output=qtl.morphine.out[[i]], bgcolor="gray95", legend=NULL)
plot(out_snps[[i]][[p]]$lod, out_snps[[i]][[p]]$snpinfo, drop_hilit=1.5, genes=out_genes[[i]][[p]])
}
}
dev.off()
}
# [1] "Time.to.Dead.Hr"
# [1] 1
# [1] 2
# [1] "RR.Depression.Rate.Hr"
# [1] "Time.to.Steady.RR.Depression.Hr"
# [1] "Min.Depression.RR"
# [1] 1
# [1] 2
# [1] "Mean.Depression.BR"
# [1] 1
# [1] 2
# [1] 3
# [1] "Steady-State.Depression.Duration.Hr"
# [1] 1
# [1] 2
# [1] 3
# [1] "Time.to.Threshold.Recovery.Hr"
# [1] 1
# [1] 2
# [1] "Time.to.Projected.Recovery.Hr"
# [1] 1
# [1] "Start.of.Recovery.Hr"
# [1] 1
# [1] 2
# [1] "RR.Recovery.Rate.Hr"
# [1] 1
# [1] 2
# [1] 3###heritability
#plot heritability by qtl2 array
load("output/Fentanyl/qtl.fentanyl.array.alternate.metrics.out.RData")
herit <- data.frame(Phenotype = names(unlist(qtl.morphine.hsq)),
                    Heritability = round(unlist(qtl.morphine.hsq),2))
herit <- herit %>%
  arrange(desc(Heritability))
herit$Phenotype <- factor(herit$Phenotype, levels = herit$Phenotype)
#histgram
pdf(file = paste0("data/FinalReport/GCTA/DO_Fentanyl_alternate_metrics_heritability_by_qtl2_array.pdf"), height = 10, width = 10)
p1<-ggplot(data=herit, aes(x=Phenotype, y=Heritability)) + #, fill=Domain, color = Domain)) +
  geom_bar(stat="identity", fill = "blue", color = "blue", show.legend = FALSE) +
  scale_y_continuous(breaks=seq(0.0, 1.0, 0.1)) +
  geom_text(aes(label = Heritability, y = Heritability + 0.005), position = position_dodge(0.9),vjust = 0) +
  theme(axis.text.x = element_text(angle = 90, hjust = 1)) +
  ggtitle("Heritability by qtl2 array")
p1
dev.off()
# png
#   2
p1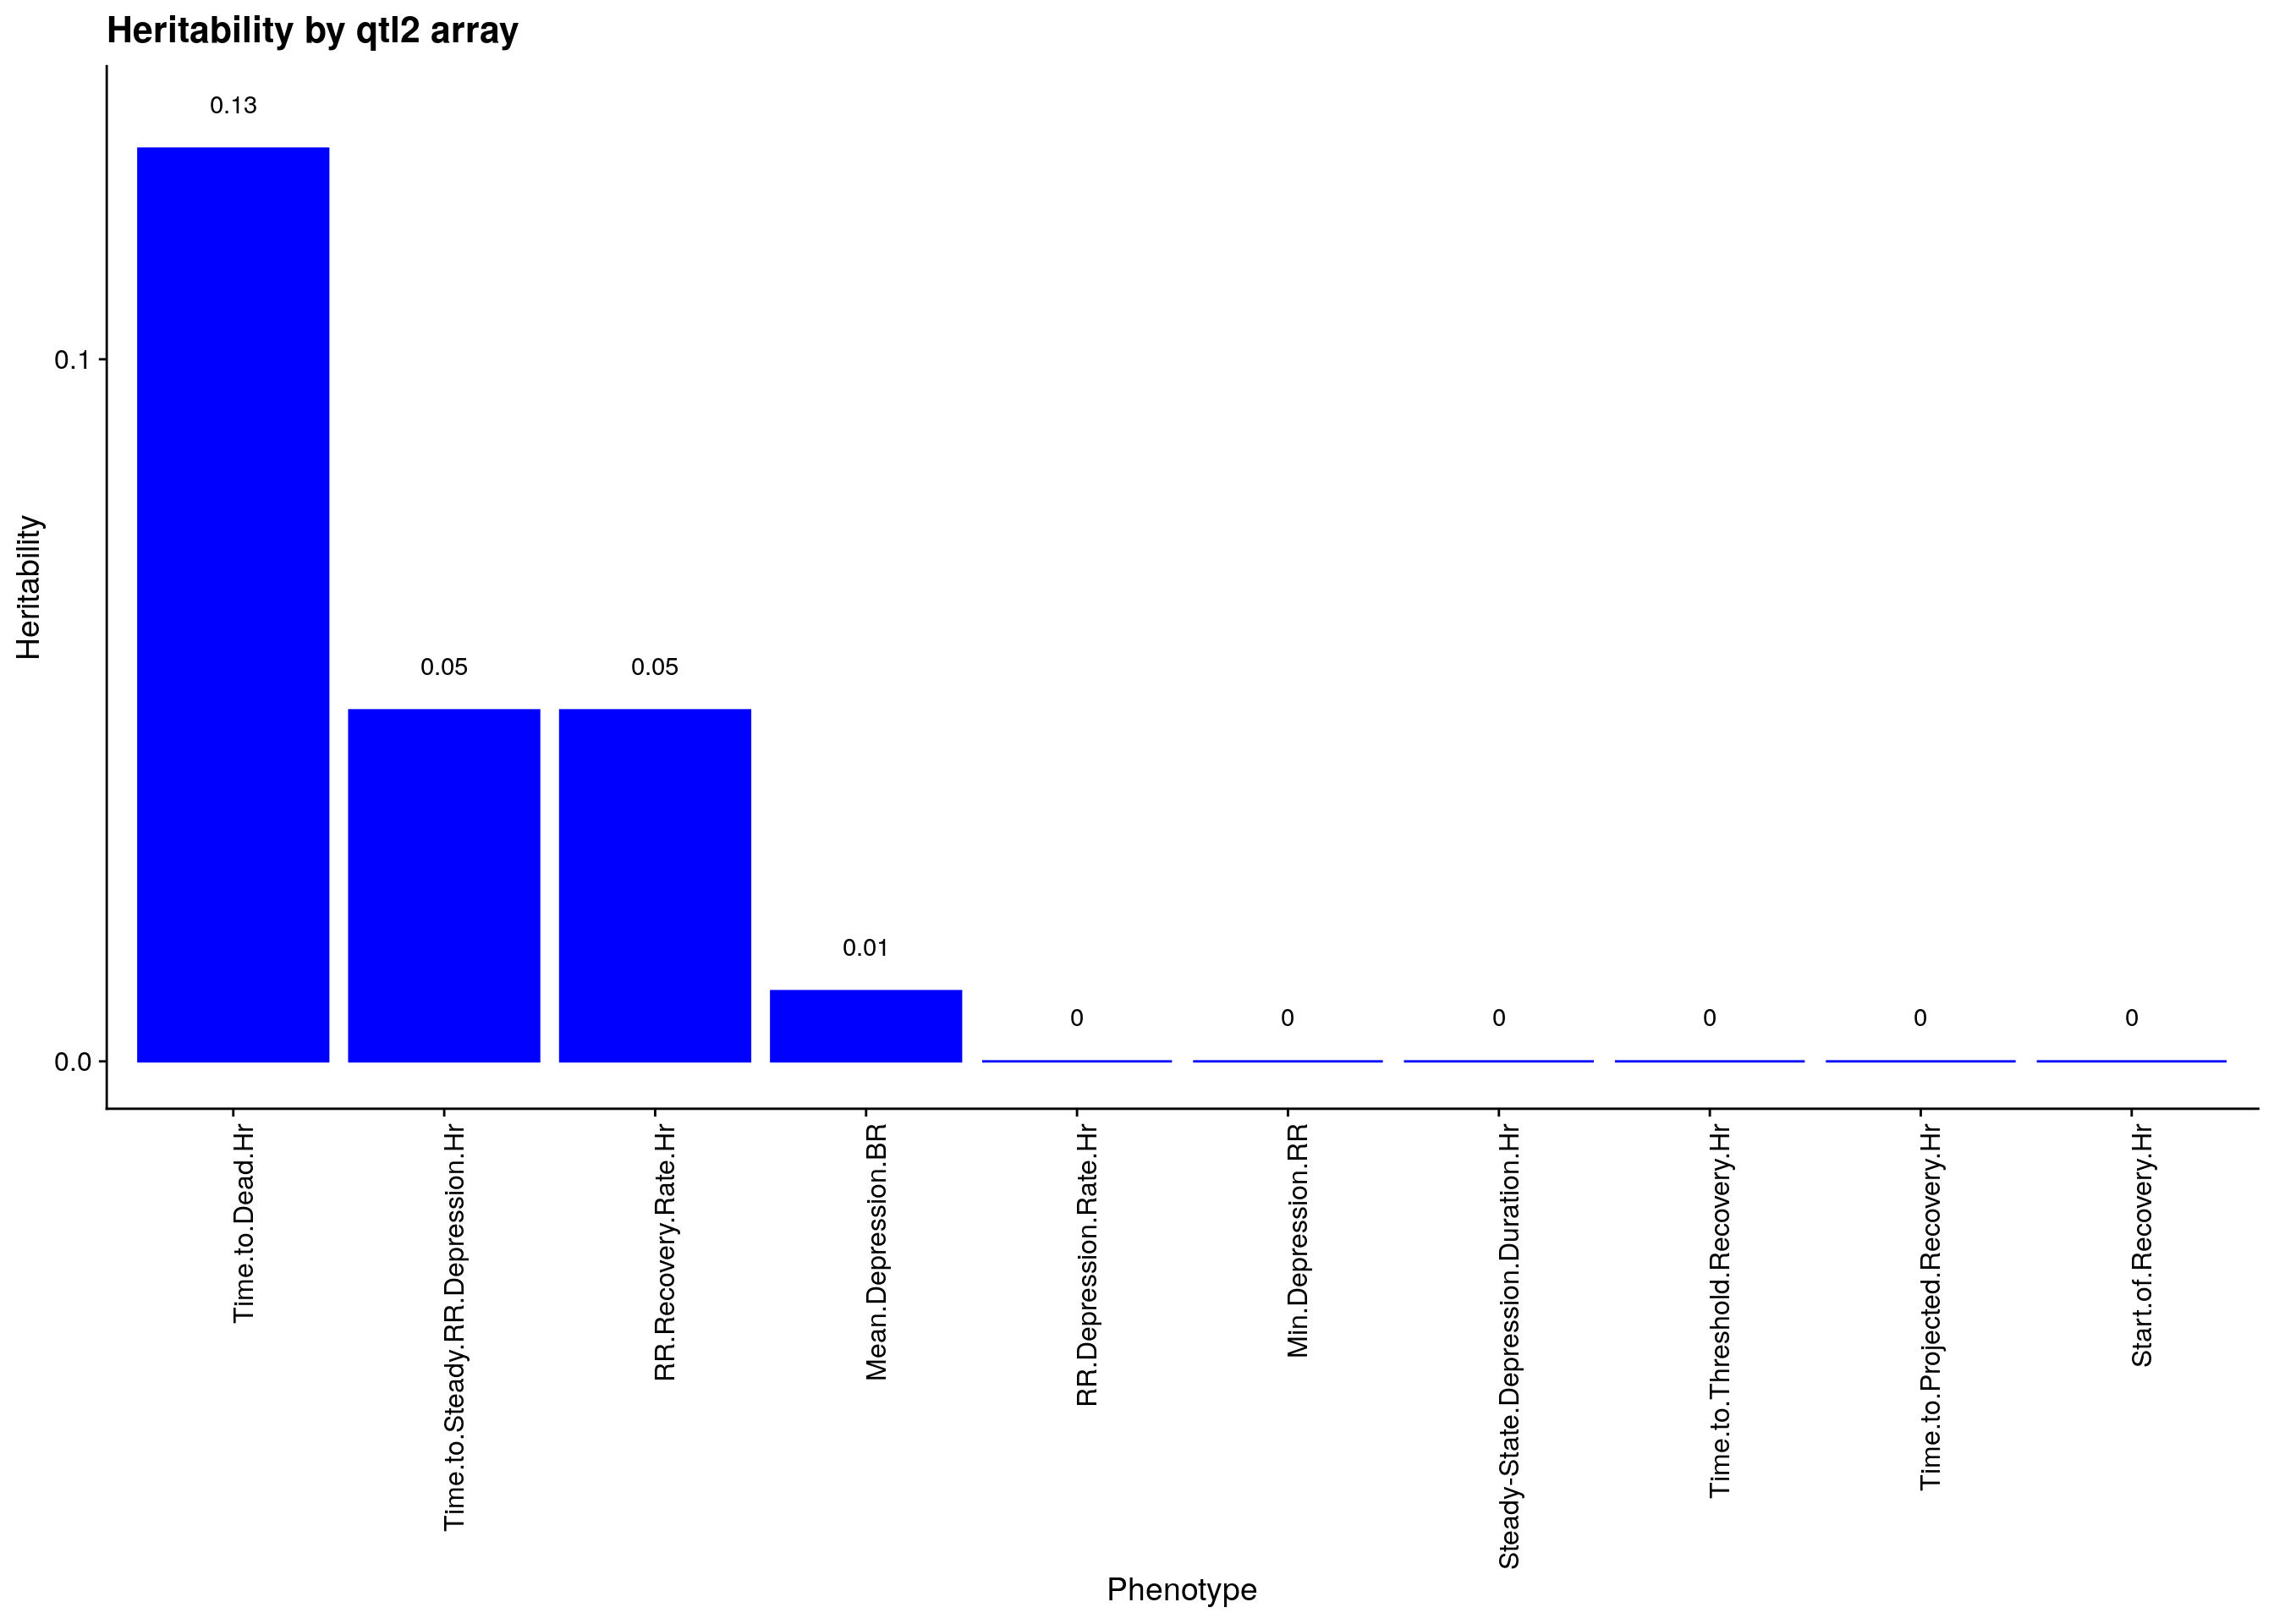
| Version | Author | Date |
|---|---|---|
| f412738 | xhyuo | 2021-12-20 |
#plot heritability by qtl2 69k
load("output/Fentanyl/qtl.fentanyl.69k.alternate.metrics.out.RData")
herit <- data.frame(Phenotype = names(unlist(qtl.morphine.hsq)),
                    Heritability = round(unlist(qtl.morphine.hsq),2))
herit <- herit %>%
  arrange(desc(Heritability))
herit$Phenotype <- factor(herit$Phenotype, levels = herit$Phenotype)
#histgram
pdf(file = paste0("data/FinalReport/GCTA/DO_Fentanyl_alternate_metrics_heritability_by_qtl2_69k.pdf"), height = 10, width = 10)
p2<-ggplot(data=herit, aes(x=Phenotype, y=Heritability)) + #, fill=Domain, color = Domain)) +
  geom_bar(stat="identity", fill = "blue", color = "blue", show.legend = FALSE) +
  scale_y_continuous(breaks=seq(0.0, 1.0, 0.1)) +
  geom_text(aes(label = Heritability, y = Heritability + 0.005), position = position_dodge(0.9),vjust = 0) +
  theme(axis.text.x = element_text(angle = 90, hjust = 1)) +
  ggtitle("Heritability by qtl2 69k")
p2
dev.off()
# png
#   2
p2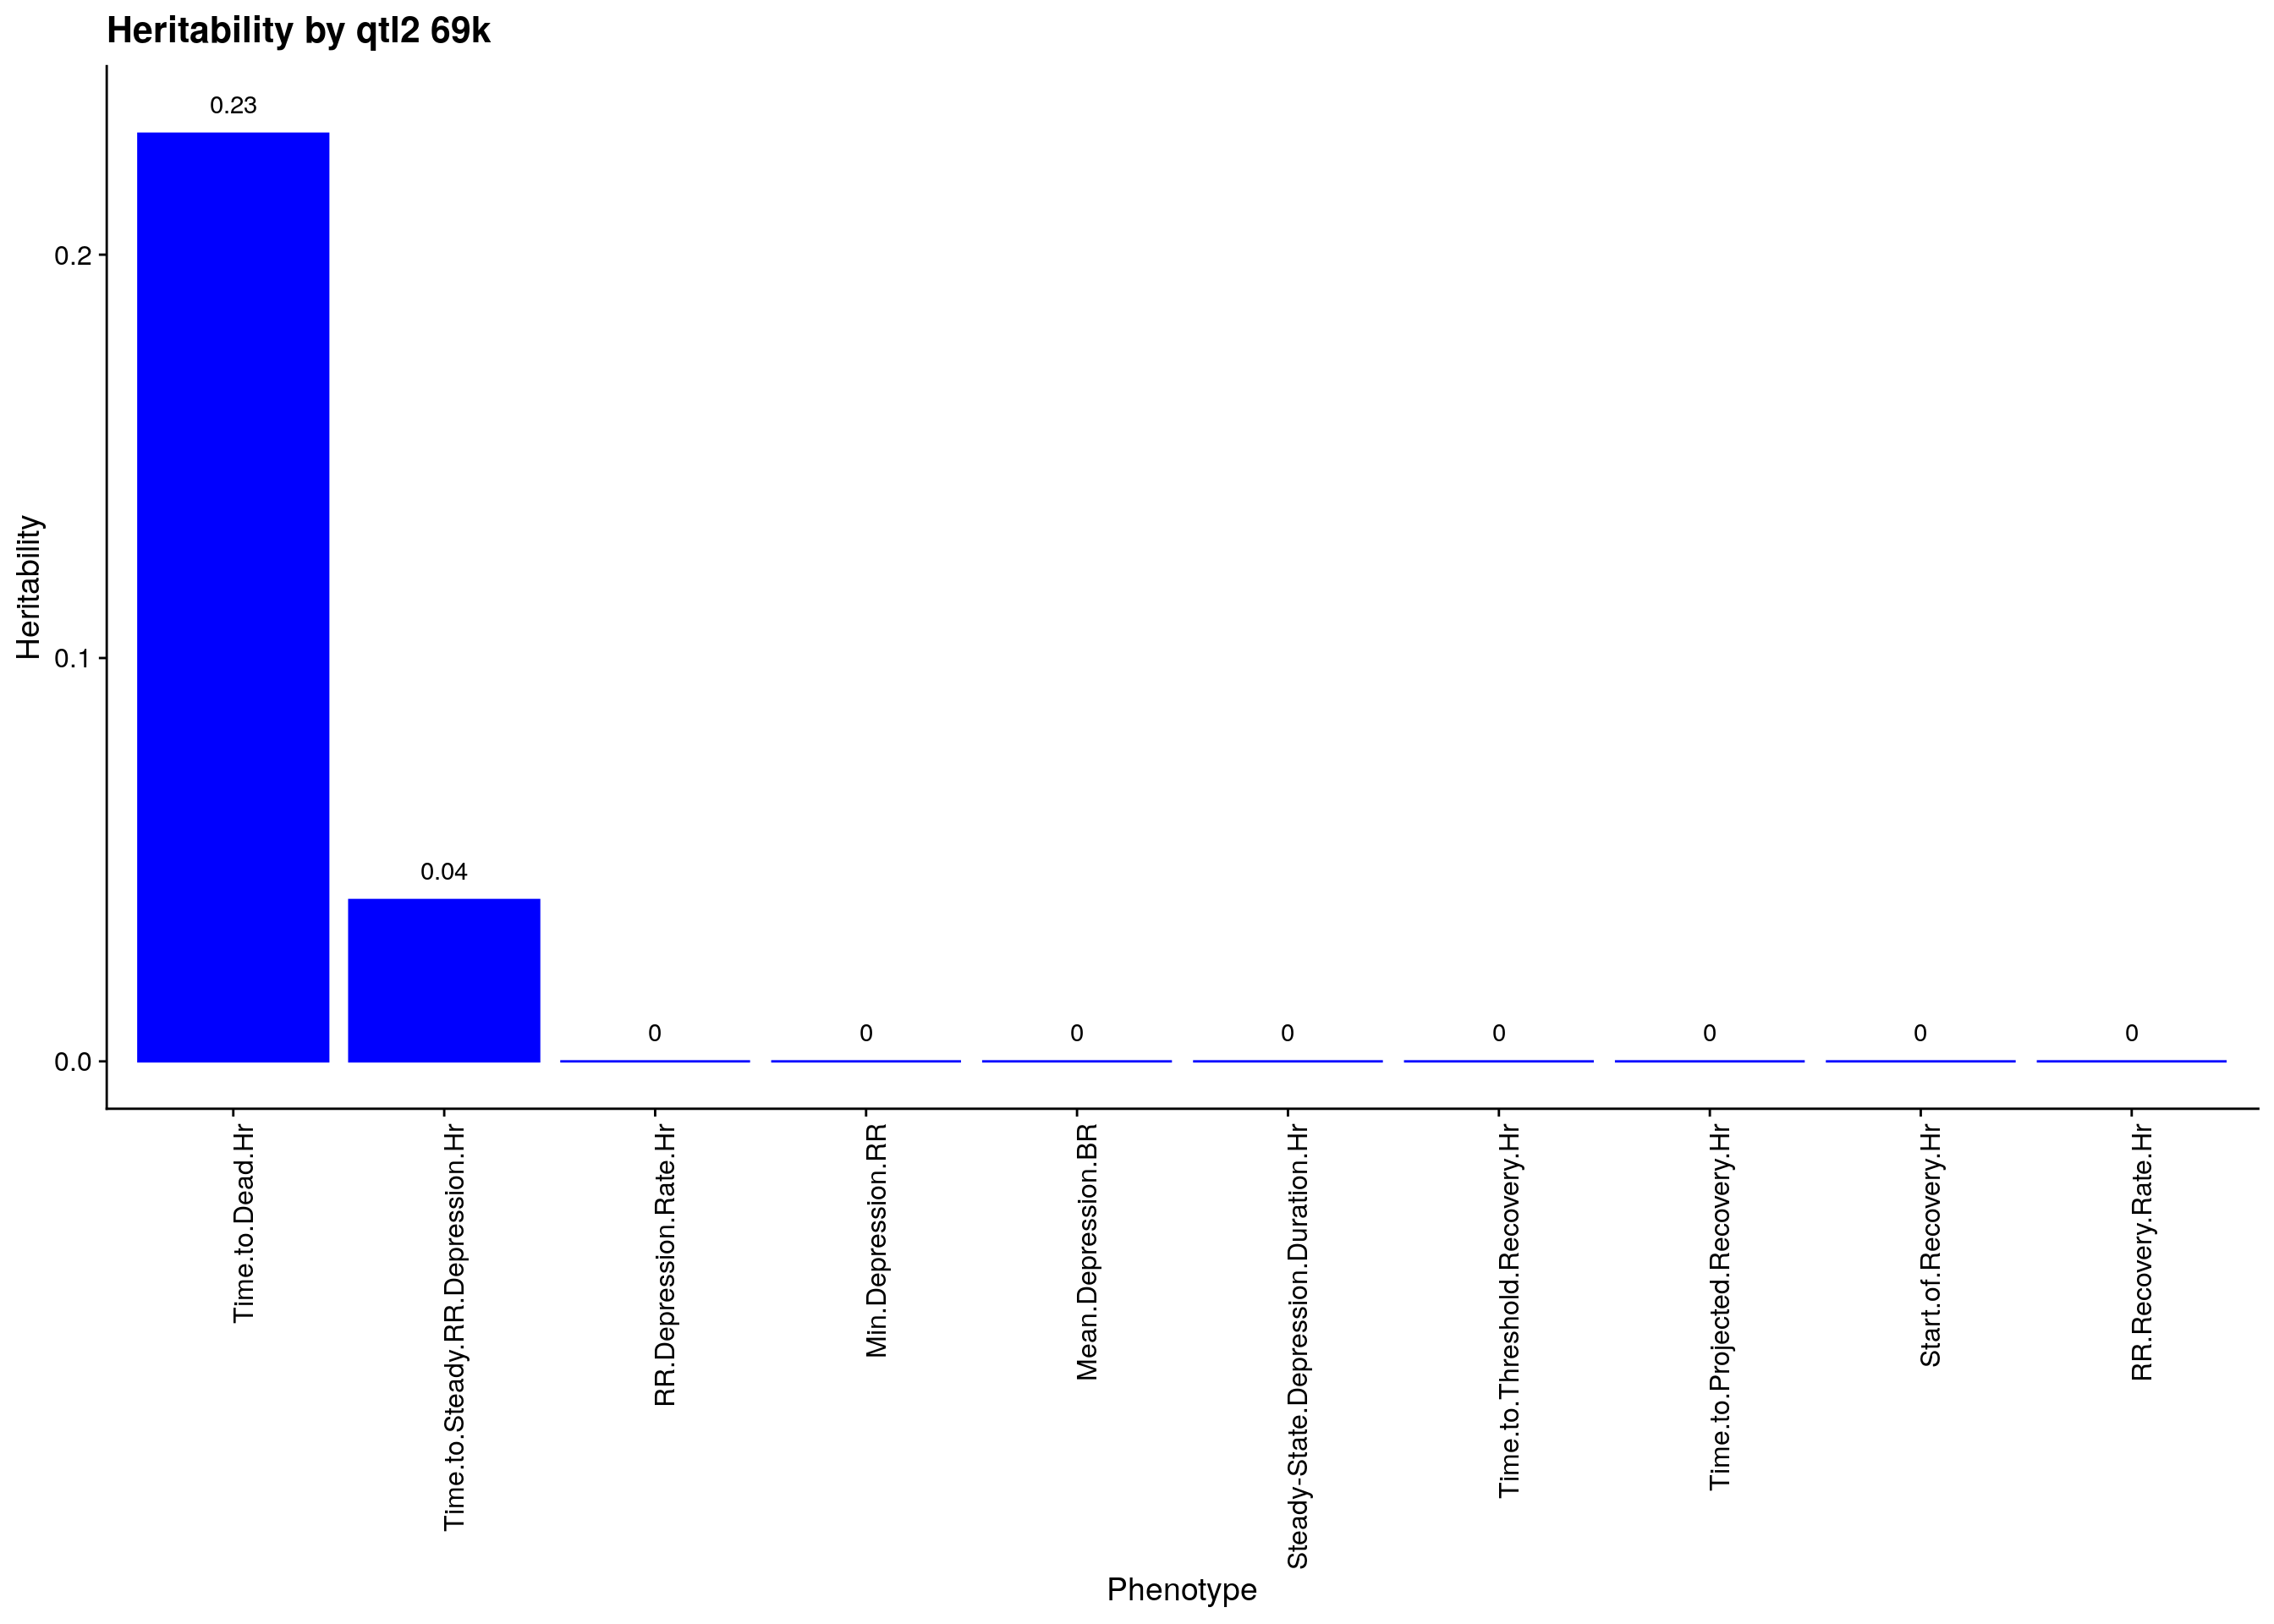
| Version | Author | Date |
|---|---|---|
| f412738 | xhyuo | 2021-12-20 |
sessionInfo()
# R version 4.0.3 (2020-10-10)
# Platform: x86_64-pc-linux-gnu (64-bit)
# Running under: Ubuntu 20.04.2 LTS
#
# Matrix products: default
# BLAS/LAPACK: /usr/lib/x86_64-linux-gnu/openblas-pthread/libopenblasp-r0.3.8.so
#
# locale:
#  [1] LC_CTYPE=en_US.UTF-8       LC_NUMERIC=C
#  [3] LC_TIME=en_US.UTF-8        LC_COLLATE=en_US.UTF-8
#  [5] LC_MONETARY=en_US.UTF-8    LC_MESSAGES=C
#  [7] LC_PAPER=en_US.UTF-8       LC_NAME=C
#  [9] LC_ADDRESS=C               LC_TELEPHONE=C
# [11] LC_MEASUREMENT=en_US.UTF-8 LC_IDENTIFICATION=C
#
# attached base packages:
# [1] parallel  stats     graphics  grDevices utils     datasets  methods
# [8] base
#
# other attached packages:
#  [1] qtl_1.47-9      patchwork_1.1.1 furrr_0.2.2     future_1.21.0
#  [5] cowplot_1.1.1   forcats_0.5.1   stringr_1.4.0   dplyr_1.0.4
#  [9] purrr_0.3.4     readr_1.4.0     tidyr_1.1.2     tibble_3.0.6
# [13] tidyverse_1.3.0 openxlsx_4.2.3  abind_1.4-5     regress_1.3-21
# [17] survival_3.2-7  qtl2_0.24       GGally_2.1.0    gridExtra_2.3
# [21] ggplot2_3.3.3   workflowr_1.6.2
#
# loaded via a namespace (and not attached):
#  [1] fs_1.5.0           lubridate_1.7.9.2  bit64_4.0.5        RColorBrewer_1.1-2
#  [5] httr_1.4.2         rprojroot_2.0.2    tools_4.0.3        backports_1.2.1
#  [9] R6_2.5.0           DBI_1.1.1          colorspace_2.0-0   withr_2.4.1
# [13] tidyselect_1.1.0   bit_4.0.4          compiler_4.0.3     git2r_0.28.0
# [17] cli_2.3.0          rvest_0.3.6        xml2_1.3.2         labeling_0.4.2
# [21] scales_1.1.1       digest_0.6.27      rmarkdown_2.6      pkgconfig_2.0.3
# [25] htmltools_0.5.1.1  parallelly_1.23.0  highr_0.8          dbplyr_2.1.0
# [29] fastmap_1.1.0      rlang_0.4.10       readxl_1.3.1       rstudioapi_0.13
# [33] RSQLite_2.2.3      farver_2.0.3       generics_0.1.0     jsonlite_1.7.2
# [37] zip_2.1.1          magrittr_2.0.1     Matrix_1.2-18      Rcpp_1.0.6
# [41] munsell_0.5.0      lifecycle_1.0.0    stringi_1.5.3      whisker_0.4
# [45] yaml_2.2.1         plyr_1.8.6         grid_4.0.3         blob_1.2.1
# [49] listenv_0.8.0      promises_1.2.0.1   crayon_1.4.1       lattice_0.20-41
# [53] haven_2.3.1        splines_4.0.3      hms_1.0.0          knitr_1.31
# [57] pillar_1.4.7       codetools_0.2-18   reprex_1.0.0       glue_1.4.2
# [61] evaluate_0.14      data.table_1.13.6  modelr_0.1.8       vctrs_0.3.6
# [65] httpuv_1.5.5       cellranger_1.1.0   gtable_0.3.0       reshape_0.8.8
# [69] assertthat_0.2.1   cachem_1.0.4       xfun_0.21          broom_0.7.4
# [73] later_1.1.0.1      memoise_2.0.0      globals_0.14.0     ellipsis_0.3.1
This R Markdown site was created with workflowr