Plot_DO_morphine_secondbatch
Hao He
2023-02-21
Last updated: 2023-02-21
Checks: 7 0
Knit directory: DO_Opioid/
This reproducible R Markdown analysis was created with workflowr (version 1.6.2). The Checks tab describes the reproducibility checks that were applied when the results were created. The Past versions tab lists the development history.
Great! Since the R Markdown file has been committed to the Git repository, you know the exact version of the code that produced these results.
Great job! The global environment was empty. Objects defined in the global environment can affect the analysis in your R Markdown file in unknown ways. For reproduciblity it’s best to always run the code in an empty environment.
The command set.seed(20200504) was run prior to running the code in the R Markdown file. Setting a seed ensures that any results that rely on randomness, e.g. subsampling or permutations, are reproducible.
Great job! Recording the operating system, R version, and package versions is critical for reproducibility.
Nice! There were no cached chunks for this analysis, so you can be confident that you successfully produced the results during this run.
Great job! Using relative paths to the files within your workflowr project makes it easier to run your code on other machines.
Great! You are using Git for version control. Tracking code development and connecting the code version to the results is critical for reproducibility.
The results in this page were generated with repository version cc3ae27. See the Past versions tab to see a history of the changes made to the R Markdown and HTML files.
Note that you need to be careful to ensure that all relevant files for the analysis have been committed to Git prior to generating the results (you can use wflow_publish or wflow_git_commit). workflowr only checks the R Markdown file, but you know if there are other scripts or data files that it depends on. Below is the status of the Git repository when the results were generated:
Ignored files:
    Ignored:    .RData
    Ignored:    .Rhistory
    Ignored:    .Rproj.user/
    Ignored:    analysis/Picture1.png

Untracked files:
    Untracked:  Rplot_rz.png
    Untracked:  TIMBR.test.prop.bm.MN.RET.RData
    Untracked:  TIMBR.test.random.RData
    Untracked:  TIMBR.test.rz.transformed_TVb_ml.RData
    Untracked:  analysis/DDO_morphine1_second_set_69k.stdout
    Untracked:  analysis/DO_Fentanyl.R
    Untracked:  analysis/DO_Fentanyl.err
    Untracked:  analysis/DO_Fentanyl.out
    Untracked:  analysis/DO_Fentanyl.sh
    Untracked:  analysis/DO_Fentanyl_69k.R
    Untracked:  analysis/DO_Fentanyl_69k.err
    Untracked:  analysis/DO_Fentanyl_69k.out
    Untracked:  analysis/DO_Fentanyl_69k.sh
    Untracked:  analysis/DO_Fentanyl_Cohort2_GCTA_herit.R
    Untracked:  analysis/DO_Fentanyl_Cohort2_gemma.R
    Untracked:  analysis/DO_Fentanyl_Cohort2_mapping.R
    Untracked:  analysis/DO_Fentanyl_Cohort2_mapping.err
    Untracked:  analysis/DO_Fentanyl_Cohort2_mapping.out
    Untracked:  analysis/DO_Fentanyl_Cohort2_mapping.sh
    Untracked:  analysis/DO_Fentanyl_GCTA_herit.R
    Untracked:  analysis/DO_Fentanyl_alternate_metrics_69k.R
    Untracked:  analysis/DO_Fentanyl_alternate_metrics_69k.err
    Untracked:  analysis/DO_Fentanyl_alternate_metrics_69k.out
    Untracked:  analysis/DO_Fentanyl_alternate_metrics_69k.sh
    Untracked:  analysis/DO_Fentanyl_alternate_metrics_array.R
    Untracked:  analysis/DO_Fentanyl_alternate_metrics_array.err
    Untracked:  analysis/DO_Fentanyl_alternate_metrics_array.out
    Untracked:  analysis/DO_Fentanyl_alternate_metrics_array.sh
    Untracked:  analysis/DO_Fentanyl_array.R
    Untracked:  analysis/DO_Fentanyl_array.err
    Untracked:  analysis/DO_Fentanyl_array.out
    Untracked:  analysis/DO_Fentanyl_array.sh
    Untracked:  analysis/DO_Fentanyl_combining2Cohort_GCTA_herit.R
    Untracked:  analysis/DO_Fentanyl_combining2Cohort_gemma.R
    Untracked:  analysis/DO_Fentanyl_combining2Cohort_mapping.R
    Untracked:  analysis/DO_Fentanyl_combining2Cohort_mapping.err
    Untracked:  analysis/DO_Fentanyl_combining2Cohort_mapping.out
    Untracked:  analysis/DO_Fentanyl_combining2Cohort_mapping.sh
    Untracked:  analysis/DO_Fentanyl_combining2Cohort_mapping_CoxPH.R
    Untracked:  analysis/DO_Fentanyl_finalreport_to_plink.sh
    Untracked:  analysis/DO_Fentanyl_gemma.R
    Untracked:  analysis/DO_Fentanyl_gemma.err
    Untracked:  analysis/DO_Fentanyl_gemma.out
    Untracked:  analysis/DO_Fentanyl_gemma.sh
    Untracked:  analysis/DO_morphine1.R
    Untracked:  analysis/DO_morphine1.Rout
    Untracked:  analysis/DO_morphine1.sh
    Untracked:  analysis/DO_morphine1.stderr
    Untracked:  analysis/DO_morphine1.stdout
    Untracked:  analysis/DO_morphine1_SNP.R
    Untracked:  analysis/DO_morphine1_SNP.Rout
    Untracked:  analysis/DO_morphine1_SNP.sh
    Untracked:  analysis/DO_morphine1_SNP.stderr
    Untracked:  analysis/DO_morphine1_SNP.stdout
    Untracked:  analysis/DO_morphine1_combined.R
    Untracked:  analysis/DO_morphine1_combined.Rout
    Untracked:  analysis/DO_morphine1_combined.sh
    Untracked:  analysis/DO_morphine1_combined.stderr
    Untracked:  analysis/DO_morphine1_combined.stdout
    Untracked:  analysis/DO_morphine1_combined_69k.R
    Untracked:  analysis/DO_morphine1_combined_69k.Rout
    Untracked:  analysis/DO_morphine1_combined_69k.sh
    Untracked:  analysis/DO_morphine1_combined_69k.stderr
    Untracked:  analysis/DO_morphine1_combined_69k.stdout
    Untracked:  analysis/DO_morphine1_combined_69k_m2.R
    Untracked:  analysis/DO_morphine1_combined_69k_m2.Rout
    Untracked:  analysis/DO_morphine1_combined_69k_m2.sh
    Untracked:  analysis/DO_morphine1_combined_69k_m2.stderr
    Untracked:  analysis/DO_morphine1_combined_69k_m2.stdout
    Untracked:  analysis/DO_morphine1_combined_weight_DOB.R
    Untracked:  analysis/DO_morphine1_combined_weight_DOB.Rout
    Untracked:  analysis/DO_morphine1_combined_weight_DOB.err
    Untracked:  analysis/DO_morphine1_combined_weight_DOB.out
    Untracked:  analysis/DO_morphine1_combined_weight_DOB.sh
    Untracked:  analysis/DO_morphine1_combined_weight_DOB.stderr
    Untracked:  analysis/DO_morphine1_combined_weight_DOB.stdout
    Untracked:  analysis/DO_morphine1_combined_weight_age.R
    Untracked:  analysis/DO_morphine1_combined_weight_age.err
    Untracked:  analysis/DO_morphine1_combined_weight_age.out
    Untracked:  analysis/DO_morphine1_combined_weight_age.sh
    Untracked:  analysis/DO_morphine1_combined_weight_age_GAMMT.R
    Untracked:  analysis/DO_morphine1_combined_weight_age_GAMMT.err
    Untracked:  analysis/DO_morphine1_combined_weight_age_GAMMT.out
    Untracked:  analysis/DO_morphine1_combined_weight_age_GAMMT.sh
    Untracked:  analysis/DO_morphine1_combined_weight_age_GAMMT_chr19.R
    Untracked:  analysis/DO_morphine1_combined_weight_age_GAMMT_chr19.err
    Untracked:  analysis/DO_morphine1_combined_weight_age_GAMMT_chr19.out
    Untracked:  analysis/DO_morphine1_combined_weight_age_GAMMT_chr19.sh
    Untracked:  analysis/DO_morphine1_cph.R
    Untracked:  analysis/DO_morphine1_cph.Rout
    Untracked:  analysis/DO_morphine1_cph.sh
    Untracked:  analysis/DO_morphine1_second_set.R
    Untracked:  analysis/DO_morphine1_second_set.Rout
    Untracked:  analysis/DO_morphine1_second_set.sh
    Untracked:  analysis/DO_morphine1_second_set.stderr
    Untracked:  analysis/DO_morphine1_second_set.stdout
    Untracked:  analysis/DO_morphine1_second_set_69k.R
    Untracked:  analysis/DO_morphine1_second_set_69k.Rout
    Untracked:  analysis/DO_morphine1_second_set_69k.sh
    Untracked:  analysis/DO_morphine1_second_set_69k.stderr
    Untracked:  analysis/DO_morphine1_second_set_SNP.R
    Untracked:  analysis/DO_morphine1_second_set_SNP.Rout
    Untracked:  analysis/DO_morphine1_second_set_SNP.sh
    Untracked:  analysis/DO_morphine1_second_set_SNP.stderr
    Untracked:  analysis/DO_morphine1_second_set_SNP.stdout
    Untracked:  analysis/DO_morphine1_second_set_weight_DOB.R
    Untracked:  analysis/DO_morphine1_second_set_weight_DOB.Rout
    Untracked:  analysis/DO_morphine1_second_set_weight_DOB.err
    Untracked:  analysis/DO_morphine1_second_set_weight_DOB.out
    Untracked:  analysis/DO_morphine1_second_set_weight_DOB.sh
    Untracked:  analysis/DO_morphine1_second_set_weight_DOB.stderr
    Untracked:  analysis/DO_morphine1_second_set_weight_DOB.stdout
    Untracked:  analysis/DO_morphine1_second_set_weight_age.R
    Untracked:  analysis/DO_morphine1_second_set_weight_age.Rout
    Untracked:  analysis/DO_morphine1_second_set_weight_age.err
    Untracked:  analysis/DO_morphine1_second_set_weight_age.out
    Untracked:  analysis/DO_morphine1_second_set_weight_age.sh
    Untracked:  analysis/DO_morphine1_second_set_weight_age.stderr
    Untracked:  analysis/DO_morphine1_second_set_weight_age.stdout
    Untracked:  analysis/DO_morphine1_weight_DOB.R
    Untracked:  analysis/DO_morphine1_weight_DOB.sh
    Untracked:  analysis/DO_morphine1_weight_age.R
    Untracked:  analysis/DO_morphine1_weight_age.sh
    Untracked:  analysis/DO_morphine_gemma.R
    Untracked:  analysis/DO_morphine_gemma.err
    Untracked:  analysis/DO_morphine_gemma.out
    Untracked:  analysis/DO_morphine_gemma.sh
    Untracked:  analysis/DO_morphine_gemma_firstmin.R
    Untracked:  analysis/DO_morphine_gemma_firstmin.err
    Untracked:  analysis/DO_morphine_gemma_firstmin.out
    Untracked:  analysis/DO_morphine_gemma_firstmin.sh
    Untracked:  analysis/DO_morphine_gemma_withpermu.R
    Untracked:  analysis/DO_morphine_gemma_withpermu.err
    Untracked:  analysis/DO_morphine_gemma_withpermu.out
    Untracked:  analysis/DO_morphine_gemma_withpermu.sh
    Untracked:  analysis/DO_morphine_gemma_withpermu_firstbatch_min.depression.R
    Untracked:  analysis/DO_morphine_gemma_withpermu_firstbatch_min.depression.err
    Untracked:  analysis/DO_morphine_gemma_withpermu_firstbatch_min.depression.out
    Untracked:  analysis/DO_morphine_gemma_withpermu_firstbatch_min.depression.sh
    Untracked:  analysis/Plot_DO_morphine1_SNP.R
    Untracked:  analysis/Plot_DO_morphine1_SNP.Rout
    Untracked:  analysis/Plot_DO_morphine1_SNP.sh
    Untracked:  analysis/Plot_DO_morphine1_SNP.stderr
    Untracked:  analysis/Plot_DO_morphine1_SNP.stdout
    Untracked:  analysis/Plot_DO_morphine1_second_set_SNP.R
    Untracked:  analysis/Plot_DO_morphine1_second_set_SNP.Rout
    Untracked:  analysis/Plot_DO_morphine1_second_set_SNP.sh
    Untracked:  analysis/Plot_DO_morphine1_second_set_SNP.stderr
    Untracked:  analysis/Plot_DO_morphine1_second_set_SNP.stdout
    Untracked:  analysis/download_GSE100356_sra.sh
    Untracked:  analysis/fentanyl_2cohorts_coxph.R
    Untracked:  analysis/fentanyl_2cohorts_coxph.err
    Untracked:  analysis/fentanyl_2cohorts_coxph.out
    Untracked:  analysis/fentanyl_2cohorts_coxph.sh
    Untracked:  analysis/fentanyl_scanone.cph.R
    Untracked:  analysis/fentanyl_scanone.cph.err
    Untracked:  analysis/fentanyl_scanone.cph.out
    Untracked:  analysis/fentanyl_scanone.cph.sh
    Untracked:  analysis/geo_rnaseq.R
    Untracked:  analysis/heritability_first_second_batch.R
    Untracked:  analysis/nf-rnaseq-b6.R
    Untracked:  analysis/plot_fentanyl_2cohorts_coxph.R
    Untracked:  analysis/scripts/
    Untracked:  analysis/tibmr.R
    Untracked:  analysis/timbr_demo.R
    Untracked:  analysis/workflow_proc.R
    Untracked:  analysis/workflow_proc.sh
    Untracked:  analysis/workflow_proc.stderr
    Untracked:  analysis/workflow_proc.stdout
    Untracked:  analysis/x.R
    Untracked:  code/cfw/
    Untracked:  code/gemma_plot.R
    Untracked:  code/process.sanger.snp.R
    Untracked:  code/reconst_utils.R
    Untracked:  data/69k_grid_pgmap.RData
    Untracked:  data/Composite Post Kevins Program Group 2 Fentanyl Prepped for Hao.xlsx
    Untracked:  data/DO_WBP_Data_JAB_to_map.xlsx
    Untracked:  data/Fentanyl_alternate_metrics.xlsx
    Untracked:  data/FinalReport/
    Untracked:  data/GM/
    Untracked:  data/GM_covar.csv
    Untracked:  data/GM_covar_07092018_morphine.csv
    Untracked:  data/Jackson_Lab_Bubier_MURGIGV01/
    Untracked:  data/MPD_Upload_October.csv
    Untracked:  data/MPD_Upload_October_updated_sex.csv
    Untracked:  data/Master Fentanyl DO Study Sheet.xlsx
    Untracked:  data/MasterMorphine Second Set DO w DOB2.xlsx
    Untracked:  data/MasterMorphine Second Set DO.xlsx
    Untracked:  data/Morphine CC DO mice Updated with Published inbred strains.csv
    Untracked:  data/Morphine_CC_DO_mice_Updated_with_Published_inbred_strains.csv
    Untracked:  data/cc_variants.sqlite
    Untracked:  data/combined/
    Untracked:  data/fentanyl/
    Untracked:  data/fentanyl2/
    Untracked:  data/fentanyl_1_2/
    Untracked:  data/fentanyl_2cohorts_coxph_data.Rdata
    Untracked:  data/first/
    Untracked:  data/founder_geno.csv
    Untracked:  data/genetic_map.csv
    Untracked:  data/gm.json
    Untracked:  data/gwas.sh
    Untracked:  data/marker_grid_0.02cM_plus.txt
    Untracked:  data/mouse_genes_mgi.sqlite
    Untracked:  data/pheno.csv
    Untracked:  data/pheno_qtl2.csv
    Untracked:  data/pheno_qtl2_07092018_morphine.csv
    Untracked:  data/pheno_qtl2_w_dob.csv
    Untracked:  data/physical_map.csv
    Untracked:  data/rnaseq/
    Untracked:  data/sample_geno.csv
    Untracked:  data/second/
    Untracked:  figure/
    Untracked:  glimma-plots/
    Untracked:  output/DO_Fentanyl_Cohort2_MinDepressionRR_coefplot.pdf
    Untracked:  output/DO_Fentanyl_Cohort2_MinDepressionRR_coefplot_blup.pdf
    Untracked:  output/DO_Fentanyl_Cohort2_RRDepressionRateHrSLOPE_coefplot.pdf
    Untracked:  output/DO_Fentanyl_Cohort2_RRRecoveryRateHrSLOPE_coefplot.pdf
    Untracked:  output/DO_Fentanyl_Cohort2_RRRecoveryRateHrSLOPE_coefplot_blup.pdf
    Untracked:  output/DO_Fentanyl_Cohort2_StartofRecoveryHr_coefplot.pdf
    Untracked:  output/DO_Fentanyl_Cohort2_StartofRecoveryHr_coefplot_blup.pdf
    Untracked:  output/DO_Fentanyl_Cohort2_Statusbin_coefplot.pdf
    Untracked:  output/DO_Fentanyl_Cohort2_Statusbin_coefplot_blup.pdf
    Untracked:  output/DO_Fentanyl_Cohort2_SteadyStateDepressionDurationHrINTERVAL_coefplot.pdf
    Untracked:  output/DO_Fentanyl_Cohort2_TimetoDead(Hr)_coefplot.pdf
    Untracked:  output/DO_Fentanyl_Cohort2_TimetoDeadHr_coefplot.pdf
    Untracked:  output/DO_Fentanyl_Cohort2_TimetoDeadHr_coefplot_blup.pdf
    Untracked:  output/DO_Fentanyl_Cohort2_TimetoProjectedRecoveryHr_coefplot.pdf
    Untracked:  output/DO_Fentanyl_Cohort2_TimetoProjectedRecoveryHr_coefplot_blup.pdf
    Untracked:  output/DO_Fentanyl_Cohort2_TimetoSteadyRRDepression(Hr)_coefplot.pdf
    Untracked:  output/DO_Fentanyl_Cohort2_TimetoSteadyRRDepressionHr_coefplot.pdf
    Untracked:  output/DO_Fentanyl_Cohort2_TimetoSteadyRRDepressionHr_coefplot_blup.pdf
    Untracked:  output/DO_Fentanyl_Cohort2_TimetoThresholdRecoveryHr_coefplot.pdf
    Untracked:  output/DO_Fentanyl_Cohort2_TimetoThresholdRecoveryHr_coefplot_blup.pdf
    Untracked:  output/DO_morphine_Min.depression.png
    Untracked:  output/DO_morphine_Min.depression22222_violin_chr5.pdf
    Untracked:  output/DO_morphine_Min.depression_coefplot.pdf
    Untracked:  output/DO_morphine_Min.depression_coefplot_blup.pdf
    Untracked:  output/DO_morphine_Min.depression_coefplot_blup_chr5.png
    Untracked:  output/DO_morphine_Min.depression_coefplot_blup_chrX.png
    Untracked:  output/DO_morphine_Min.depression_coefplot_chr5.png
    Untracked:  output/DO_morphine_Min.depression_coefplot_chrX.png
    Untracked:  output/DO_morphine_Min.depression_peak_genes_chr5.png
    Untracked:  output/DO_morphine_Min.depression_violin_chr5.png
    Untracked:  output/DO_morphine_Recovery.Time.png
    Untracked:  output/DO_morphine_Recovery.Time_coefplot.pdf
    Untracked:  output/DO_morphine_Recovery.Time_coefplot_blup.pdf
    Untracked:  output/DO_morphine_Recovery.Time_coefplot_blup_chr11.png
    Untracked:  output/DO_morphine_Recovery.Time_coefplot_blup_chr4.png
    Untracked:  output/DO_morphine_Recovery.Time_coefplot_blup_chr7.png
    Untracked:  output/DO_morphine_Recovery.Time_coefplot_blup_chr9.png
    Untracked:  output/DO_morphine_Recovery.Time_coefplot_chr11.png
    Untracked:  output/DO_morphine_Recovery.Time_coefplot_chr4.png
    Untracked:  output/DO_morphine_Recovery.Time_coefplot_chr7.png
    Untracked:  output/DO_morphine_Recovery.Time_coefplot_chr9.png
    Untracked:  output/DO_morphine_Status_bin.png
    Untracked:  output/DO_morphine_Status_bin_coefplot.pdf
    Untracked:  output/DO_morphine_Status_bin_coefplot_blup.pdf
    Untracked:  output/DO_morphine_Survival.Time.png
    Untracked:  output/DO_morphine_Survival.Time_coefplot.pdf
    Untracked:  output/DO_morphine_Survival.Time_coefplot_blup.pdf
    Untracked:  output/DO_morphine_Survival.Time_coefplot_blup_chr17.png
    Untracked:  output/DO_morphine_Survival.Time_coefplot_blup_chr8.png
    Untracked:  output/DO_morphine_Survival.Time_coefplot_chr17.png
    Untracked:  output/DO_morphine_Survival.Time_coefplot_chr8.png
    Untracked:  output/DO_morphine_combine_batch_peak_violin.pdf
    Untracked:  output/DO_morphine_combined_69k_m2_Min.depression.png
    Untracked:  output/DO_morphine_combined_69k_m2_Min.depression_coefplot.pdf
    Untracked:  output/DO_morphine_combined_69k_m2_Min.depression_coefplot_blup.pdf
    Untracked:  output/DO_morphine_combined_69k_m2_Recovery.Time.png
    Untracked:  output/DO_morphine_combined_69k_m2_Recovery.Time_coefplot.pdf
    Untracked:  output/DO_morphine_combined_69k_m2_Recovery.Time_coefplot_blup.pdf
    Untracked:  output/DO_morphine_combined_69k_m2_Status_bin.png
    Untracked:  output/DO_morphine_combined_69k_m2_Status_bin_coefplot.pdf
    Untracked:  output/DO_morphine_combined_69k_m2_Status_bin_coefplot_blup.pdf
    Untracked:  output/DO_morphine_combined_69k_m2_Survival.Time.png
    Untracked:  output/DO_morphine_combined_69k_m2_Survival.Time_coefplot.pdf
    Untracked:  output/DO_morphine_combined_69k_m2_Survival.Time_coefplot_blup.pdf
    Untracked:  output/DO_morphine_coxph_24hrs_kinship_QTL.png
    Untracked:  output/DO_morphine_cphout.RData
    Untracked:  output/DO_morphine_first_batch_peak_in_second_batch_violin.pdf
    Untracked:  output/DO_morphine_first_batch_peak_in_second_batch_violin_sidebyside.pdf
    Untracked:  output/DO_morphine_first_batch_peak_violin.pdf
    Untracked:  output/DO_morphine_operm.cph.RData
    Untracked:  output/DO_morphine_second_batch_on_first_batch_peak_violin.pdf
    Untracked:  output/DO_morphine_second_batch_peak_ch6surv_on_first_batchviolin.pdf
    Untracked:  output/DO_morphine_second_batch_peak_ch6surv_on_first_batchviolin2.pdf
    Untracked:  output/DO_morphine_second_batch_peak_in_first_batch_violin.pdf
    Untracked:  output/DO_morphine_second_batch_peak_in_first_batch_violin_sidebyside.pdf
    Untracked:  output/DO_morphine_second_batch_peak_violin.pdf
    Untracked:  output/DO_morphine_secondbatch_69k_Min.depression.png
    Untracked:  output/DO_morphine_secondbatch_69k_Min.depression_coefplot.pdf
    Untracked:  output/DO_morphine_secondbatch_69k_Min.depression_coefplot_blup.pdf
    Untracked:  output/DO_morphine_secondbatch_69k_Recovery.Time.png
    Untracked:  output/DO_morphine_secondbatch_69k_Recovery.Time_coefplot.pdf
    Untracked:  output/DO_morphine_secondbatch_69k_Recovery.Time_coefplot_blup.pdf
    Untracked:  output/DO_morphine_secondbatch_69k_Status_bin.png
    Untracked:  output/DO_morphine_secondbatch_69k_Status_bin_coefplot.pdf
    Untracked:  output/DO_morphine_secondbatch_69k_Status_bin_coefplot_blup.pdf
    Untracked:  output/DO_morphine_secondbatch_69k_Survival.Time.png
    Untracked:  output/DO_morphine_secondbatch_69k_Survival.Time_coefplot.pdf
    Untracked:  output/DO_morphine_secondbatch_69k_Survival.Time_coefplot_blup.pdf
    Untracked:  output/DO_morphine_secondbatch_Min.depression.png
    Untracked:  output/DO_morphine_secondbatch_Min.depression_coefplot.pdf
    Untracked:  output/DO_morphine_secondbatch_Min.depression_coefplot_blup.pdf
    Untracked:  output/DO_morphine_secondbatch_Recovery.Time.png
    Untracked:  output/DO_morphine_secondbatch_Recovery.Time_coefplot.pdf
    Untracked:  output/DO_morphine_secondbatch_Recovery.Time_coefplot_blup.pdf
    Untracked:  output/DO_morphine_secondbatch_Status_bin.png
    Untracked:  output/DO_morphine_secondbatch_Status_bin_coefplot.pdf
    Untracked:  output/DO_morphine_secondbatch_Status_bin_coefplot_blup.pdf
    Untracked:  output/DO_morphine_secondbatch_Survival.Time.png
    Untracked:  output/DO_morphine_secondbatch_Survival.Time_coefplot.pdf
    Untracked:  output/DO_morphine_secondbatch_Survival.Time_coefplot_blup.pdf
    Untracked:  output/Fentanyl/
    Untracked:  output/KPNA3.pdf
    Untracked:  output/SSC4D.pdf
    Untracked:  output/TIMBR.test.RData
    Untracked:  output/apr_69kchr_combined.RData
    Untracked:  output/apr_69kchr_k_loco_combined.rds
    Untracked:  output/apr_69kchr_second_set.RData
    Untracked:  output/combine_batch_variation.RData
    Untracked:  output/combined_gm.RData
    Untracked:  output/combined_gm.k_loco.rds
    Untracked:  output/combined_gm.k_overall.rds
    Untracked:  output/combined_gm.probs_8state.rds
    Untracked:  output/coxph/
    Untracked:  output/do.morphine.RData
    Untracked:  output/do.morphine.k_loco.rds
    Untracked:  output/do.morphine.probs_36state.rds
    Untracked:  output/do.morphine.probs_8state.rds
    Untracked:  output/do_Fentanyl_combine2cohort_MeanDepressionBR_coefplot.pdf
    Untracked:  output/do_Fentanyl_combine2cohort_MeanDepressionBR_coefplot_blup.pdf
    Untracked:  output/do_Fentanyl_combine2cohort_MinDepressionBR_coefplot.pdf
    Untracked:  output/do_Fentanyl_combine2cohort_MinDepressionBR_coefplot_blup.pdf
    Untracked:  output/do_Fentanyl_combine2cohort_MinDepressionRR_coefplot.pdf
    Untracked:  output/do_Fentanyl_combine2cohort_MinDepressionRR_coefplot_blup.pdf
    Untracked:  output/do_Fentanyl_combine2cohort_RRRecoveryRateHr_coefplot.pdf
    Untracked:  output/do_Fentanyl_combine2cohort_RRRecoveryRateHr_coefplot_blup.pdf
    Untracked:  output/do_Fentanyl_combine2cohort_StartofRecoveryHr_coefplot.pdf
    Untracked:  output/do_Fentanyl_combine2cohort_StartofRecoveryHr_coefplot_blup.pdf
    Untracked:  output/do_Fentanyl_combine2cohort_Statusbin_coefplot.pdf
    Untracked:  output/do_Fentanyl_combine2cohort_Statusbin_coefplot_blup.pdf
    Untracked:  output/do_Fentanyl_combine2cohort_SteadyStateDepressionDurationHr_coefplot.pdf
    Untracked:  output/do_Fentanyl_combine2cohort_SteadyStateDepressionDurationHr_coefplot_blup.pdf
    Untracked:  output/do_Fentanyl_combine2cohort_SurvivalTime_coefplot.pdf
    Untracked:  output/do_Fentanyl_combine2cohort_SurvivalTime_coefplot_blup.pdf
    Untracked:  output/do_Fentanyl_combine2cohort_TimetoDeadHr_coefplot.pdf
    Untracked:  output/do_Fentanyl_combine2cohort_TimetoDeadHr_coefplot_blup.pdf
    Untracked:  output/do_Fentanyl_combine2cohort_TimetoMostlyDeadHr_coefplot.pdf
    Untracked:  output/do_Fentanyl_combine2cohort_TimetoMostlyDeadHr_coefplot_blup.pdf
    Untracked:  output/do_Fentanyl_combine2cohort_TimetoProjectedRecoveryHr_coefplot.pdf
    Untracked:  output/do_Fentanyl_combine2cohort_TimetoProjectedRecoveryHr_coefplot_blup.pdf
    Untracked:  output/do_Fentanyl_combine2cohort_TimetoRecoveryHr_coefplot.pdf
    Untracked:  output/do_Fentanyl_combine2cohort_TimetoRecoveryHr_coefplot_blup.pdf
    Untracked:  output/first_batch_variation.RData
    Untracked:  output/first_second_survival_peak_chr.xlsx
    Untracked:  output/hsq_1_first_batch_herit_qtl2.RData
    Untracked:  output/hsq_2_second_batch_herit_qtl2.RData
    Untracked:  output/old_temp/
    Untracked:  output/pr_69kchr_combined.RData
    Untracked:  output/pr_69kchr_second_set.RData
    Untracked:  output/qtl.morphine.69k.out.combined.RData
    Untracked:  output/qtl.morphine.69k.out.combined_m2.RData
    Untracked:  output/qtl.morphine.69k.out.second_set.RData
    Untracked:  output/qtl.morphine.operm.RData
    Untracked:  output/qtl.morphine.out.RData
    Untracked:  output/qtl.morphine.out.combined_gm.RData
    Untracked:  output/qtl.morphine.out.combined_gm.female.RData
    Untracked:  output/qtl.morphine.out.combined_gm.male.RData
    Untracked:  output/qtl.morphine.out.combined_weight_DOB.RData
    Untracked:  output/qtl.morphine.out.combined_weight_age.RData
    Untracked:  output/qtl.morphine.out.female.RData
    Untracked:  output/qtl.morphine.out.male.RData
    Untracked:  output/qtl.morphine.out.second_set.RData
    Untracked:  output/qtl.morphine.out.second_set.female.RData
    Untracked:  output/qtl.morphine.out.second_set.male.RData
    Untracked:  output/qtl.morphine.out.second_set.weight_DOB.RData
    Untracked:  output/qtl.morphine.out.second_set.weight_age.RData
    Untracked:  output/qtl.morphine.out.weight_DOB.RData
    Untracked:  output/qtl.morphine.out.weight_age.RData
    Untracked:  output/qtl.morphine1.snpout.RData
    Untracked:  output/qtl.morphine2.snpout.RData
    Untracked:  output/second_batch_pheno.csv
    Untracked:  output/second_batch_variation.RData
    Untracked:  output/second_set_apr_69kchr_k_loco.rds
    Untracked:  output/second_set_gm.RData
    Untracked:  output/second_set_gm.k_loco.rds
    Untracked:  output/second_set_gm.probs_36state.rds
    Untracked:  output/second_set_gm.probs_8state.rds
    Untracked:  output/topSNP_chr5_mindepression.csv
    Untracked:  output/zoompeak_Min.depression_9.pdf
    Untracked:  output/zoompeak_Recovery.Time_16.pdf
    Untracked:  output/zoompeak_Status_bin_11.pdf
    Untracked:  output/zoompeak_Survival.Time_1.pdf
    Untracked:  output/zoompeak_fentanyl_Survival.Time_2.pdf
    Untracked:  sra-tools_v2.10.7.sif

Unstaged changes:
    Modified:   _workflowr.yml
    Modified:   analysis/Plot_DO_Fentanyl_Cohort2_mapping.Rmd
    Modified:   analysis/Plot_DO_Fentanyl_combining2Cohort_mapping.Rmd
    Modified:   analysis/Plot_DO_fentanyl.Rmd
    Modified:   analysis/marker_violin.Rmd
Note that any generated files, e.g. HTML, png, CSS, etc., are not included in this status report because it is ok for generated content to have uncommitted changes.
These are the previous versions of the repository in which changes were made to the R Markdown (analysis/Plot_DO_morphine_secondbatch.Rmd) and HTML (docs/Plot_DO_morphine_secondbatch.html) files. If you’ve configured a remote Git repository (see ?wflow_git_remote), click on the hyperlinks in the table below to view the files as they were in that past version.
| File | Version | Author | Date | Message |
|---|---|---|---|---|
| Rmd | cc3ae27 | xhyuo | 2023-02-21 | update with sex specific morphine plot |
| html | 8fe8543 | xhyuo | 2023-02-20 | Build site. |
| Rmd | b46775c | xhyuo | 2023-02-20 | update with sex specific morphine |
| html | 9e4e3be | xhyuo | 2021-08-24 | Build site. |
| Rmd | 8b6594f | xhyuo | 2021-08-24 | add snp/gene plot |
| html | c191146 | xhyuo | 2020-06-16 | Build site. |
| Rmd | 45c4bc8 | xhyuo | 2020-06-16 | Plot_DO_morphine_secondbatch |
| html | 5cbc78e | xhyuo | 2020-06-01 | Build site. |
| Rmd | 60e46d6 | xhyuo | 2020-06-01 | Plot_DO_morphine_secondbatch |
| html | b830cde | xhyuo | 2020-06-01 | Build site. |
| Rmd | 8ecb9e6 | xhyuo | 2020-06-01 | Plot_DO_morphine_secondbatch |
Last update: 2023-02-21
loading libraries
library(ggplot2)
library(gridExtra)
library(GGally)
library(parallel)
library(qtl2)
library(parallel)
library(survival)
library(regress)
library(abind)
library(openxlsx)

rz.transform <- function(y) {
  rankY=rank(y, ties.method="average", na.last="keep")
  rzT=qnorm(rankY/(length(na.exclude(rankY))+1))
  return(rzT)
}
load("code/do.colors.RData")
Read phenotype data
# Read phenotype data -----------------------------------------------------
second_set <- read.xlsx(xlsxFile = "data/MasterMorphine Second Set DO.xlsx",
                        sheet = 1)
colnames(second_set)[2] <- "Sex"
colnames(second_set)[6] <- "Status24"
#character
second_set[,c("ID", "Sex", "GROUP", "Status24")] <- lapply(second_set[, c("ID", "Sex", "GROUP", "Status24")], as.character)
second_set$Status_bin <- ifelse(second_set$Status24 == "ALIVE", 1, 0)
rownames(second_set) <- second_set$ID

#remove outlier
second_set <- second_set[second_set$ID != "empty",]
#remove negative survival time subjects
second_set <- second_set[!(!is.na(second_set$Survival.Time) & second_set$Survival.Time < 0),]
second_set$Survival.Time[!is.na(second_set$Survival.Time) & second_set$Survival.Time > 15] <- NA
second_set$Recovery.Time[!is.na(second_set$Recovery.Time) & second_set$Recovery.Time > 24] <- NA
second_set$Min.depression[!is.na(second_set$Min.depression) & second_set$Min.depression > 1] <- NA

#do
do.morphine <- get(load("output/second_set_gm.RData"))
do.pheno <- merge(second_set, do.morphine$covar, by.x = "row.names", by.y = "row.names", all.x = TRUE)

#first batch
do.pheno1 <- read.csv("data/pheno_qtl2.csv")
colnames(do.pheno1)[1] <- "ID"
do.pheno1$Survival.Time <- as.numeric(do.pheno1$Survival.Time)
do.pheno1$Recovery.Time <- as.numeric(do.pheno1$Recovery.Time)
do.pheno1$Min.depression <- as.numeric(do.pheno1$Min.depression)
do.pheno1$ngen <- "29"

#boxplot
#survival time
surv <- do.pheno[,c(2,8,15)]
#surv <- rbind(surv, do.pheno1[,c(1,2,5)])
surv <- surv[complete.cases(surv), ]
surv$ngen <- factor(surv$ngen, levels = as.character(c(30:34)))
p1 <- ggplot(surv, aes(x=ngen, y=Survival.Time, group = ngen, fill = ngen, alpha = 0.9)) +
  geom_boxplot(show.legend = F , outlier.size = 1.5, notchwidth = 0.85) +
  geom_jitter(color="black", size=0.8, alpha=0.9) +
  scale_fill_brewer(palette="Blues") +
  ylab("Survival Time") +
  xlab("Generation") +
  labs(fill = "") +
  theme(legend.position = "none",
        panel.grid.major = element_blank(),
        panel.grid.minor = element_blank(),
        panel.background = element_blank(),
        axis.line = element_line(colour = "black"),
        text = element_text(size=16),
        axis.title=element_text(size=16)) +
  guides(shape = guide_legend(override.aes = list(size = 12)))
p1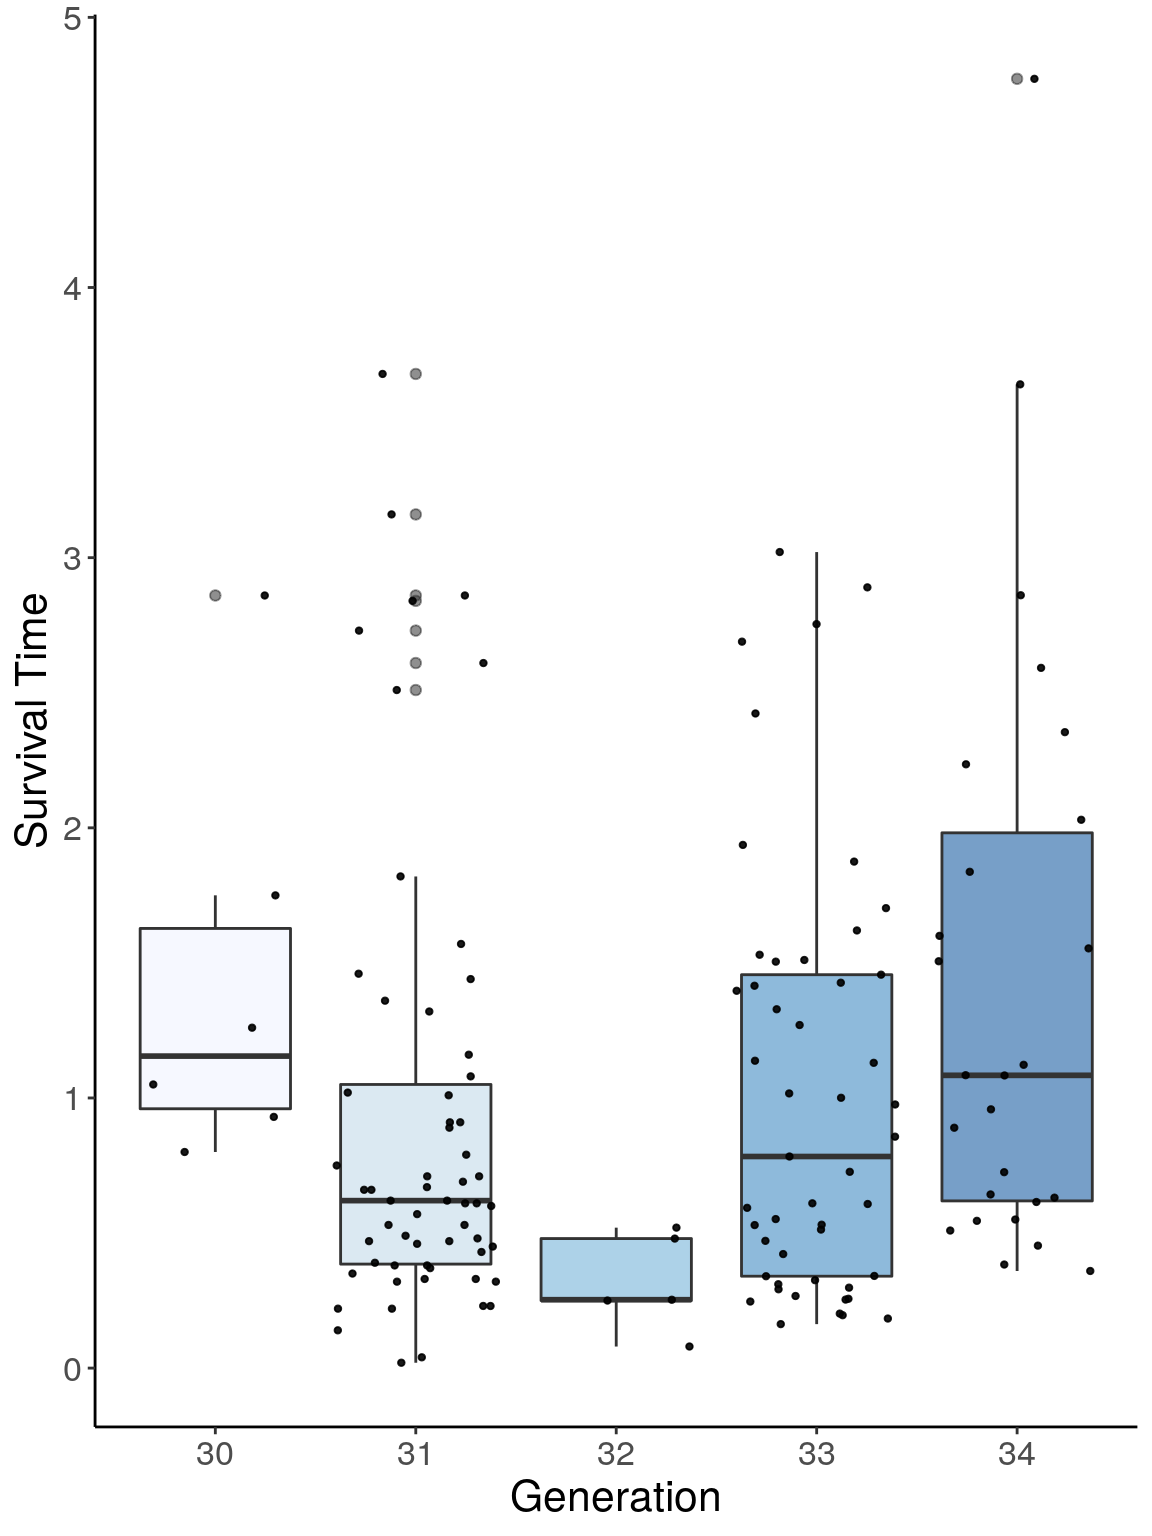
reco <- do.pheno[,c(2,9,15)]
#reco <- rbind(reco, do.pheno1[,c(1,3,5)])
reco <- reco[complete.cases(reco), ]
reco$ngen <- factor(reco$ngen, levels = as.character(c(30:35)))
p2 <- ggplot(reco, aes(x=ngen, y=Recovery.Time, group = ngen, fill = ngen, alpha = 0.9)) +
  geom_boxplot(show.legend = F , outlier.size = 1.5, notchwidth = 0.85) +
  geom_jitter(color="black", size=0.8, alpha=0.9) +
  scale_fill_brewer(palette="Blues") +
  ylab("Recovery Time") +
  xlab("Generation") +
  labs(fill = "") +
  theme(legend.position = "none",
        panel.grid.major = element_blank(),
        panel.grid.minor = element_blank(),
        panel.background = element_blank(),
        axis.line = element_line(colour = "black"),
        text = element_text(size=16),
        axis.title=element_text(size=16)) +
  guides(shape = guide_legend(override.aes = list(size = 12)))
p2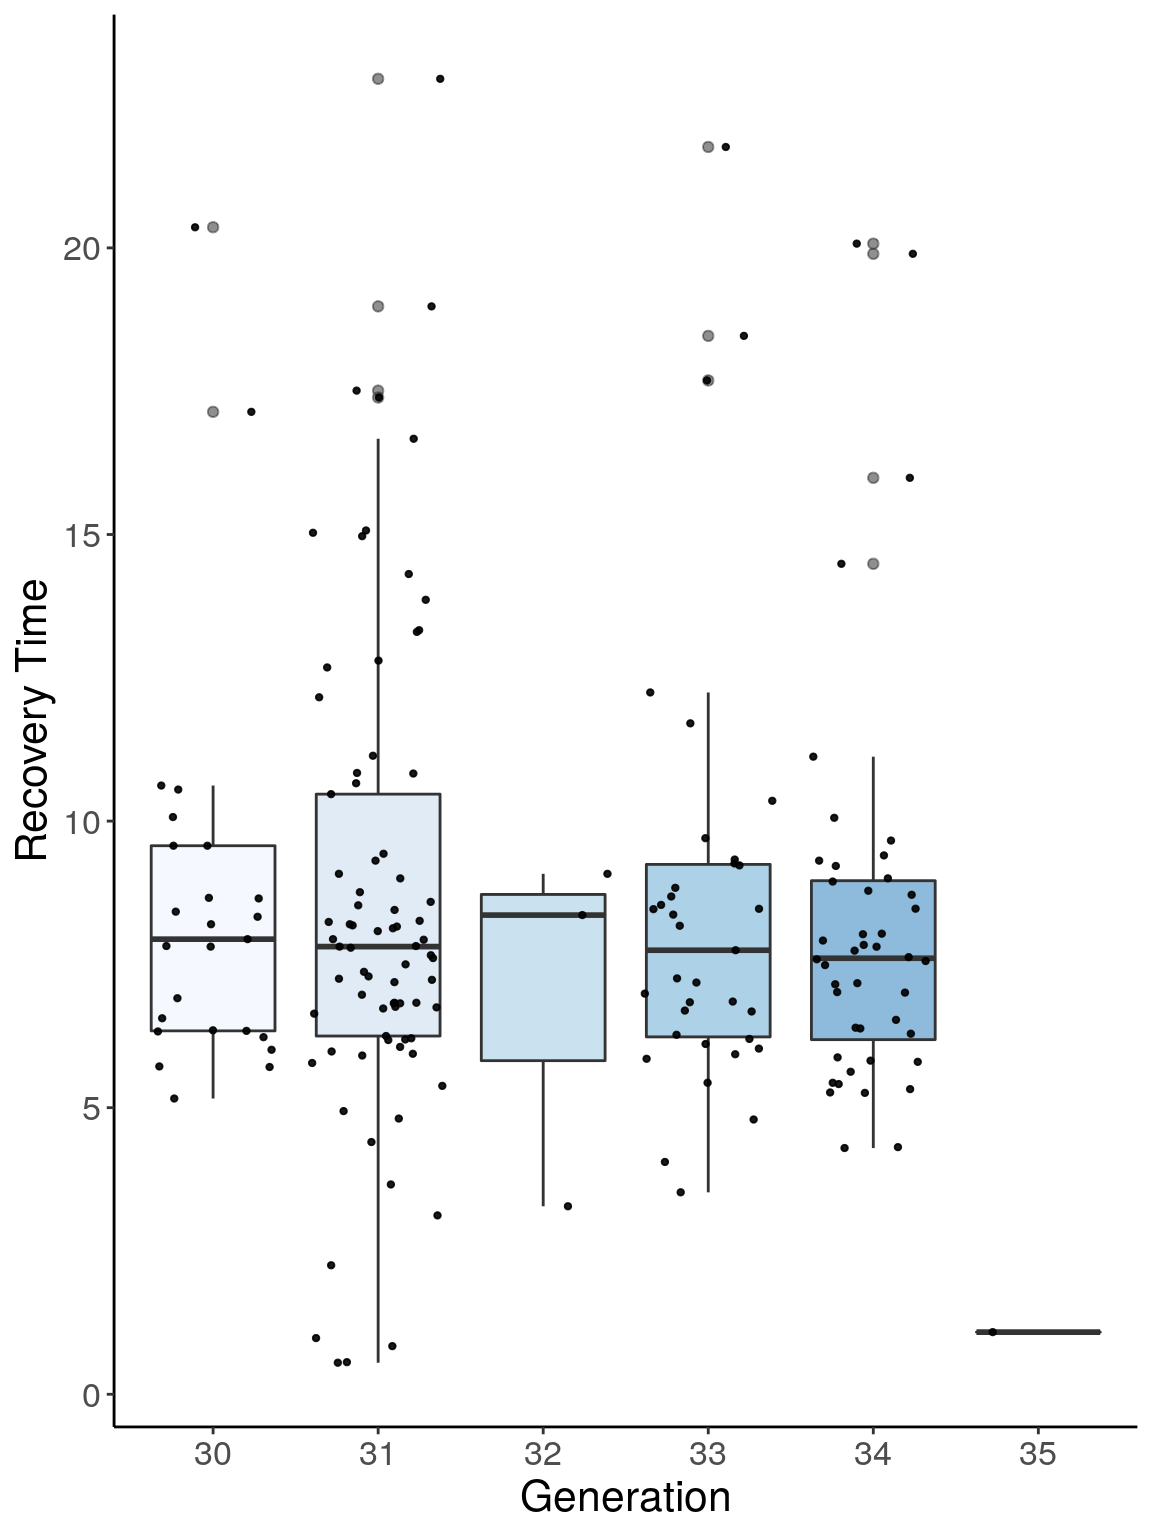
dep <- do.pheno[,c(2,10,15)]
#dep <- rbind(dep, do.pheno1[,c(1,4,5)])
dep <- dep[complete.cases(dep), ]
dep$ngen <- factor(dep$ngen, levels = as.character(c(30:35)))
p3 <- ggplot(dep, aes(x=ngen, y=Min.depression, group = ngen, fill = ngen, alpha = 0.9)) +
  geom_boxplot(show.legend = F , outlier.size = 1.5, notchwidth = 0.85) +
  geom_jitter(color="black", size=0.8, alpha=0.9) +
  scale_fill_brewer(palette="Blues") +
  ylab("Min depression") +
  xlab("Generation") +
  labs(fill = "") +
  theme(legend.position = "none",
        panel.grid.major = element_blank(),
        panel.grid.minor = element_blank(),
        panel.background = element_blank(),
        axis.line = element_line(colour = "black"),
        text = element_text(size=16),
        axis.title=element_text(size=16)) +
  guides(shape = guide_legend(override.aes = list(size = 12)))
p3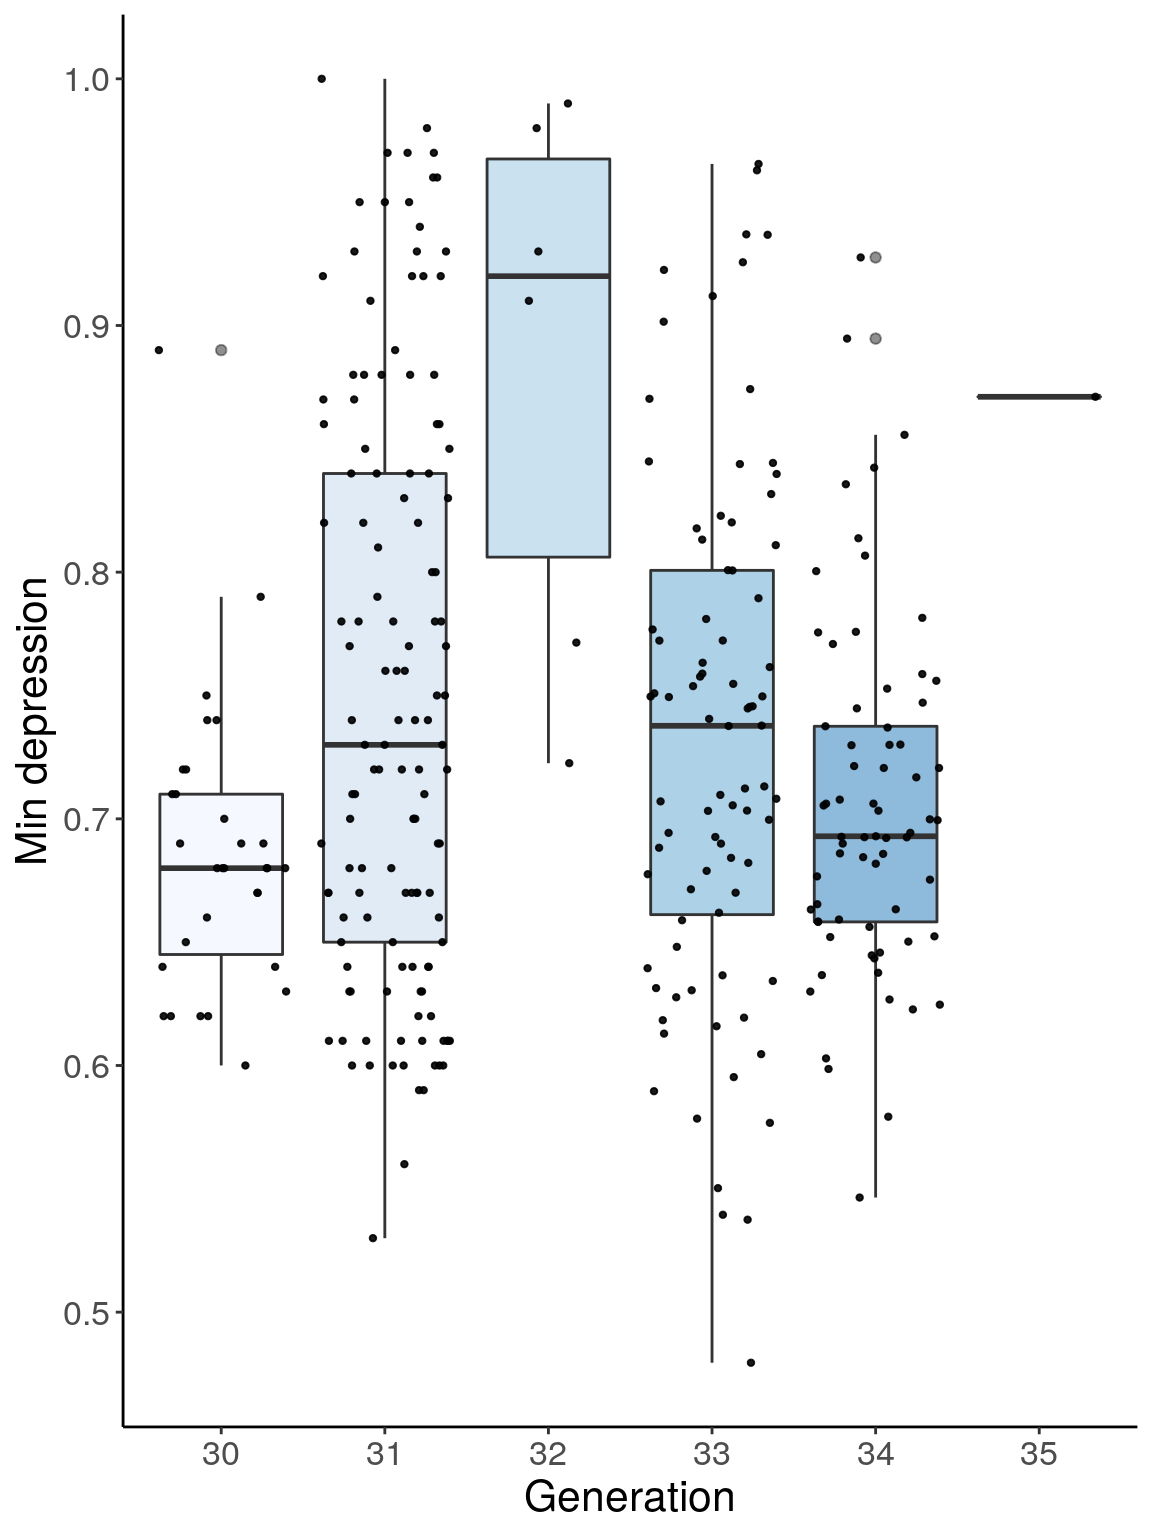
#histogram
a <- ggplot(data=do.pheno, aes(do.pheno$Survival.Time)) +
  geom_histogram() +
  ylab("Number of DO mice") + xlab("Survival Time (h)")

b <- ggplot(data=do.pheno, aes(do.pheno$Recovery.Time)) +
  geom_histogram() +
  ylab("Number of DO mice") + xlab("Recovery Time (h)")

c <- ggplot(data=do.pheno, aes(do.pheno$Min.depression)) +
  geom_histogram() +
  ylab("Number of DO mice") + xlab("Respiratory Depression (% of baseline)")

grid.arrange(a,b,c)
# Warning: Use of `do.pheno$Survival.Time` is discouraged. Use `Survival.Time`
# instead.
# Warning: Removed 211 rows containing non-finite values (stat_bin).
# Warning: Use of `do.pheno$Recovery.Time` is discouraged. Use `Recovery.Time`
# instead.
# Warning: Removed 166 rows containing non-finite values (stat_bin).
# Warning: Use of `do.pheno$Min.depression` is discouraged. Use `Min.depression`
# instead.
# Warning: Removed 17 rows containing non-finite values (stat_bin).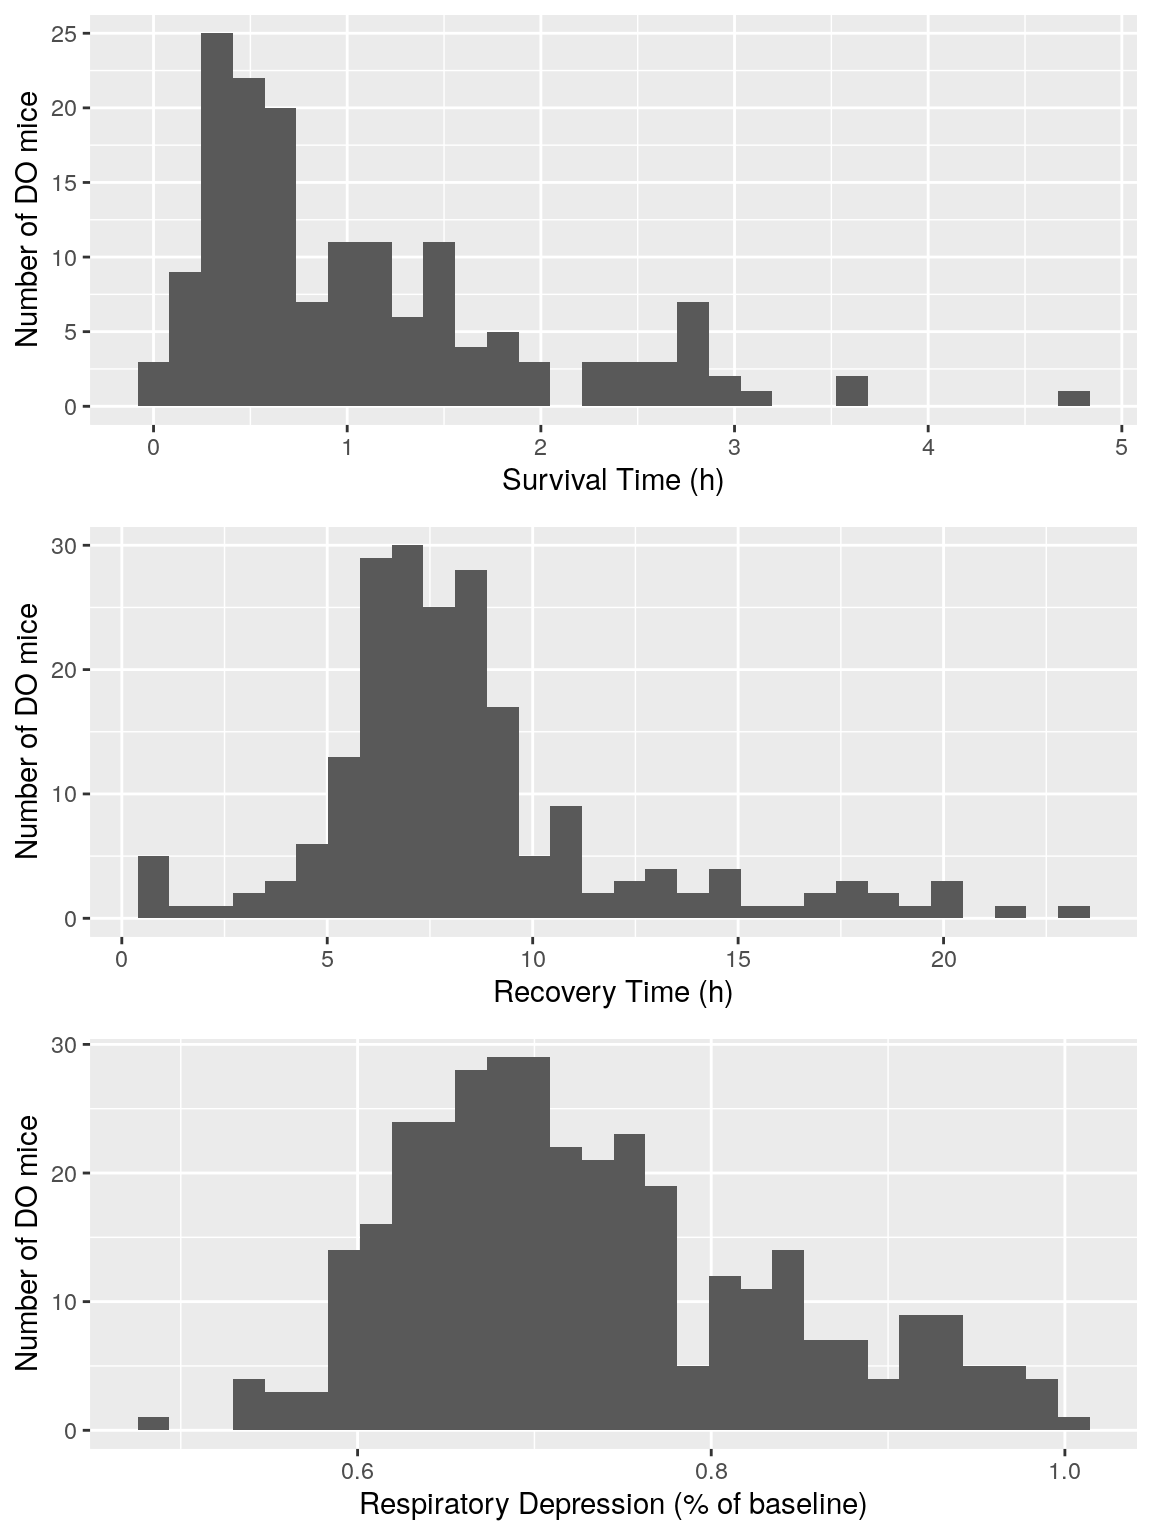
Plot qtl mapping on array
Plot by using its output qtl.morphine.out.second_set.RData
load("output/qtl.morphine.out.second_set.RData")
#pmap and gmap
chr.names <- c("1","2","3","4","5","6","7","8","9","10","11","12","13","14","15","16","17","18","19", "X")
gmap <- list()
pmap <- list()
for (chr in chr.names){
gmap[[chr]] <- do.morphine$gmap[[chr]]
pmap[[chr]] <- do.morphine$pmap[[chr]]
}
attr(gmap, "is_x_chr") <- structure(c(rep(FALSE,19),TRUE), names=1:20)
attr(pmap, "is_x_chr") <- structure(c(rep(FALSE,19),TRUE), names=1:20)
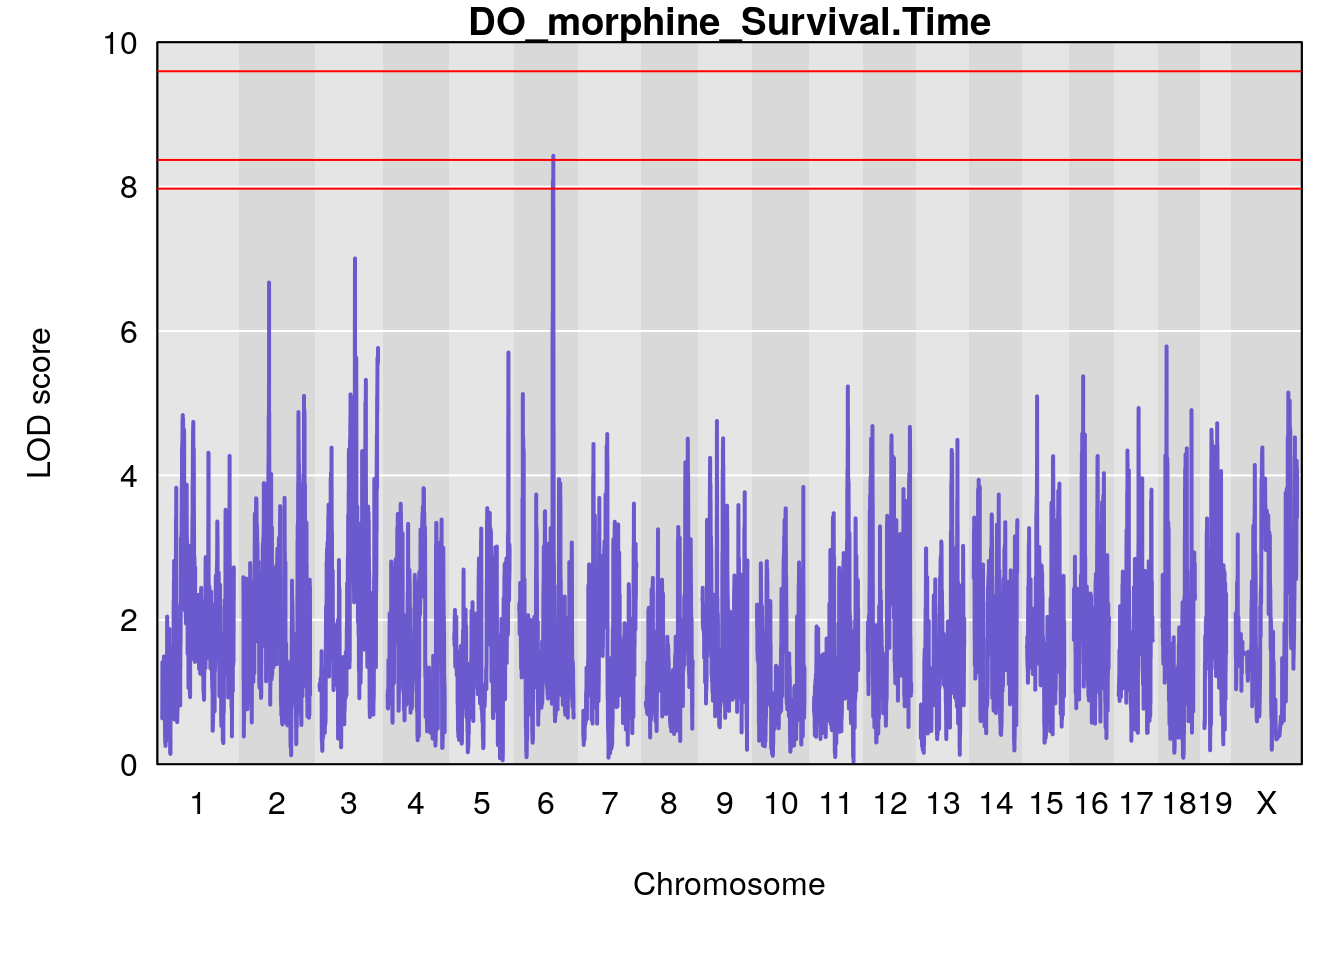
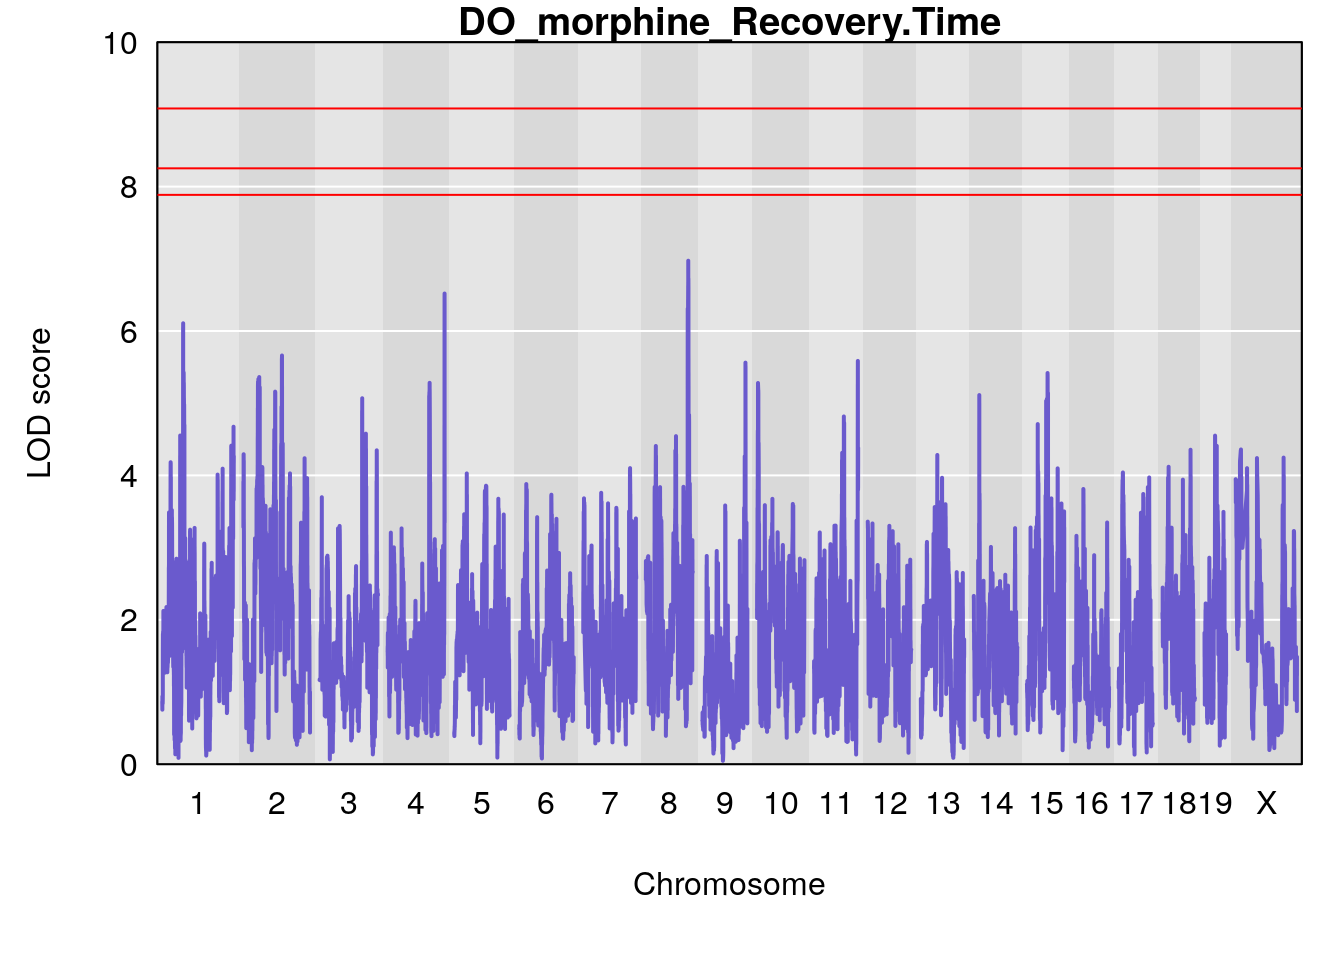
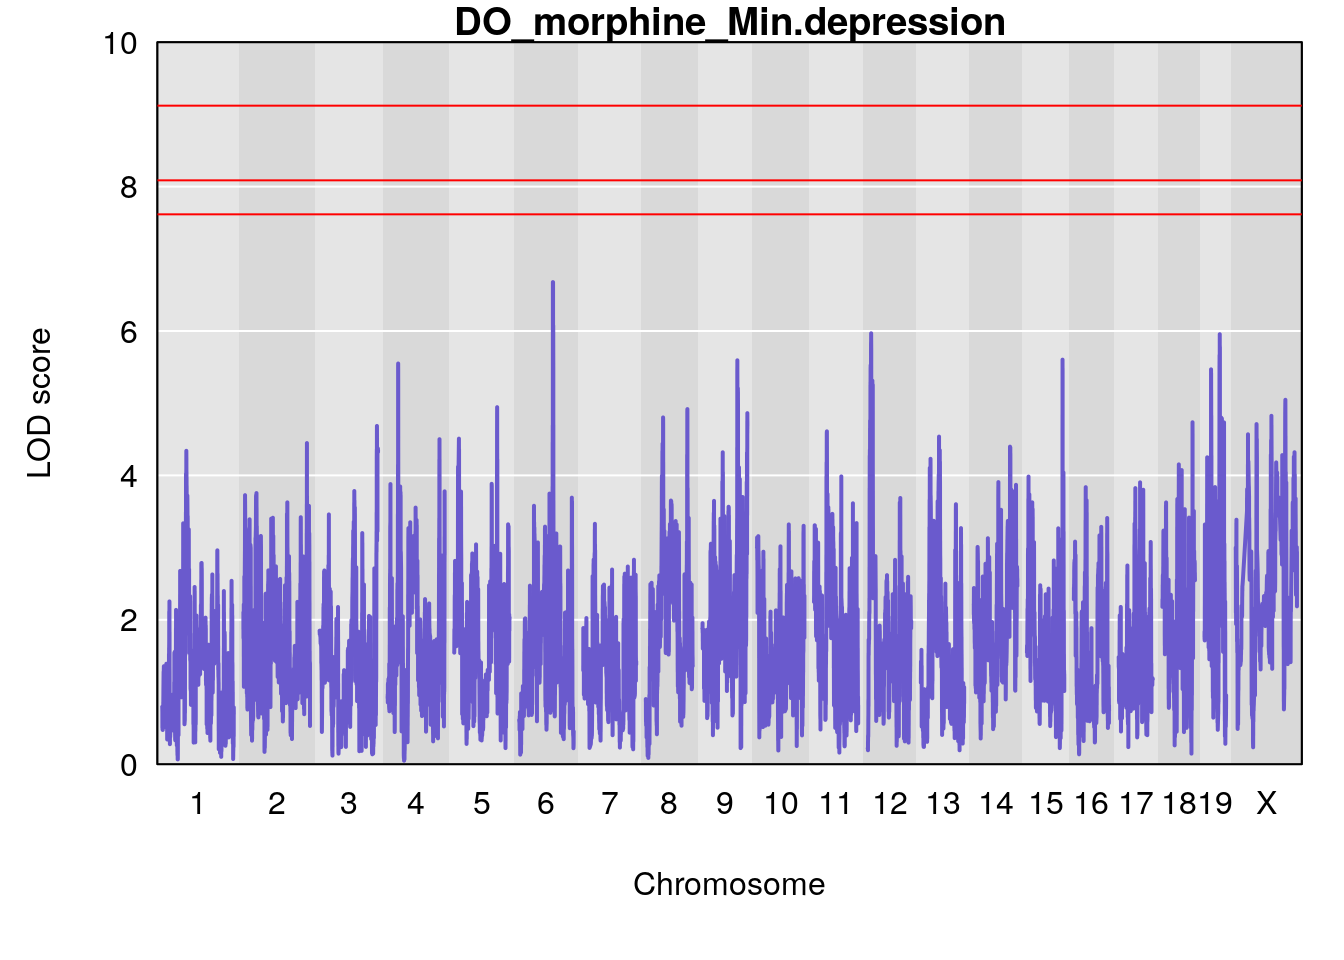
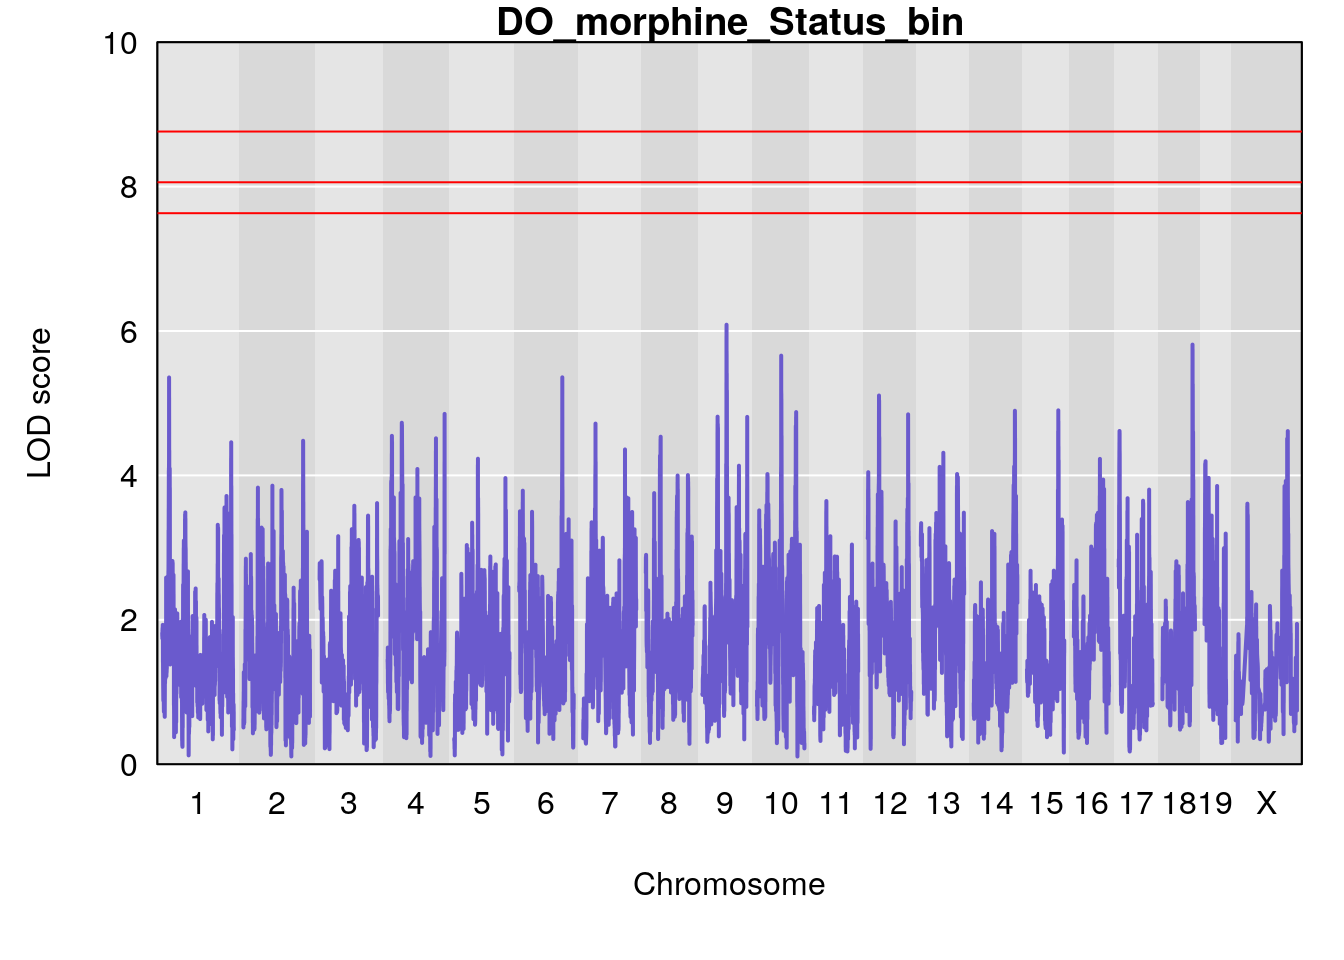
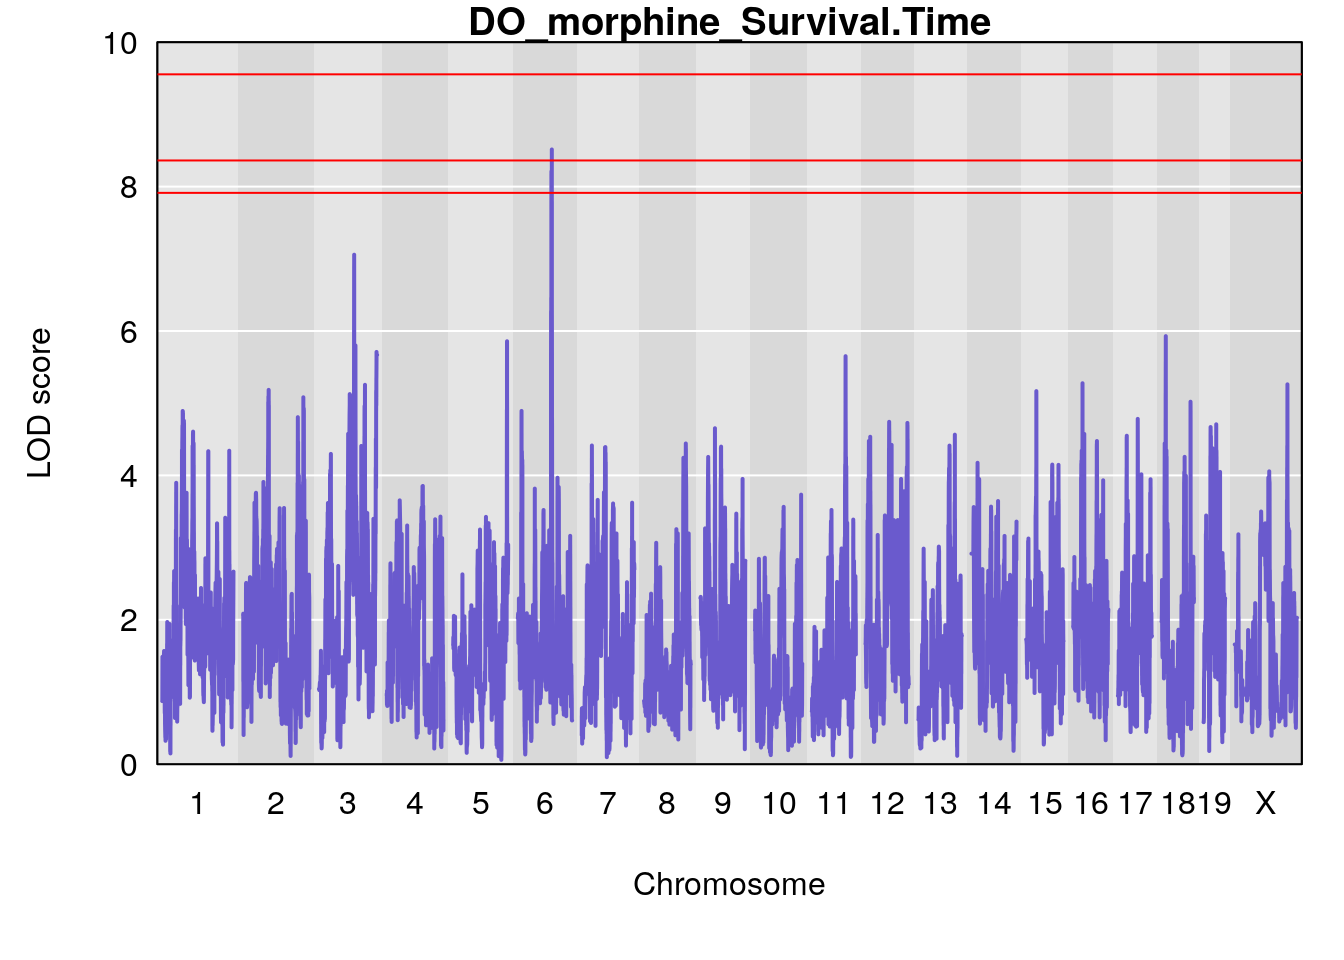
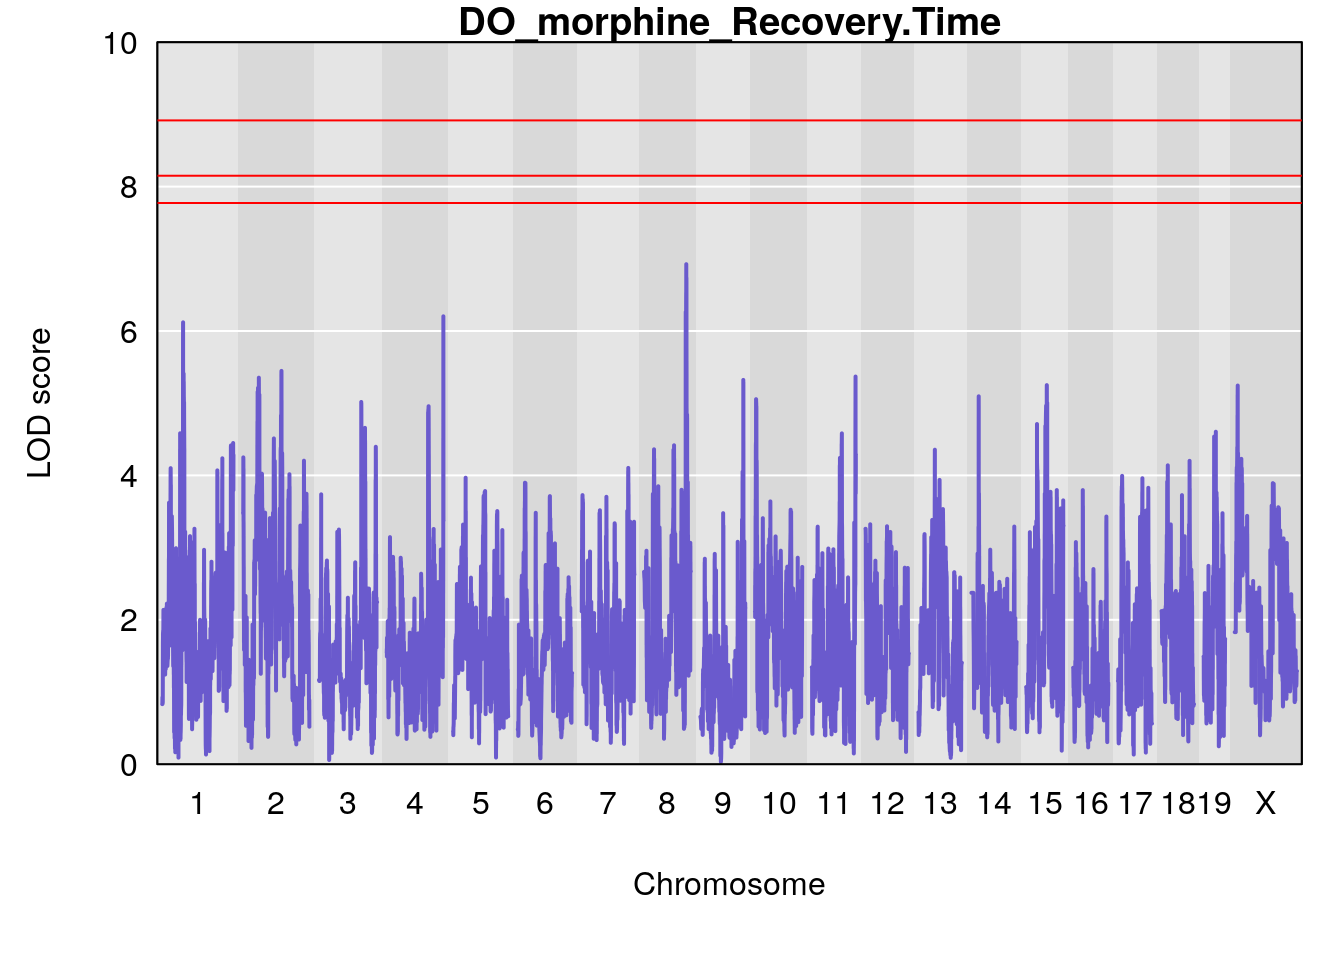
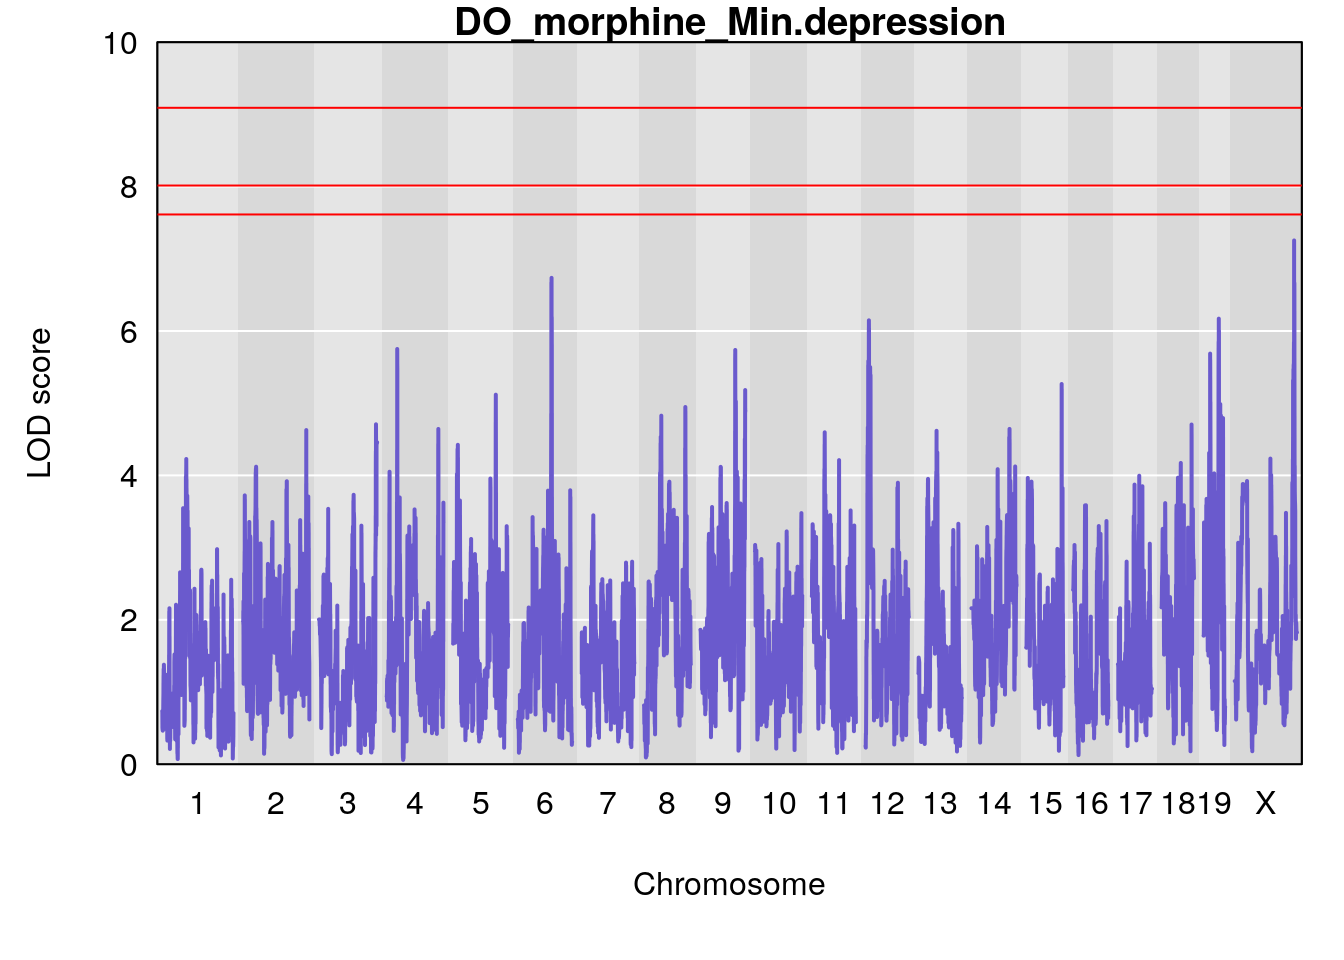
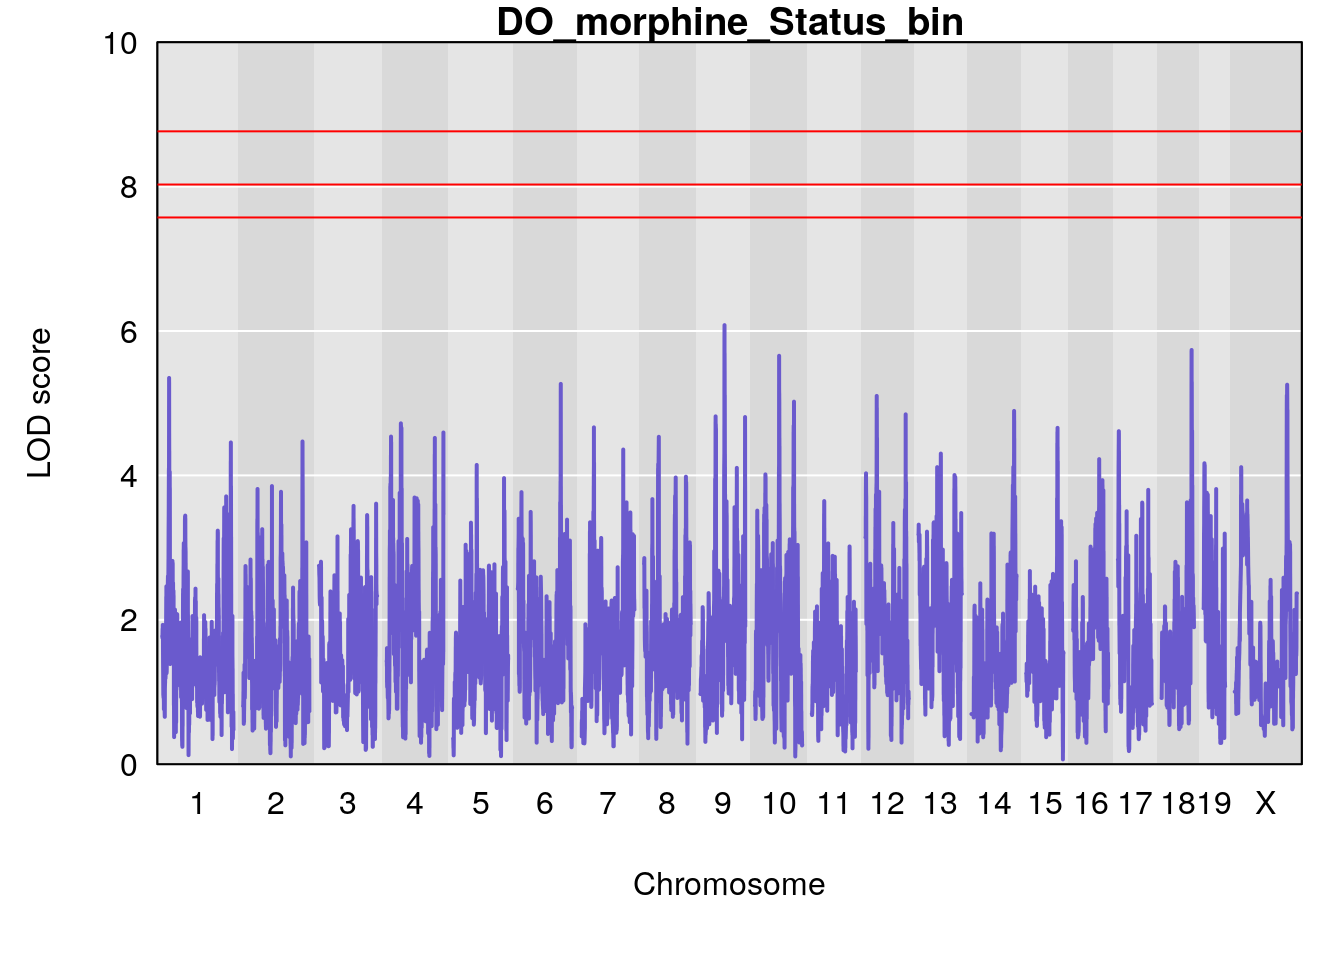
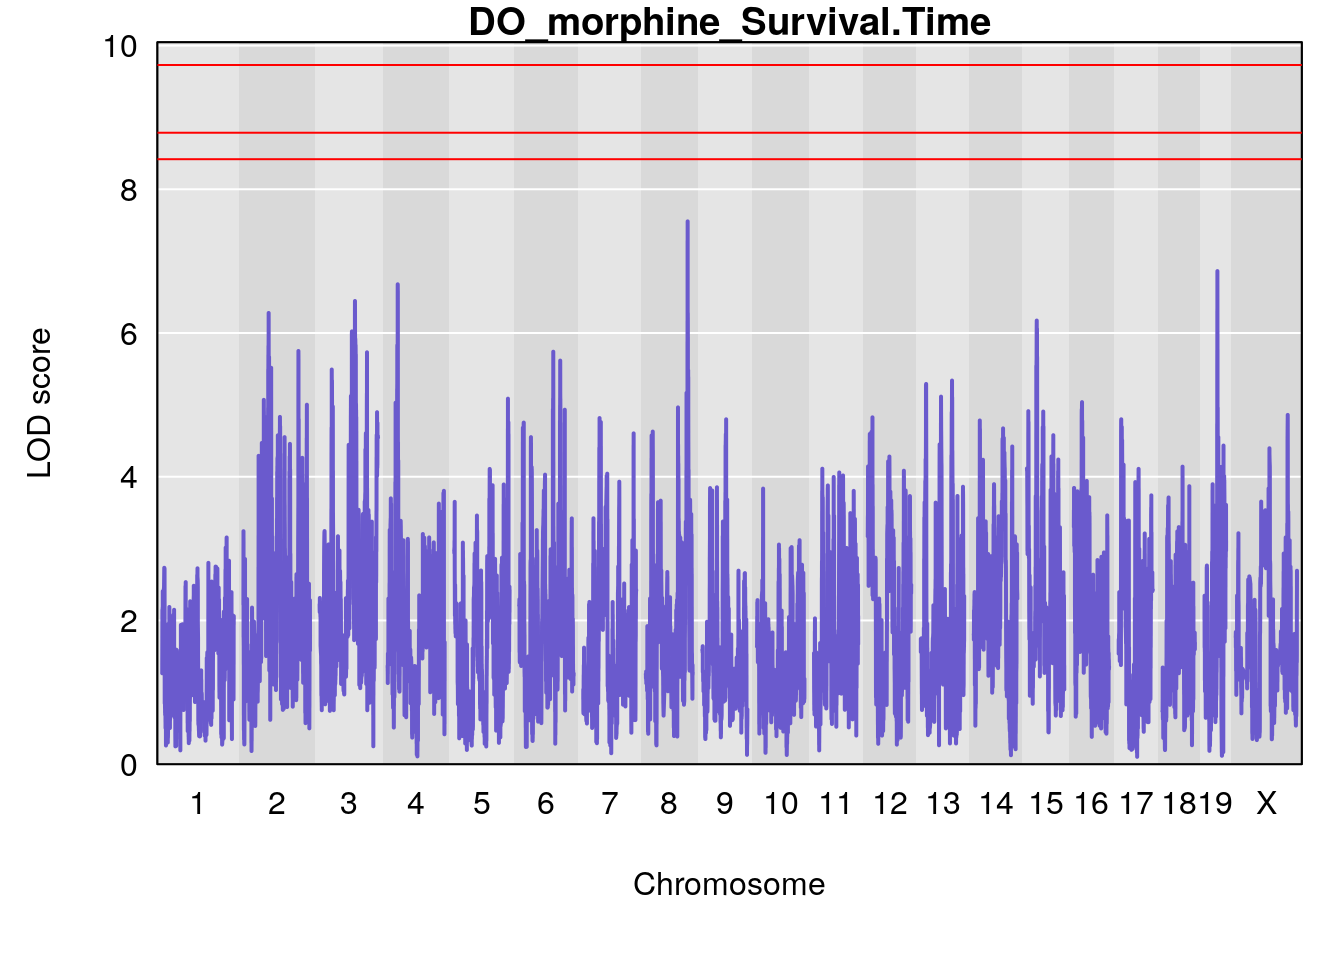
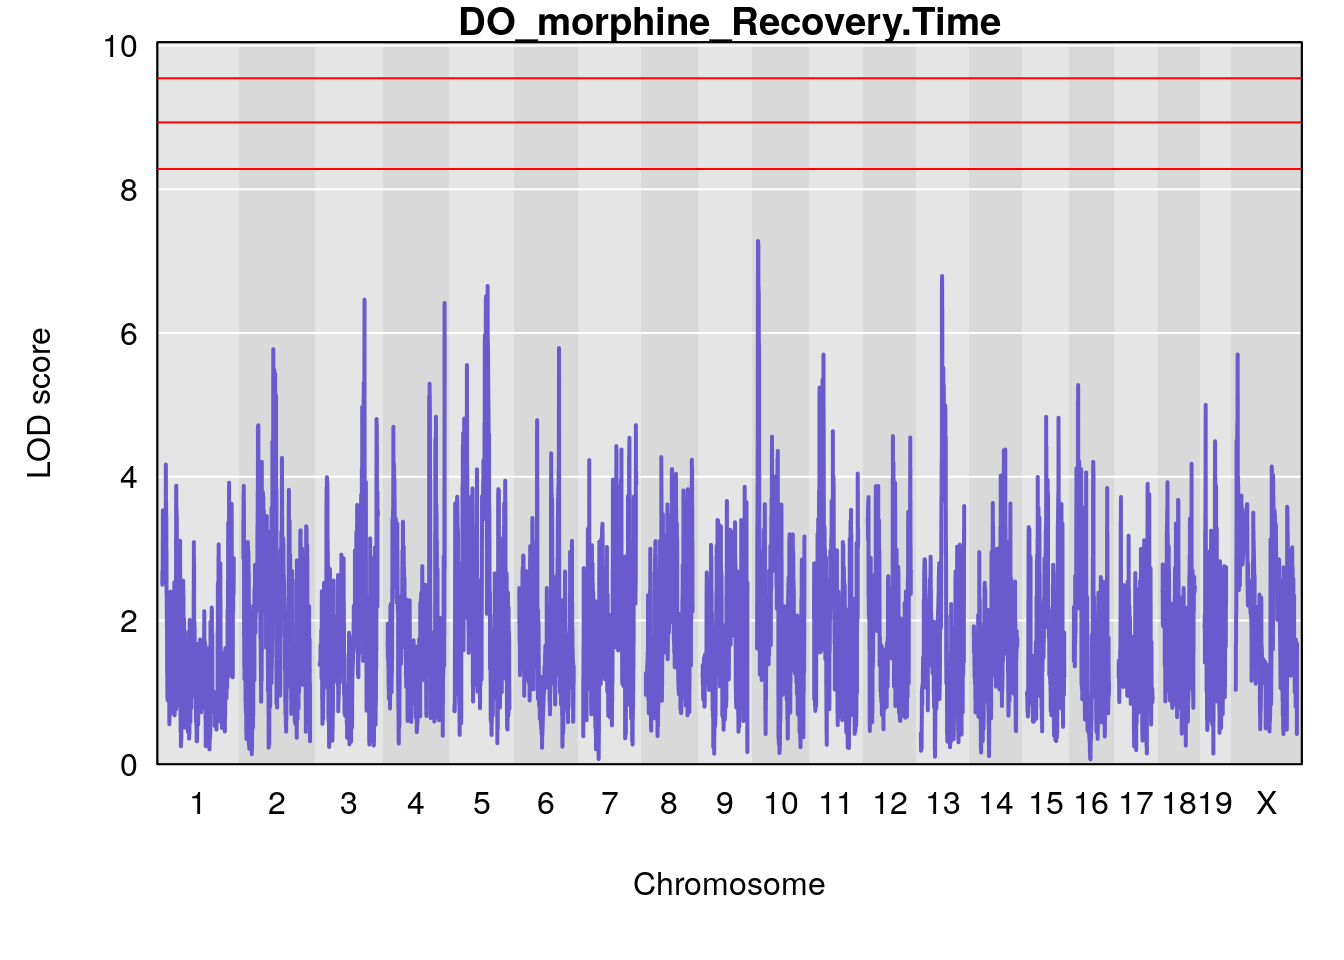
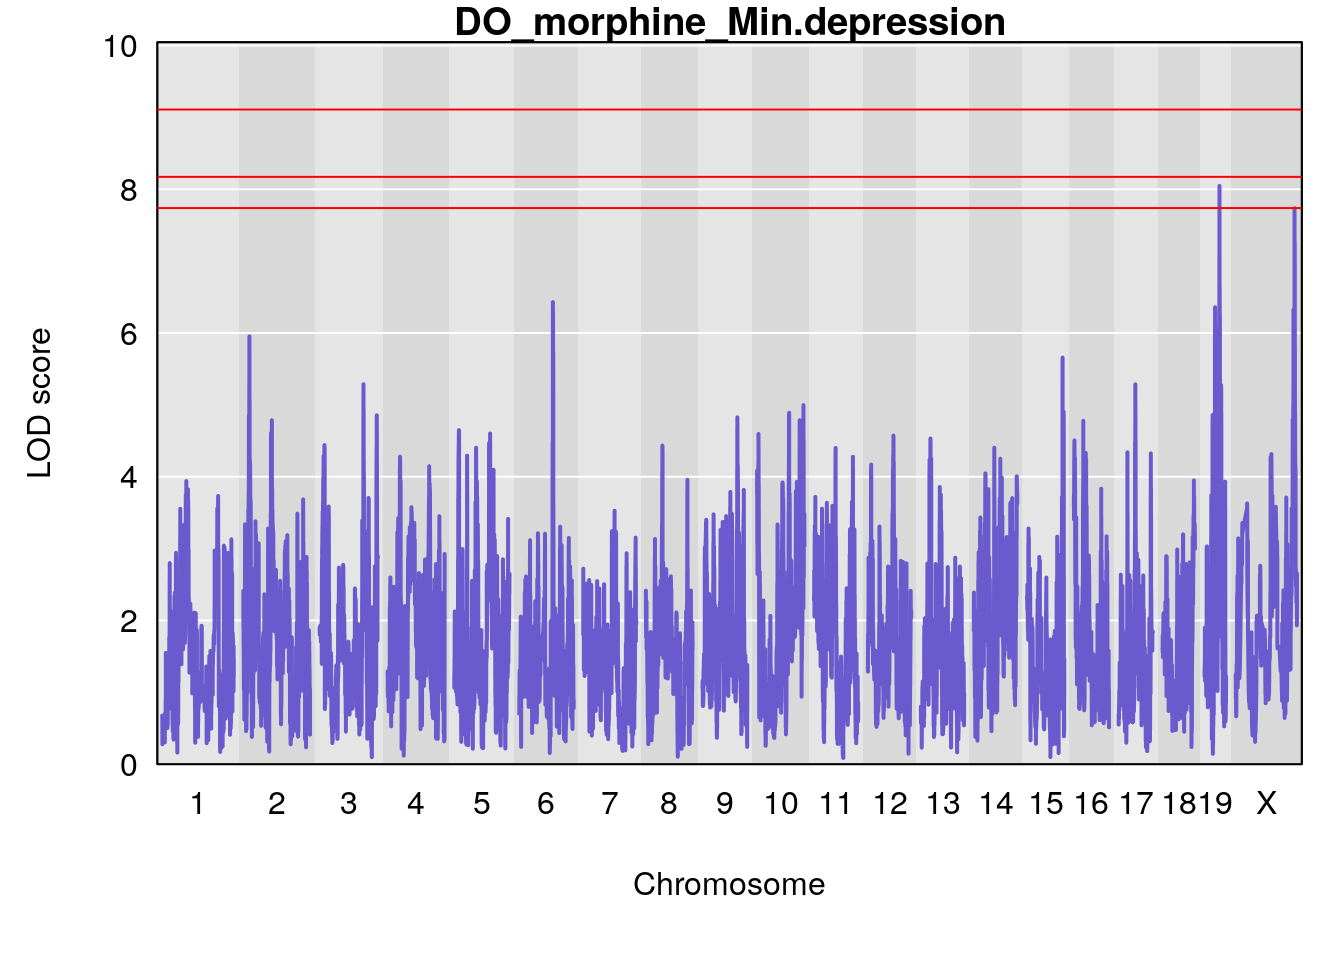
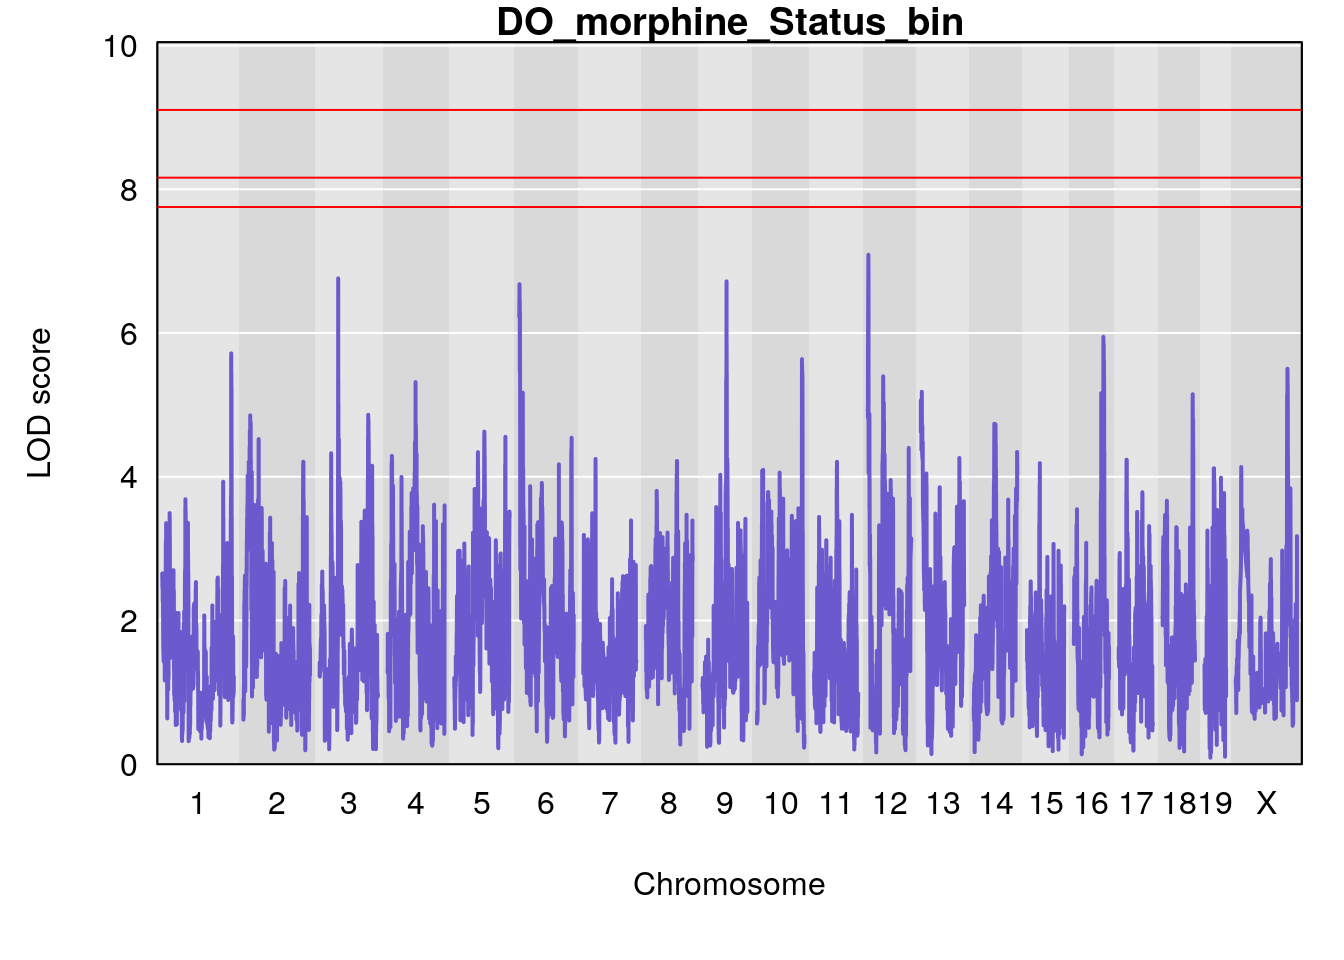
#genome-wide plot
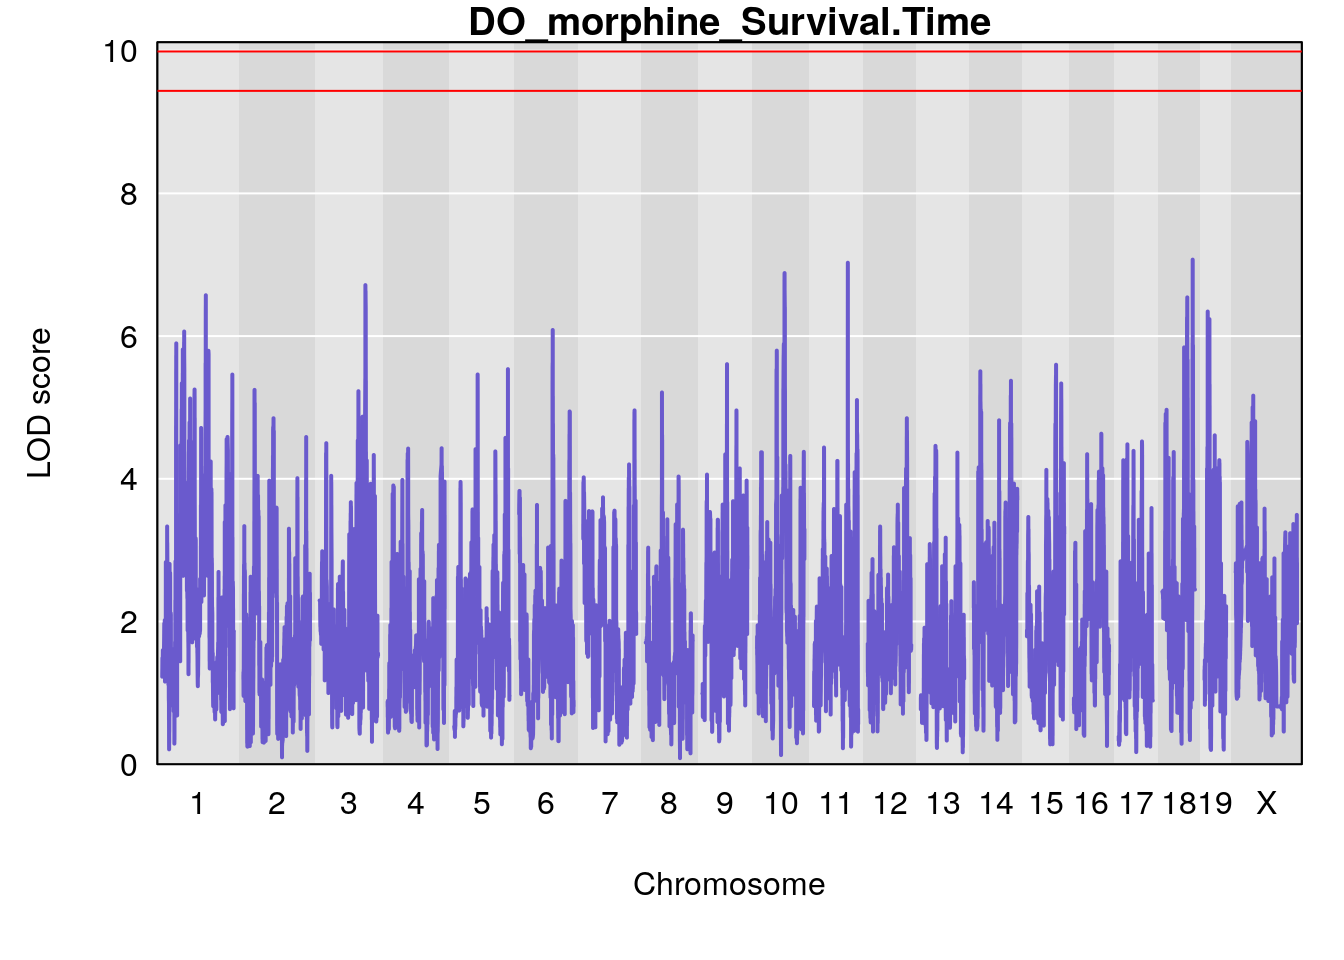
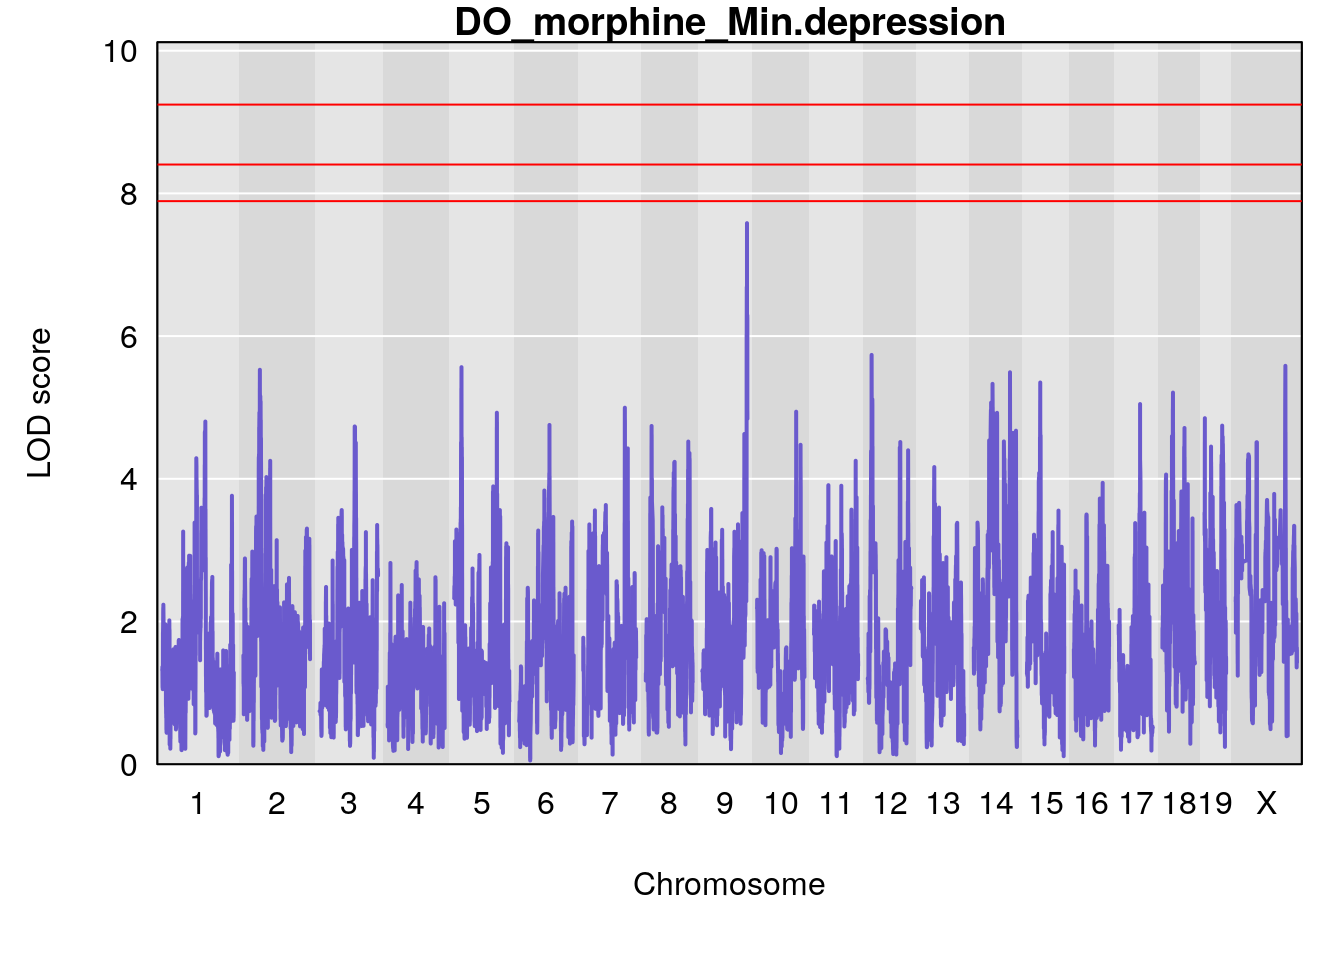
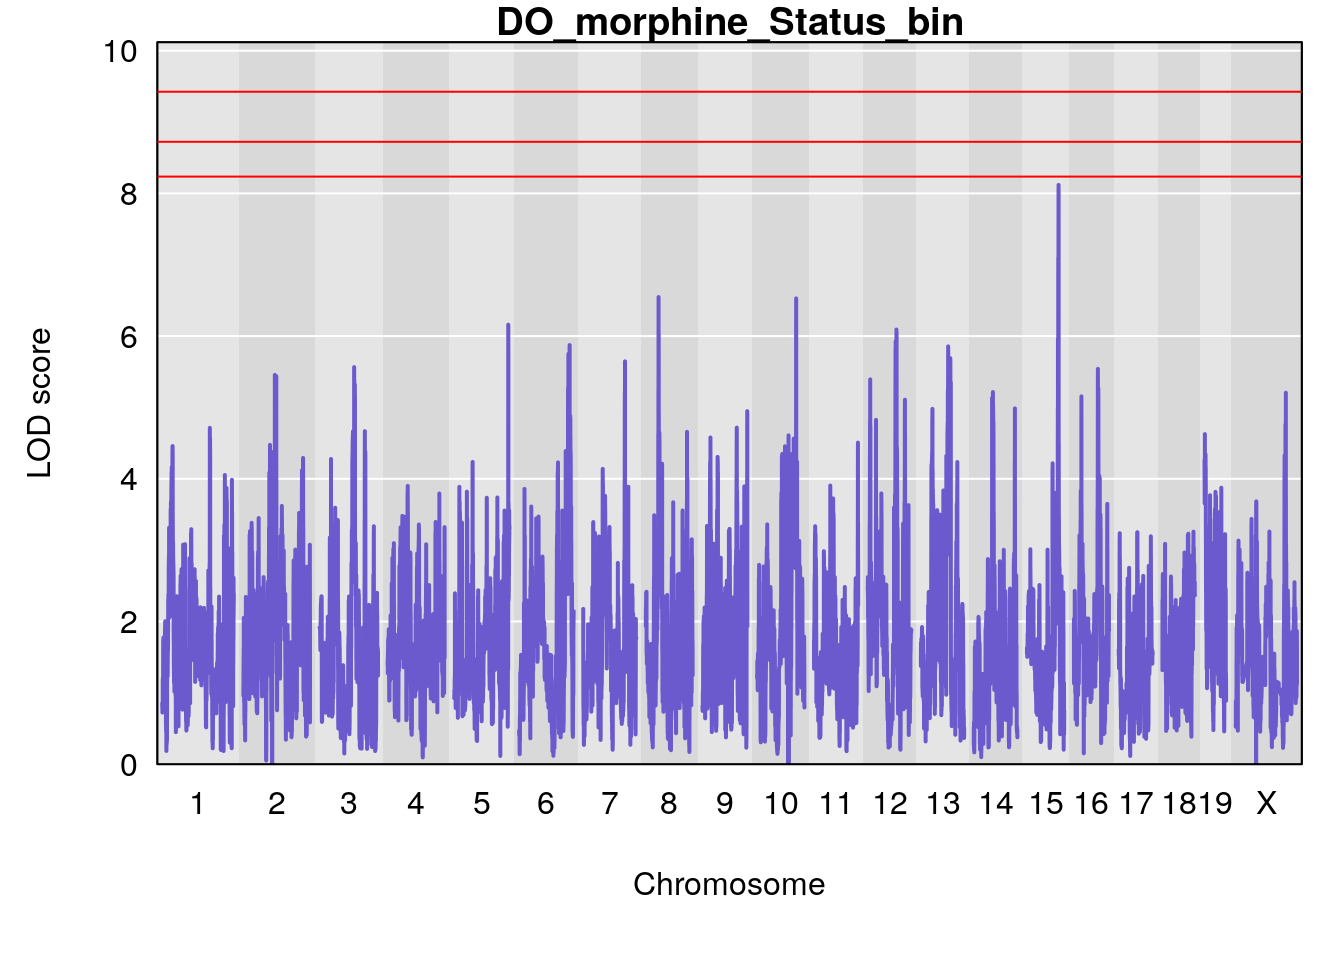
for(i in names(qtl.morphine.out)){
par(mar=c(5.1, 4.1, 1.1, 1.1))
ymx <- maxlod(qtl.morphine.out[[i]]) # overall maximum LOD score
plot(qtl.morphine.out[[i]], map=pmap, lodcolumn=1, col="slateblue", ylim=c(0, 10))
abline(h=summary(qtl.morphine.operm[[i]], alpha=c(0.10, 0.05, 0.01))[[1]], col="red")
abline(h=summary(qtl.morphine.operm[[i]], alpha=c(0.10, 0.05, 0.01))[[2]], col="red")
abline(h=summary(qtl.morphine.operm[[i]], alpha=c(0.10, 0.05, 0.01))[[3]], col="red")
title(main = paste0("DO_morphine_",i))
}
#save genome-wide plot
for(i in names(qtl.morphine.out)){
png(file = paste0("output/DO_morphine_secondbatch_", i, ".png"), width = 16, height =8, res=300, units = "in")
par(mar=c(5.1, 4.1, 1.1, 1.1))
ymx <- maxlod(qtl.morphine.out[[i]]) # overall maximum LOD score
plot(qtl.morphine.out[[i]], map=pmap, lodcolumn=1, col="slateblue", ylim=c(0, 10))
abline(h=summary(qtl.morphine.operm[[i]], alpha=c(0.10, 0.05, 0.01))[[1]], col="red")
abline(h=summary(qtl.morphine.operm[[i]], alpha=c(0.10, 0.05, 0.01))[[2]], col="red")
abline(h=summary(qtl.morphine.operm[[i]], alpha=c(0.10, 0.05, 0.01))[[3]], col="red")
title(main = paste0("DO_morphine_",i))
dev.off()
}
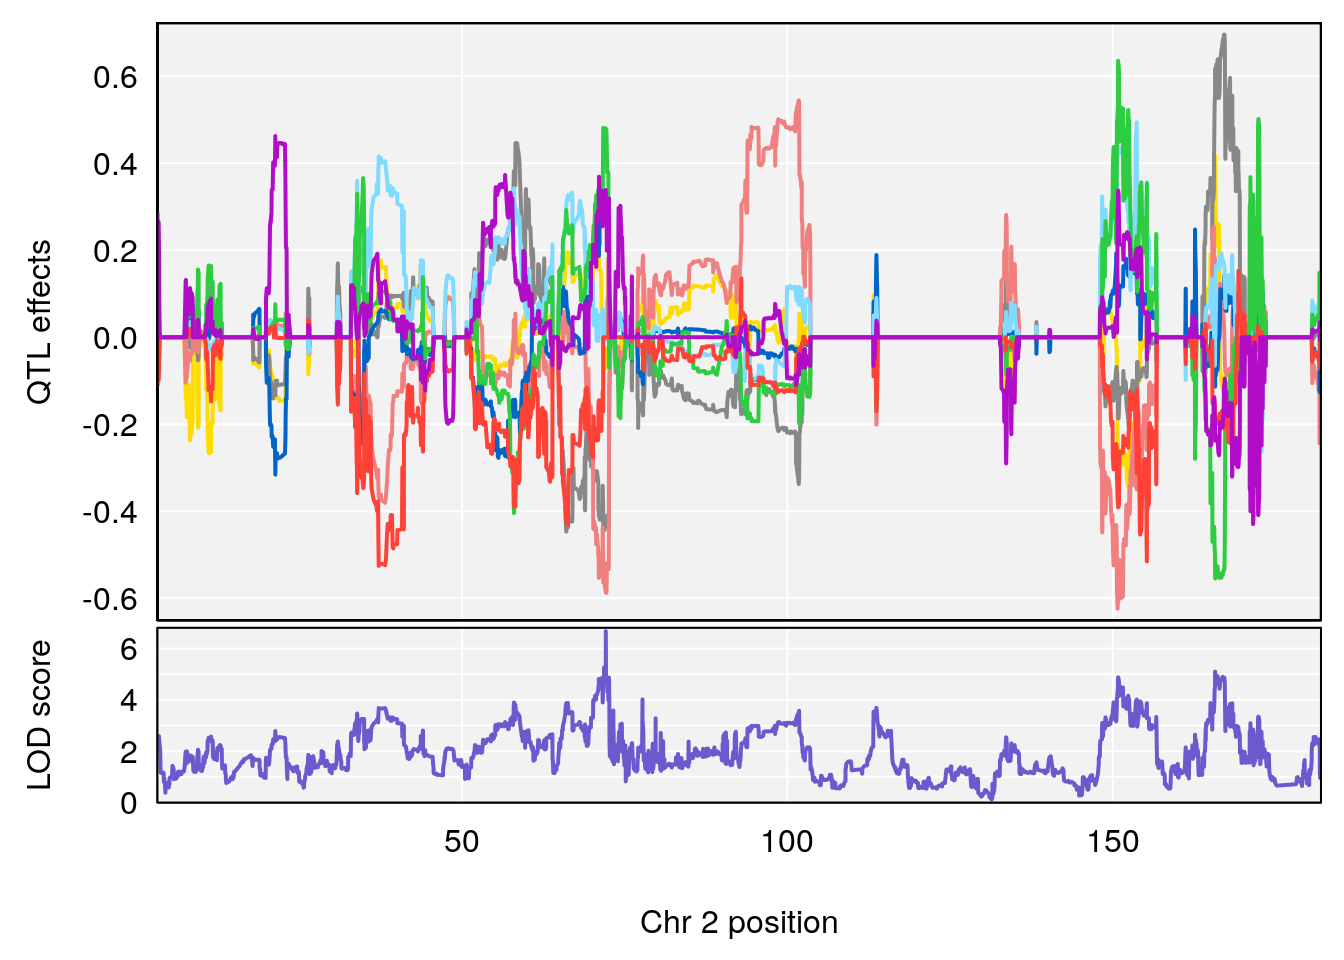
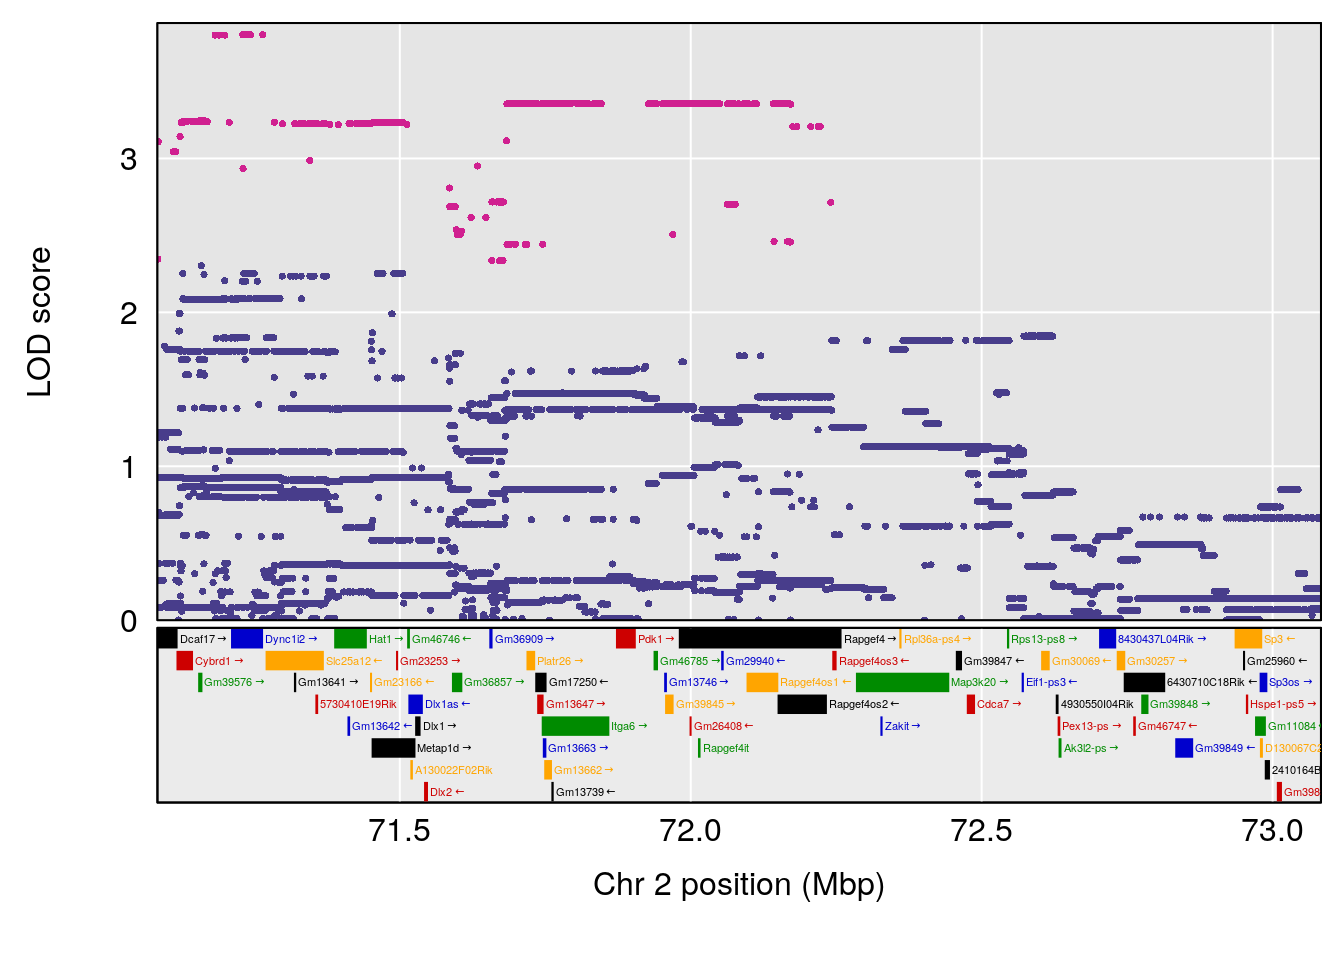
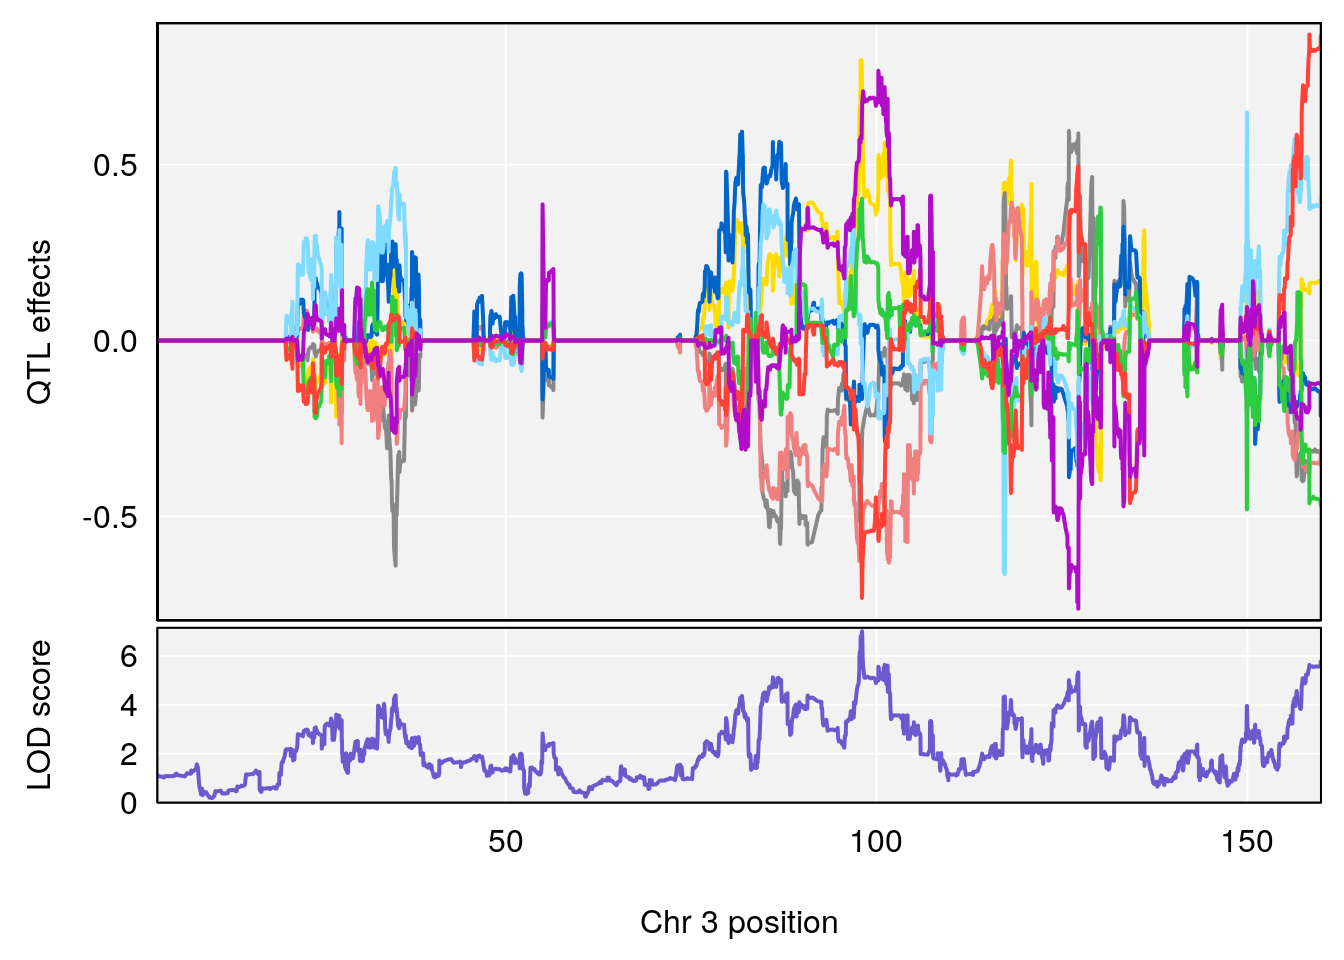
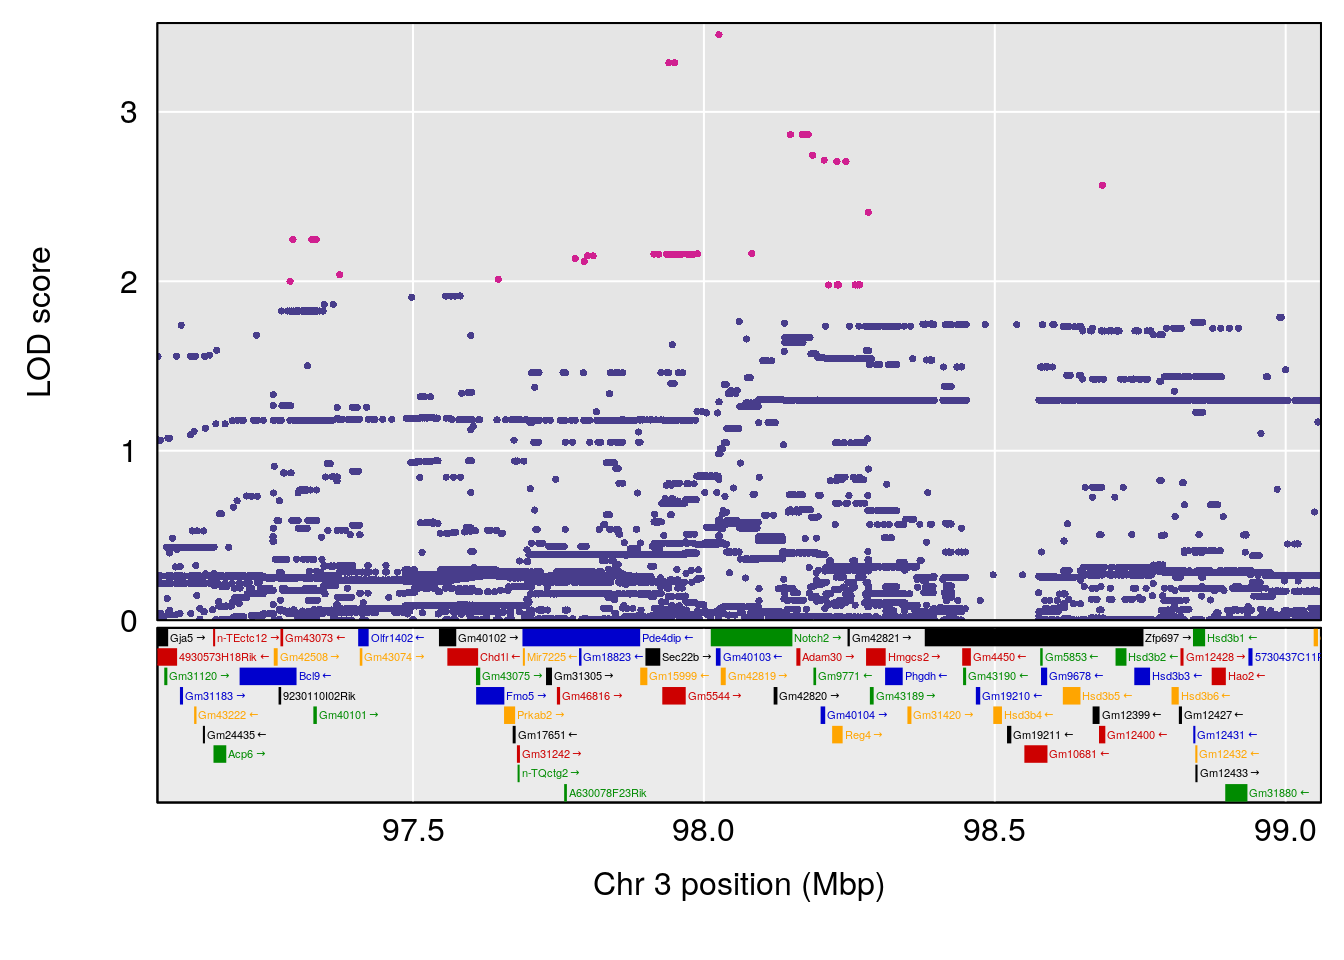
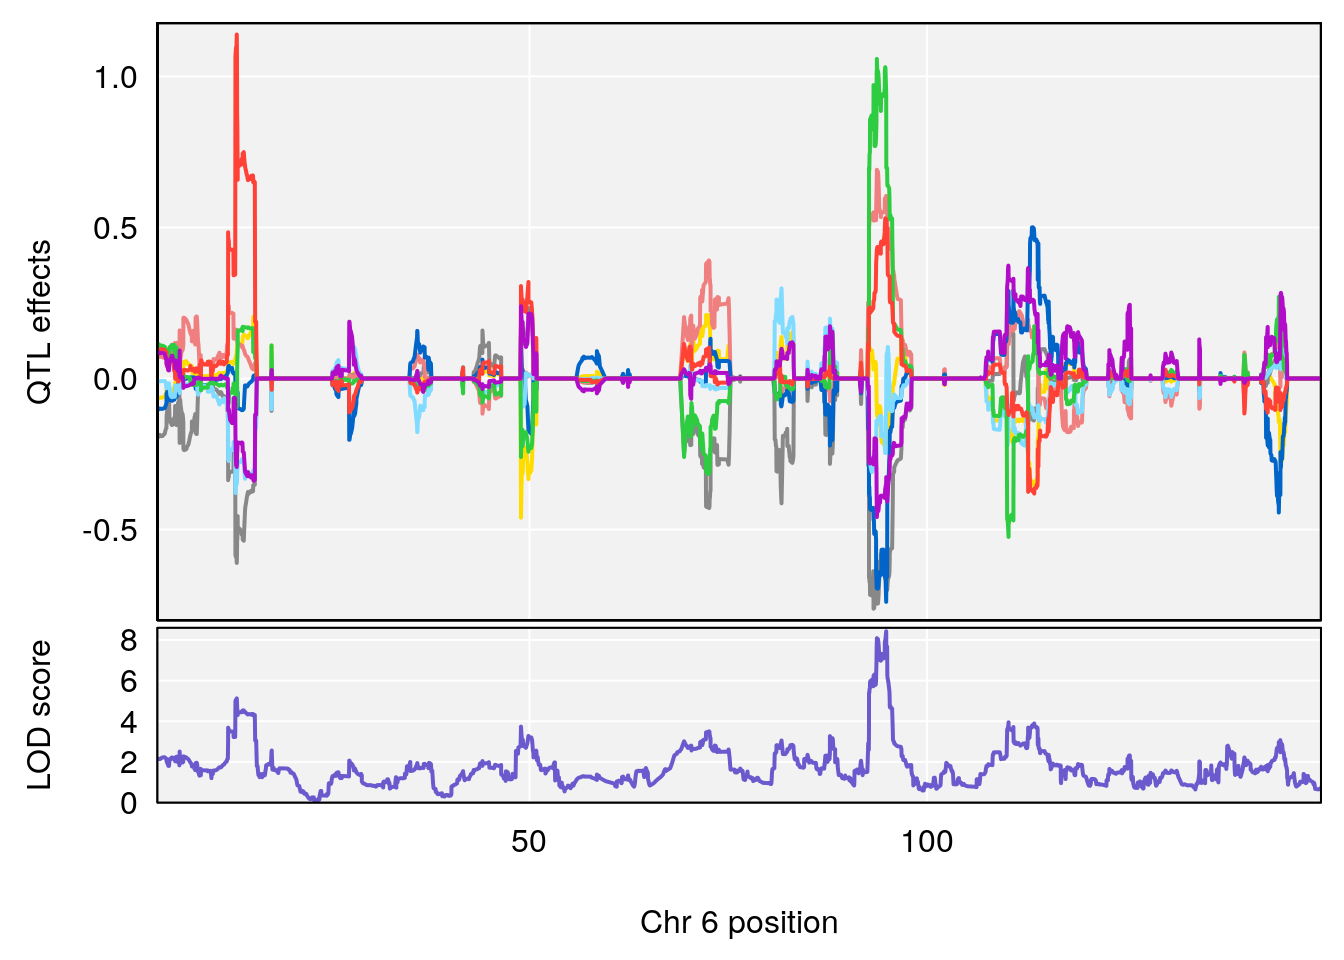
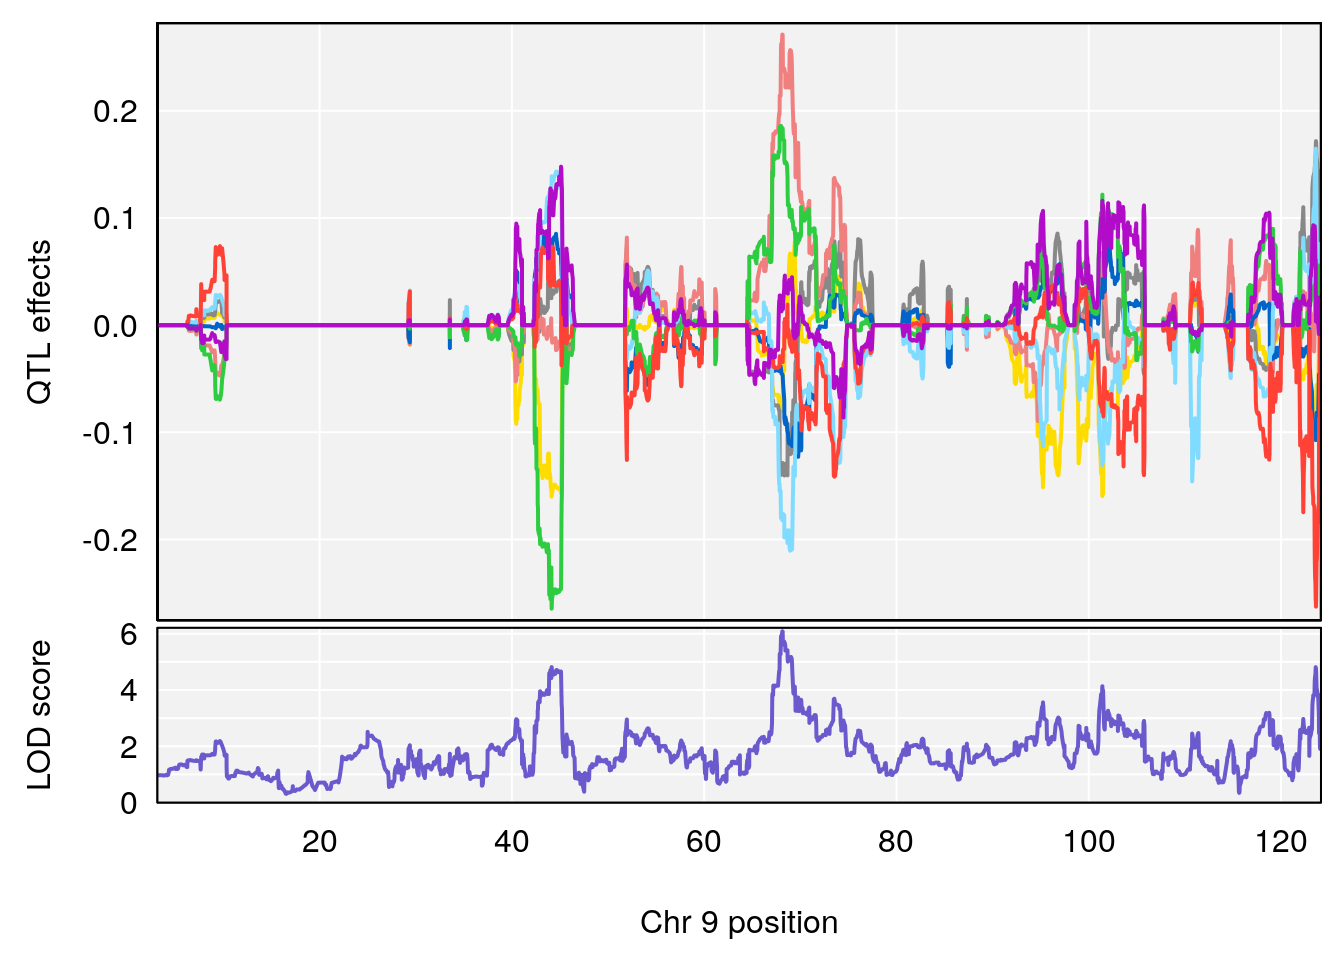
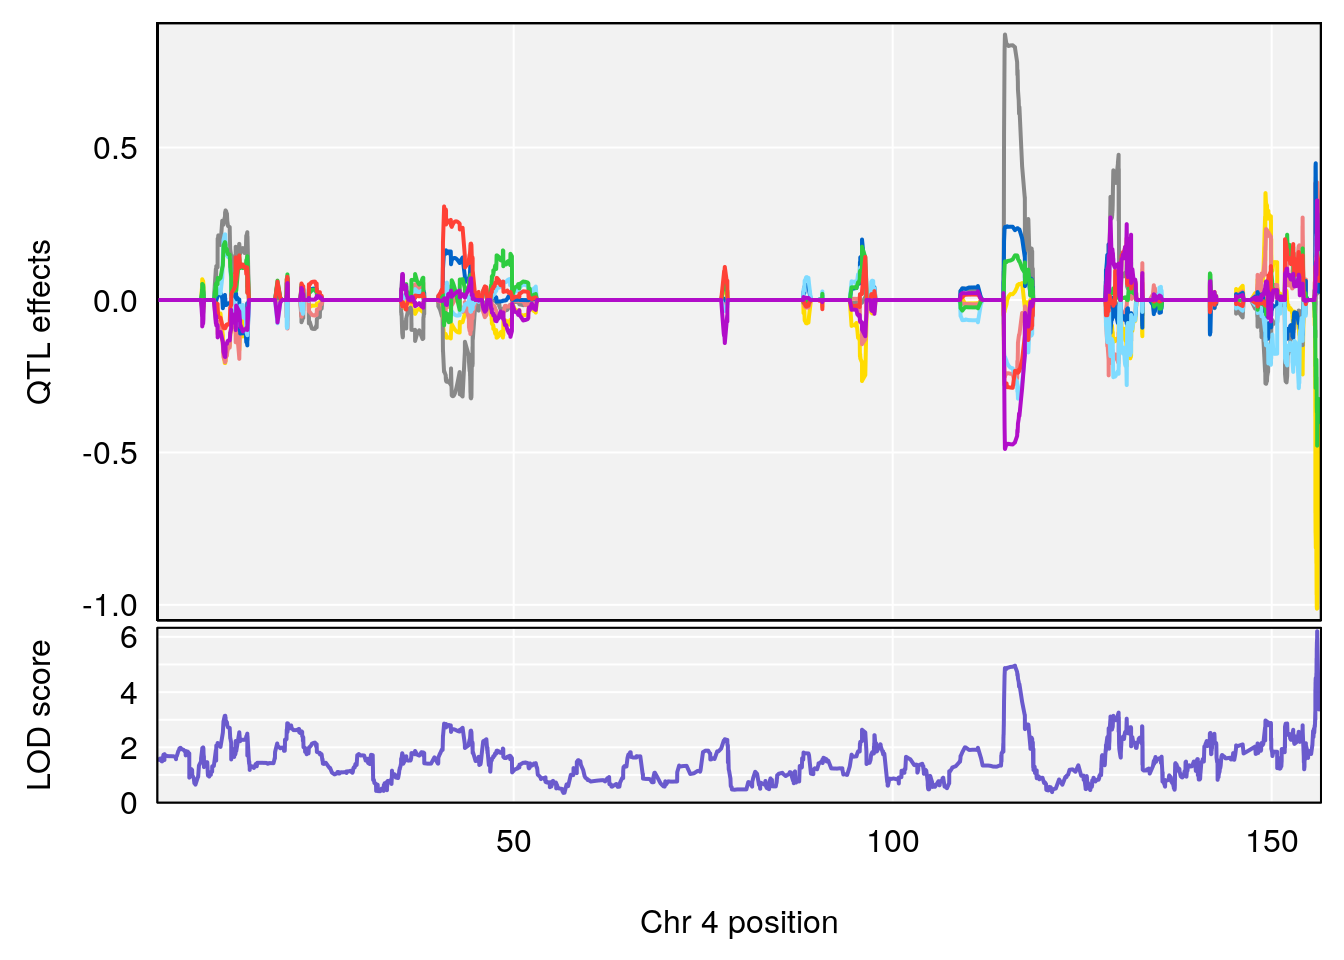
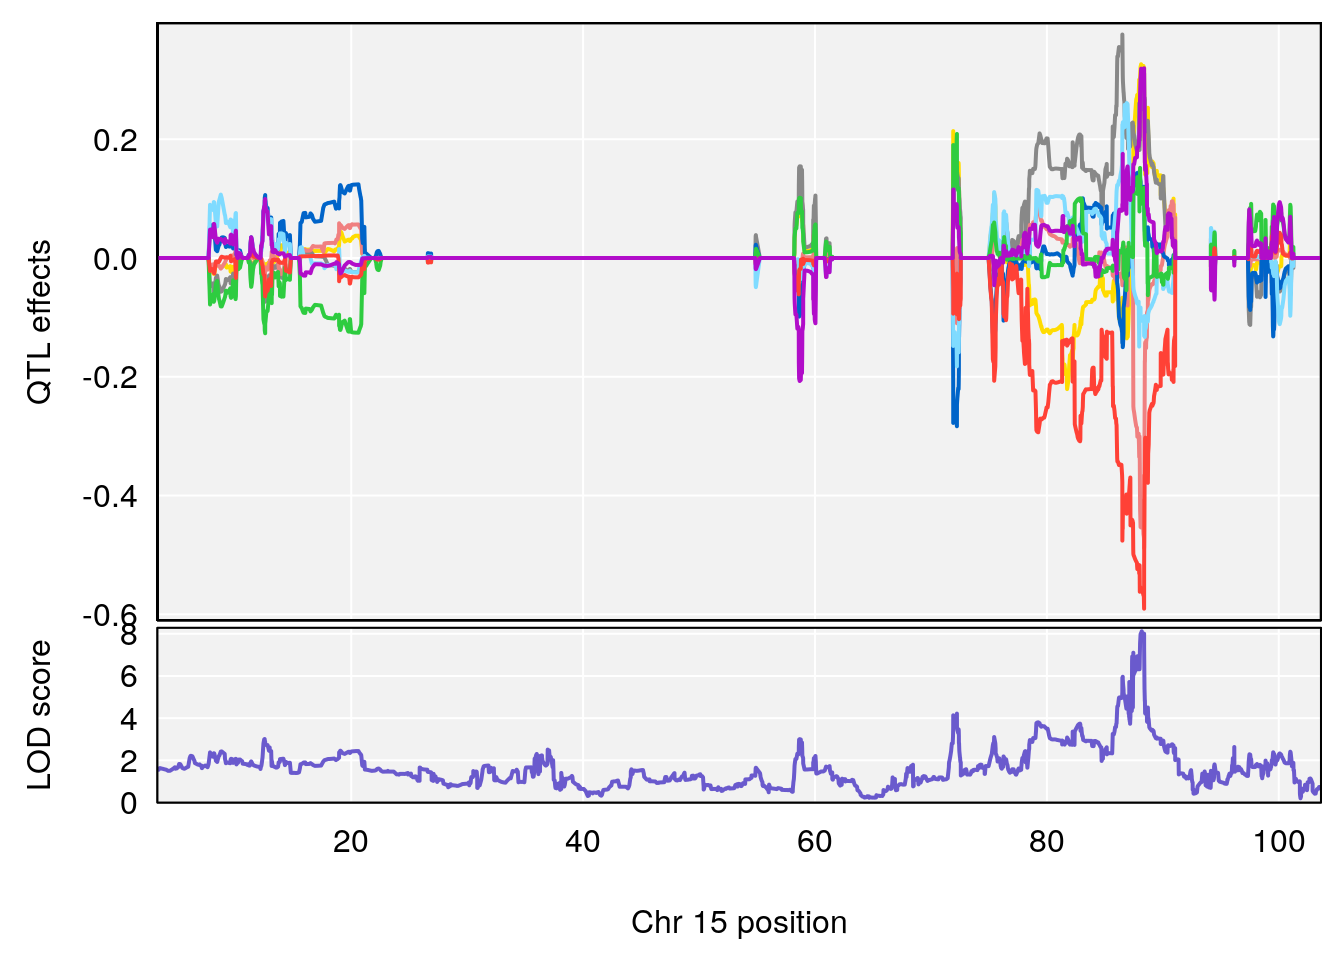
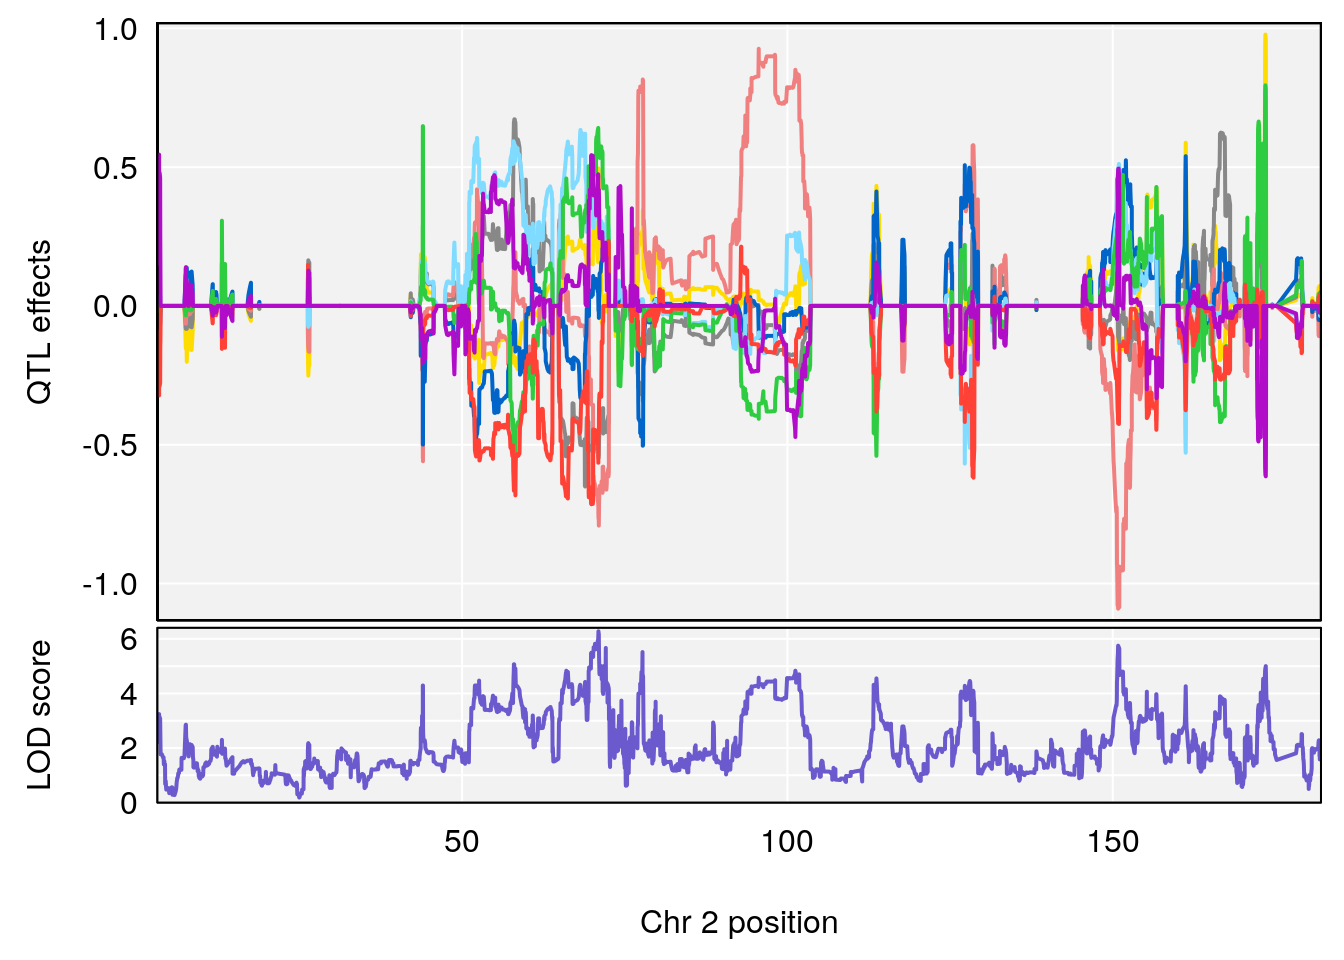
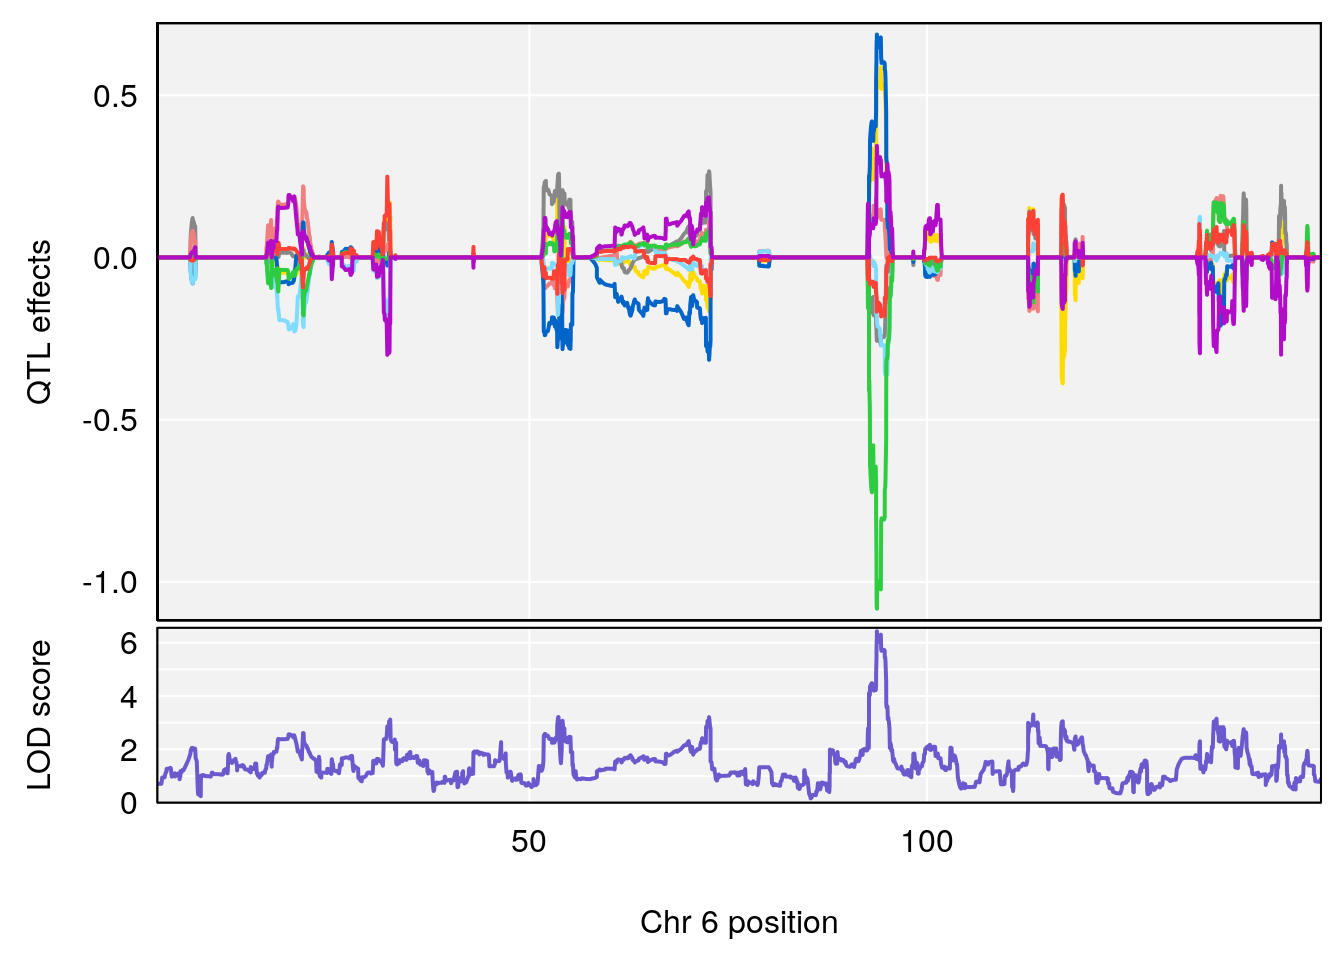
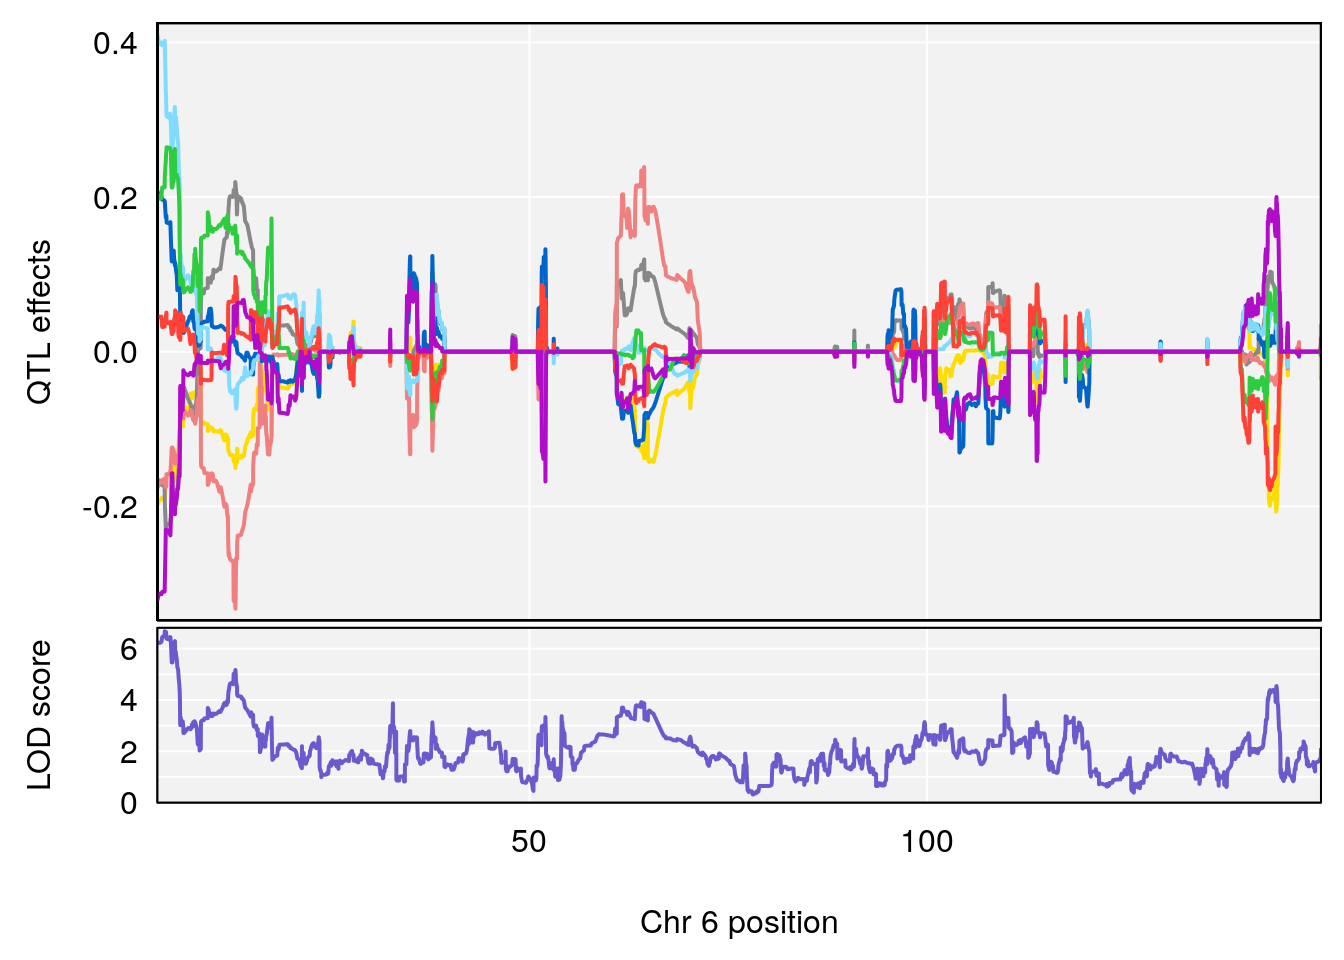
#peaks coeff plot
for(i in names(qtl.morphine.out)){
print(i)
peaks <- find_peaks(qtl.morphine.out[[i]], map=pmap, threshold=6, drop=1.5)
print(peaks)
for(p in 1:dim(peaks)[1]) {
print(p)
chr <-peaks[p,3]
#coeff plot
par(mar=c(4.1, 4.1, 0.6, 0.6))
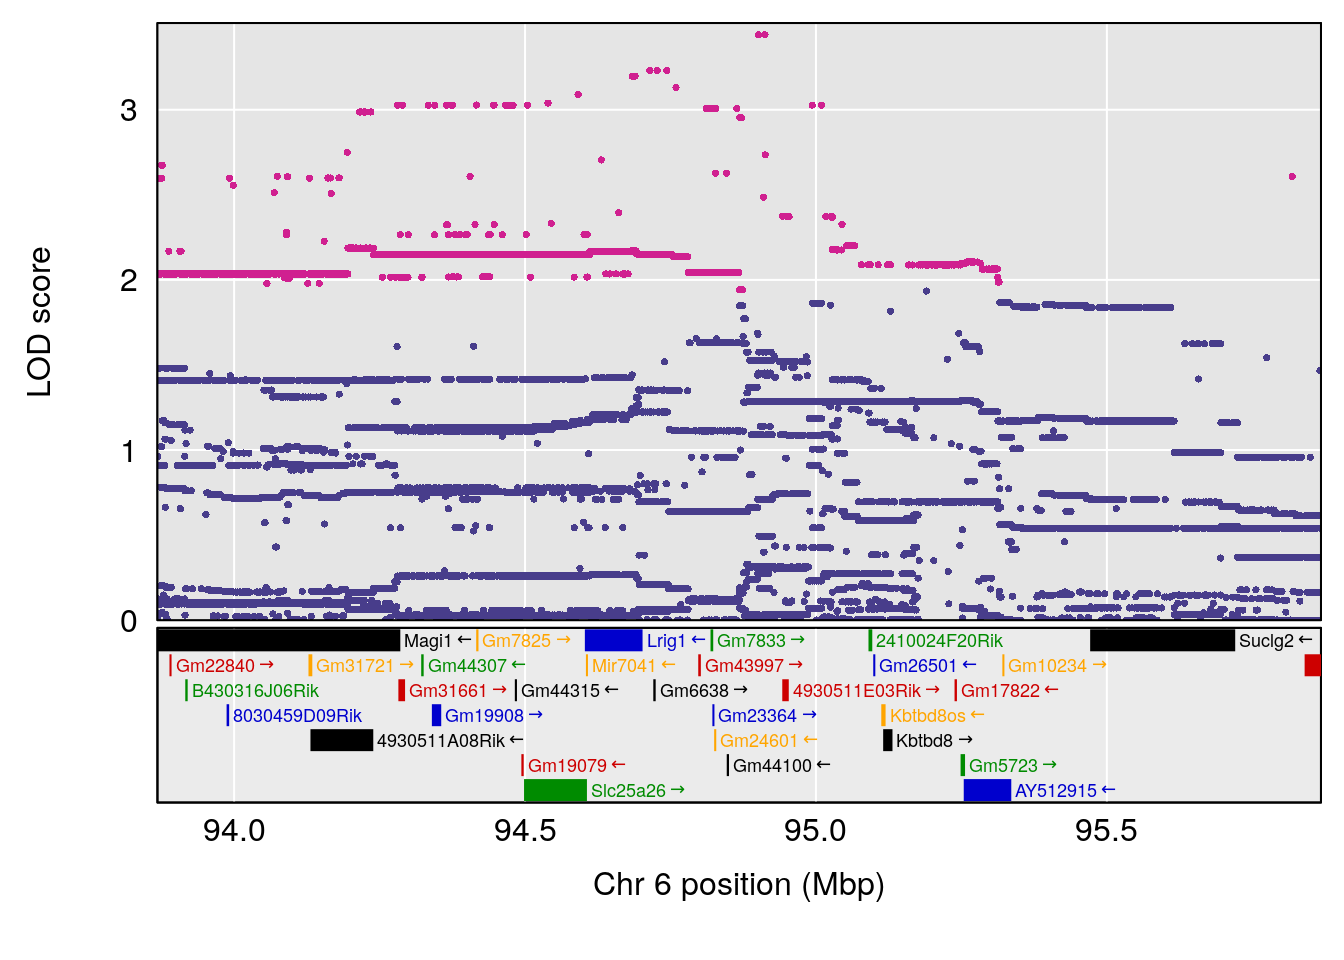
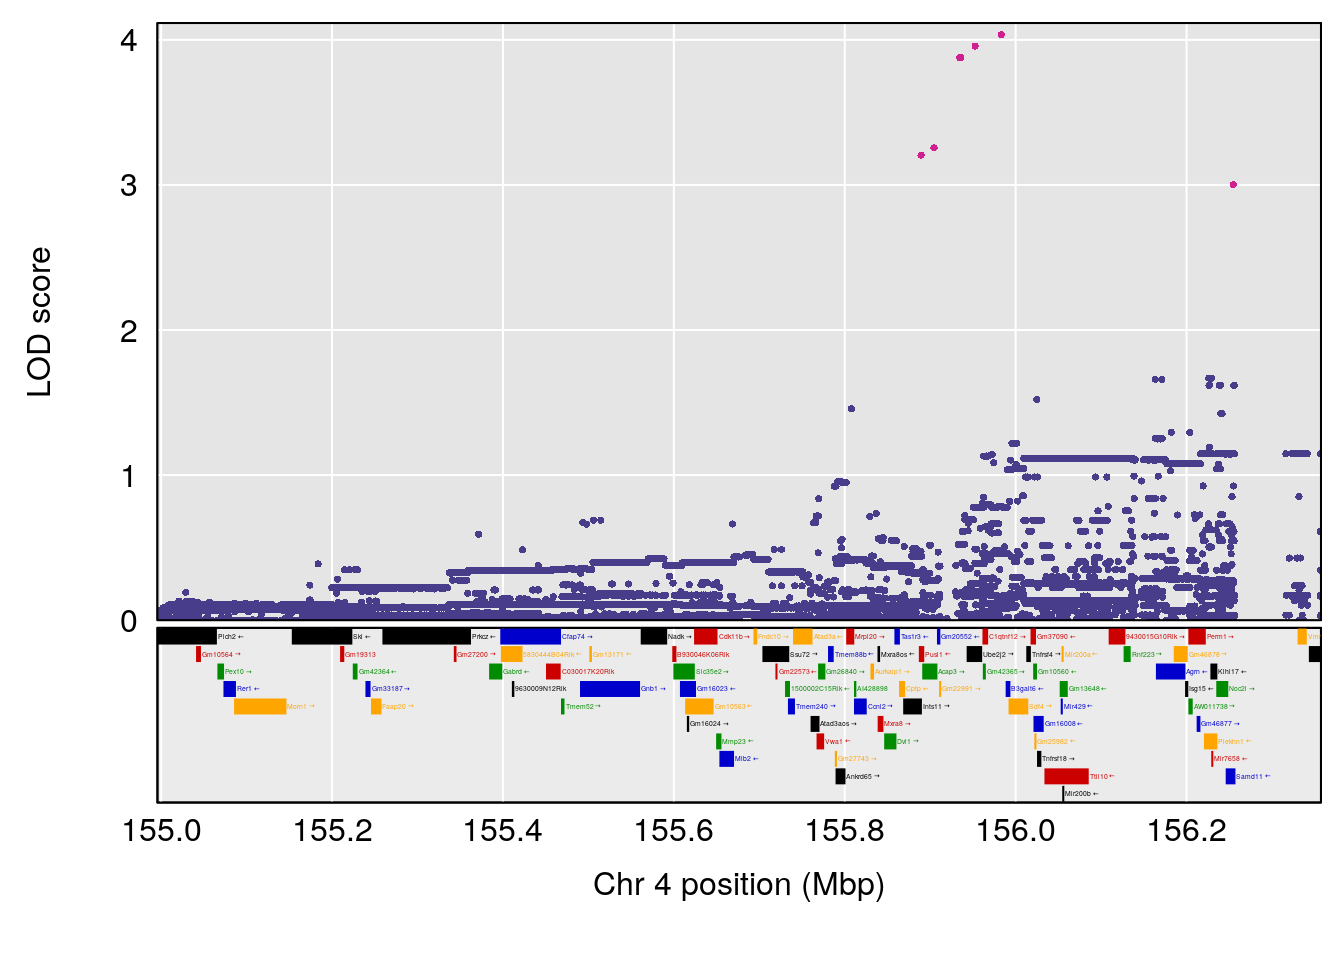
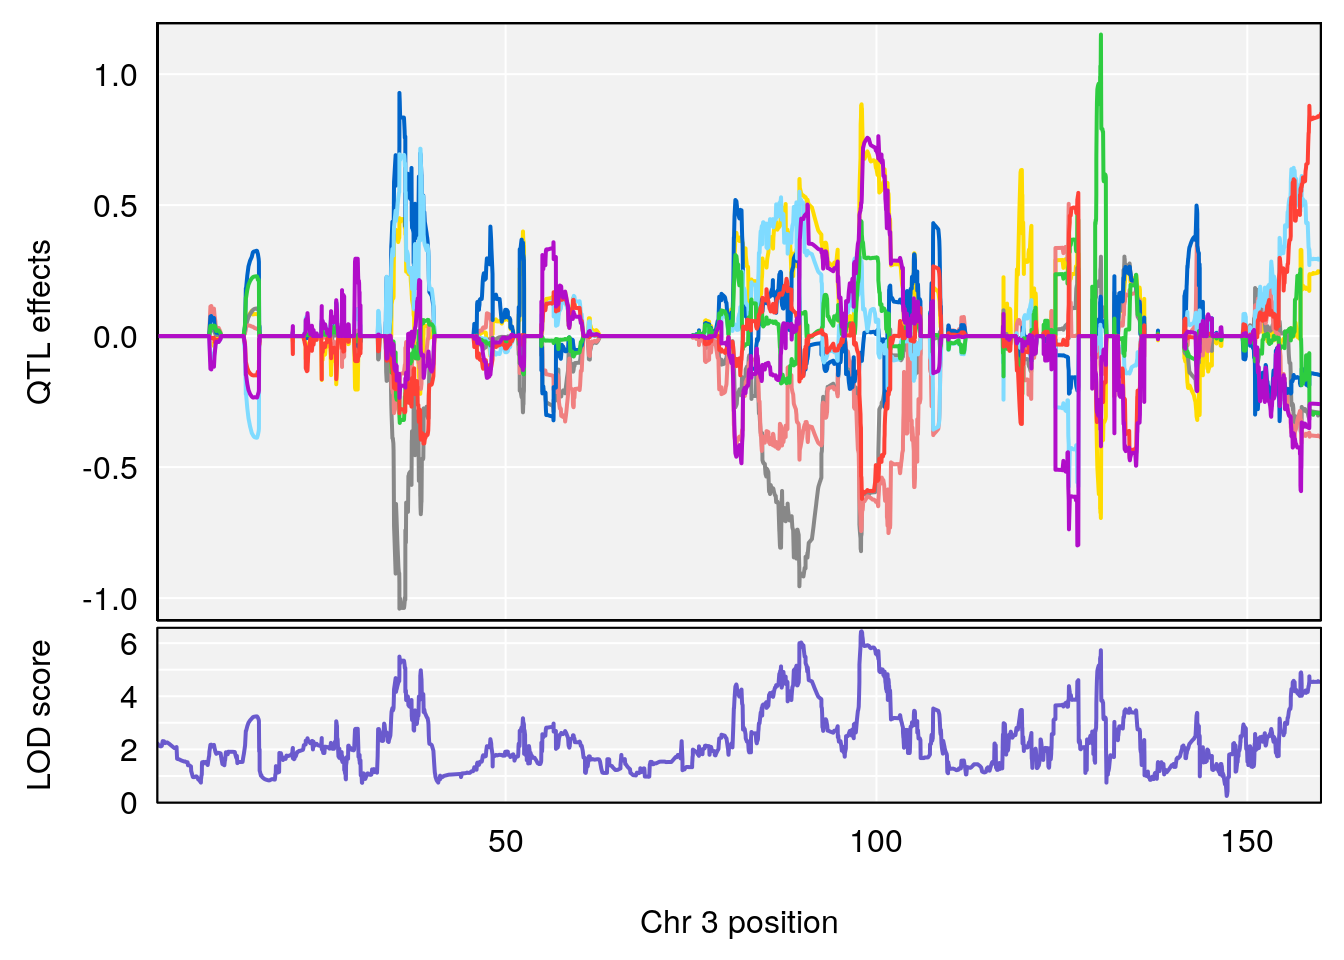
plot_coefCC(coef_c1[[i]][[p]], pmap[chr], scan1_output=qtl.morphine.out[[i]], bgcolor="gray95", legend=NULL)
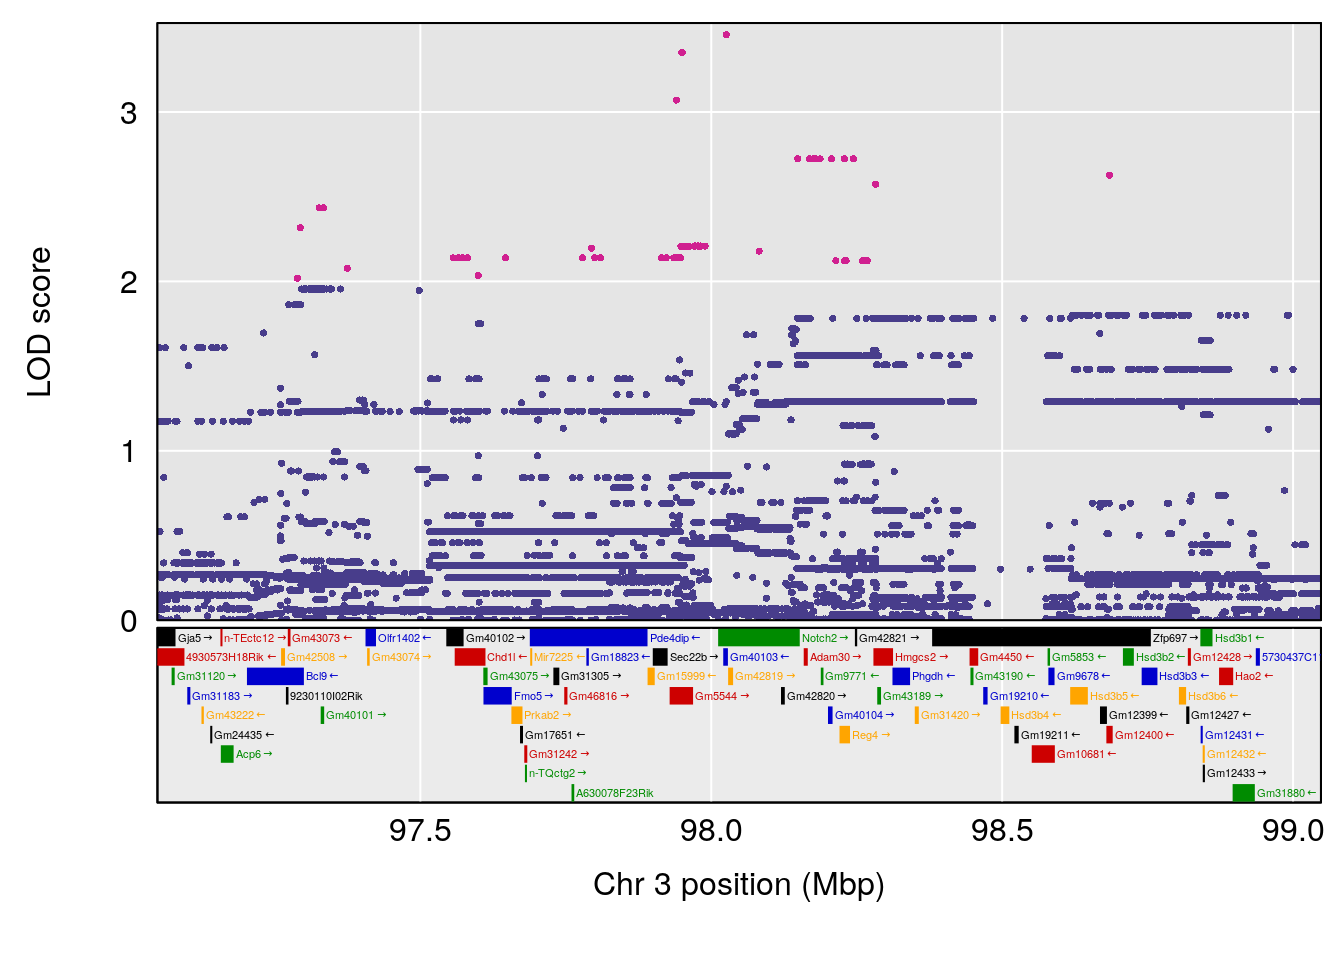
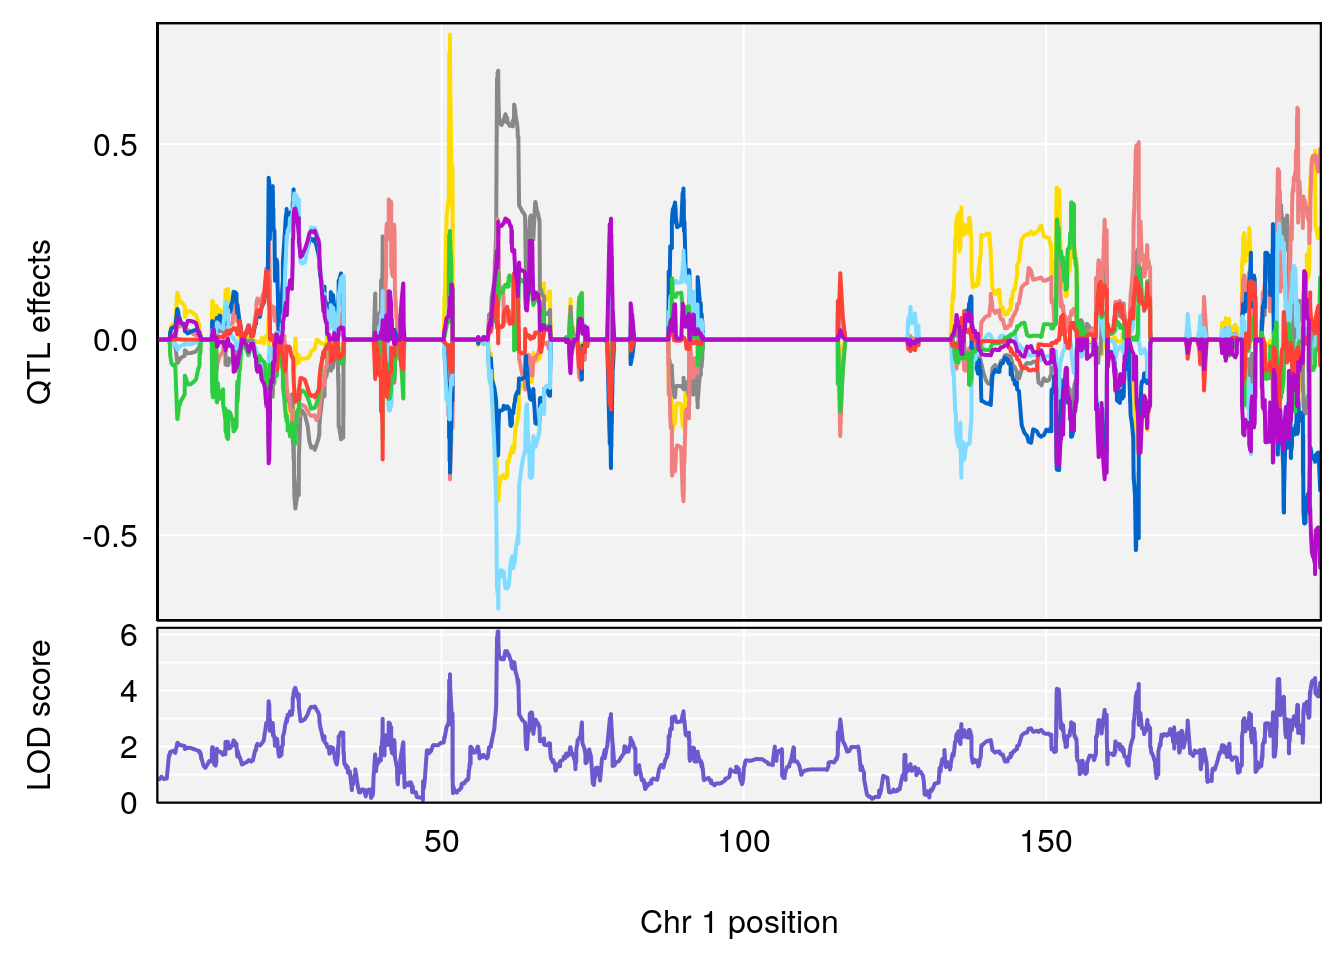
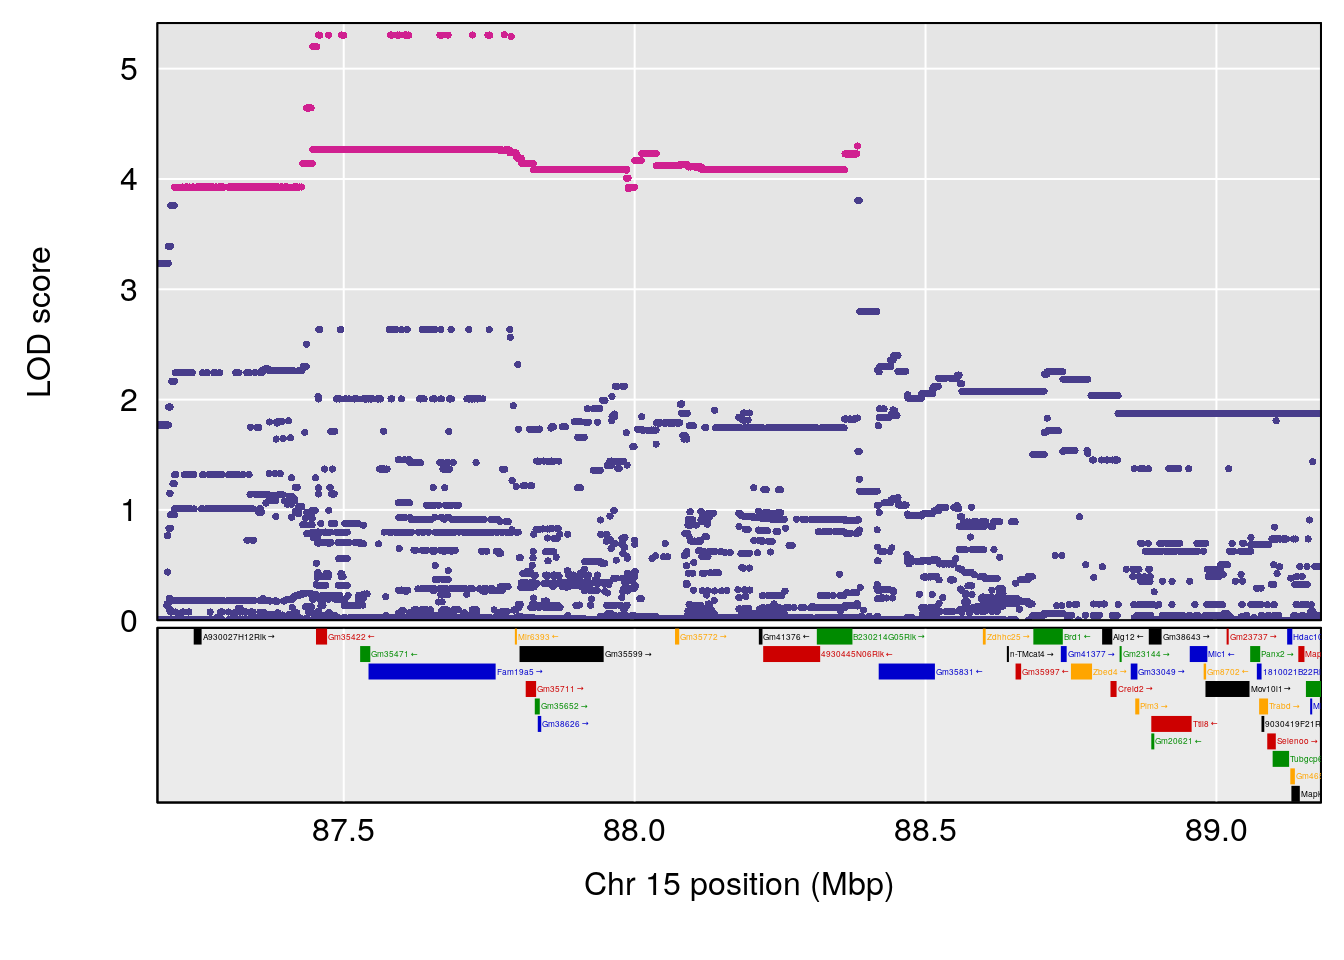
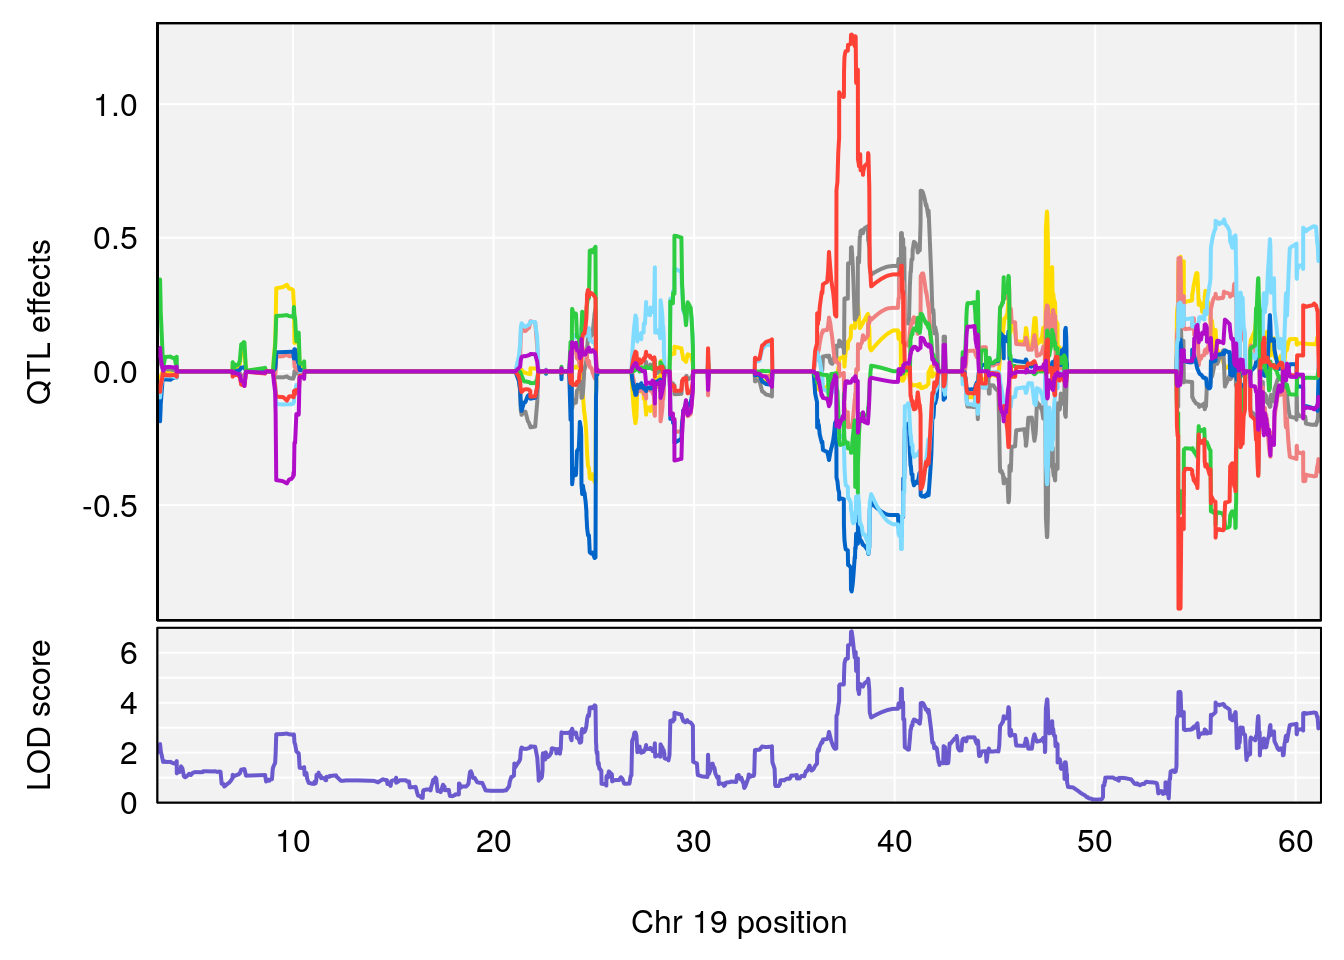
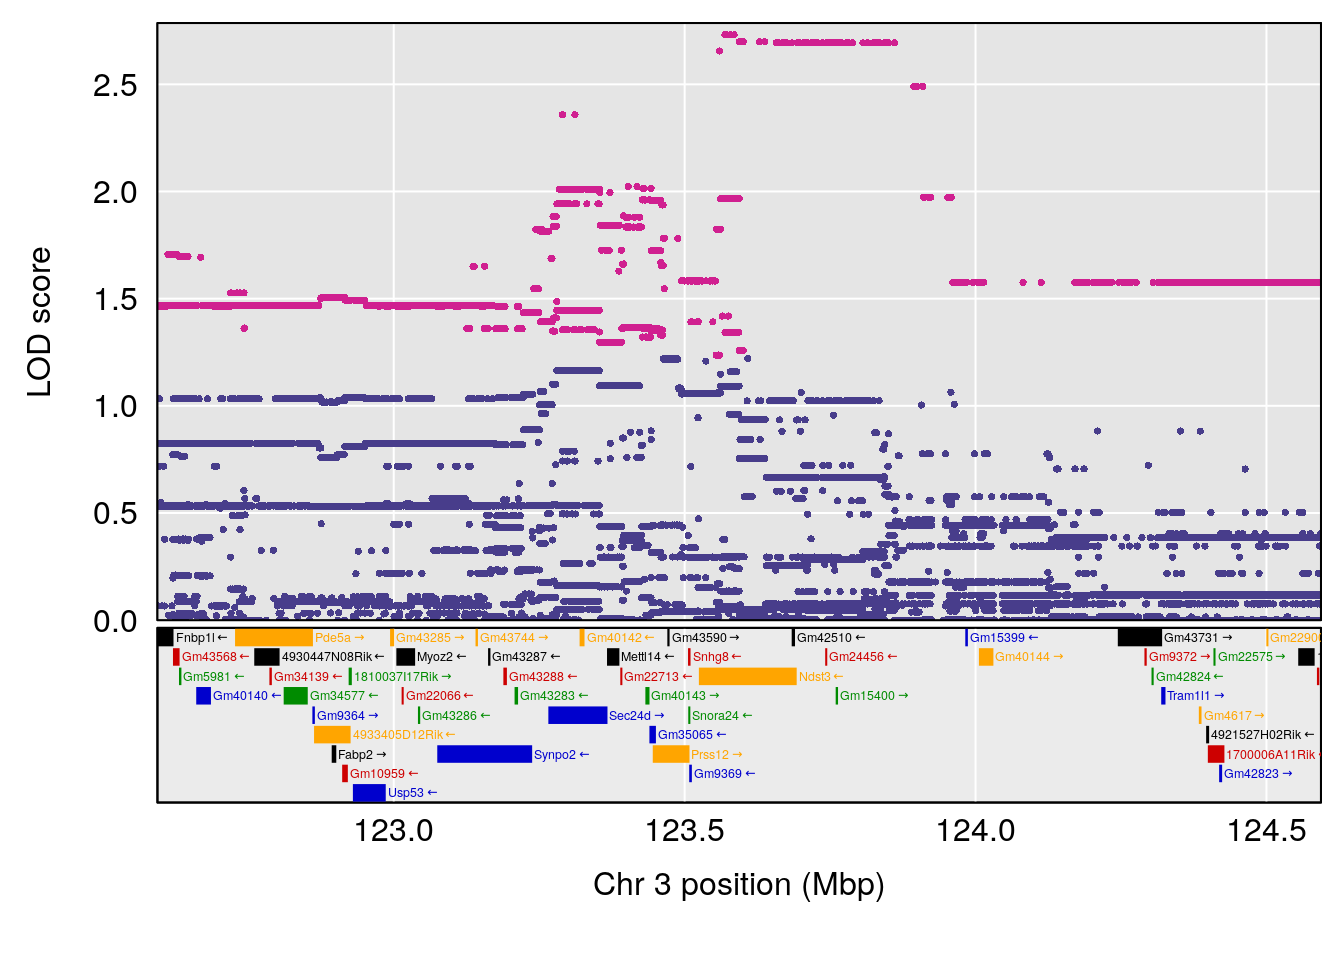
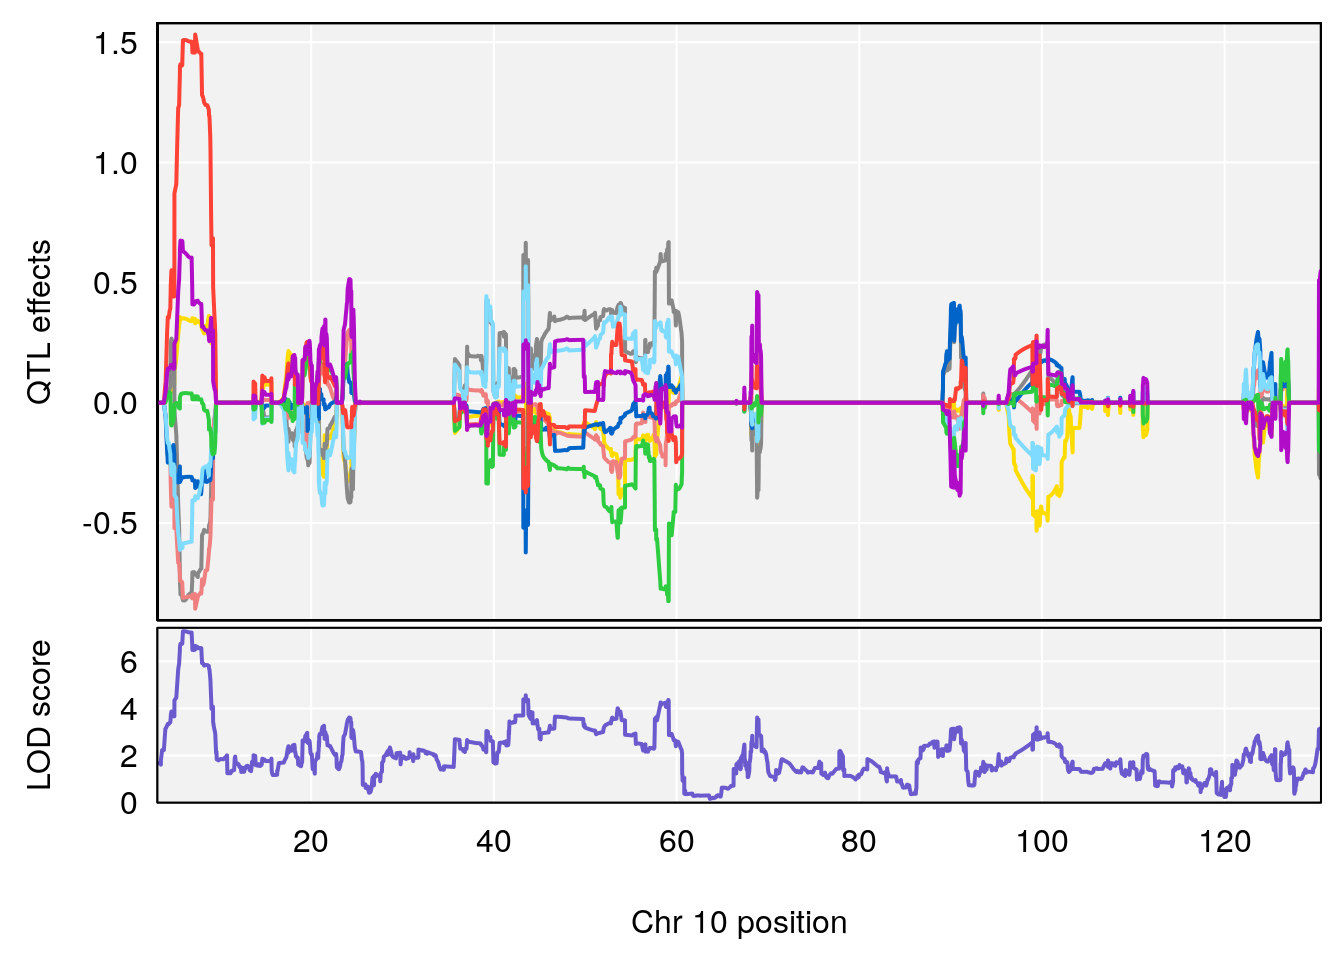
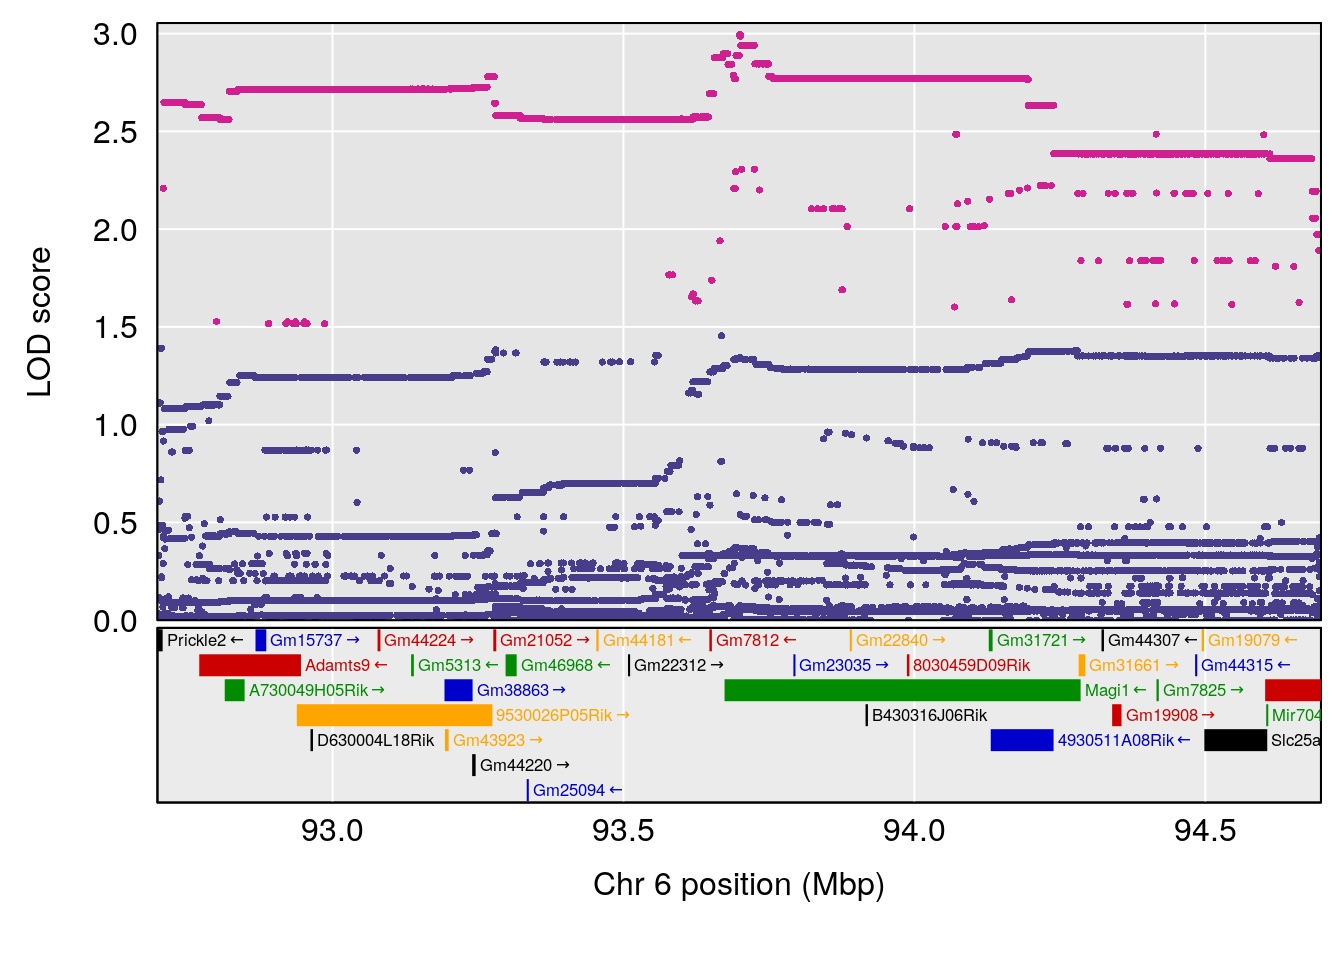
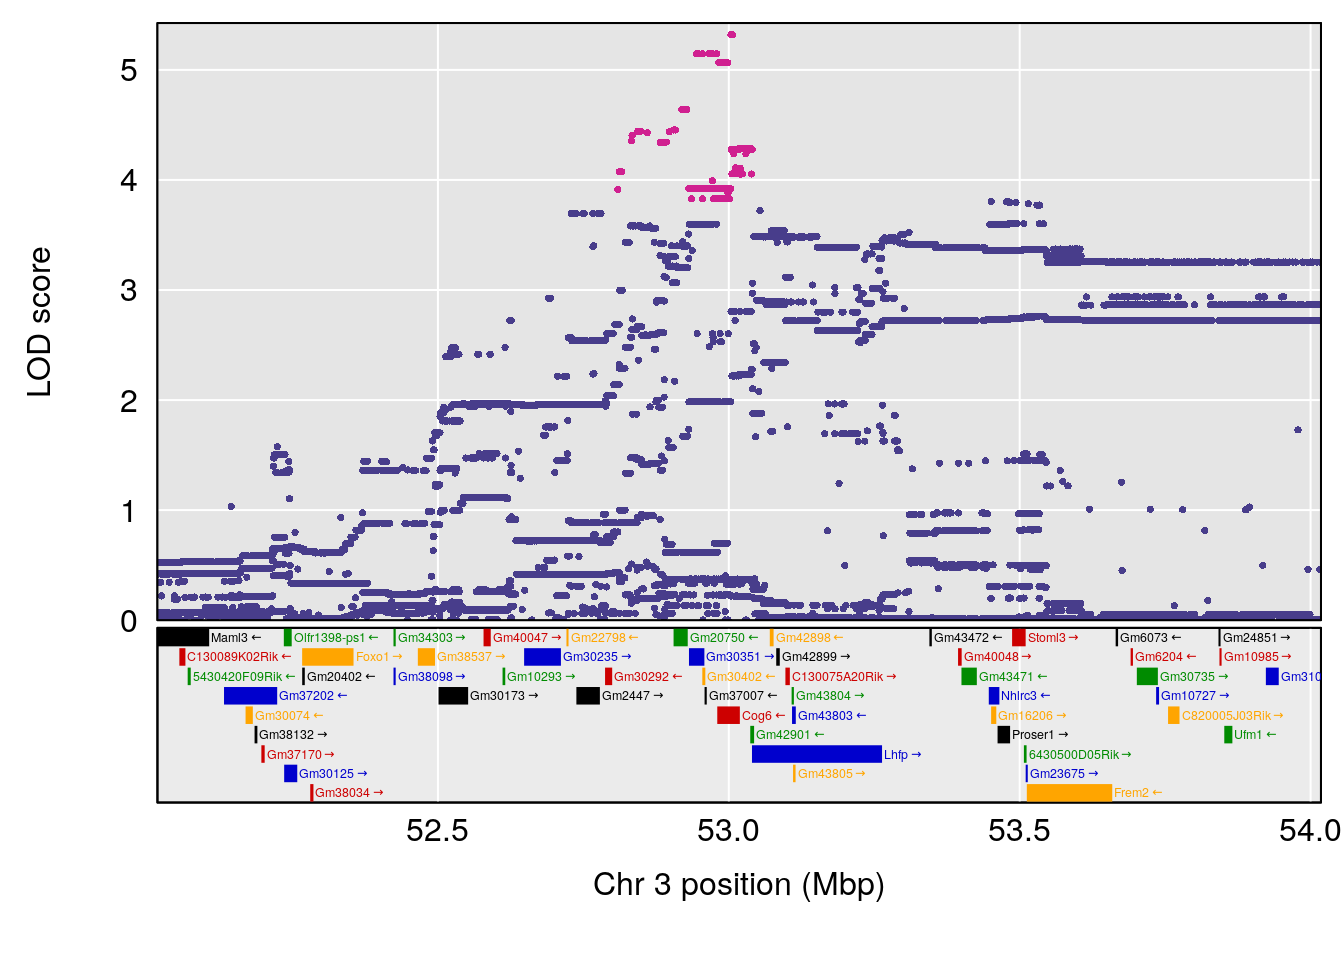
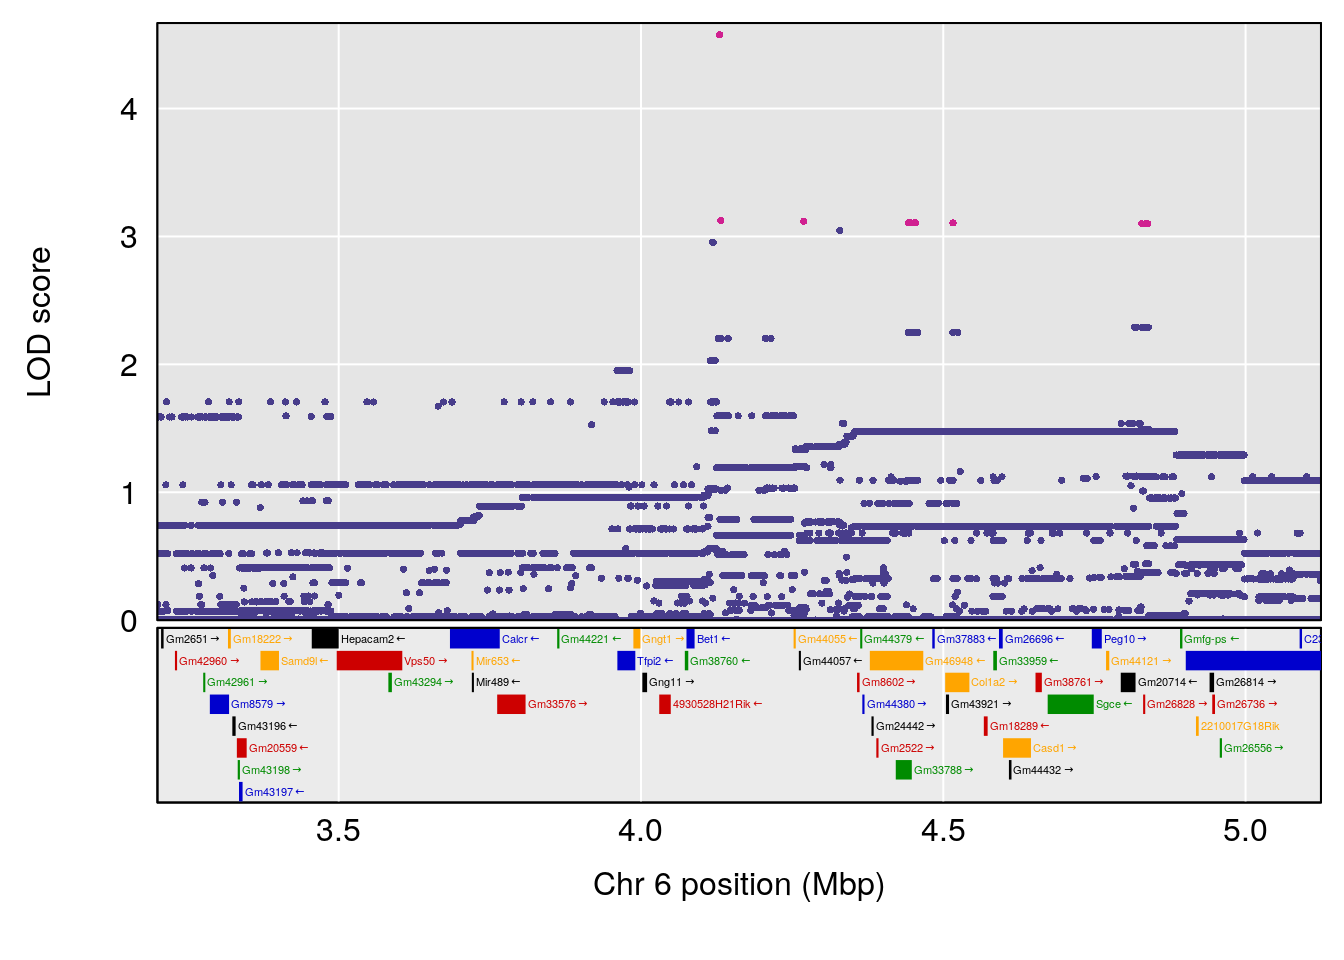
plot_coefCC(coef_c2[[i]][[p]], pmap[chr], scan1_output=qtl.morphine.out[[i]], bgcolor="gray95", legend=NULL)
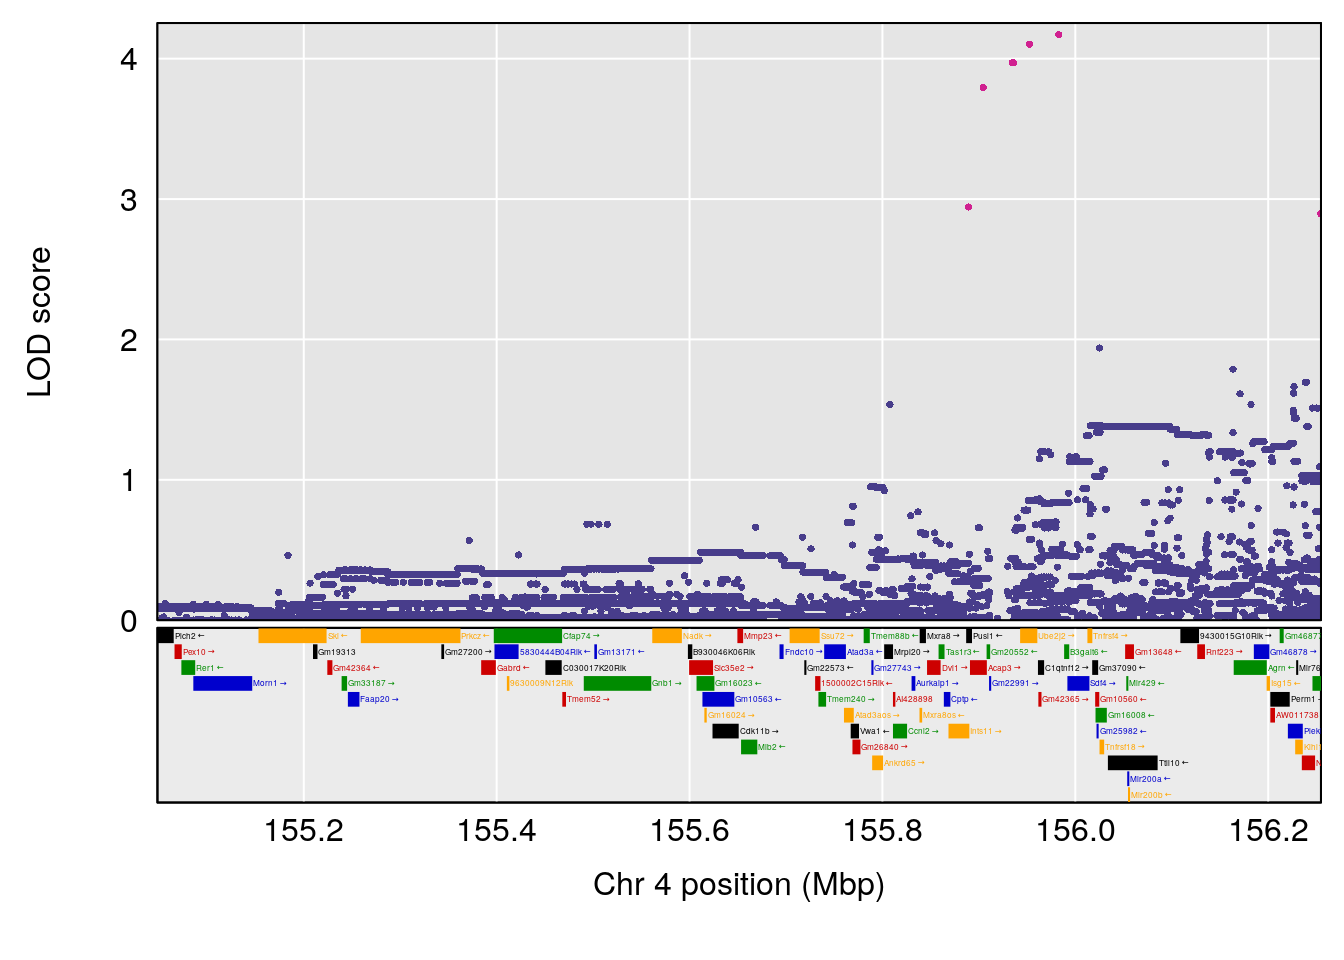
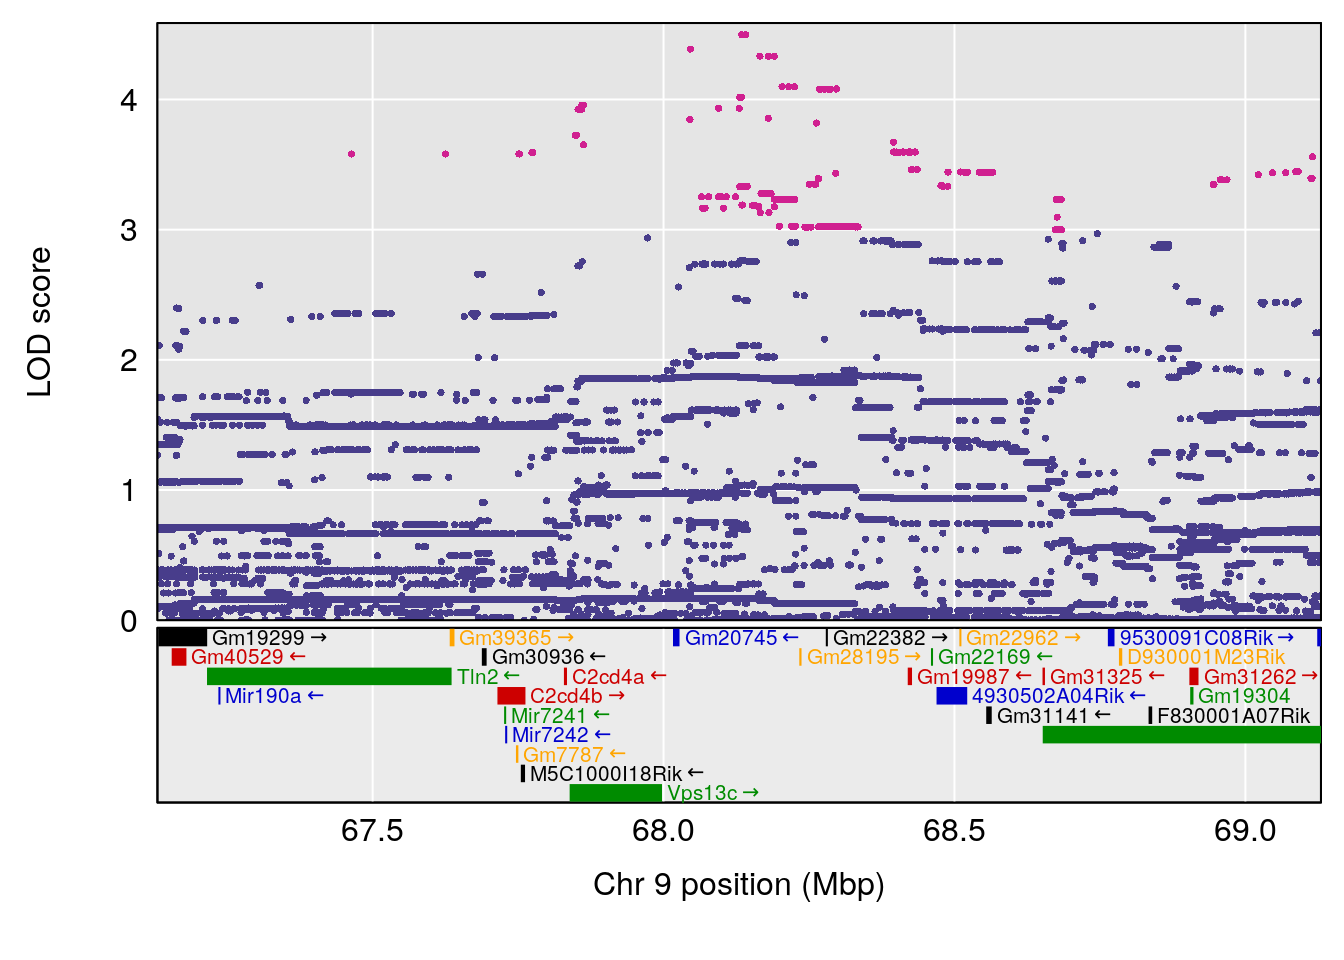
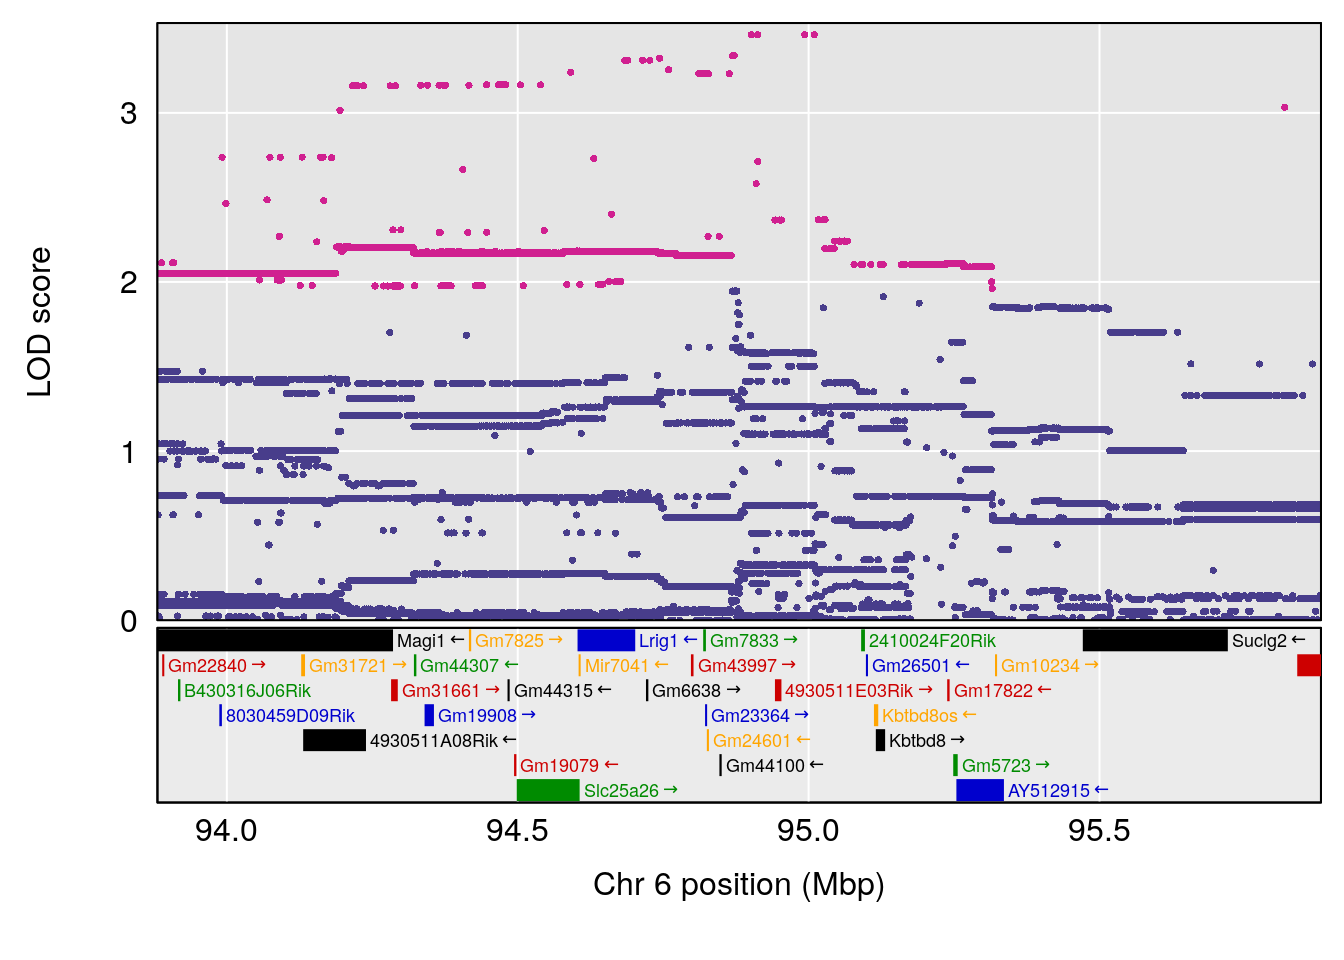
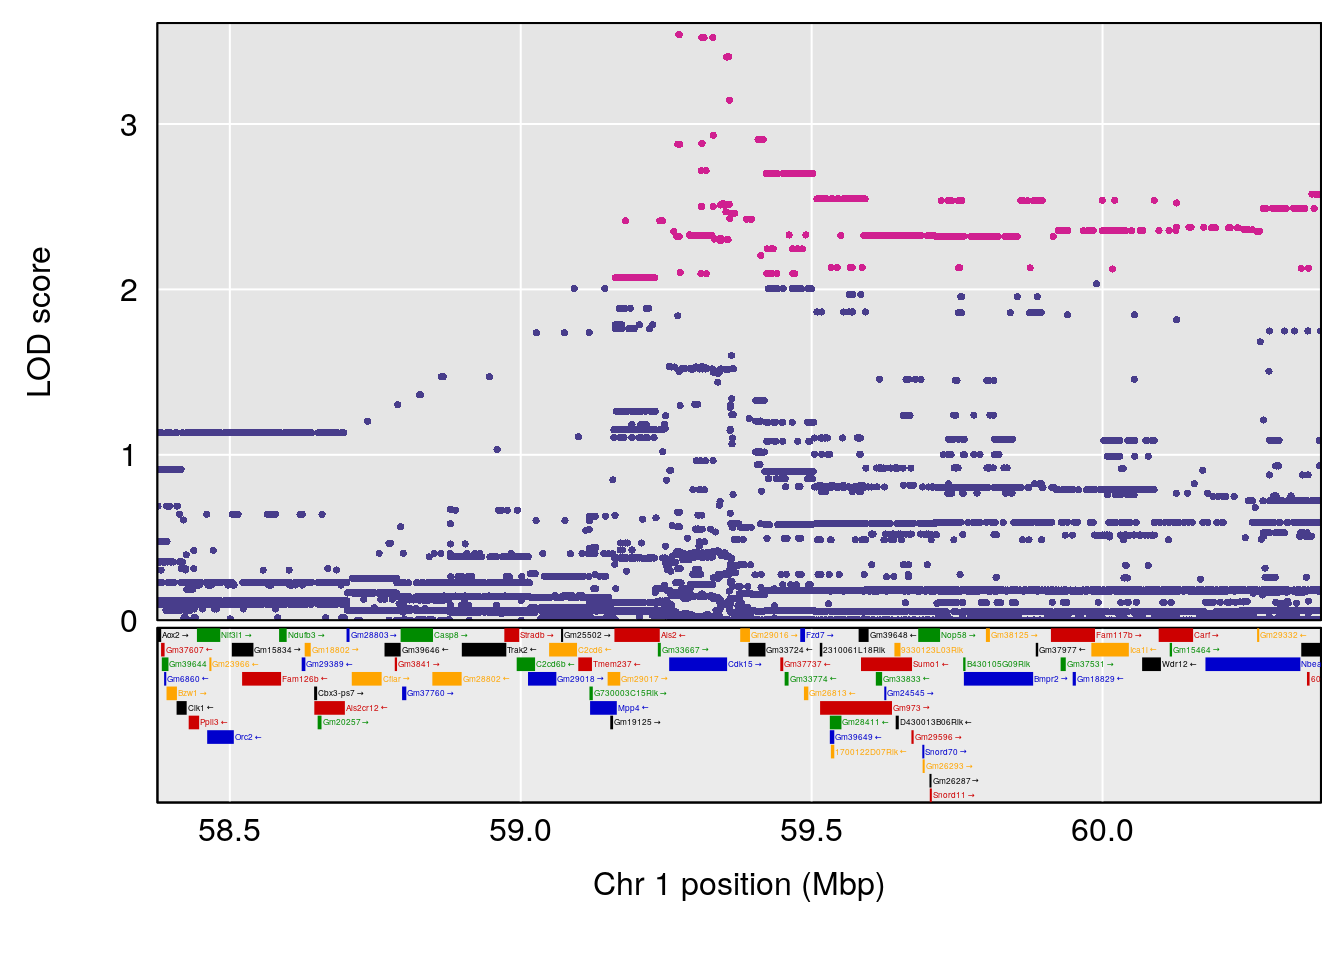
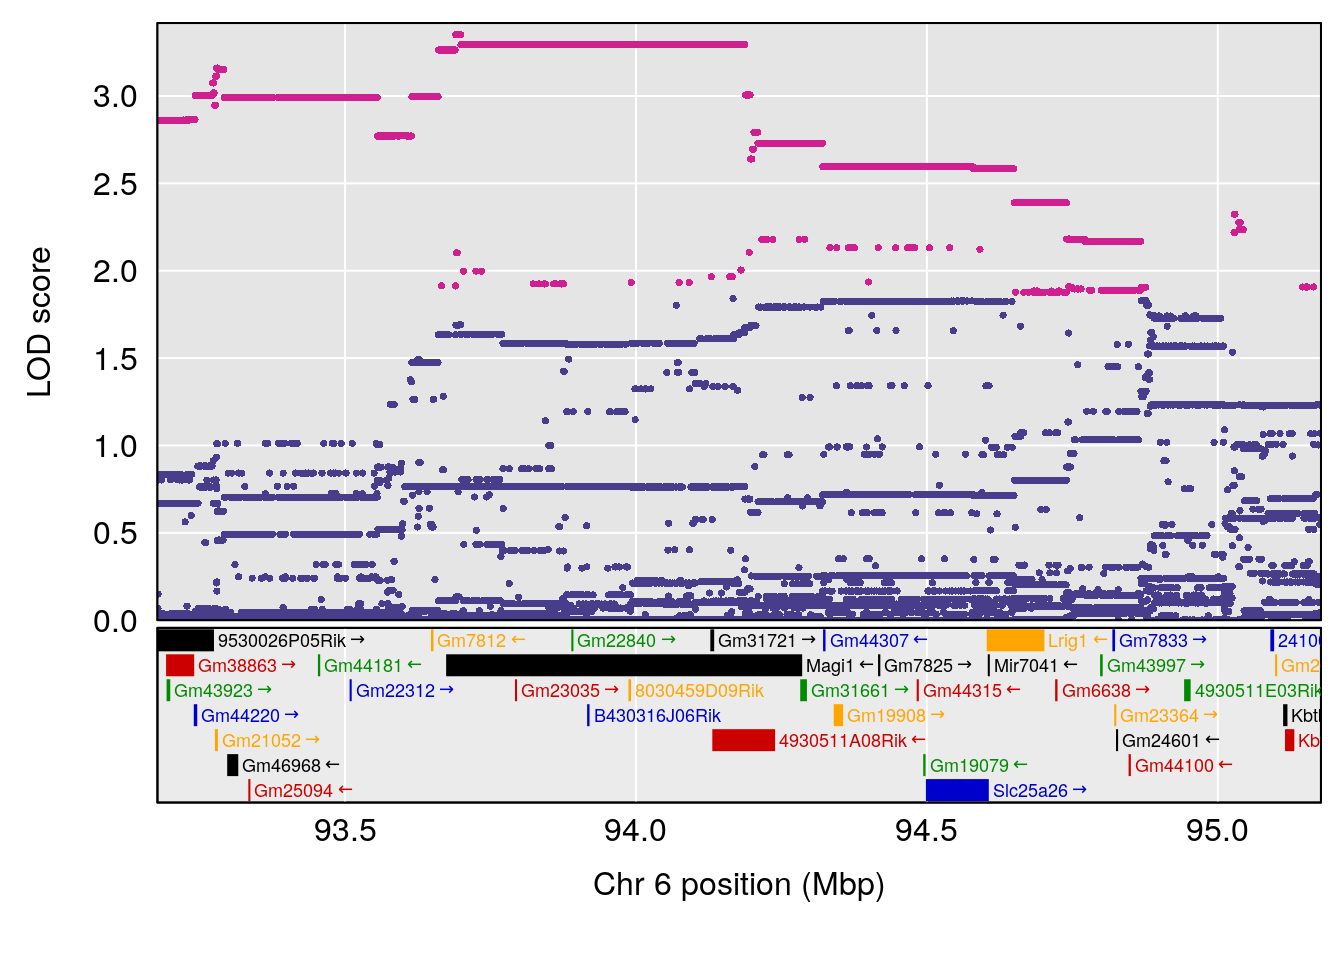
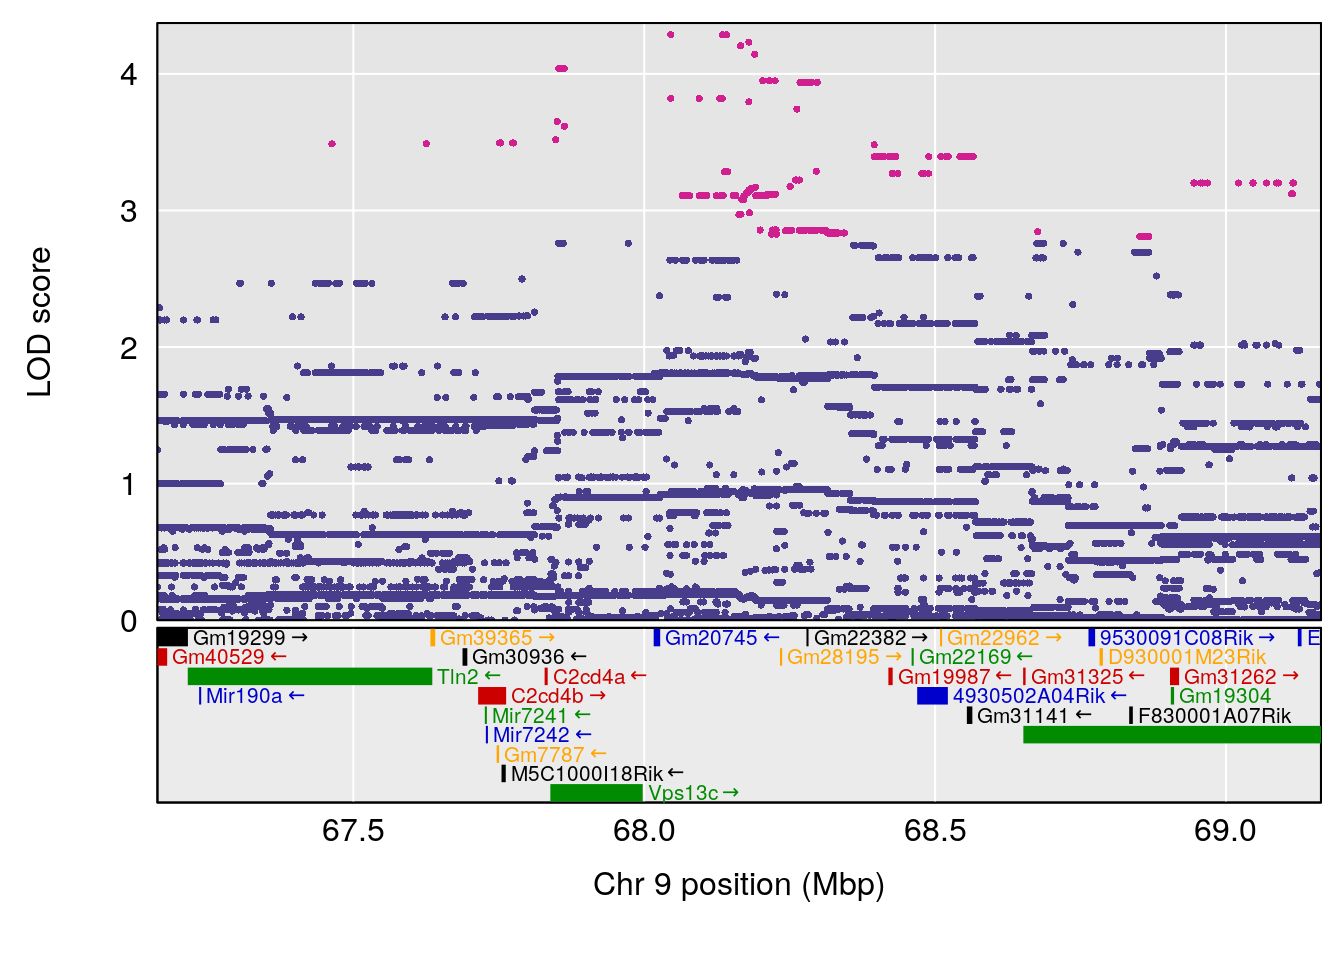
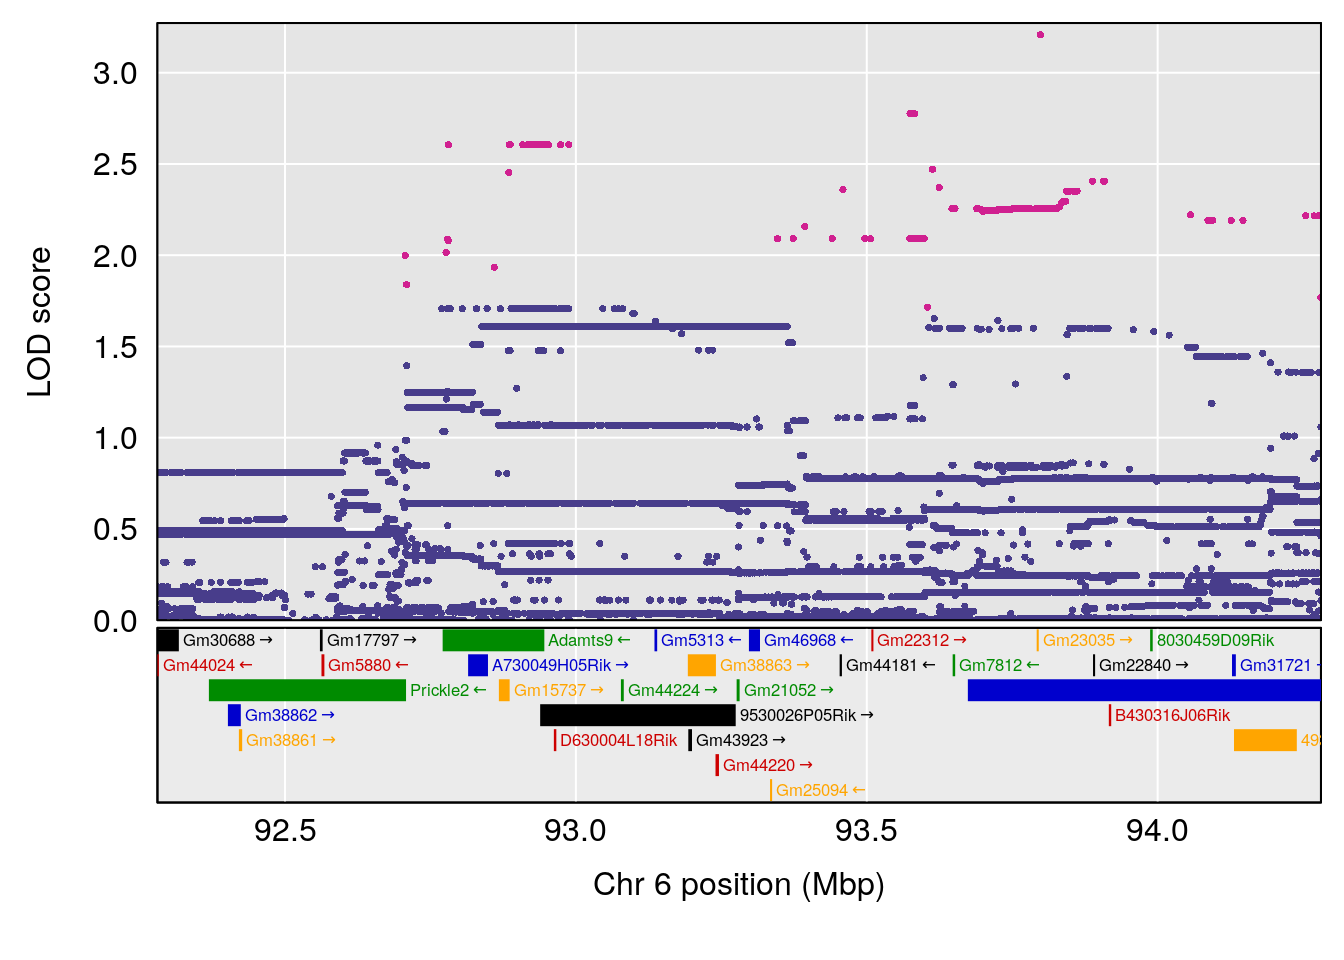
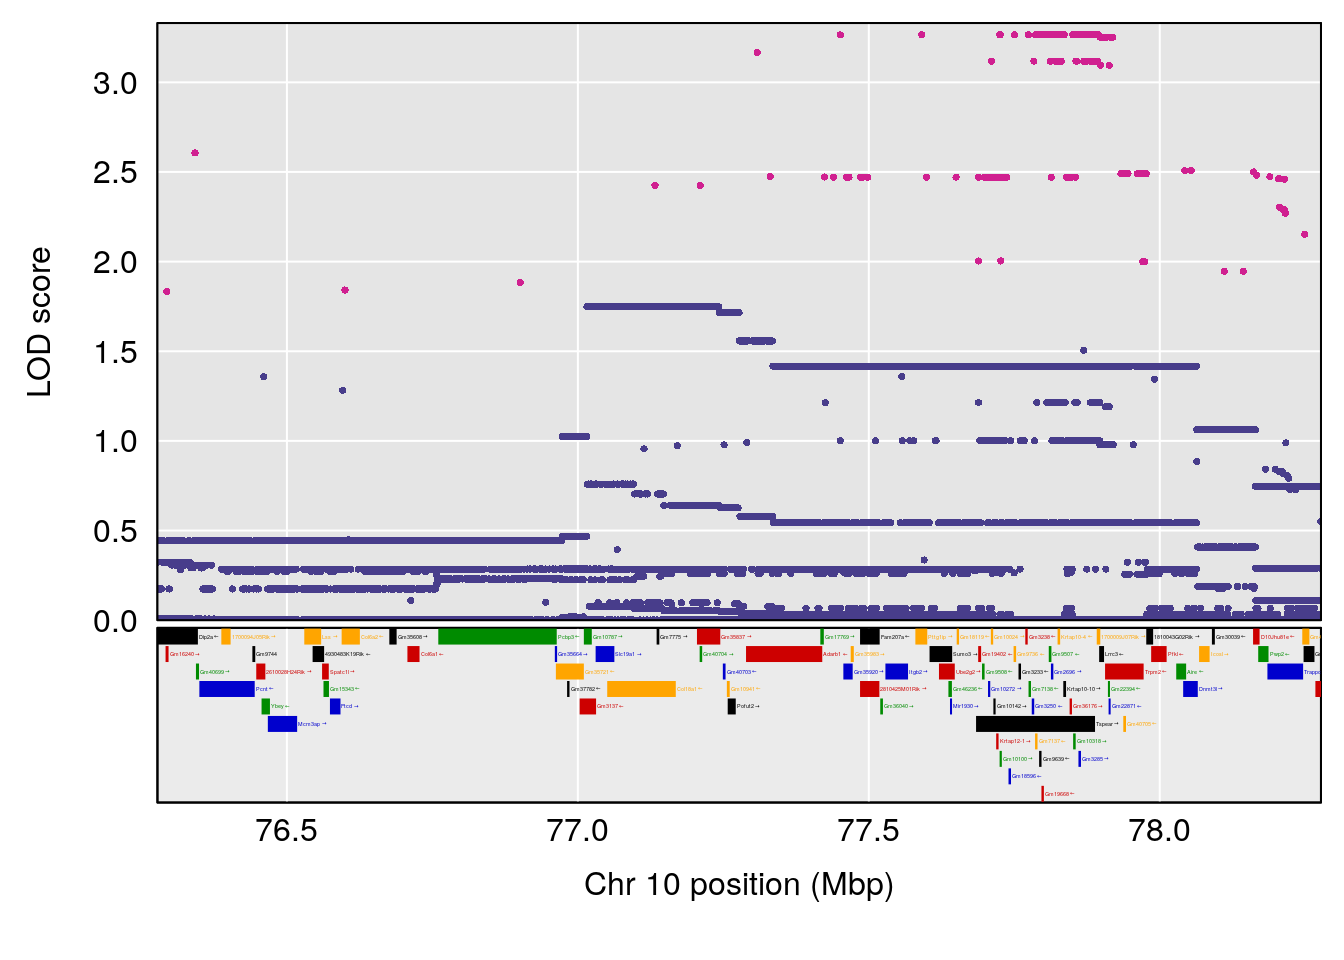
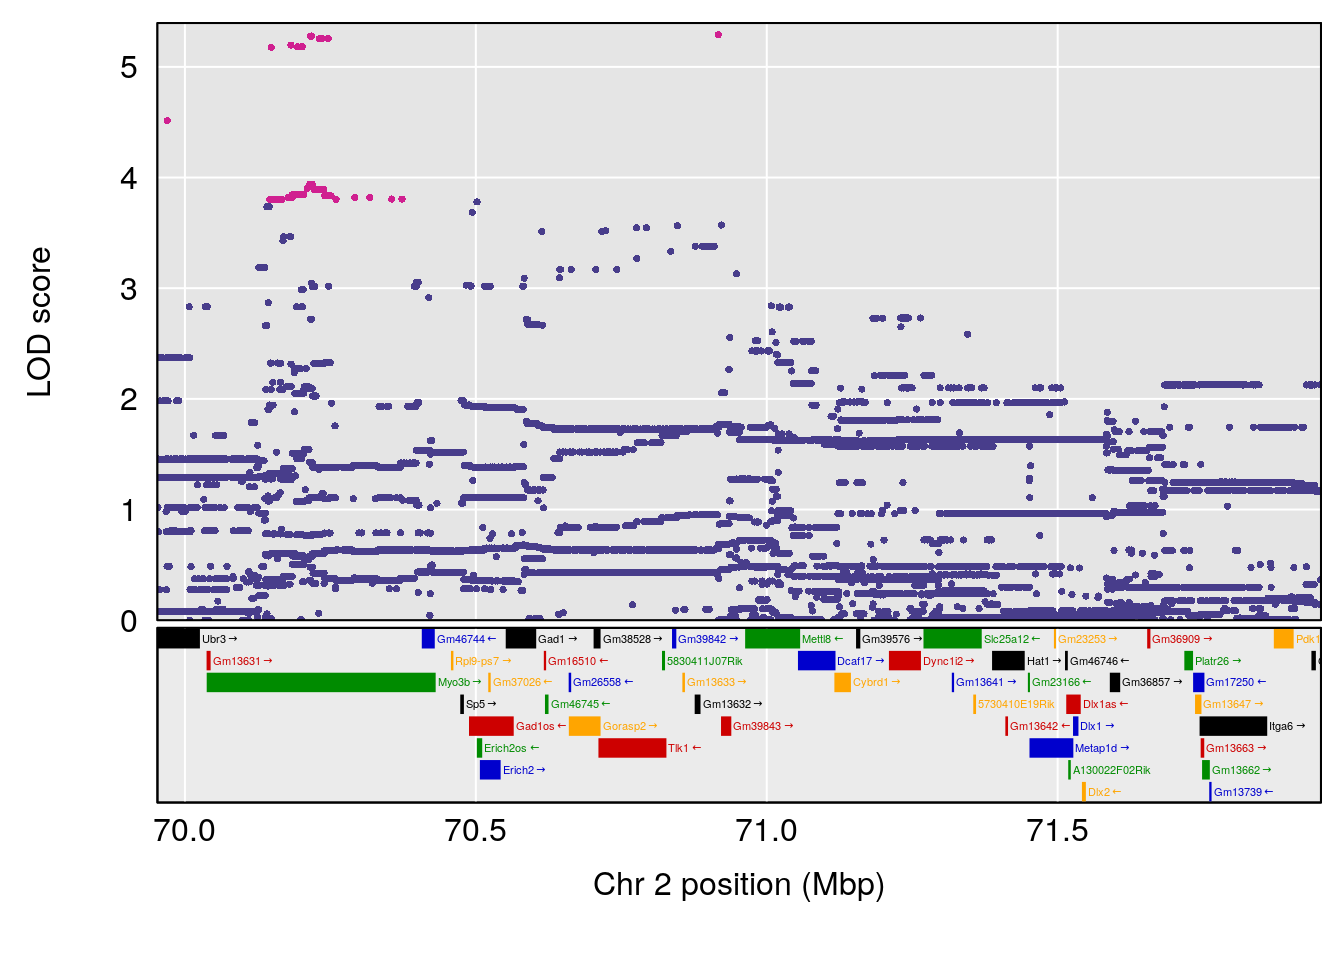
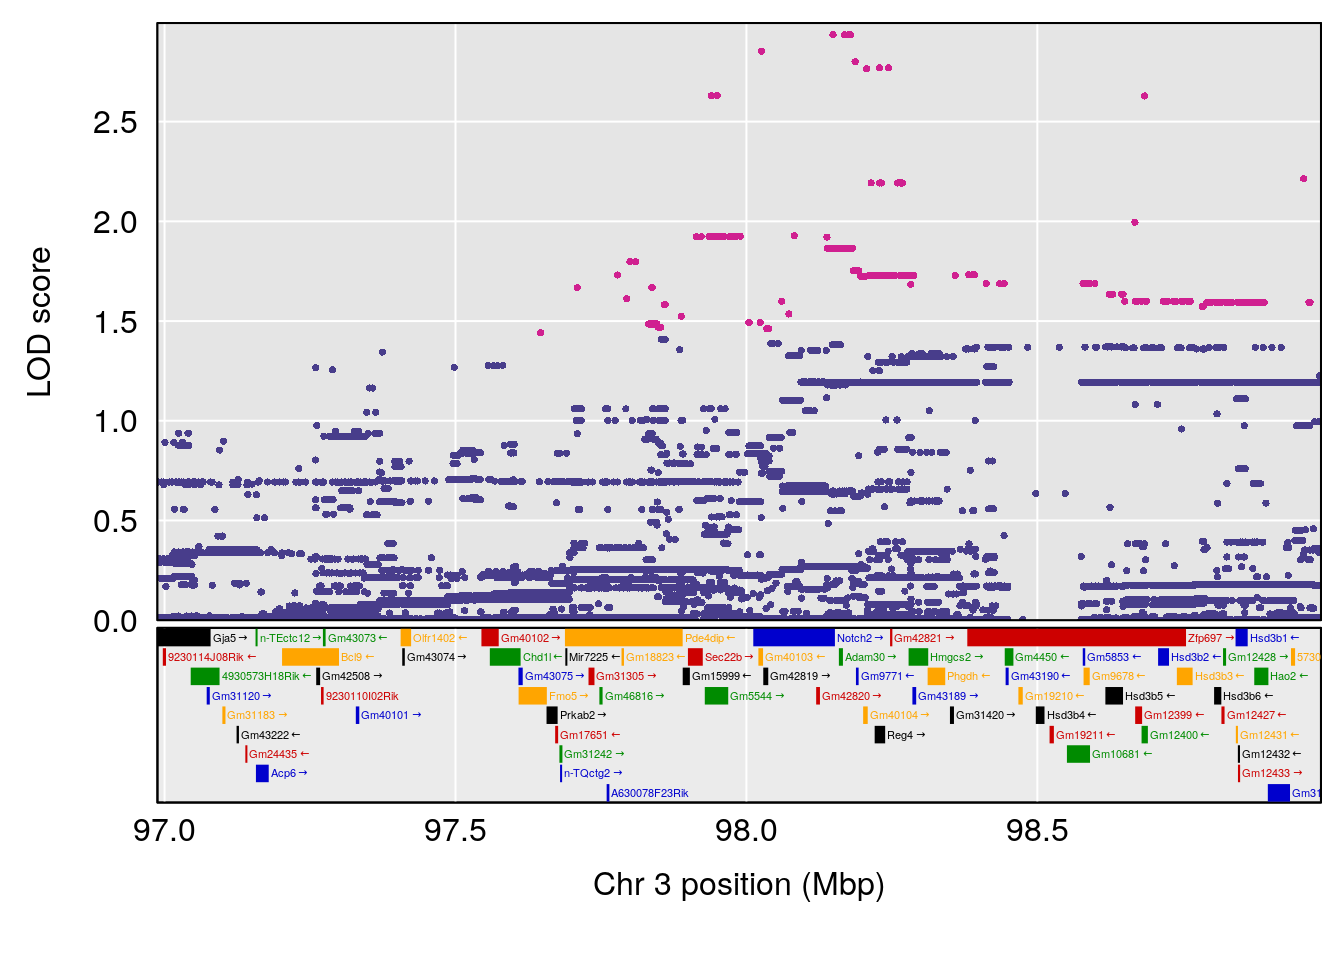
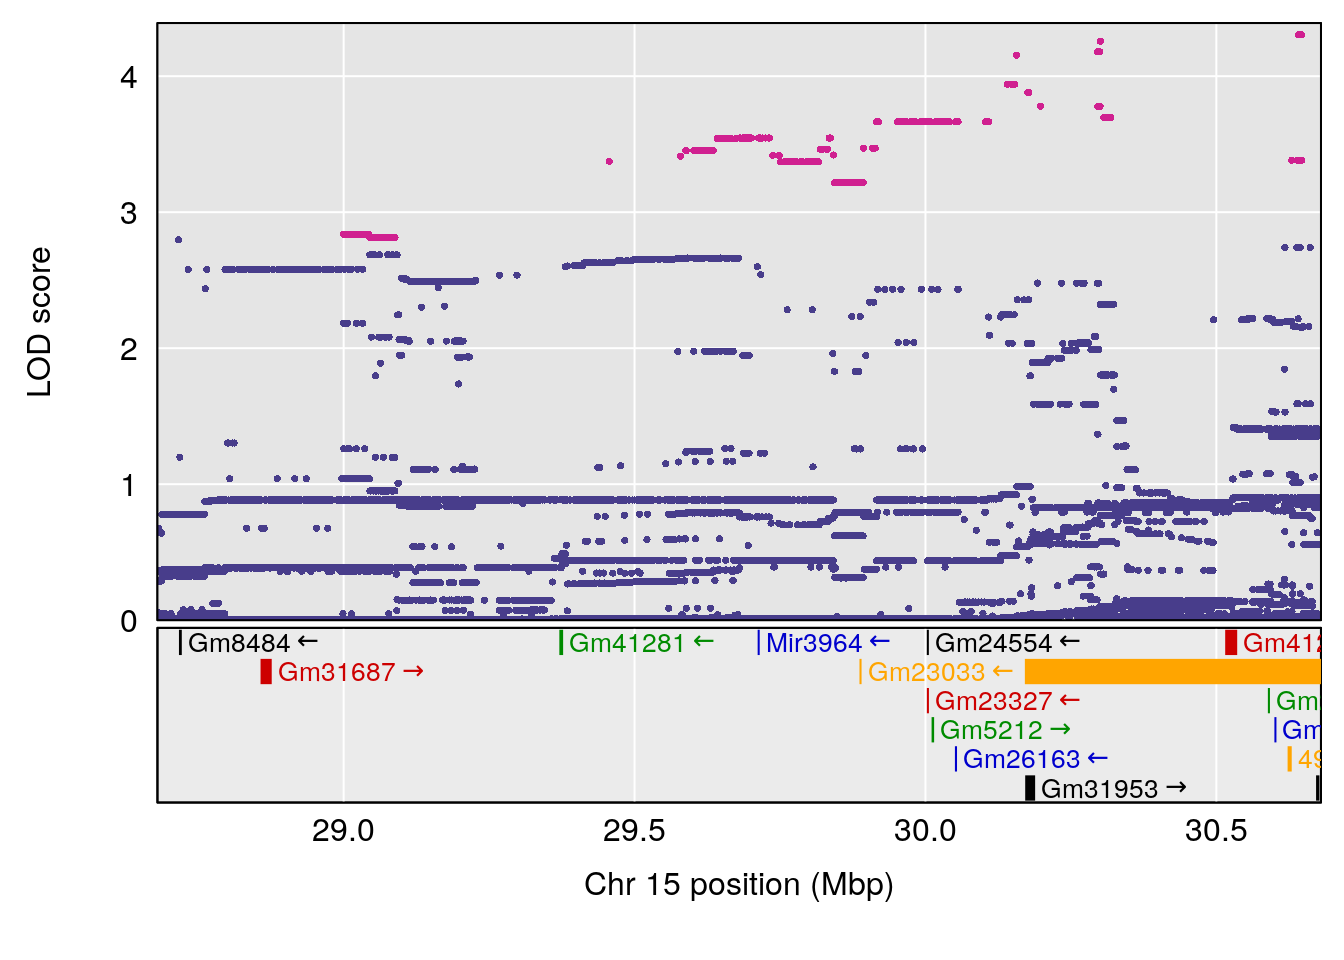
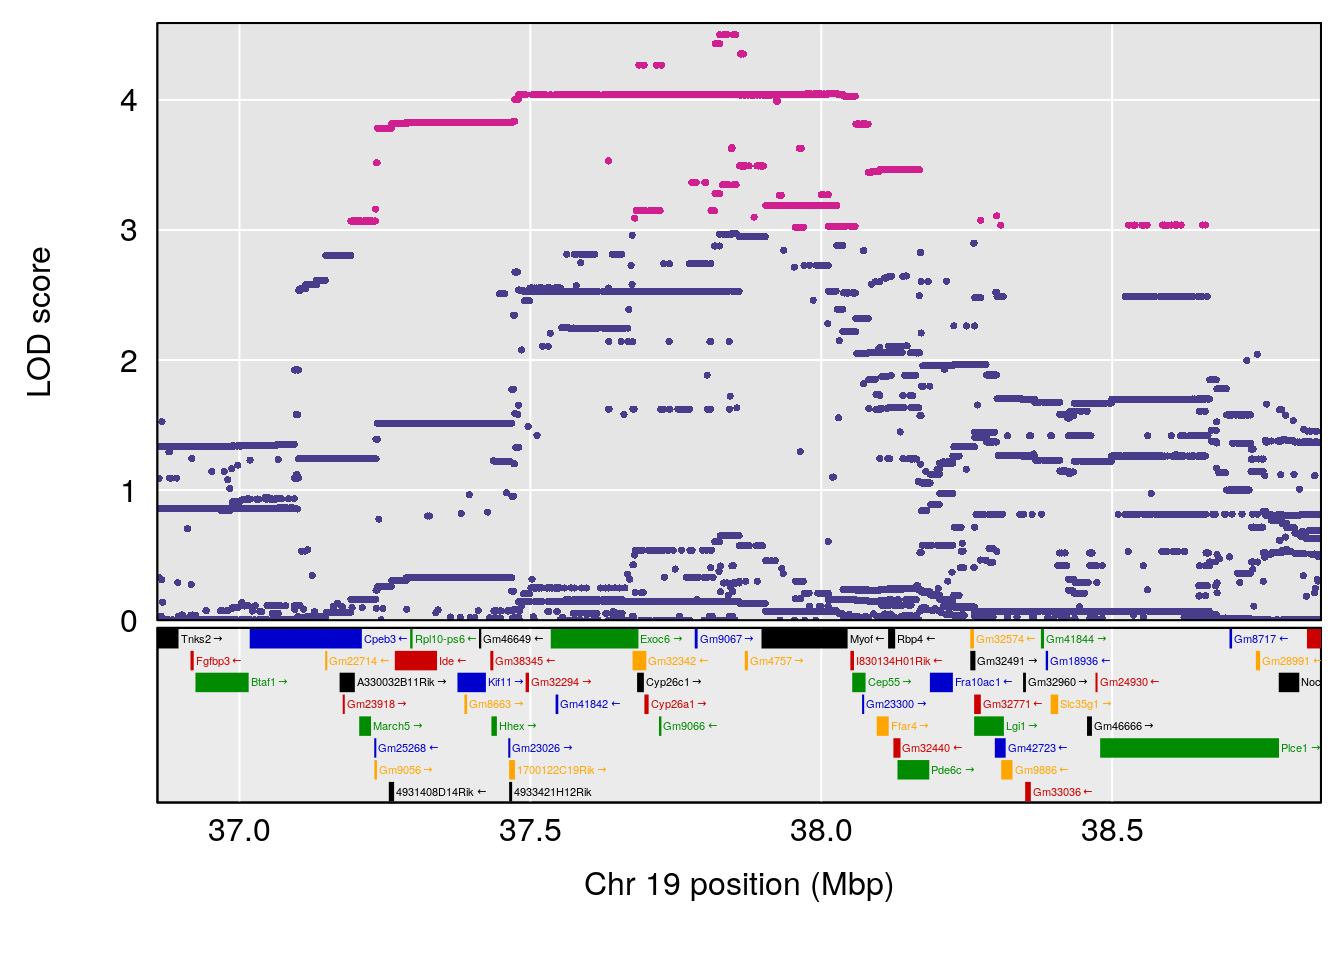
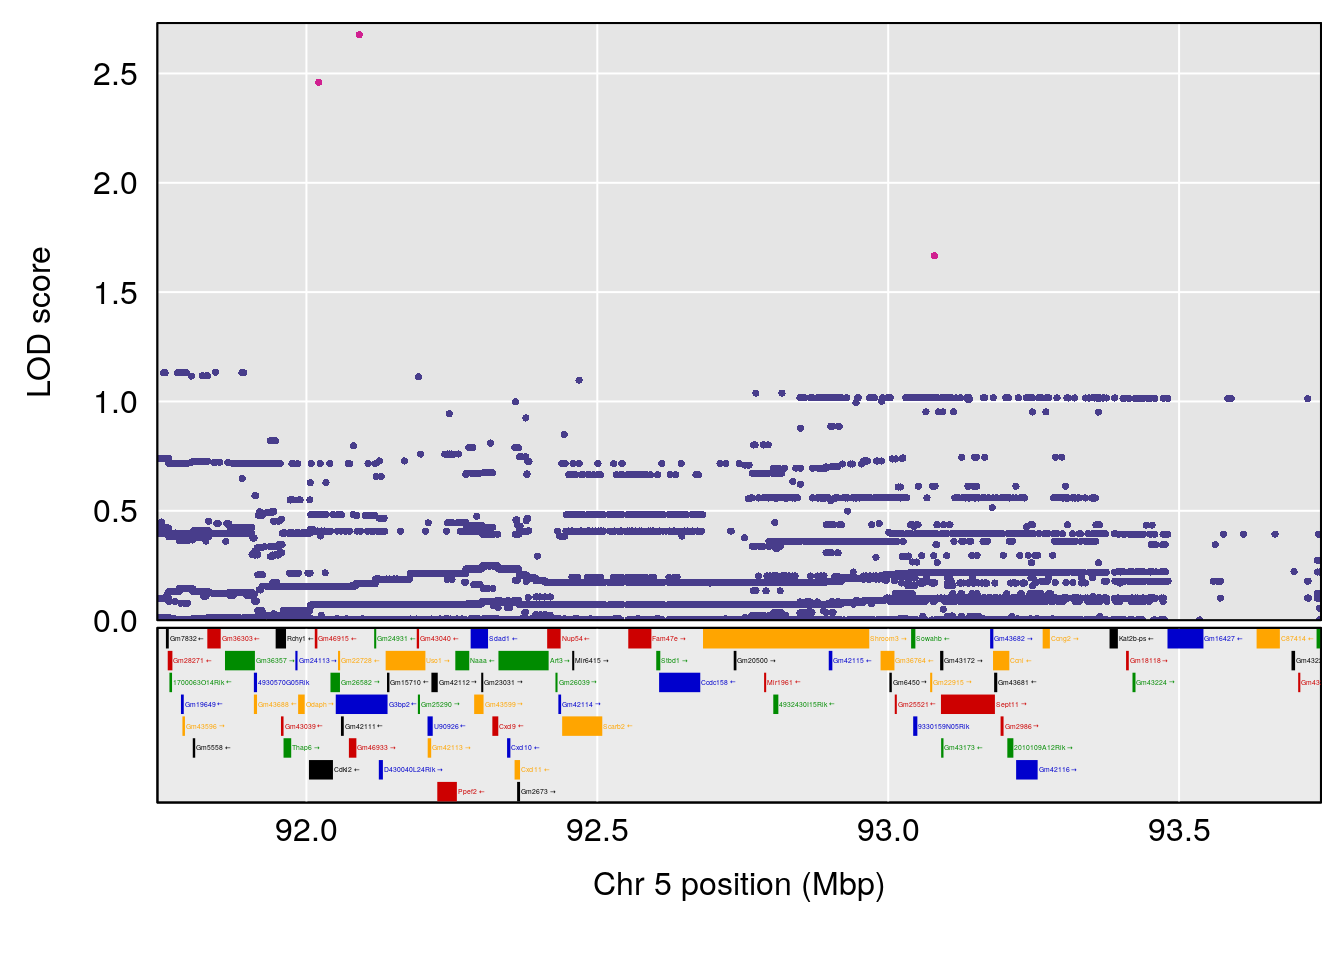
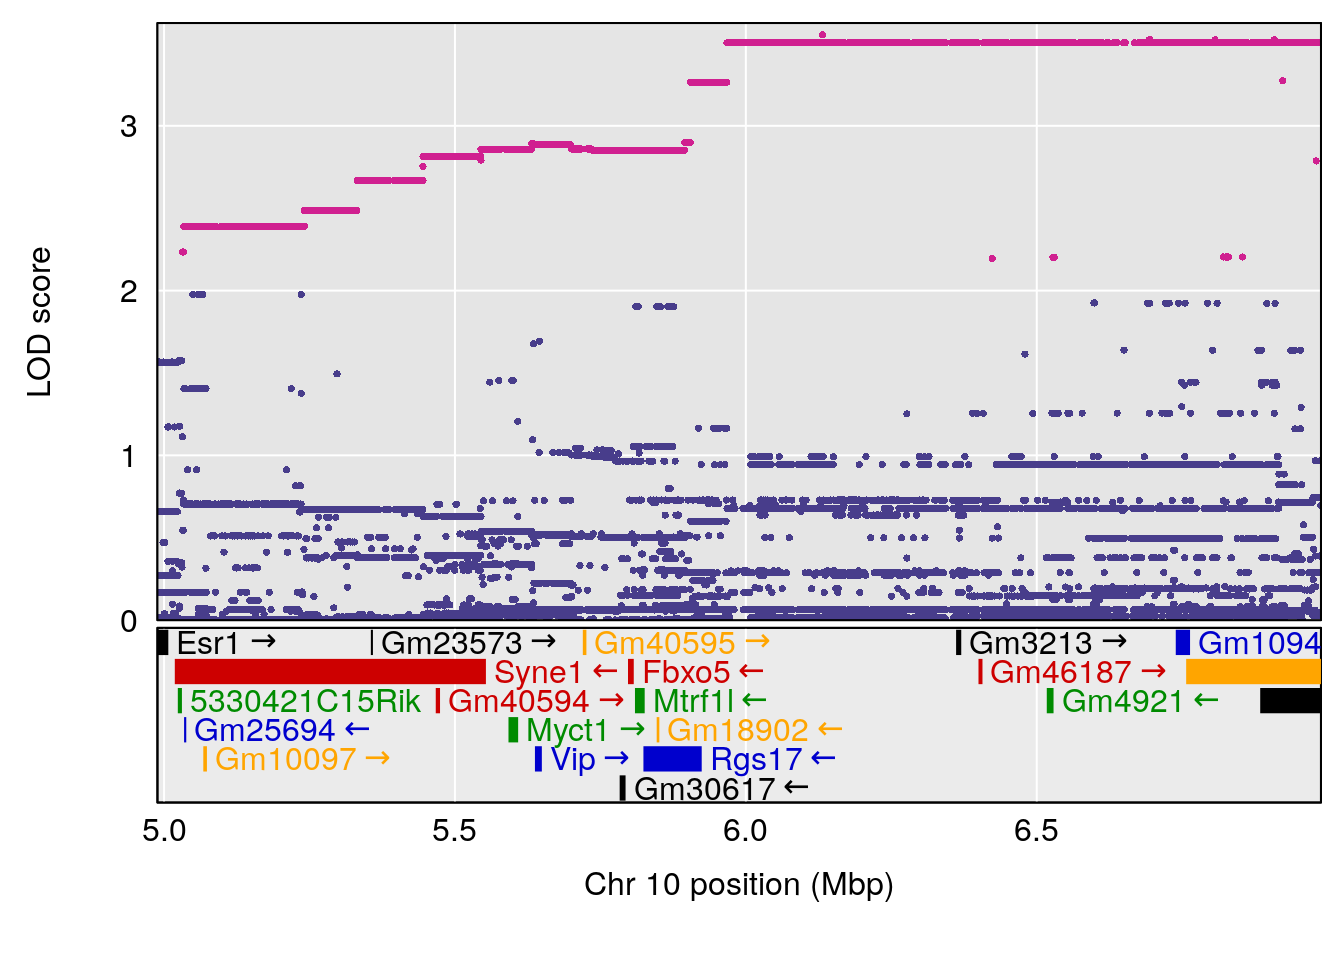
plot(out_snps[[i]][[p]]$lod, out_snps[[i]][[p]]$snpinfo, drop_hilit=1.5, genes=out_genes[[i]][[p]])
}
}
# [1] "Survival.Time"
# lodindex lodcolumn chr pos lod ci_lo ci_hi
# 1 1 pheno1 2 72.08345 6.672136 71.80655 72.11478
# 2 1 pheno1 3 98.06064 7.005262 97.69551 159.92550
# 3 1 pheno1 6 94.86810 8.427626 93.64635 95.01090
# [1] 1
# [1] 2
# [1] 3
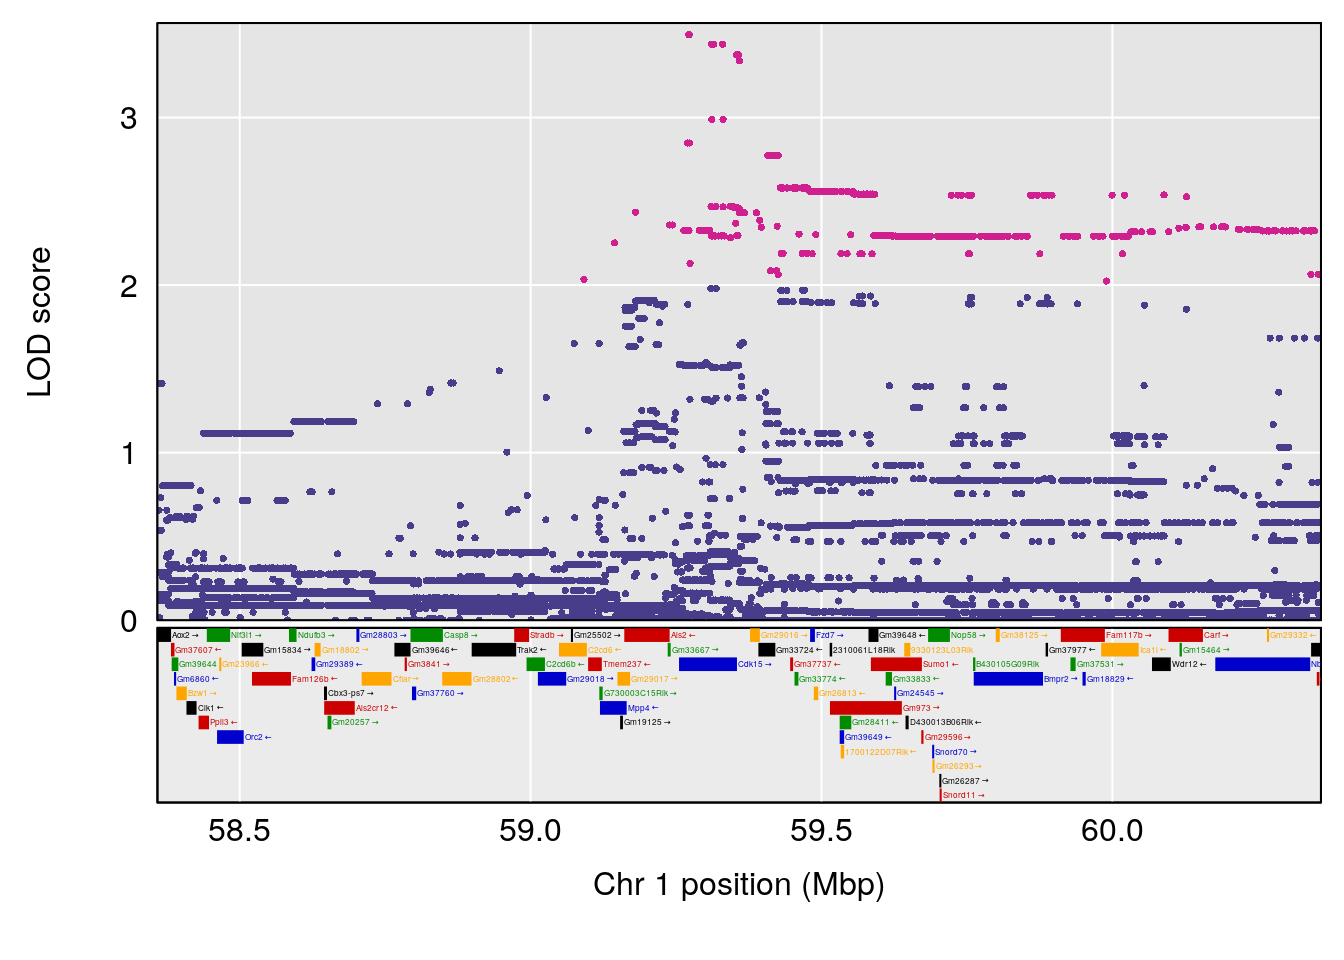
# [1] "Recovery.Time"
#   lodindex lodcolumn chr       pos      lod     ci_lo    ci_hi
# 1        1    pheno1   1  59.35852 6.107005  59.07336 194.5045
# 2        1    pheno1   4 156.04818 6.519153 114.73873 156.1199
# 3        1    pheno1   8 117.07865 6.973714 115.52733 117.7515
# [1] 1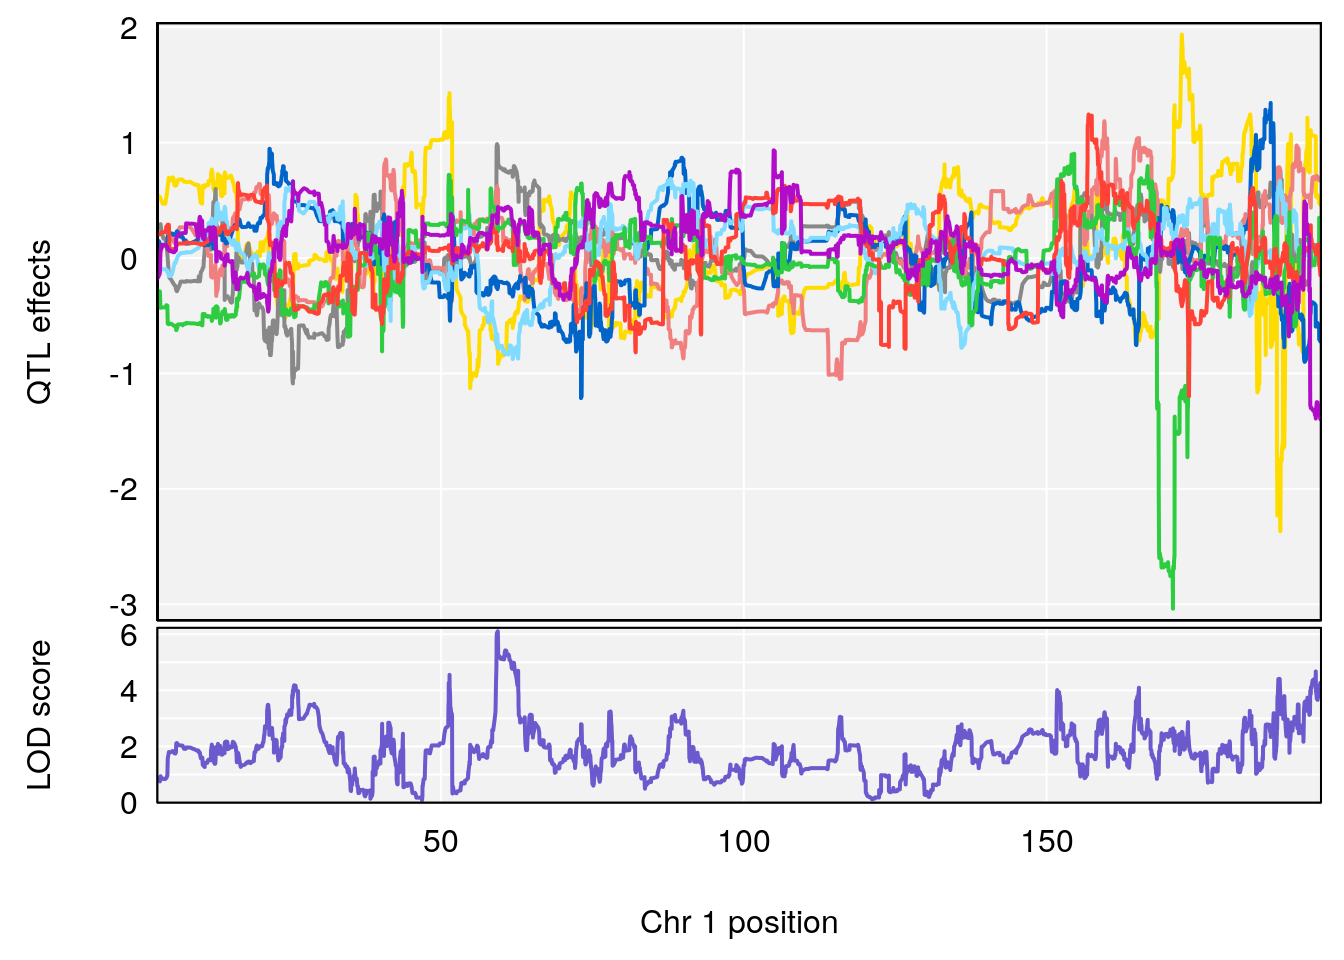

# [1] 2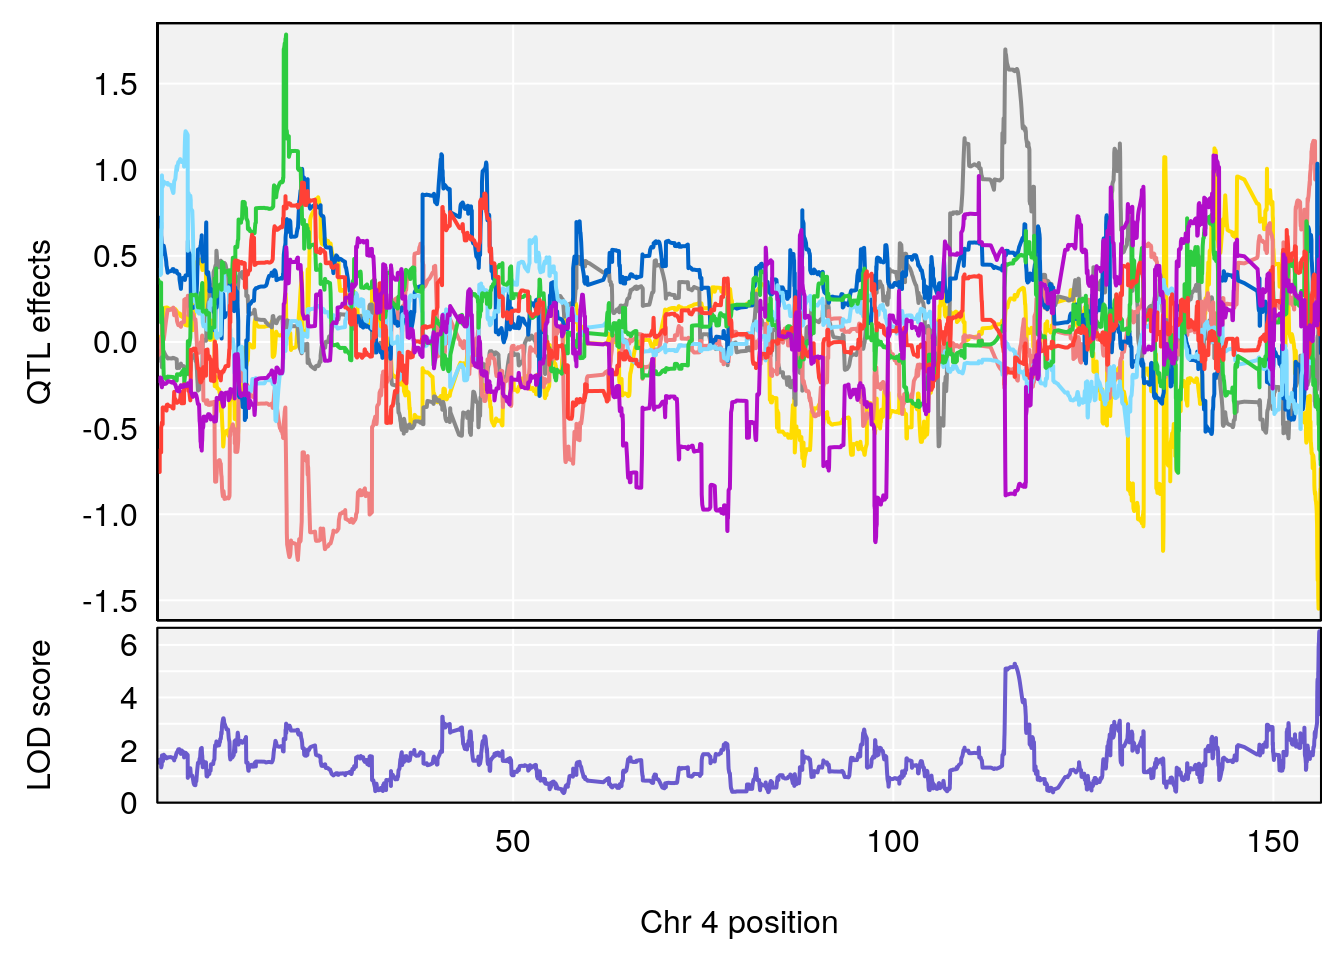
# [1] 3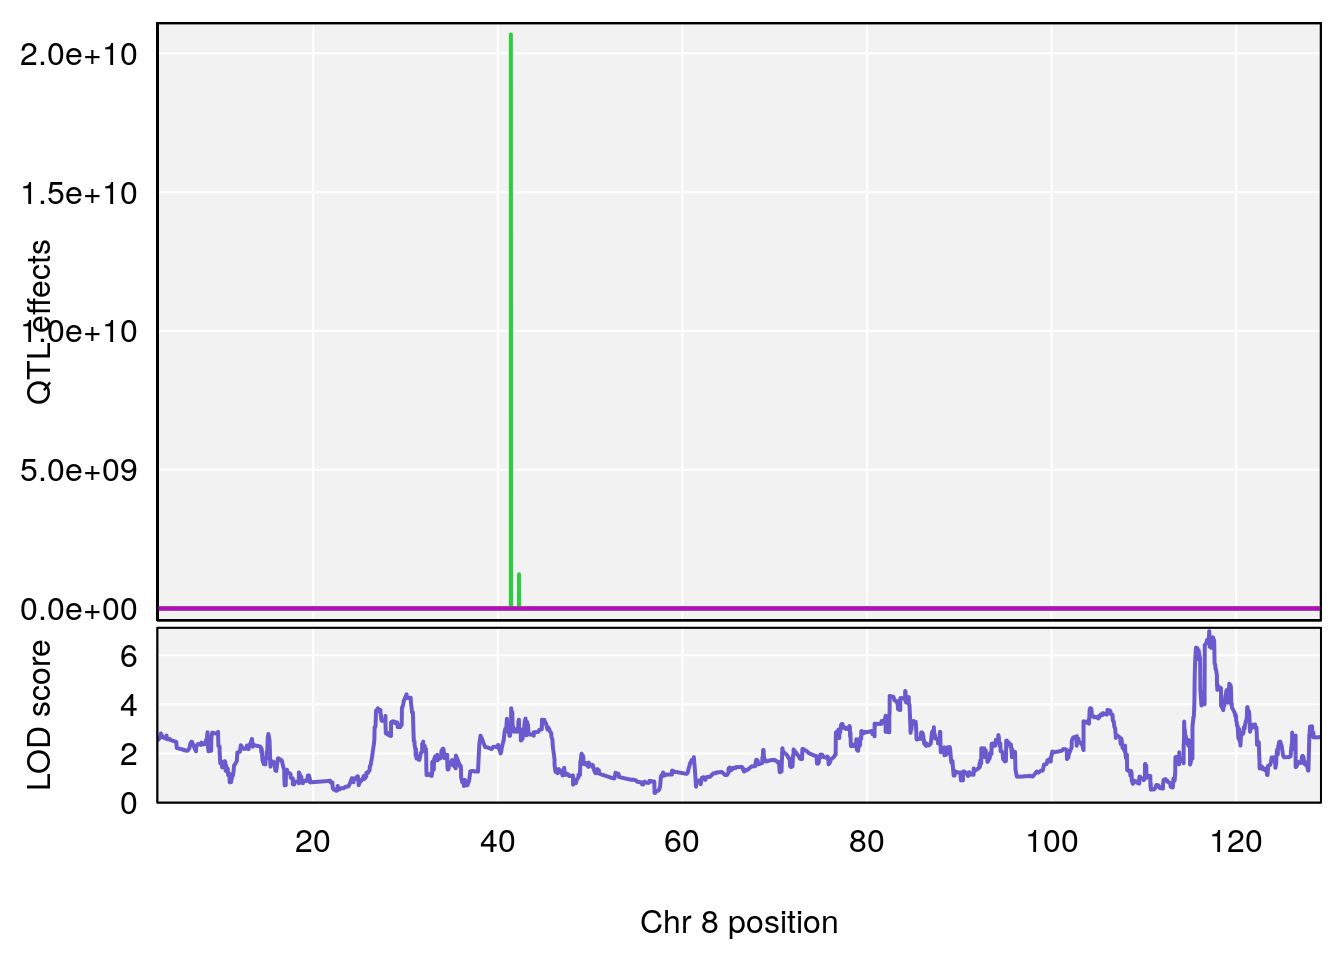
| Version | Author | Date |
|---|---|---|
| 9e4e3be | xhyuo | 2021-08-24 |
| Version | Author | Date |
|---|---|---|
| 9e4e3be | xhyuo | 2021-08-24 |
# [1] "Min.depression"
#   lodindex lodcolumn chr      pos      lod    ci_lo    ci_hi
# 1        1    pheno1   6 93.69909 6.677445 93.60388 94.87509
# [1] 1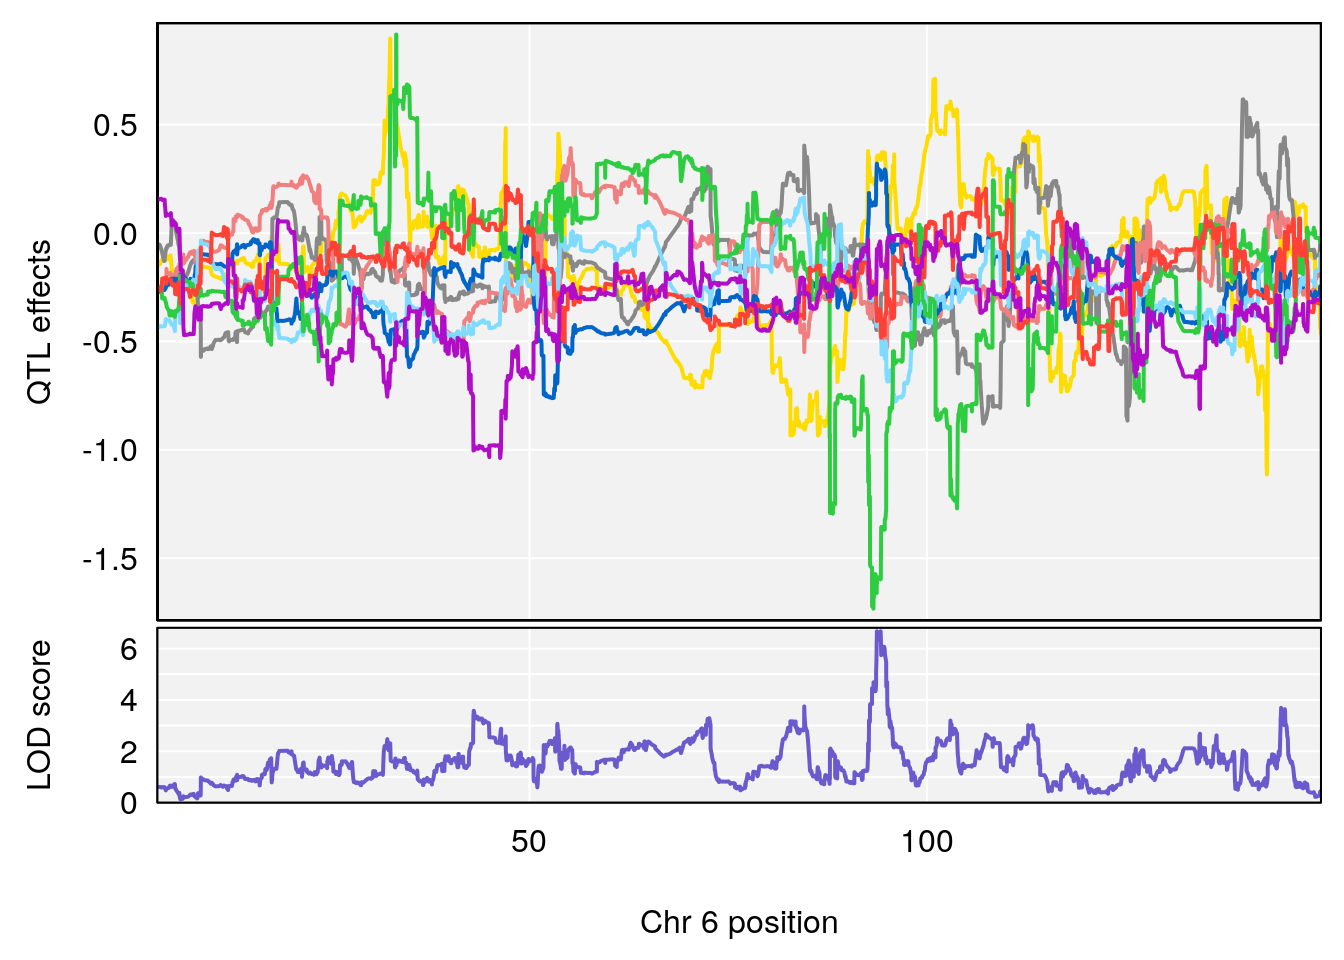
| Version | Author | Date |
|---|---|---|
| 9e4e3be | xhyuo | 2021-08-24 |

| Version | Author | Date |
|---|---|---|
| 9e4e3be | xhyuo | 2021-08-24 |
| Version | Author | Date |
|---|---|---|
| 9e4e3be | xhyuo | 2021-08-24 |
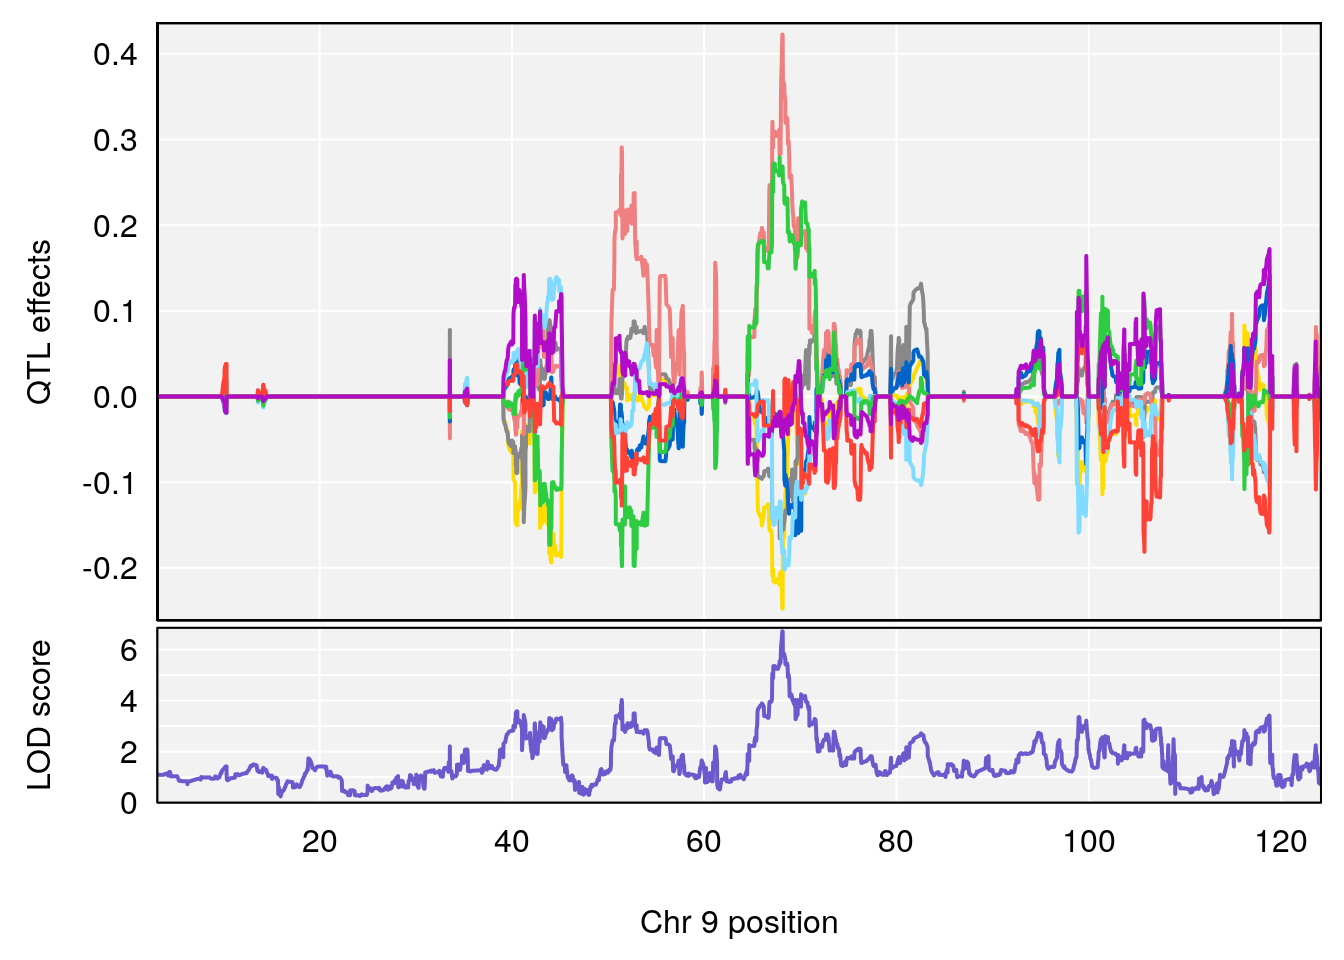
# [1] "Status_bin"
#   lodindex lodcolumn chr      pos      lod    ci_lo    ci_hi
# 1        1    pheno1   9 68.12998 6.087016 43.84234 123.7027
# [1] 1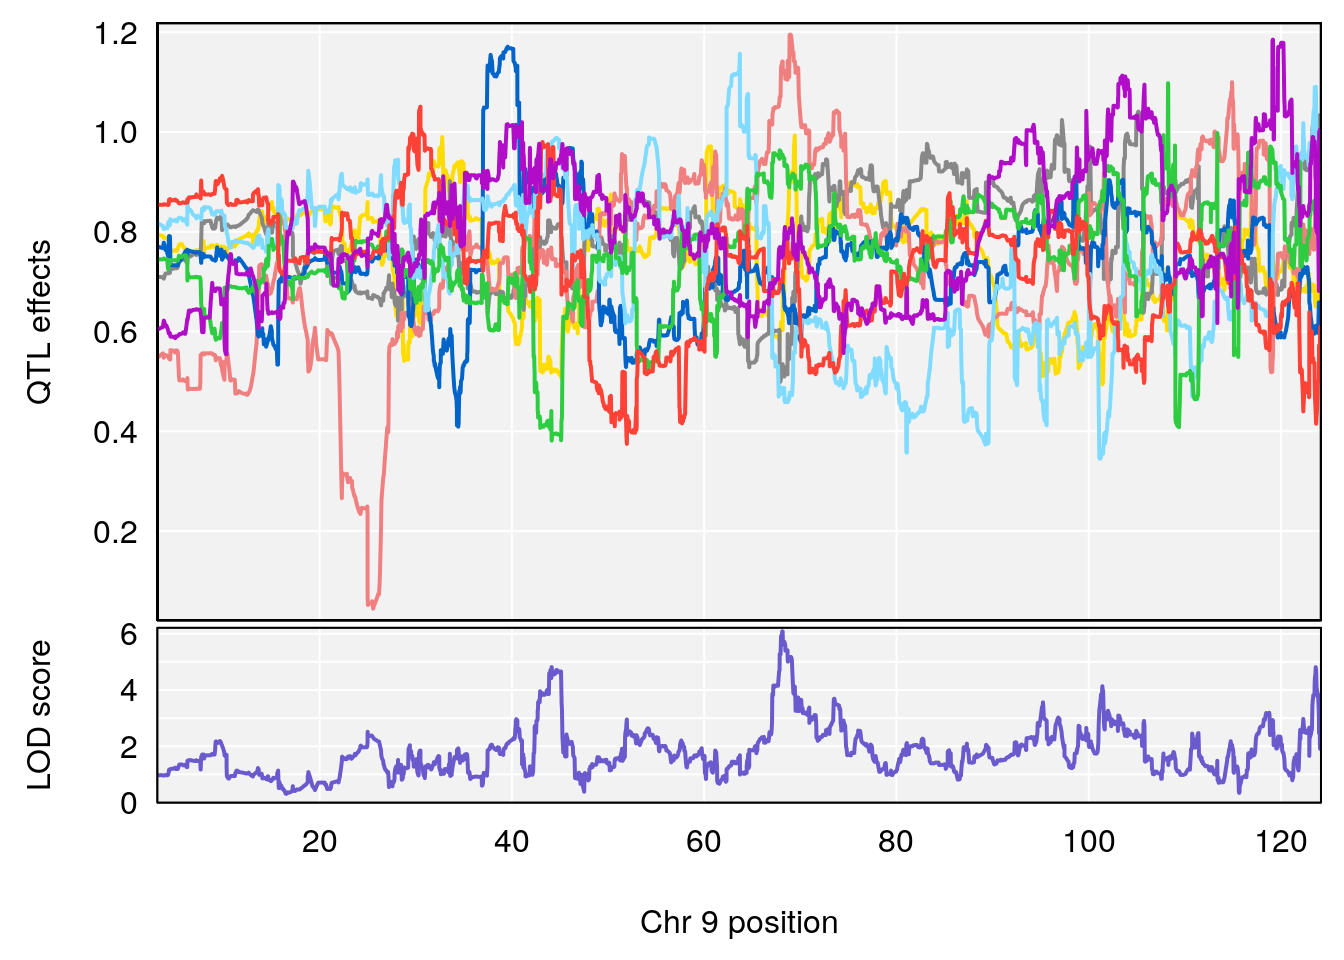
| Version | Author | Date |
|---|---|---|
| 9e4e3be | xhyuo | 2021-08-24 |
| Version | Author | Date |
|---|---|---|
| 9e4e3be | xhyuo | 2021-08-24 |
| Version | Author | Date |
|---|---|---|
| 9e4e3be | xhyuo | 2021-08-24 |
#save peaks coeff plot
for(i in names(qtl.morphine.out)){
print(i)
peaks <- find_peaks(qtl.morphine.out[[i]], map=pmap, threshold=6, drop=1.5)
fname <- paste("output/DO_morphine_secondbatch_",i,"_coefplot.pdf",sep="")
pdf(file = fname, width = 16, height =8)
for(p in 1:dim(peaks)[1]) {
print(p)
chr <-peaks[p,3]
#coeff plot
par(mar=c(4.1, 4.1, 0.6, 0.6))
plot_coefCC(coef_c1[[i]][[p]], pmap[chr], scan1_output=qtl.morphine.out[[i]], bgcolor="gray95", legend=NULL)
plot(out_snps[[i]][[p]]$lod, out_snps[[i]][[p]]$snpinfo, drop_hilit=1.5, genes=out_genes[[i]][[p]])
}
dev.off()
}
# [1] "Survival.Time"
# [1] 1
# [1] 2
# [1] 3
# [1] "Recovery.Time"
# [1] 1
# [1] 2
# [1] 3
# [1] "Min.depression"
# [1] 1
# [1] "Status_bin"
# [1] 1
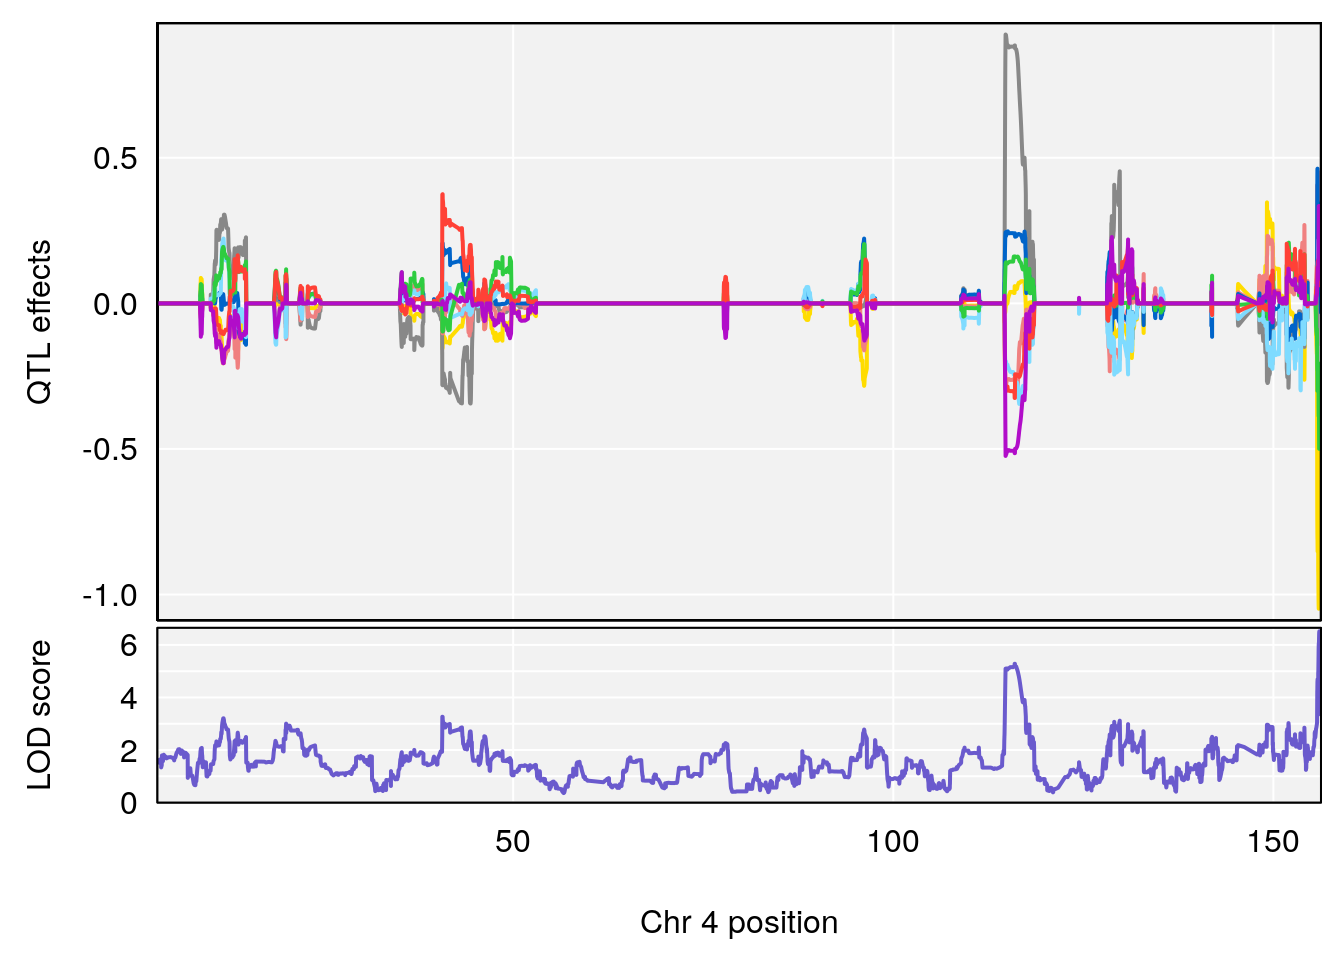
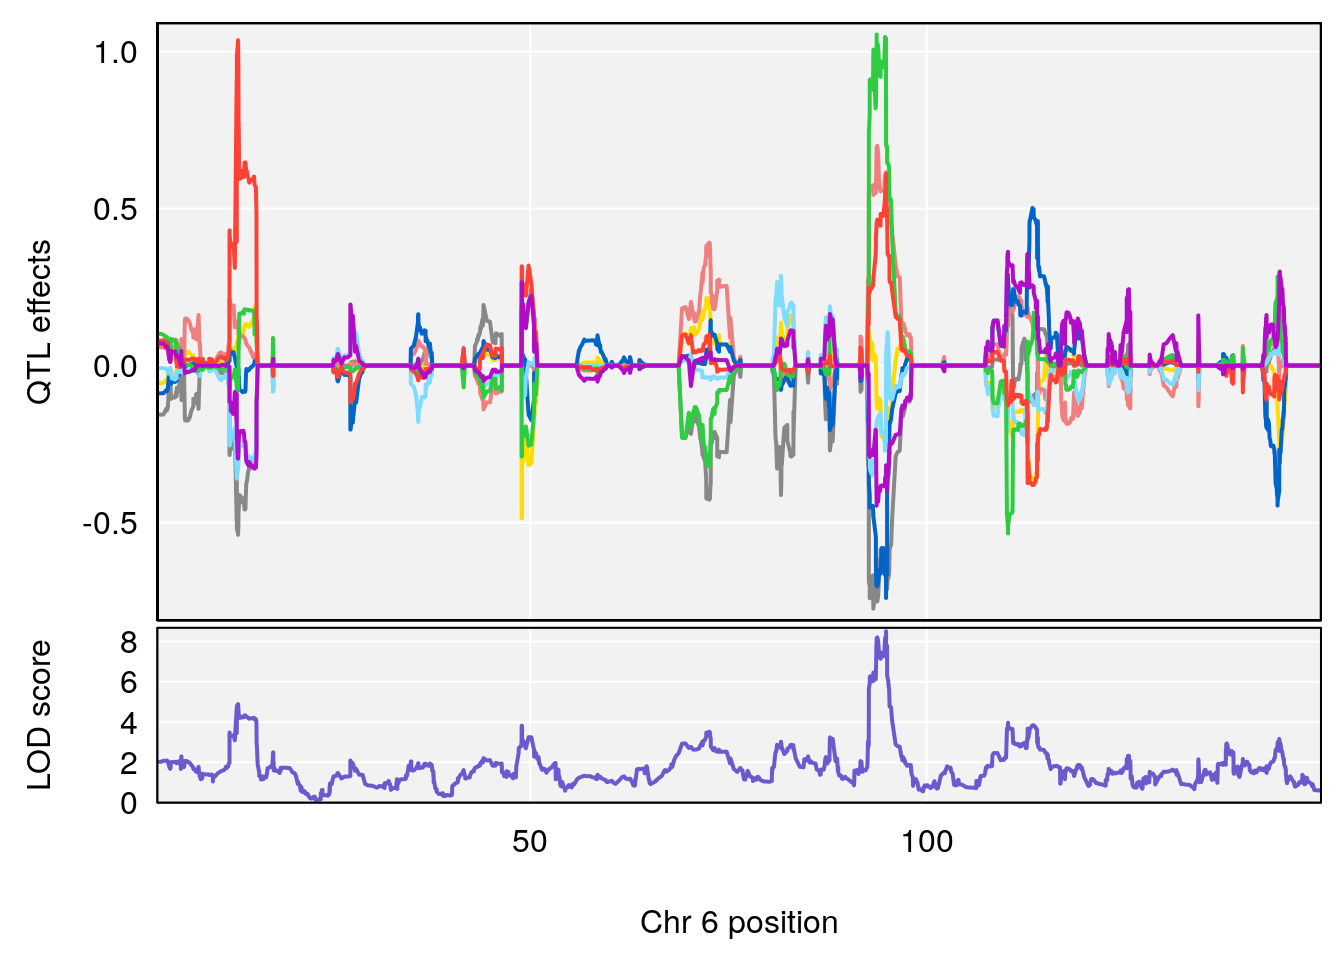
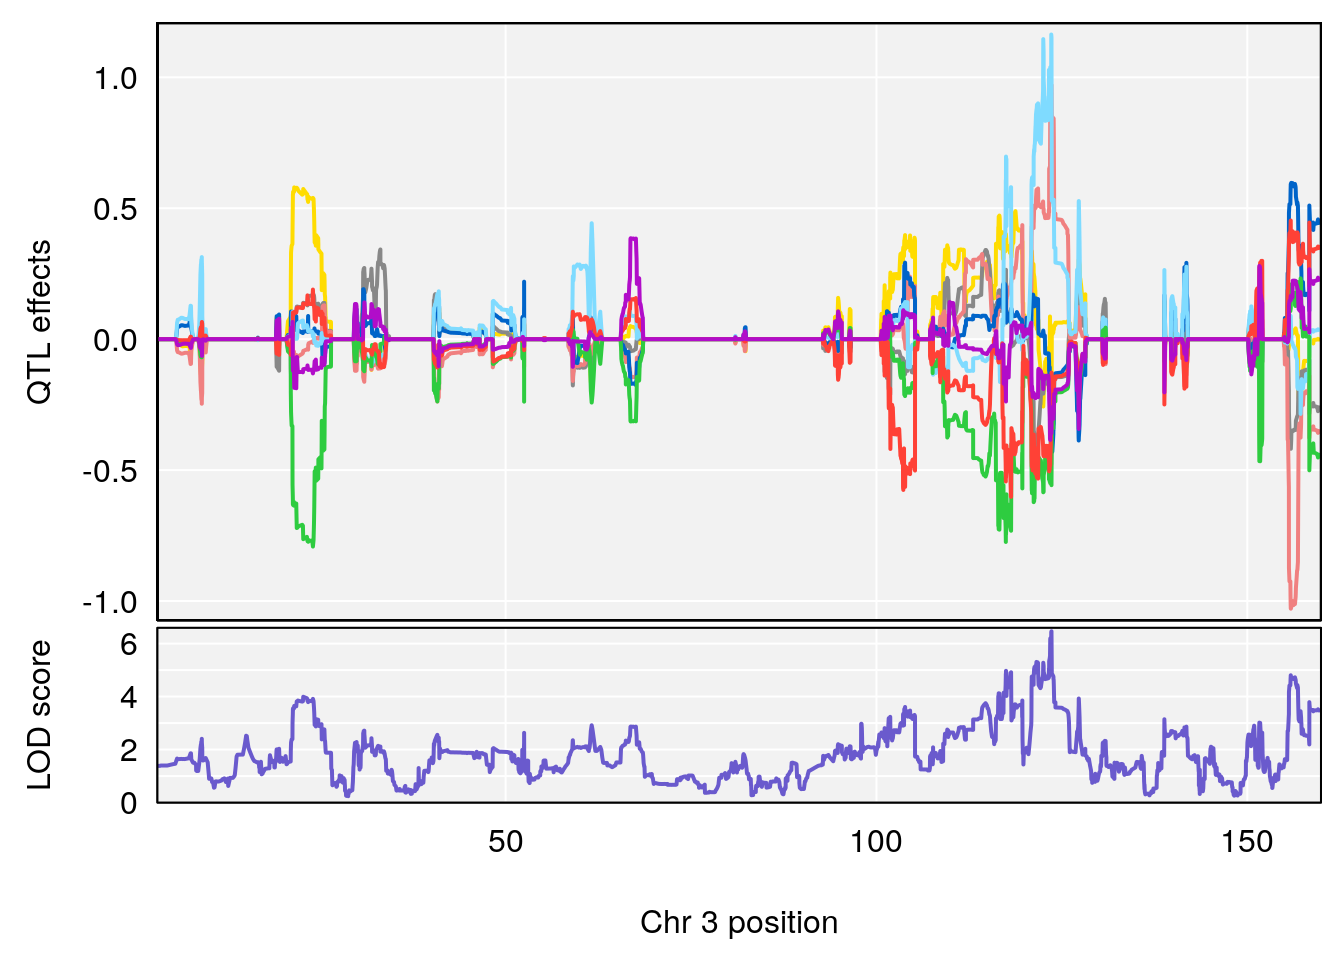
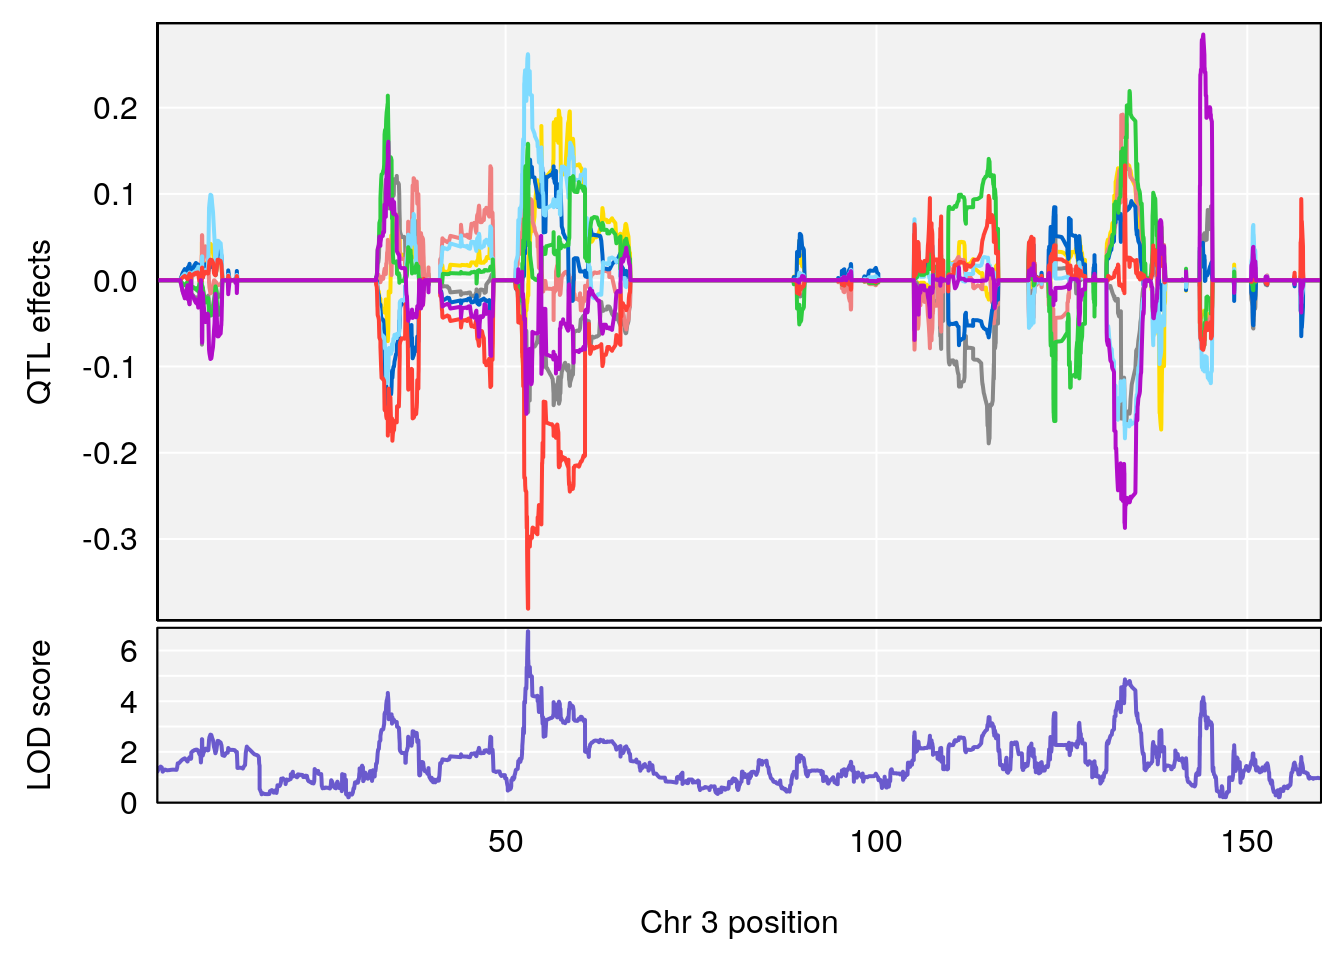
#save peaks coeff blup plot
for(i in names(qtl.morphine.out)){
print(i)
peaks <- find_peaks(qtl.morphine.out[[i]], map=pmap, threshold=6, drop=1.5)
fname <- paste("output/DO_morphine_secondbatch_",i,"_coefplot_blup.pdf",sep="")
pdf(file = fname, width = 16, height =8)
for(p in 1:dim(peaks)[1]) {
print(p)
chr <-peaks[p,3]
#coeff plot
par(mar=c(4.1, 4.1, 0.6, 0.6))
plot_coefCC(coef_c2[[i]][[p]], pmap[chr], scan1_output=qtl.morphine.out[[i]], bgcolor="gray95", legend=NULL)
plot(out_snps[[i]][[p]]$lod, out_snps[[i]][[p]]$snpinfo, drop_hilit=1.5, genes=out_genes[[i]][[p]])
}
dev.off()
}
# [1] "Survival.Time"
# [1] 1
# [1] 2
# [1] 3
# [1] "Recovery.Time"
# [1] 1
# [1] 2
# [1] 3
# [1] "Min.depression"
# [1] 1
# [1] "Status_bin"
# [1] 1Plot qtl mapping on 69K
Plot by using its output qtl.morphine.69k.out.second_set.RData
load("output/qtl.morphine.69k.out.second_set.RData")
#pmap and gmap
load("data/69k_grid_pgmap.RData")

#genome-wide plot
for(i in names(qtl.morphine.out)){
  par(mar=c(5.1, 4.1, 1.1, 1.1))
  ymx <- maxlod(qtl.morphine.out[[i]]) # overall maximum LOD score
  plot(qtl.morphine.out[[i]], map=pmap, lodcolumn=1, col="slateblue", ylim=c(0, 10))
  abline(h=summary(qtl.morphine.operm[[i]], alpha=c(0.10, 0.05, 0.01))[[1]], col="red")
  abline(h=summary(qtl.morphine.operm[[i]], alpha=c(0.10, 0.05, 0.01))[[2]], col="red")
  abline(h=summary(qtl.morphine.operm[[i]], alpha=c(0.10, 0.05, 0.01))[[3]], col="red")
  title(main = paste0("DO_morphine_",i))
}
#save genome-wide plot
for(i in names(qtl.morphine.out)){
png(file = paste0("output/DO_morphine_secondbatch_69k_", i, ".png"), width = 16, height =8, res=300, units = "in")
par(mar=c(5.1, 4.1, 1.1, 1.1))
ymx <- maxlod(qtl.morphine.out[[i]]) # overall maximum LOD score
plot(qtl.morphine.out[[i]], map=pmap, lodcolumn=1, col="slateblue", ylim=c(0, 10))
abline(h=summary(qtl.morphine.operm[[i]], alpha=c(0.10, 0.05, 0.01))[[1]], col="red")
abline(h=summary(qtl.morphine.operm[[i]], alpha=c(0.10, 0.05, 0.01))[[2]], col="red")
abline(h=summary(qtl.morphine.operm[[i]], alpha=c(0.10, 0.05, 0.01))[[3]], col="red")
title(main = paste0("DO_morphine_",i))
dev.off()
}
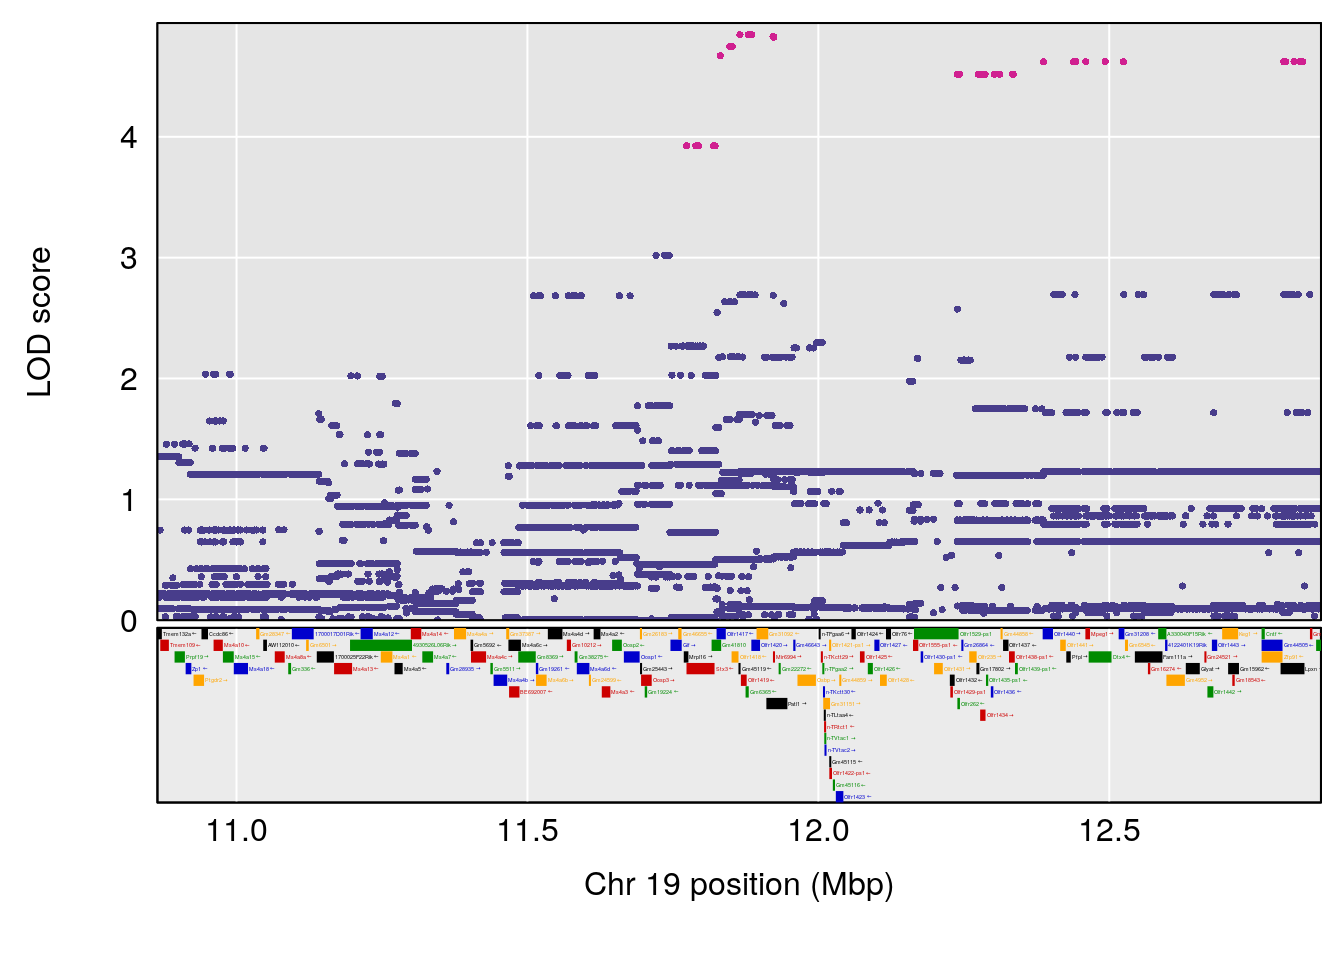
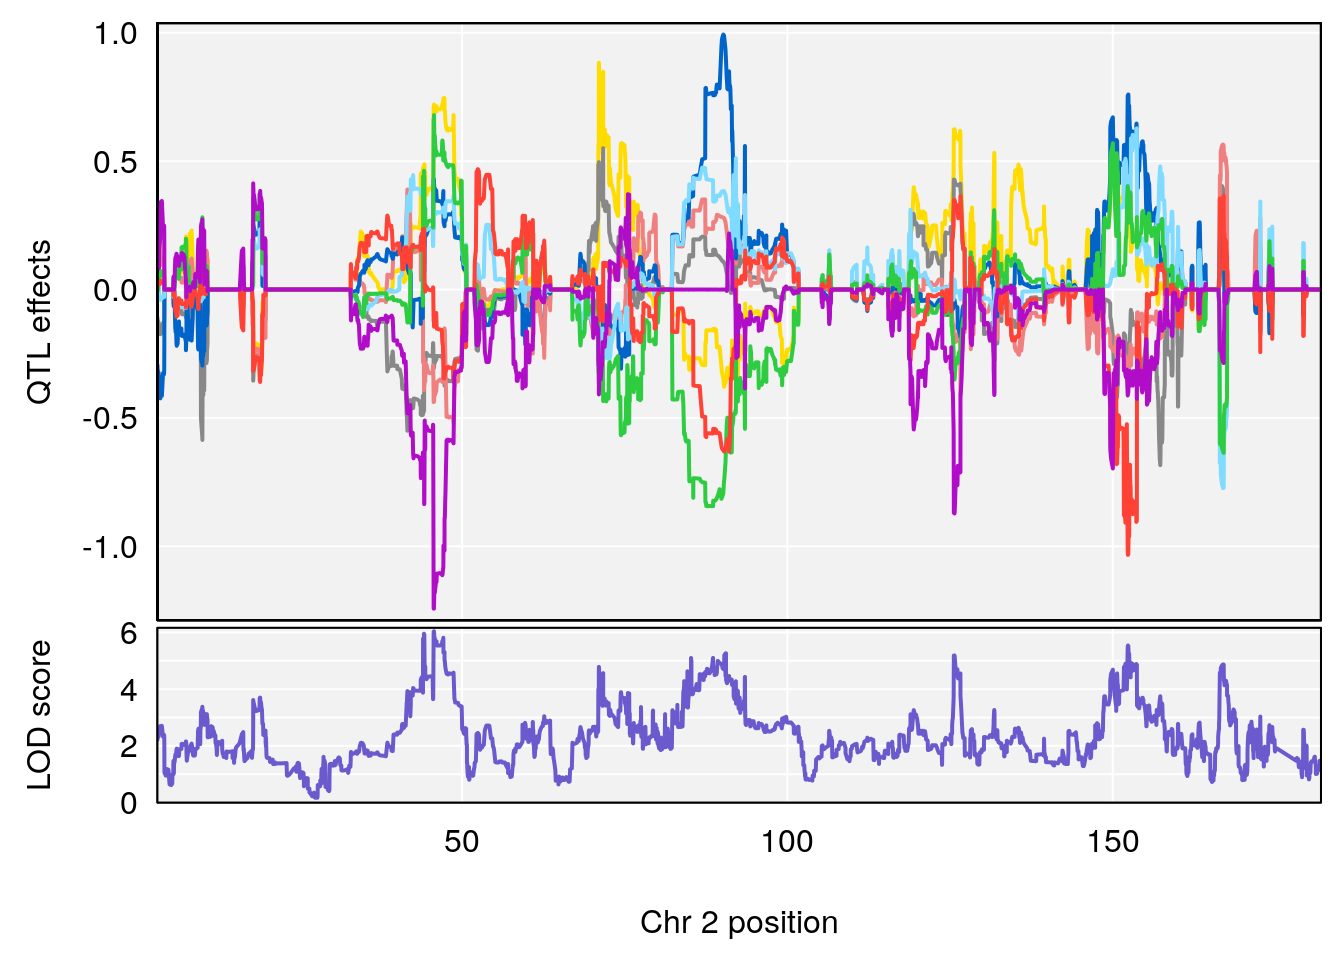
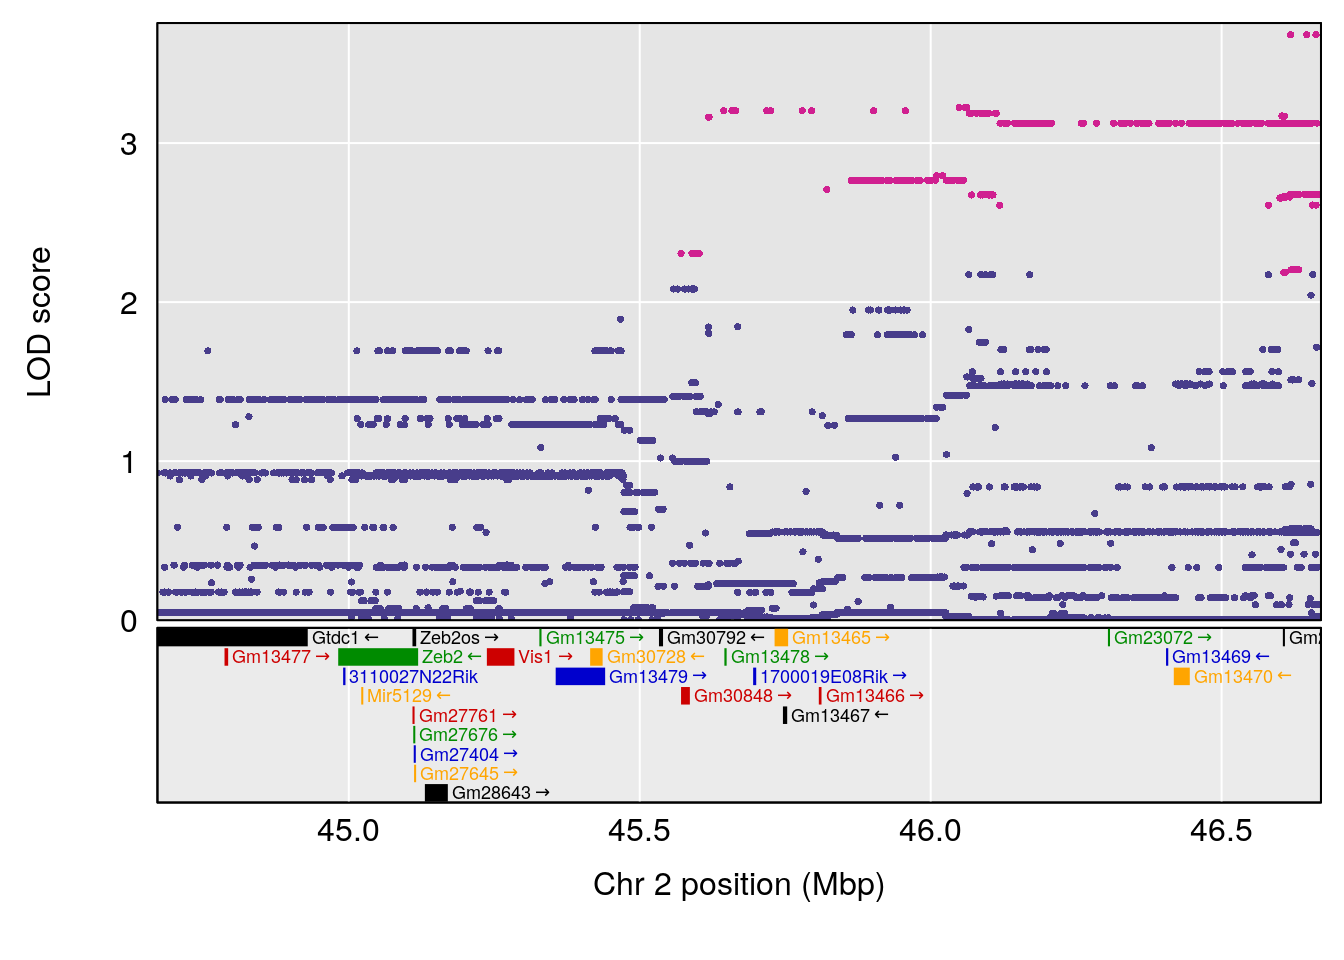
#peaks coeff plot
for(i in names(qtl.morphine.out)){
print(i)
peaks <- find_peaks(qtl.morphine.out[[i]], map=pmap, threshold=6, drop=1.5)
print(peaks)
for(p in 1:dim(peaks)[1]) {
print(p)
chr <-peaks[p,3]
#coeff plot
par(mar=c(4.1, 4.1, 0.6, 0.6))
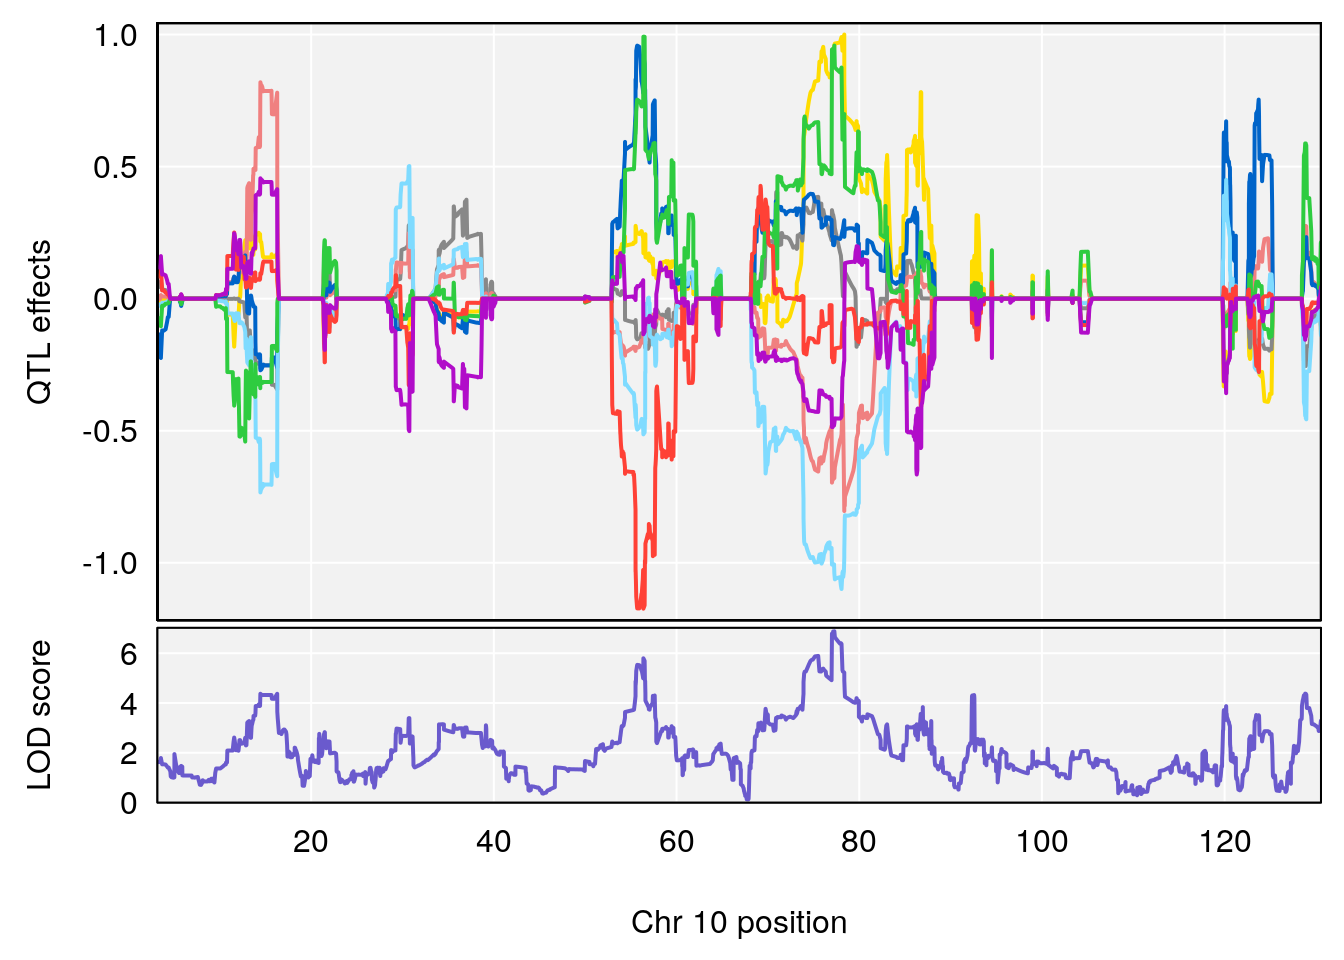
plot_coefCC(coef_c1[[i]][[p]], pmap[chr], scan1_output=qtl.morphine.out[[i]], bgcolor="gray95", legend=NULL)
plot_coefCC(coef_c2[[i]][[p]], pmap[chr], scan1_output=qtl.morphine.out[[i]], bgcolor="gray95", legend=NULL)
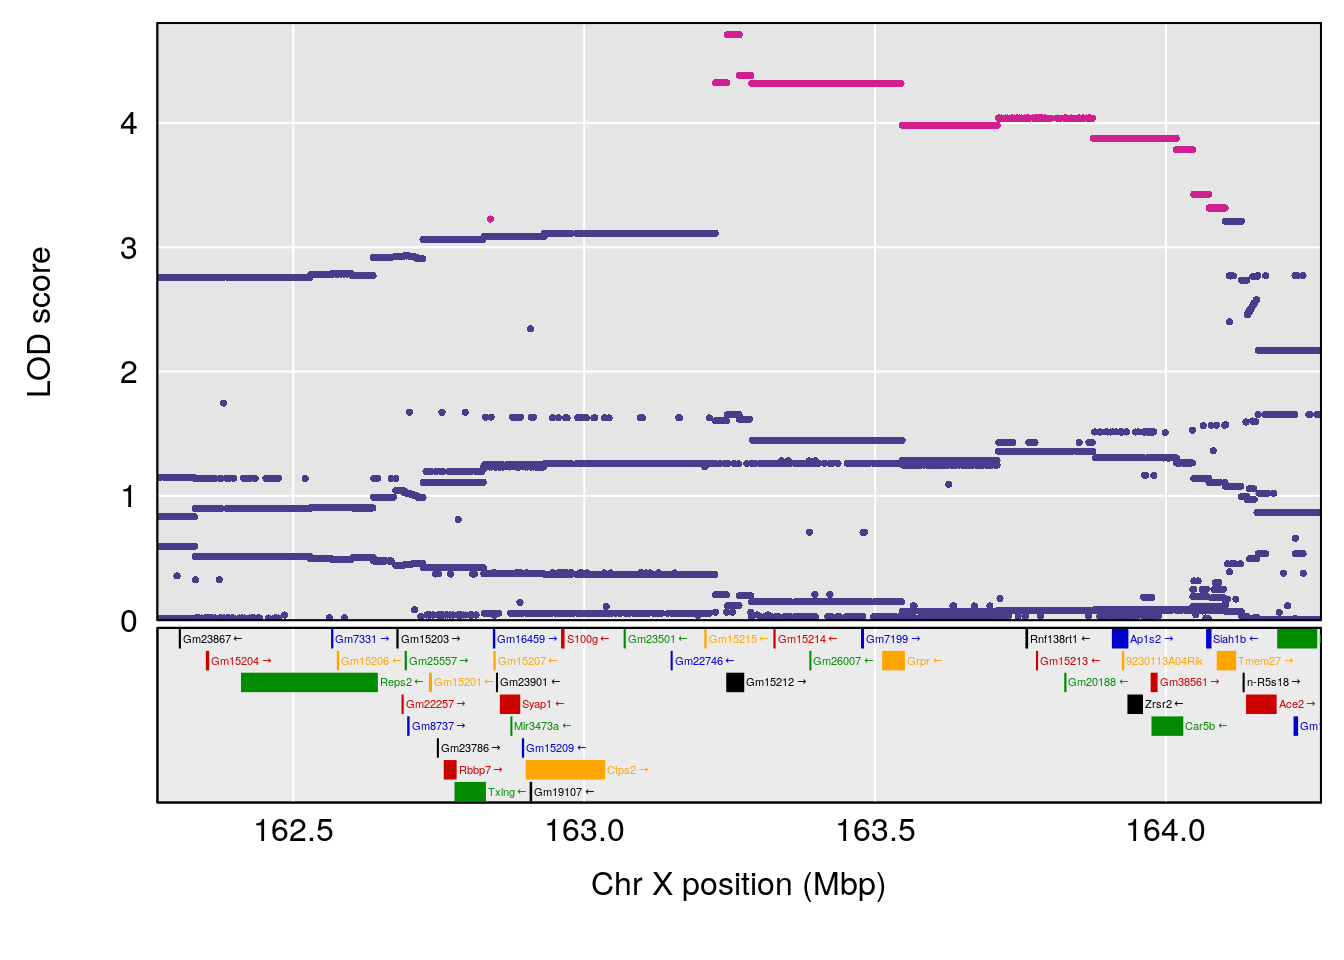
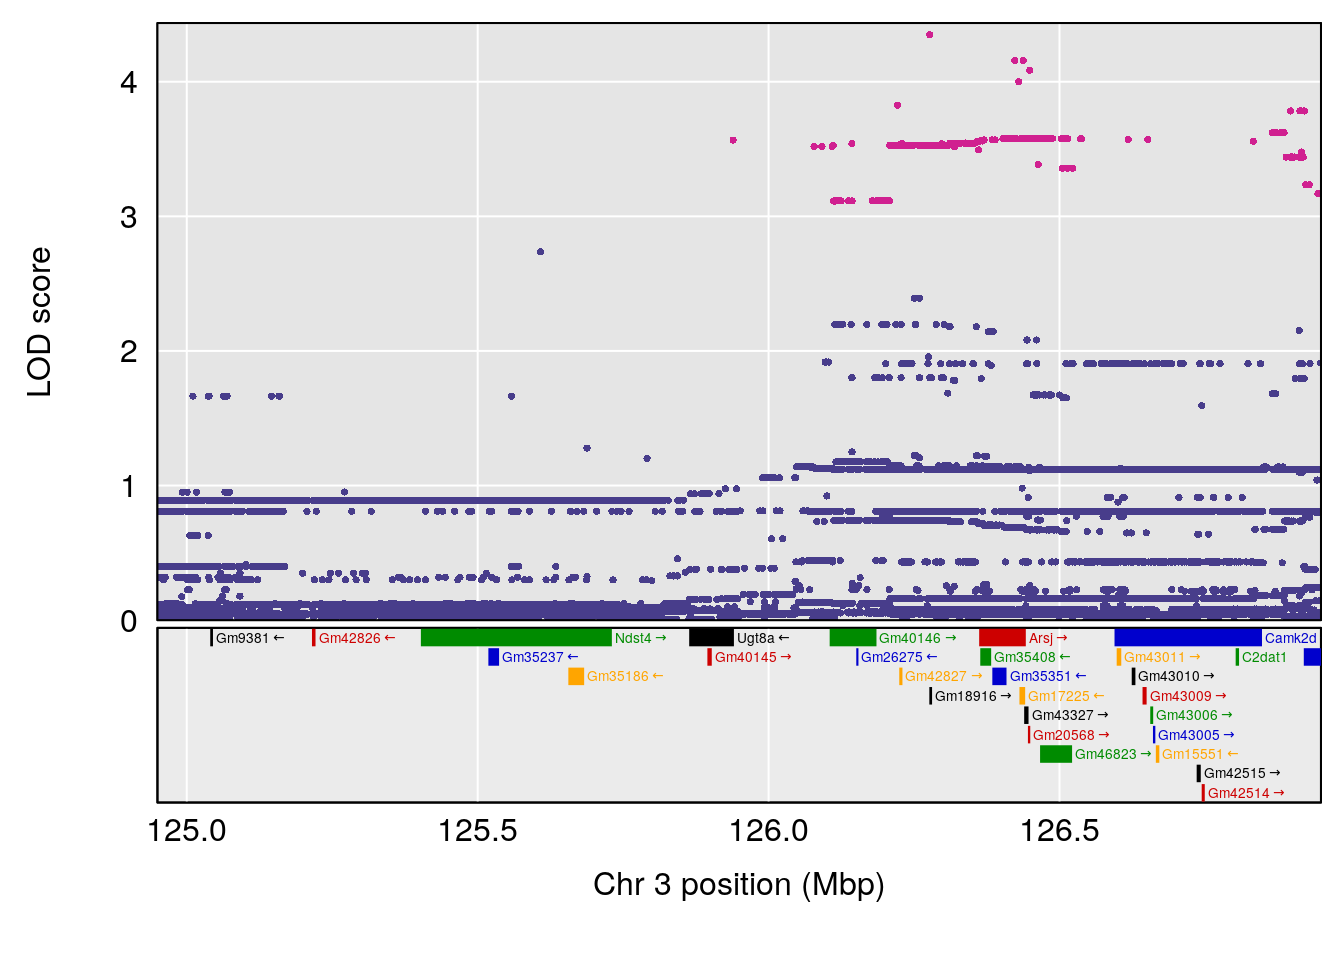
plot(out_snps[[i]][[p]]$lod, out_snps[[i]][[p]]$snpinfo, drop_hilit=1.5, genes=out_genes[[i]][[p]])
}
}
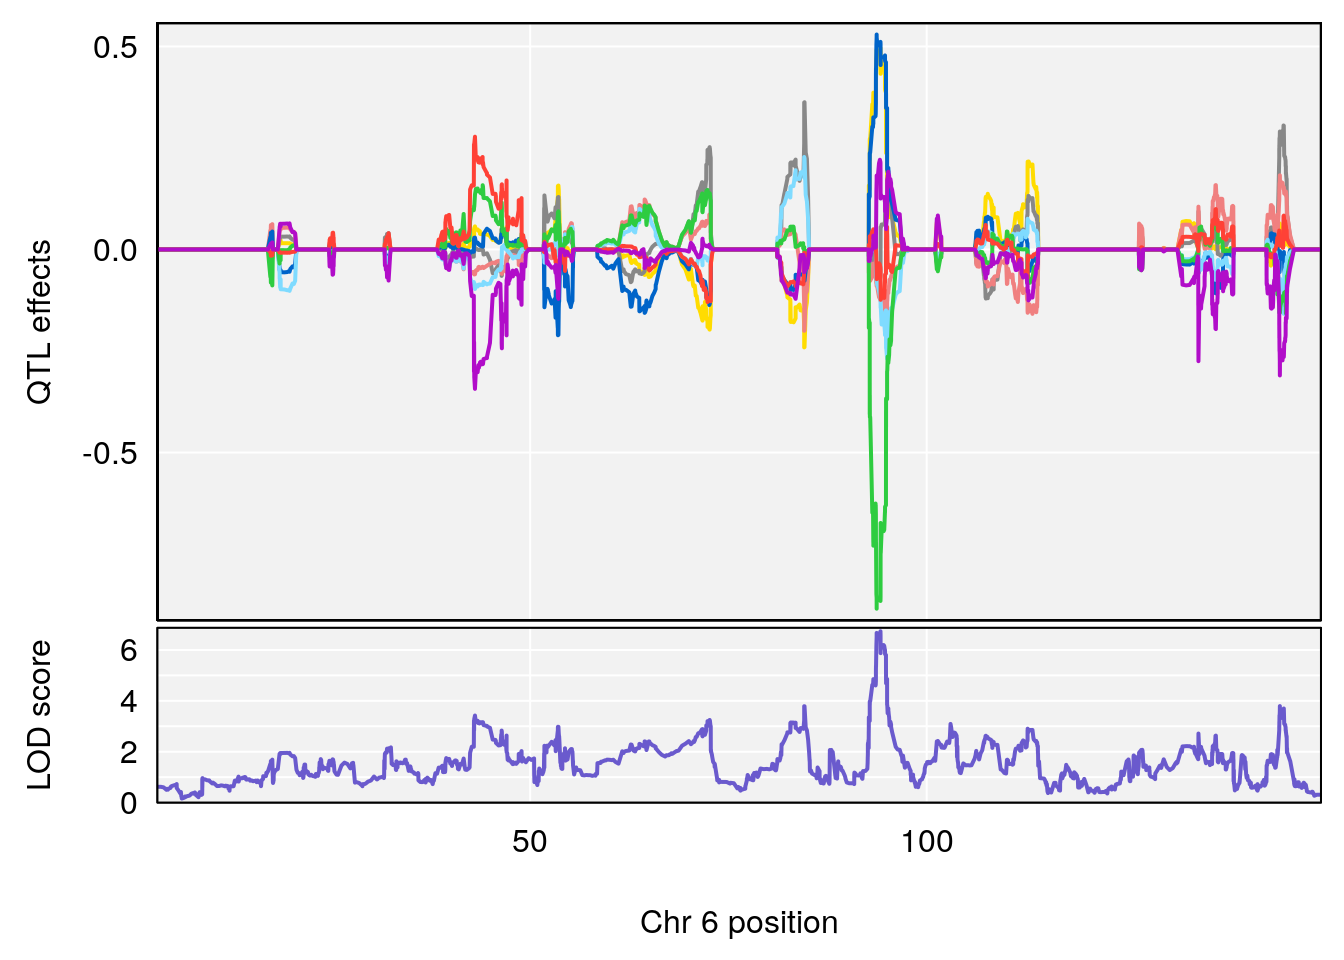
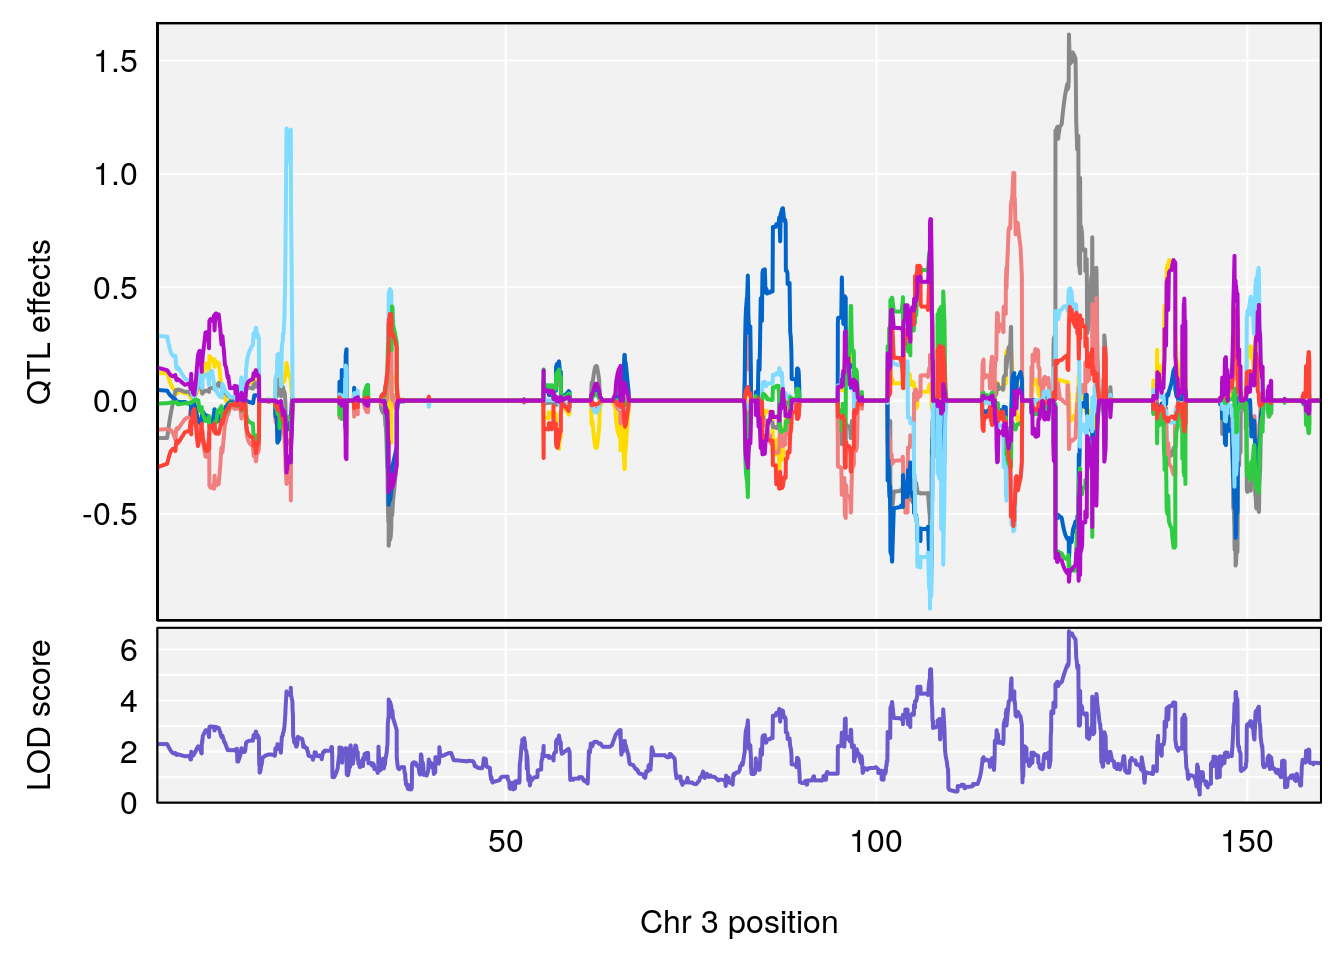
# [1] "Survival.Time"
# lodindex lodcolumn chr pos lod ci_lo ci_hi
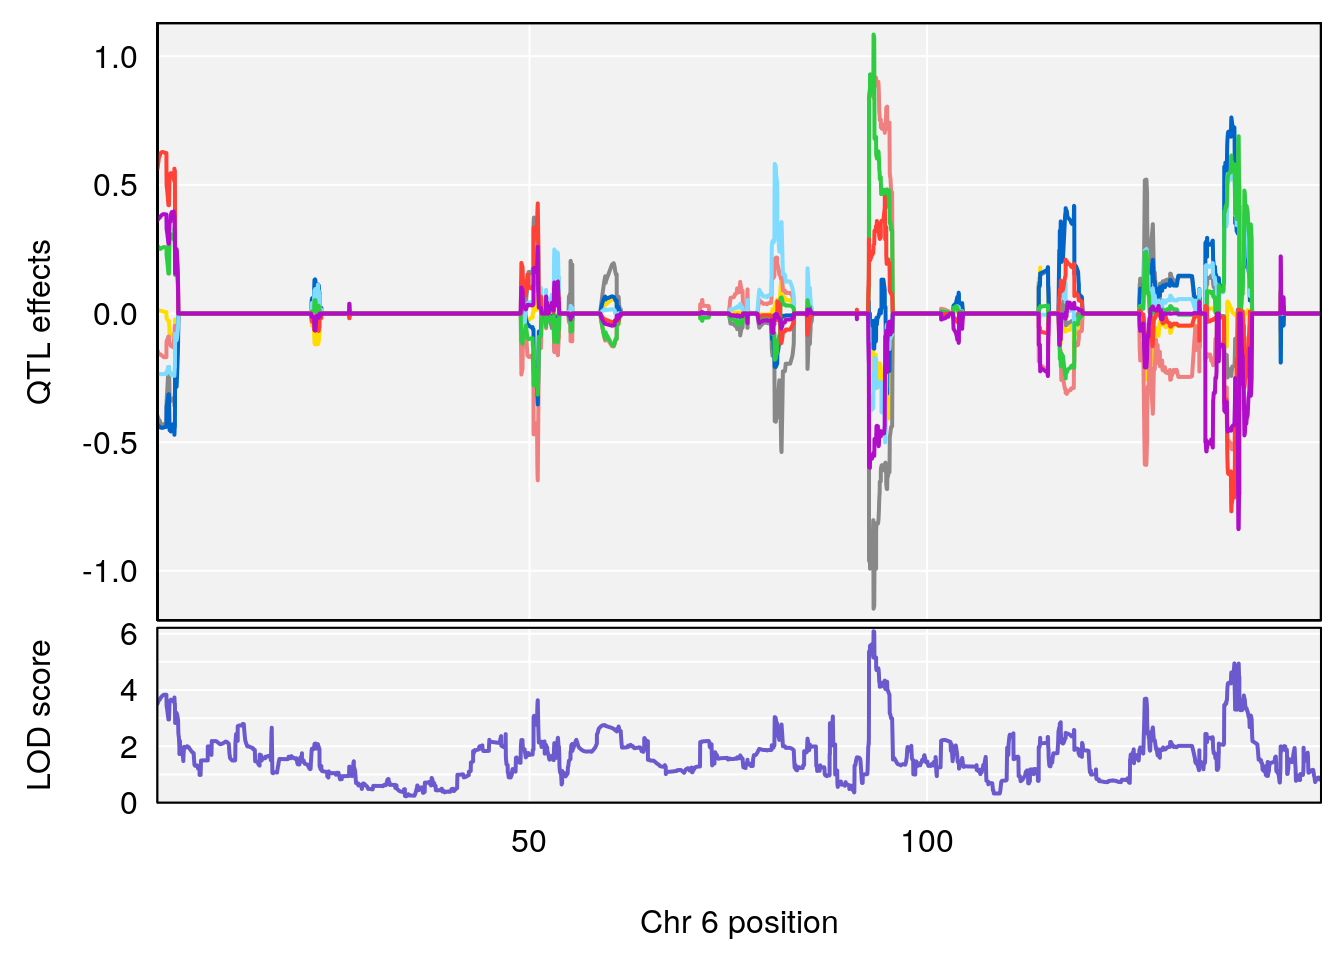
# 1 1 pheno1 3 98.04809 7.056873 97.51576 160.01710
# 2 1 pheno1 6 94.88068 8.514711 93.61447 95.01174
# [1] 1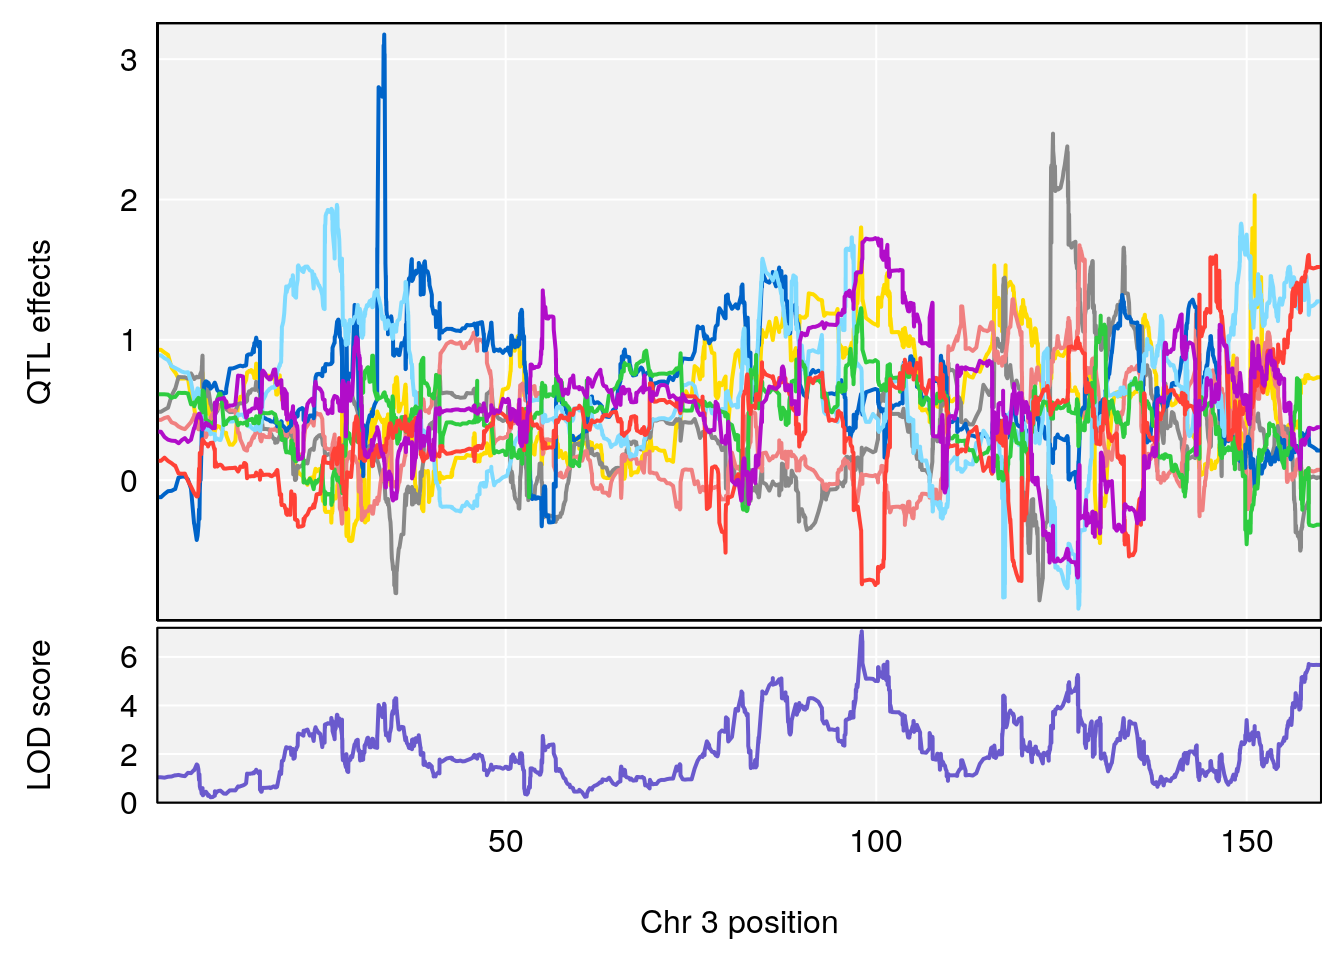
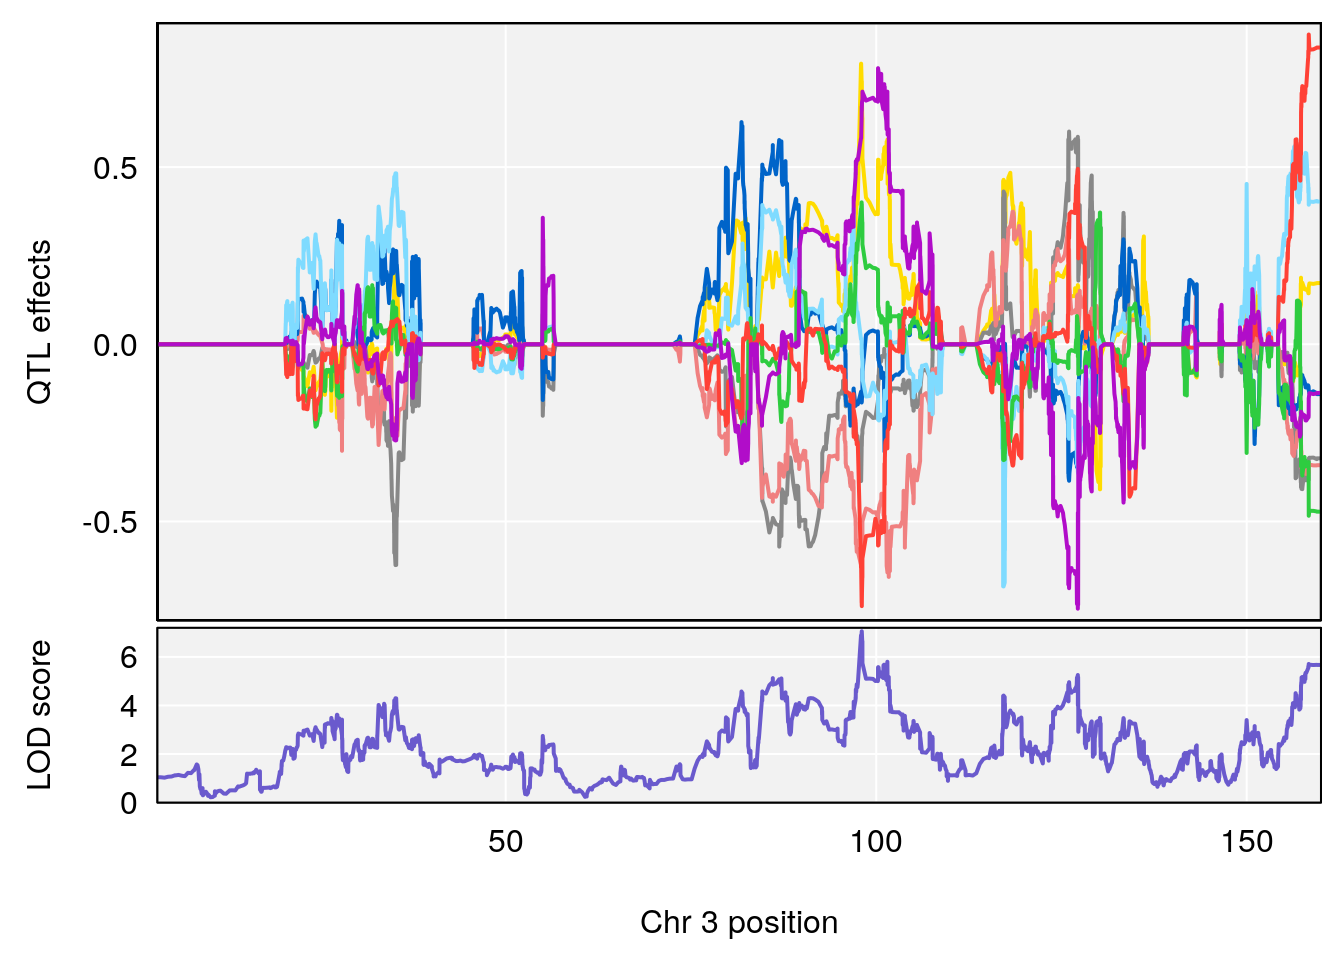
# [1] 2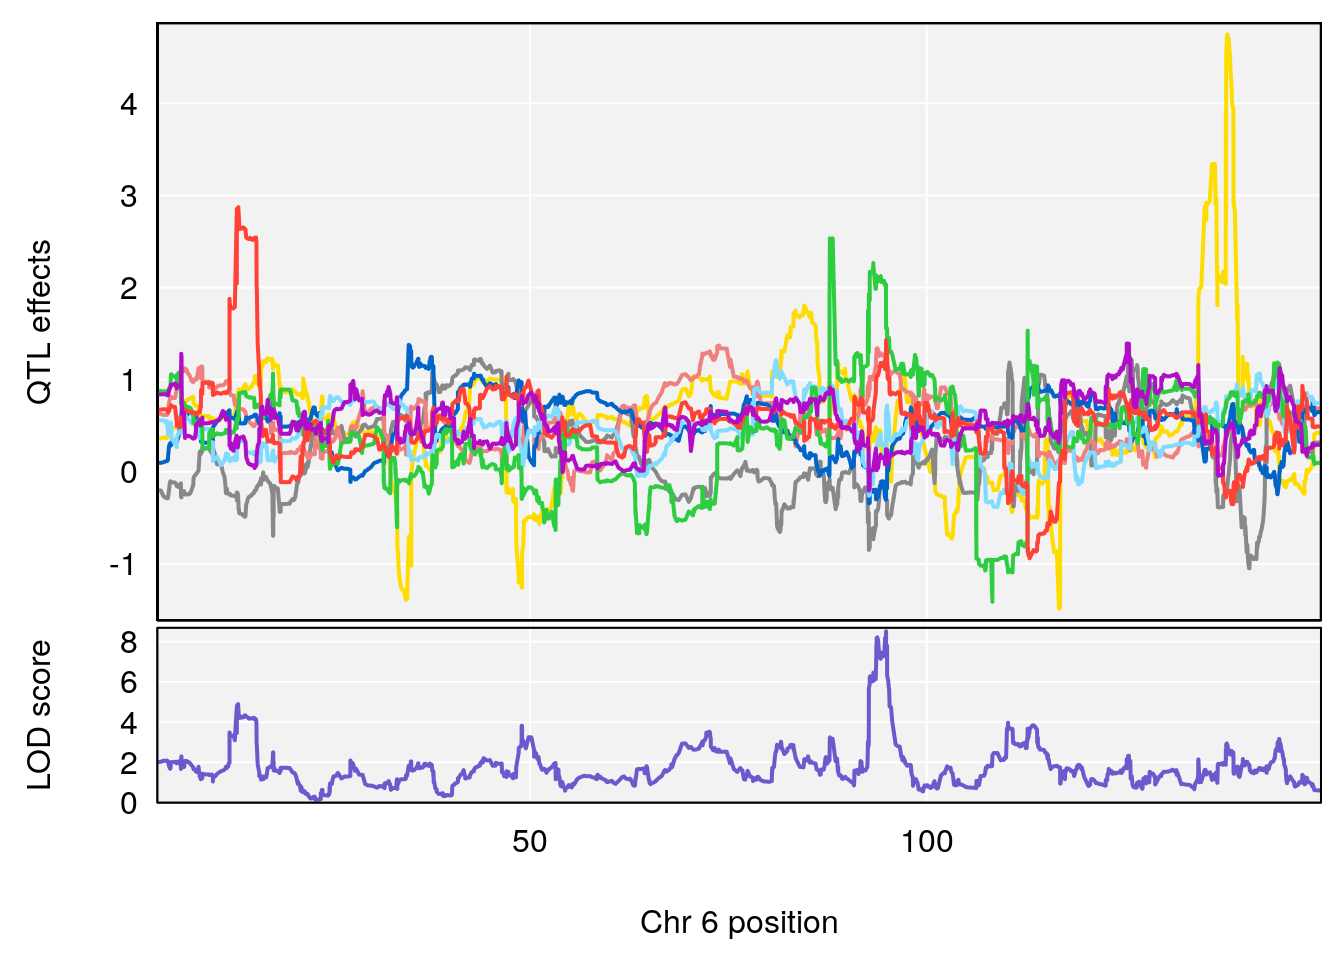
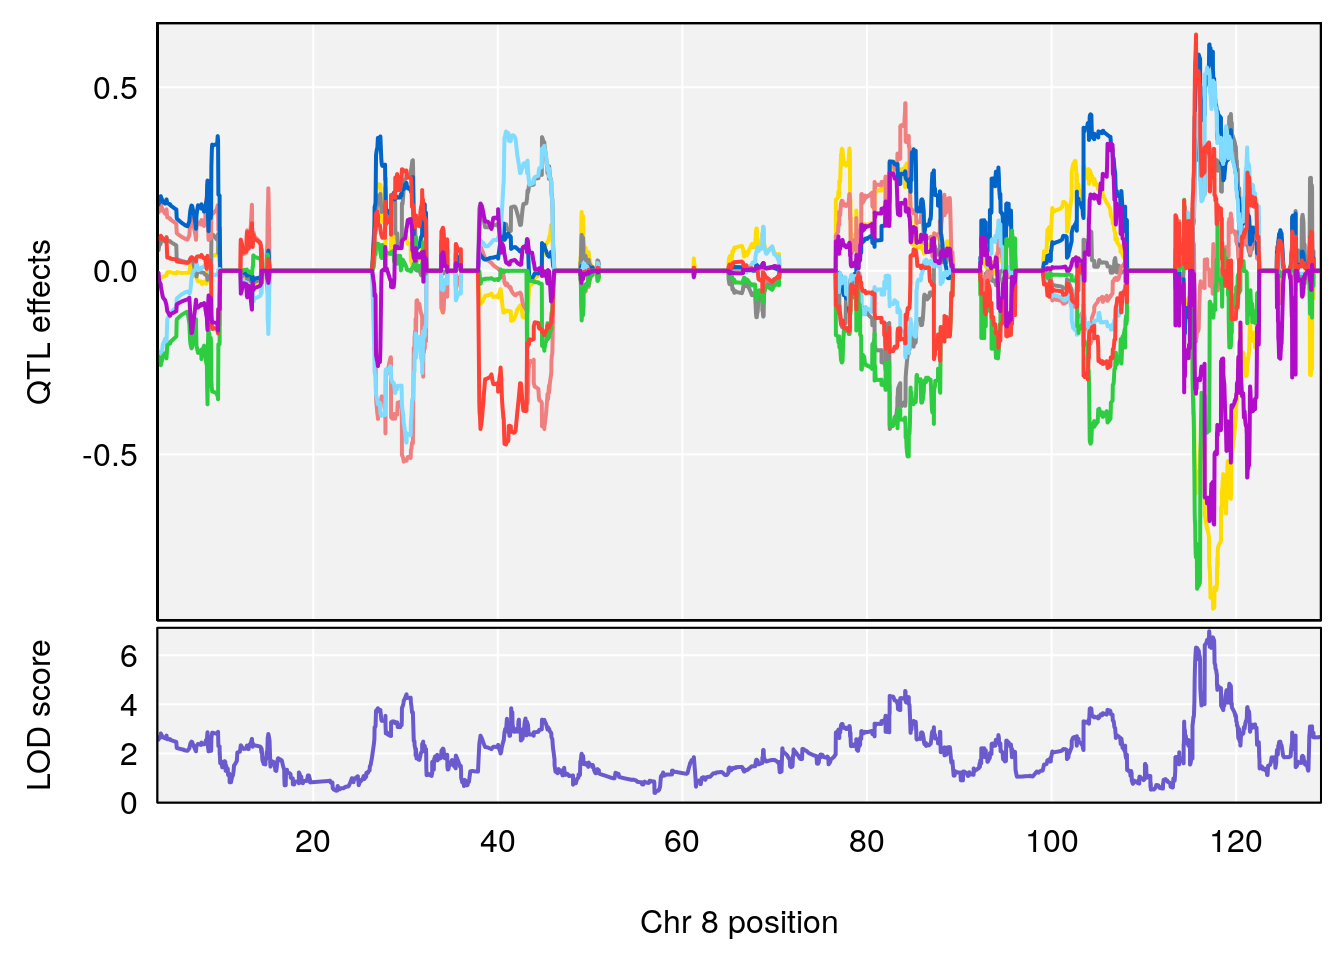
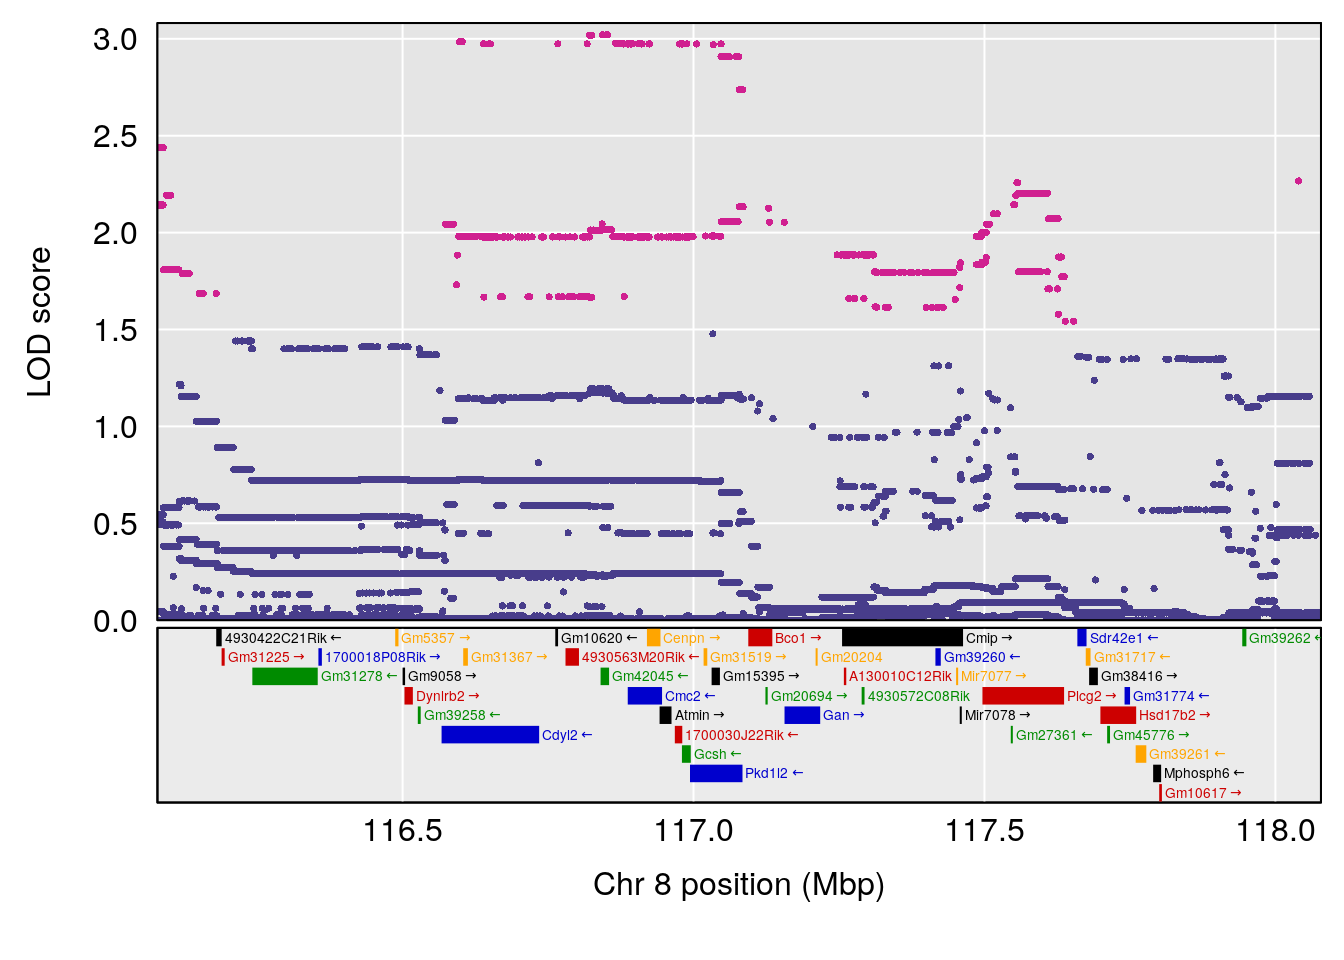
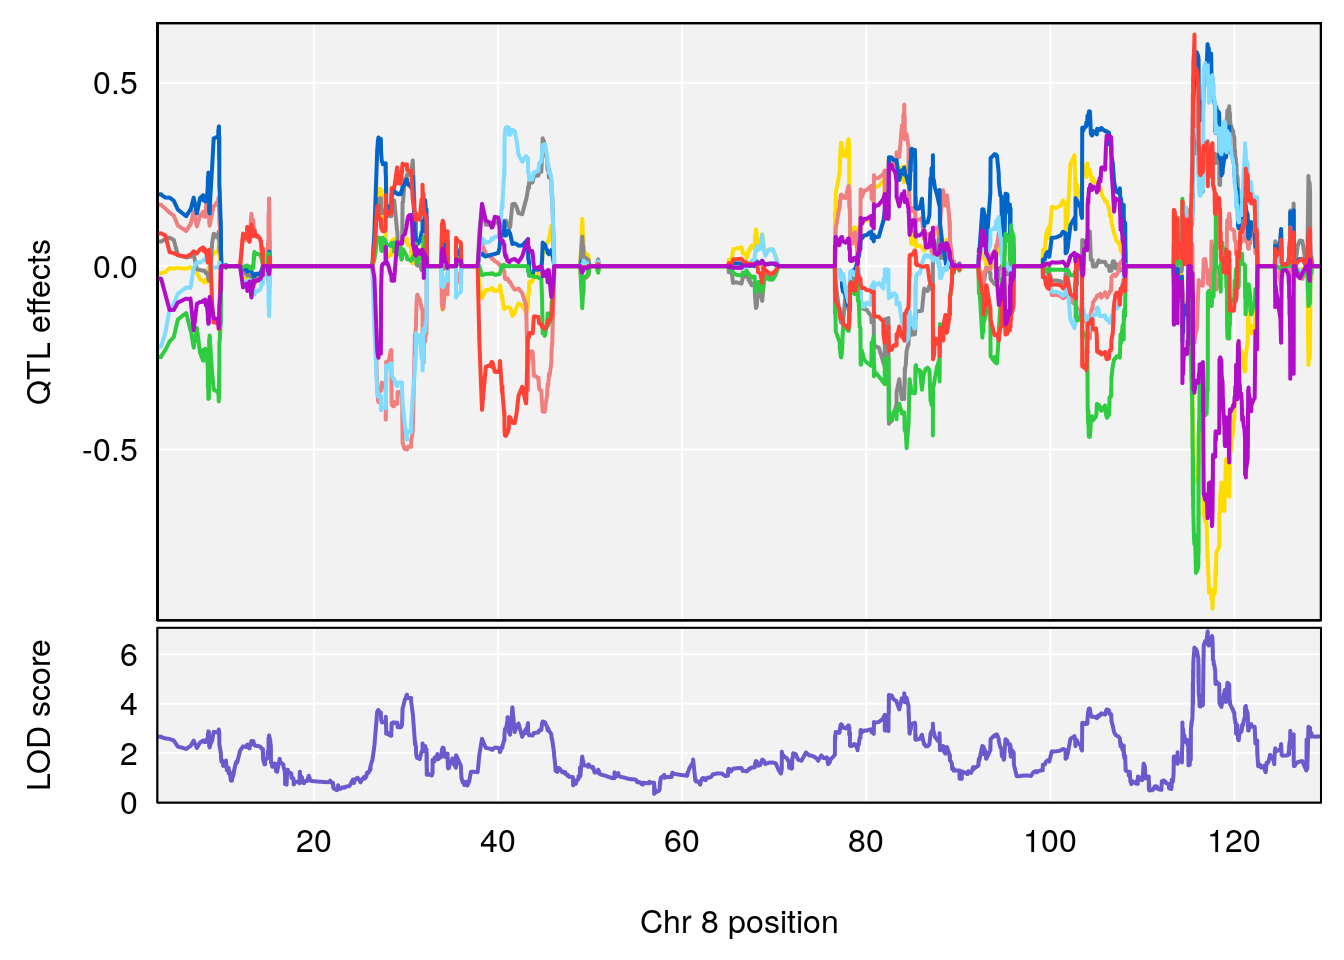
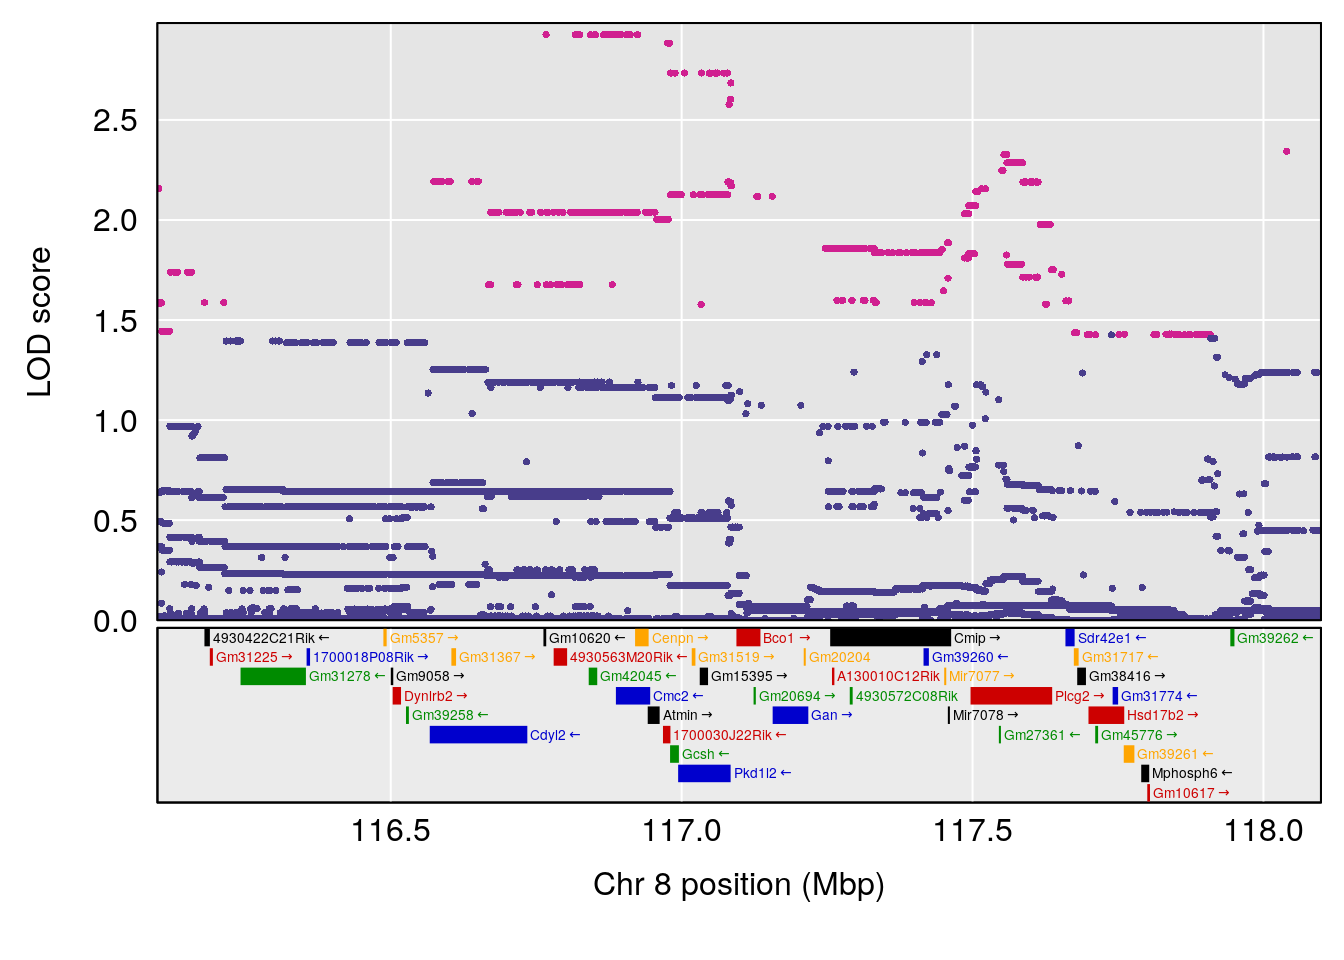
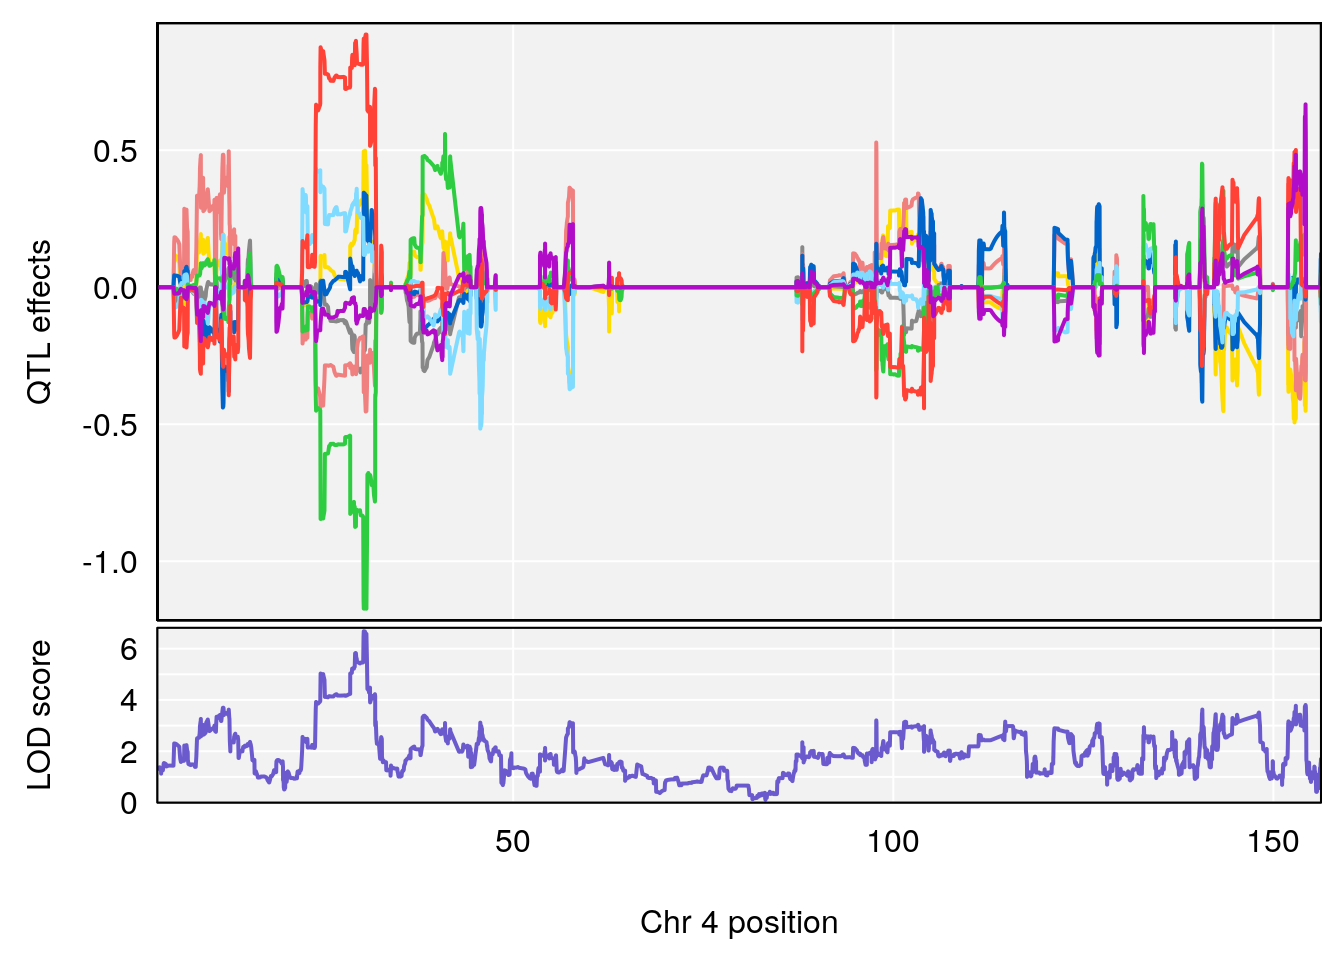
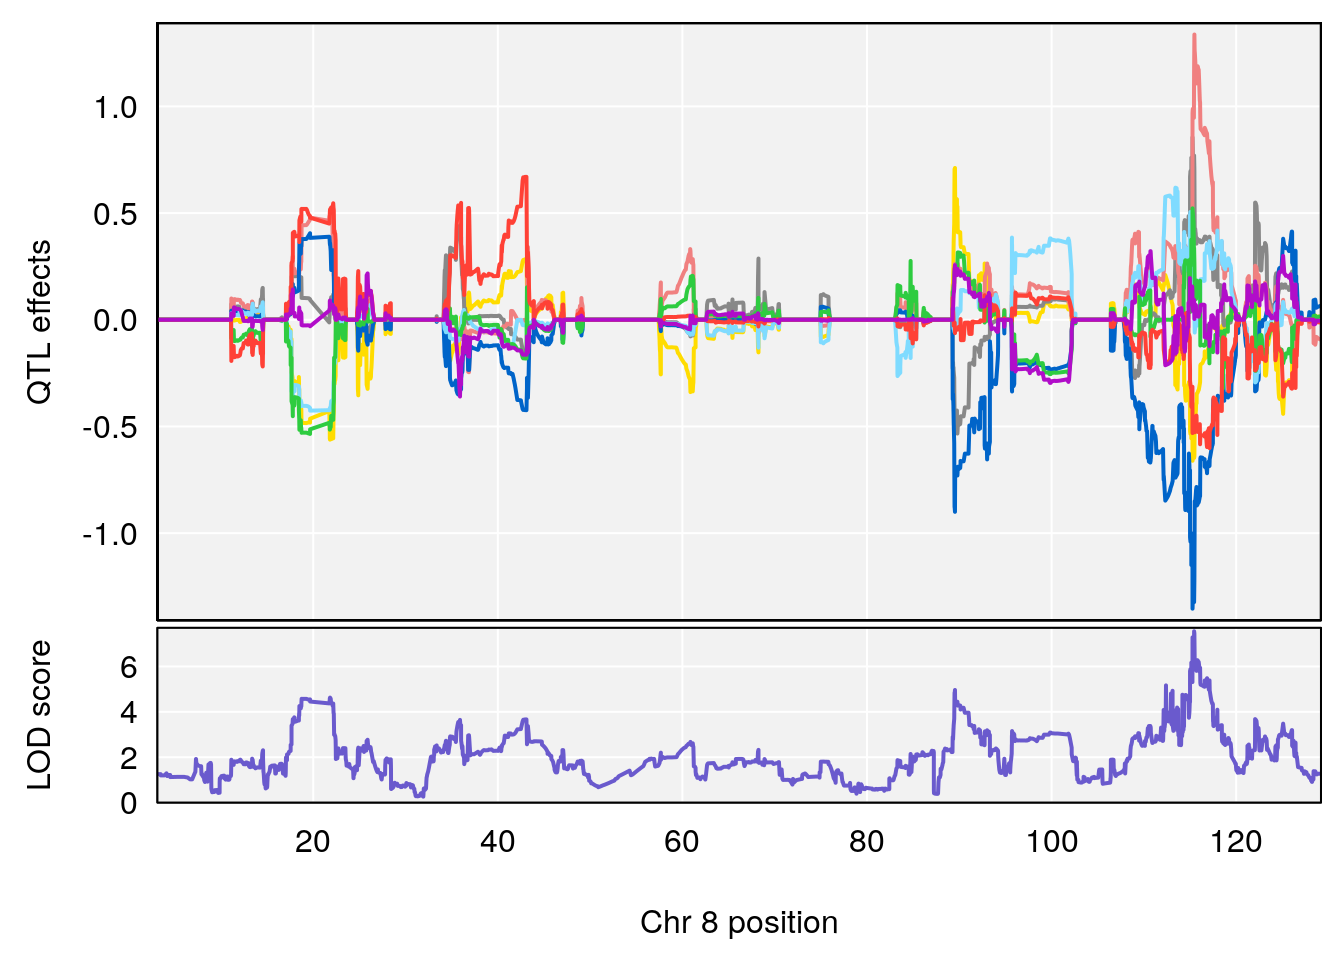
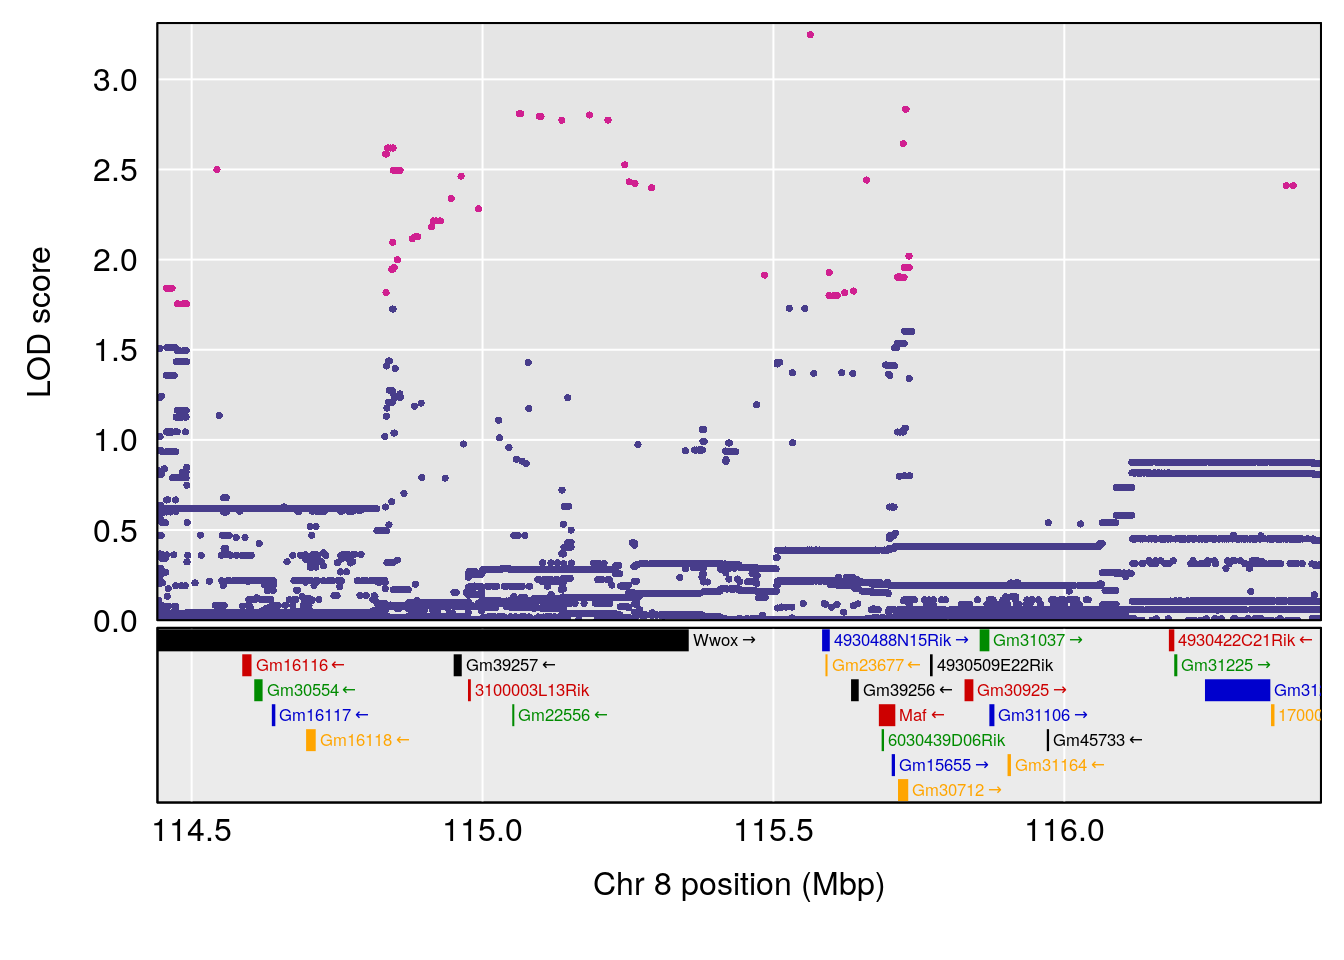
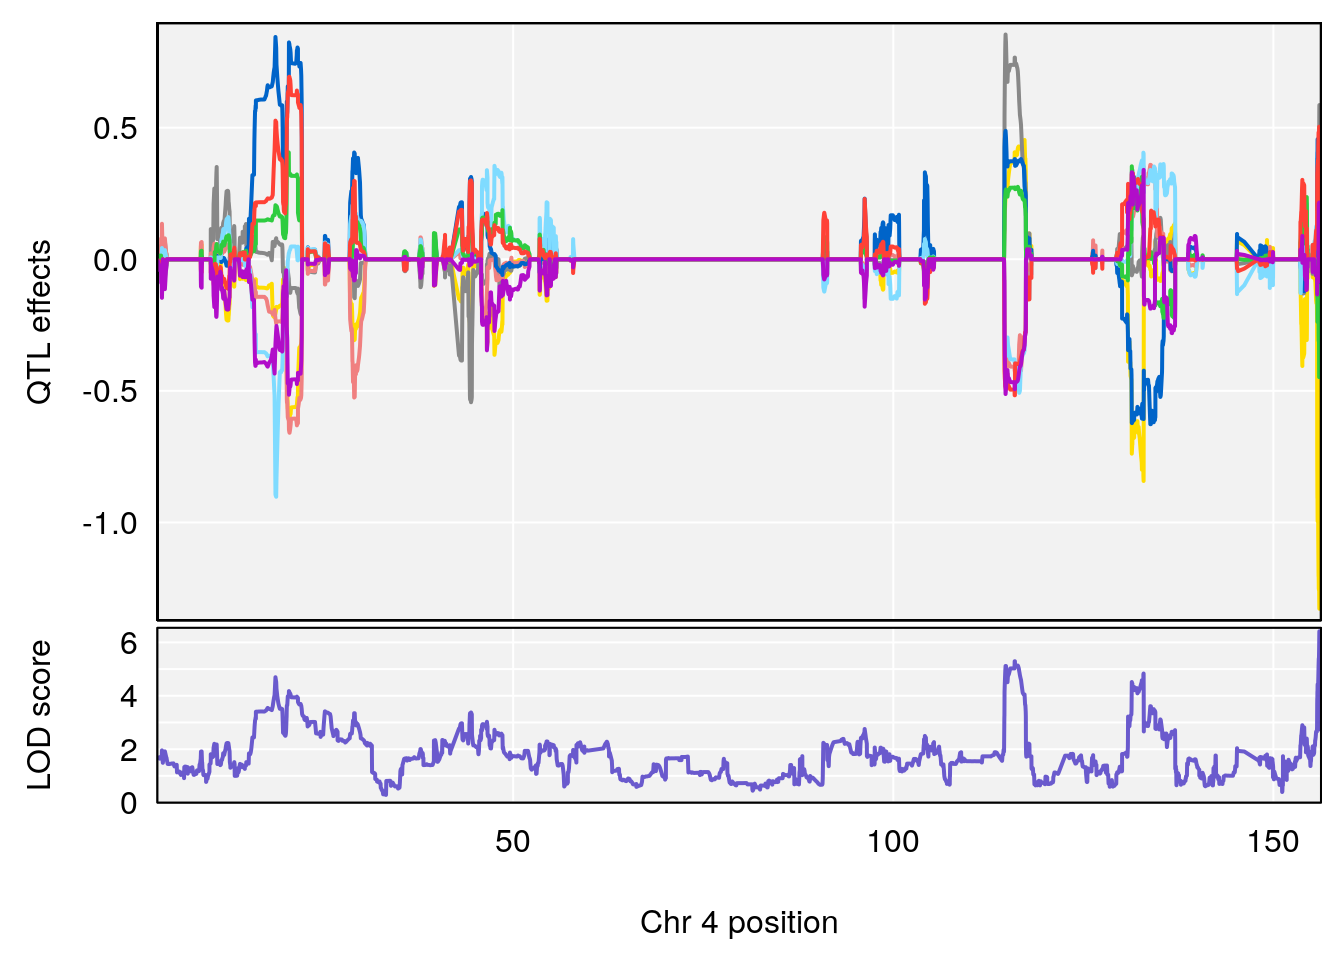
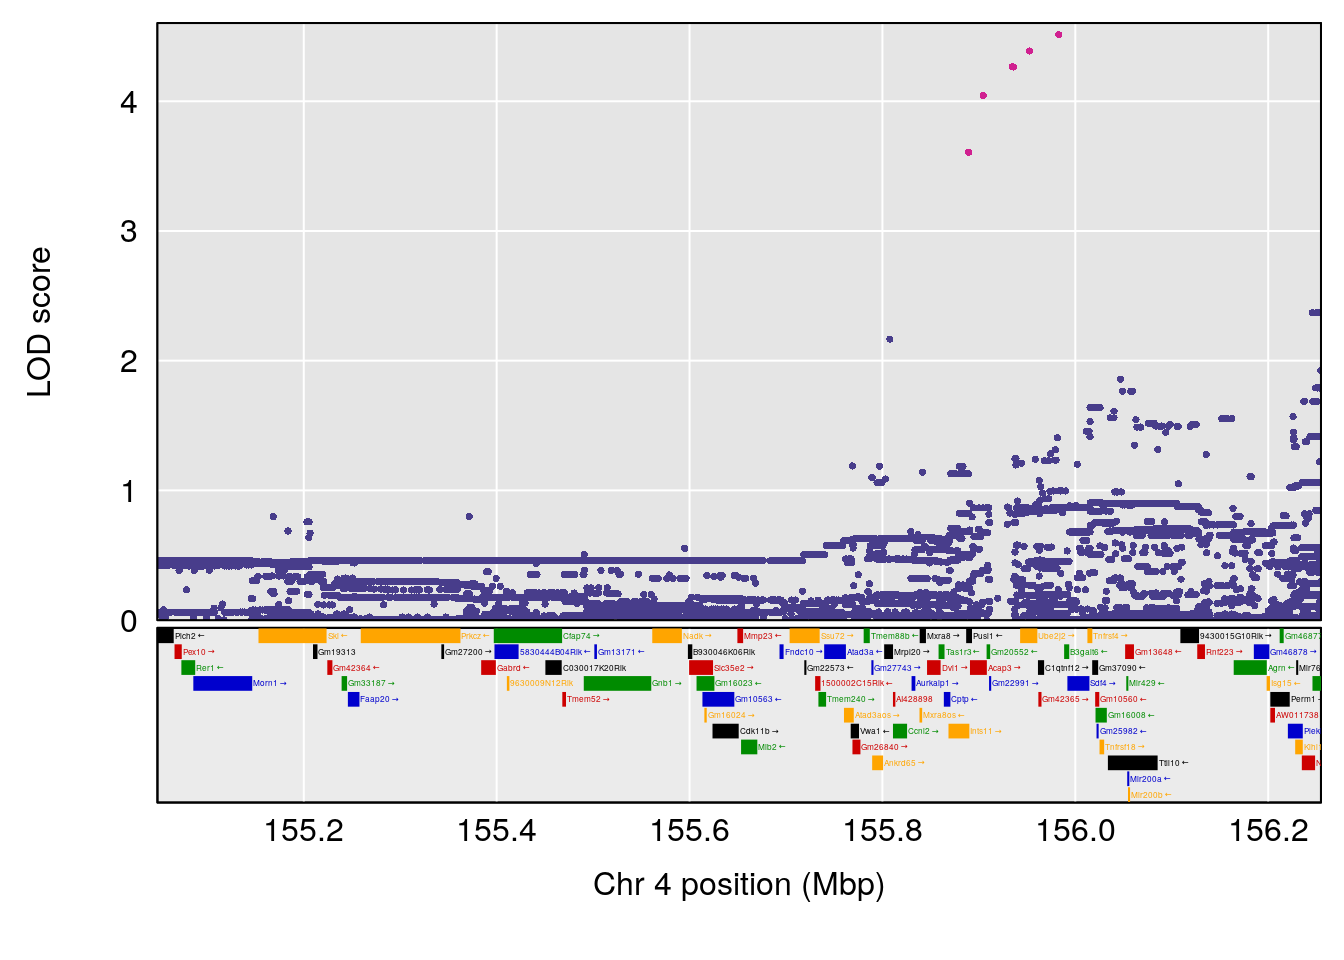
# [1] "Recovery.Time"
# lodindex lodcolumn chr pos lod ci_lo ci_hi
# 1 1 pheno1 1 59.37548 6.120300 59.01588 62.32984
# 2 1 pheno1 4 155.99563 6.203463 114.75702 156.13631
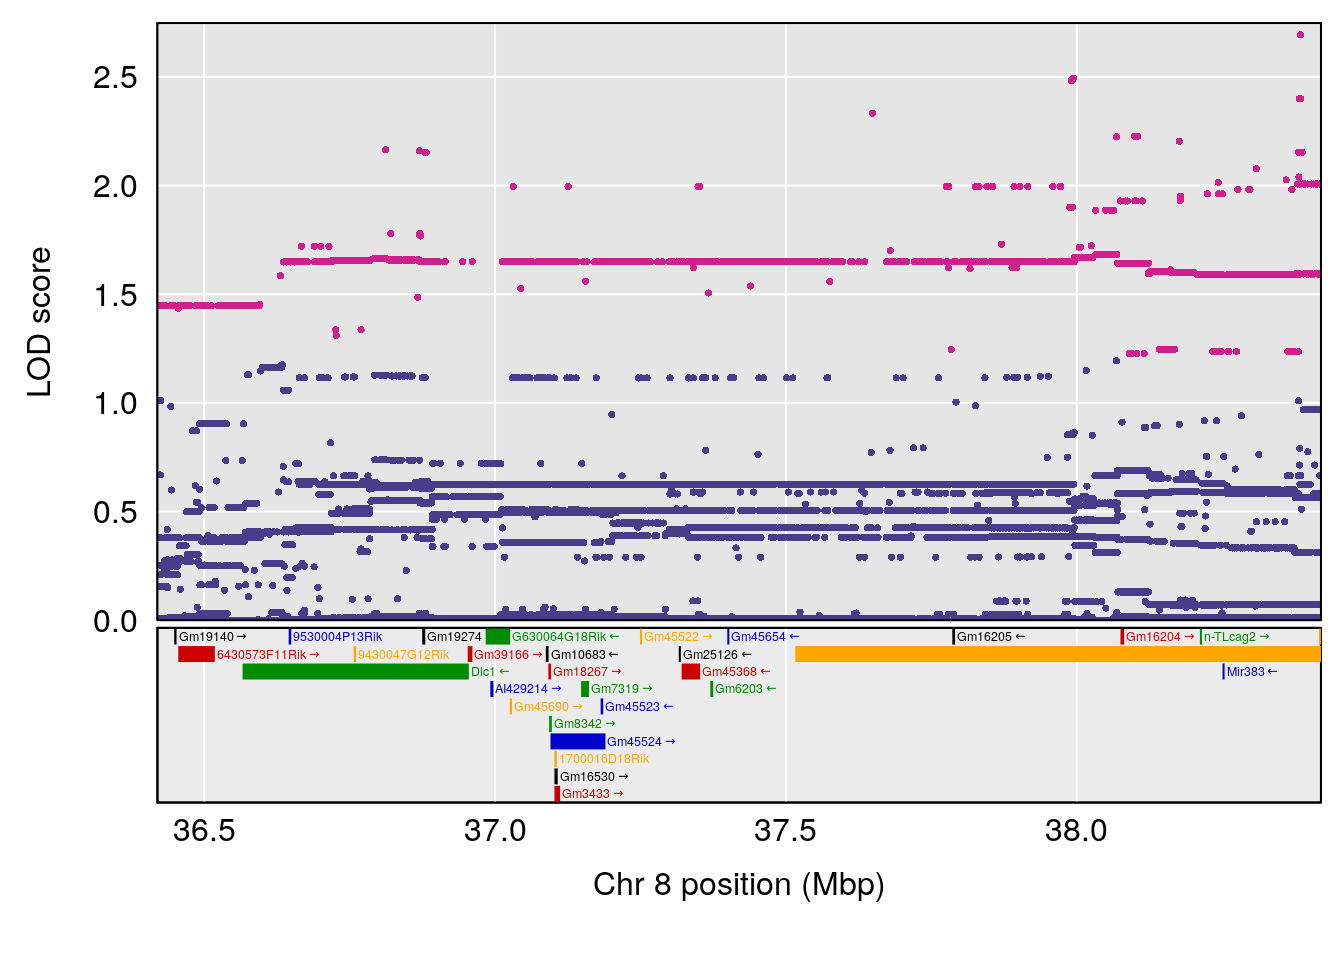
# 3 1 pheno1 8 117.09888 6.925422 115.52682 117.86788
# [1] 1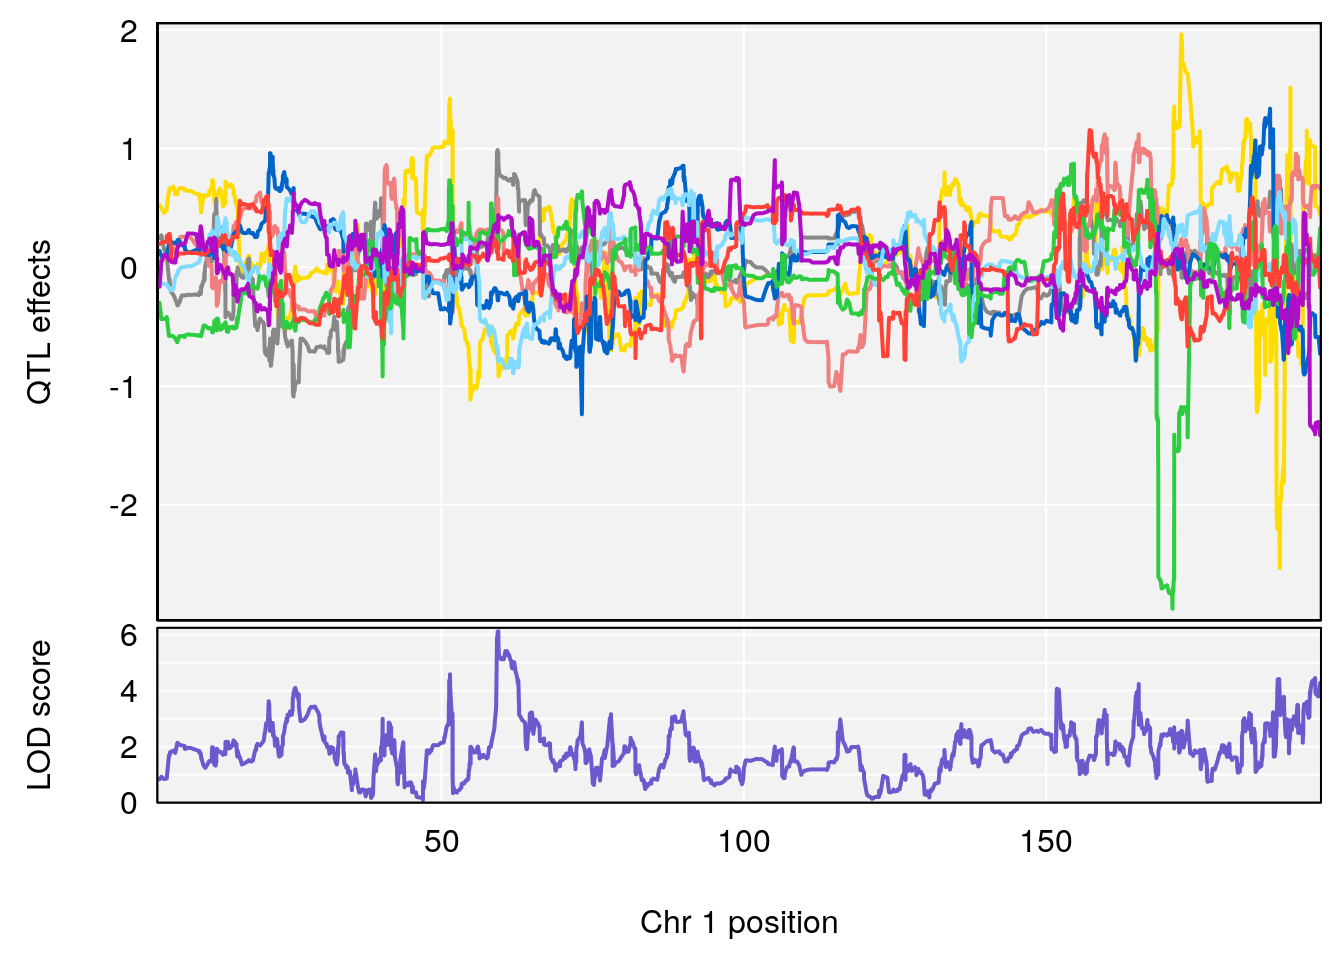
# [1] 2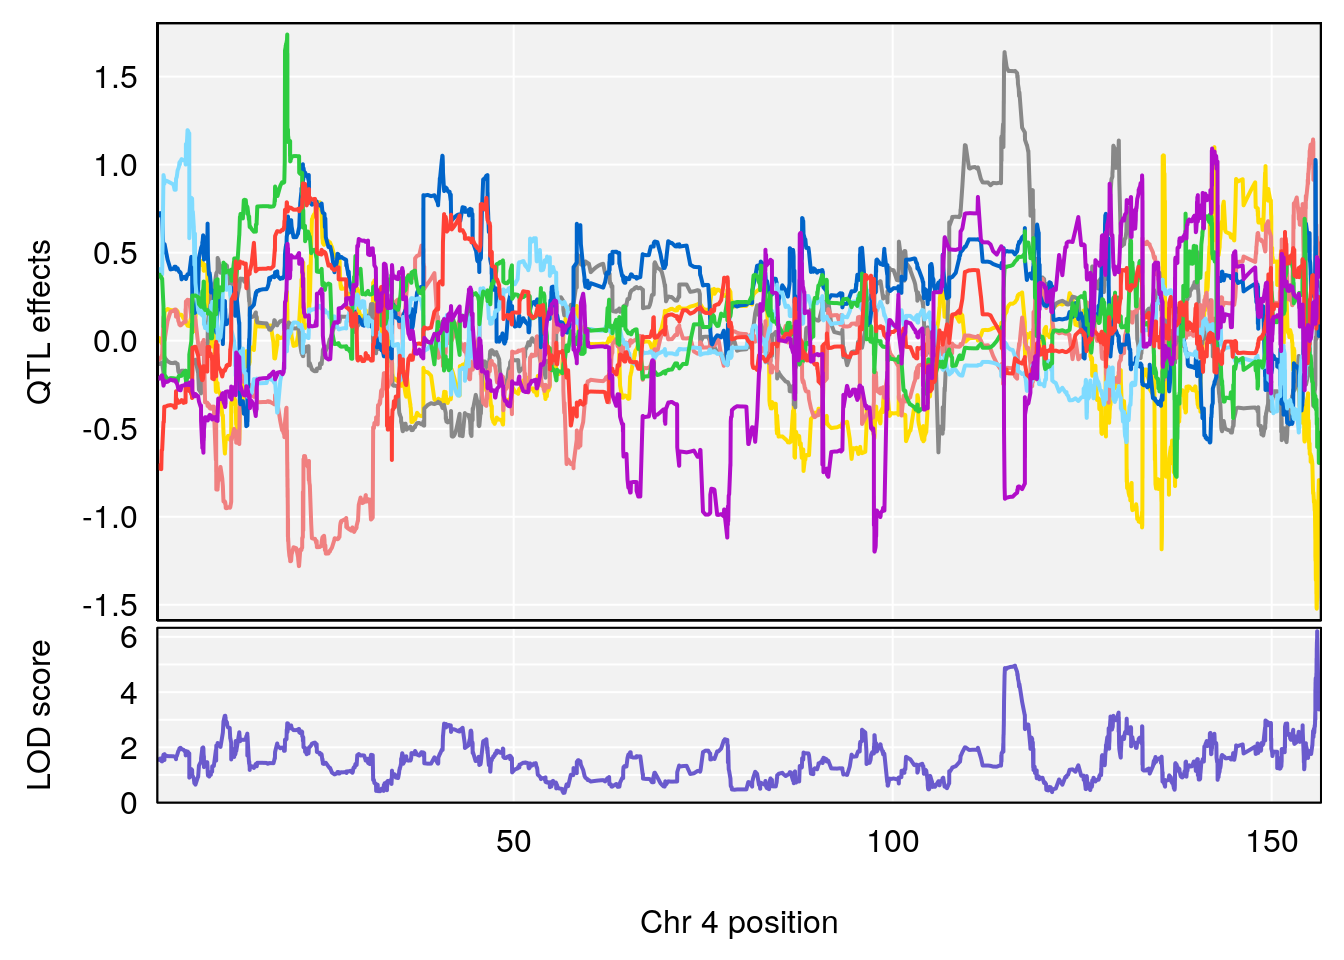
# [1] 3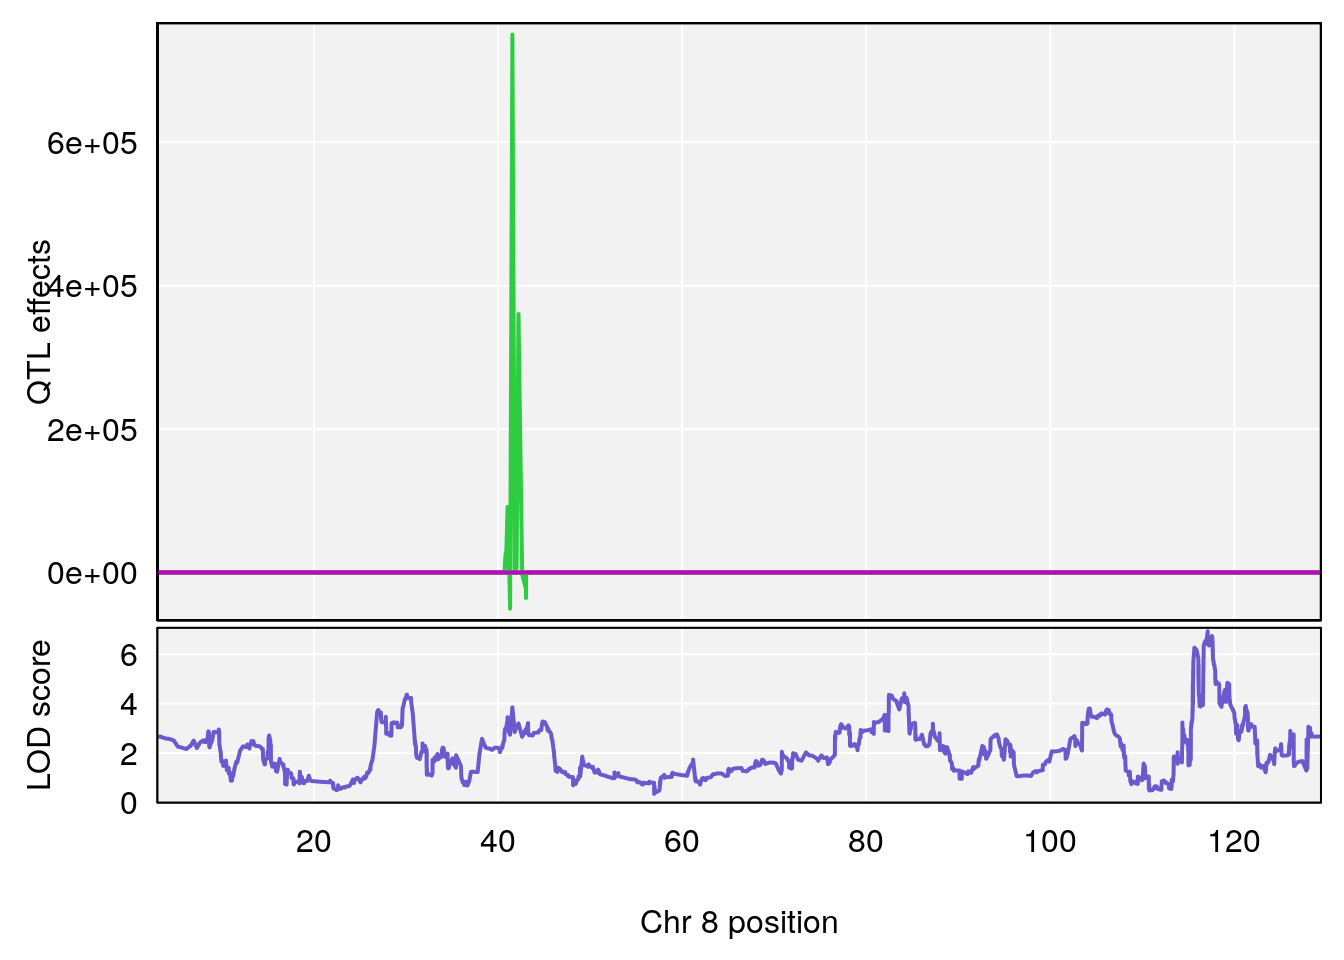
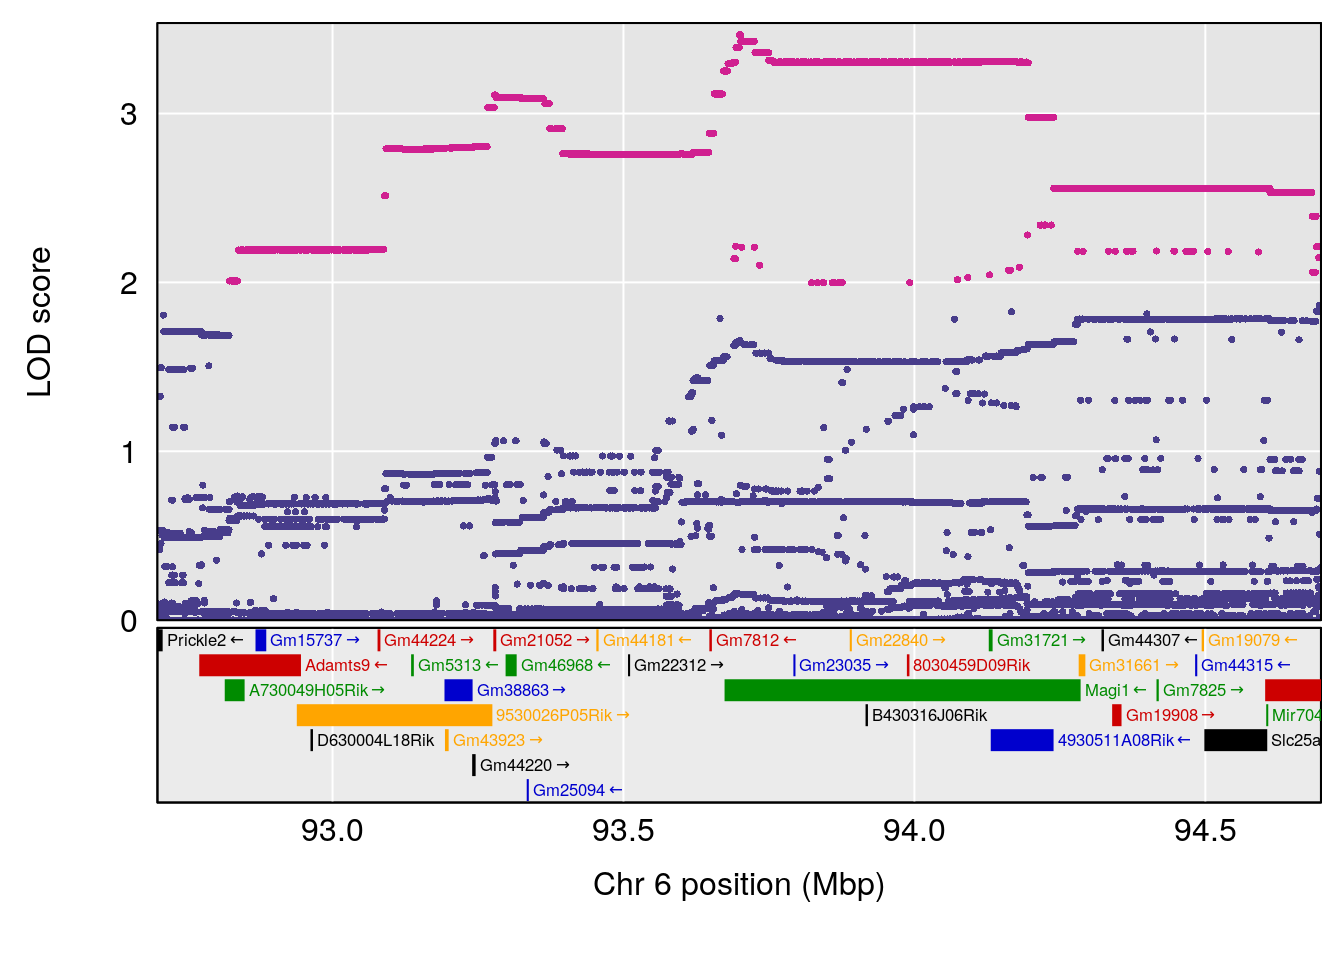
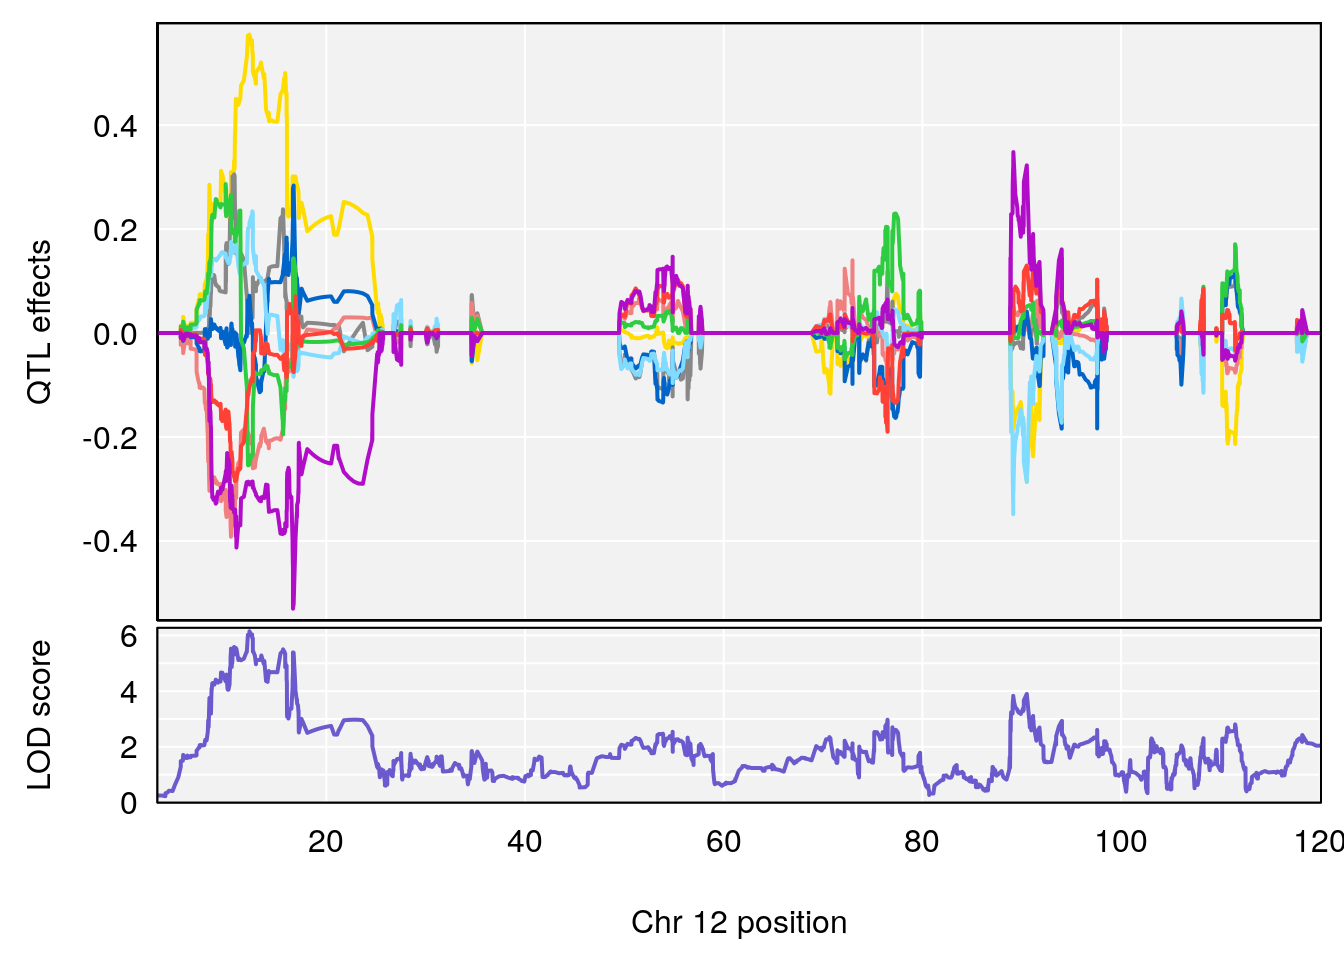
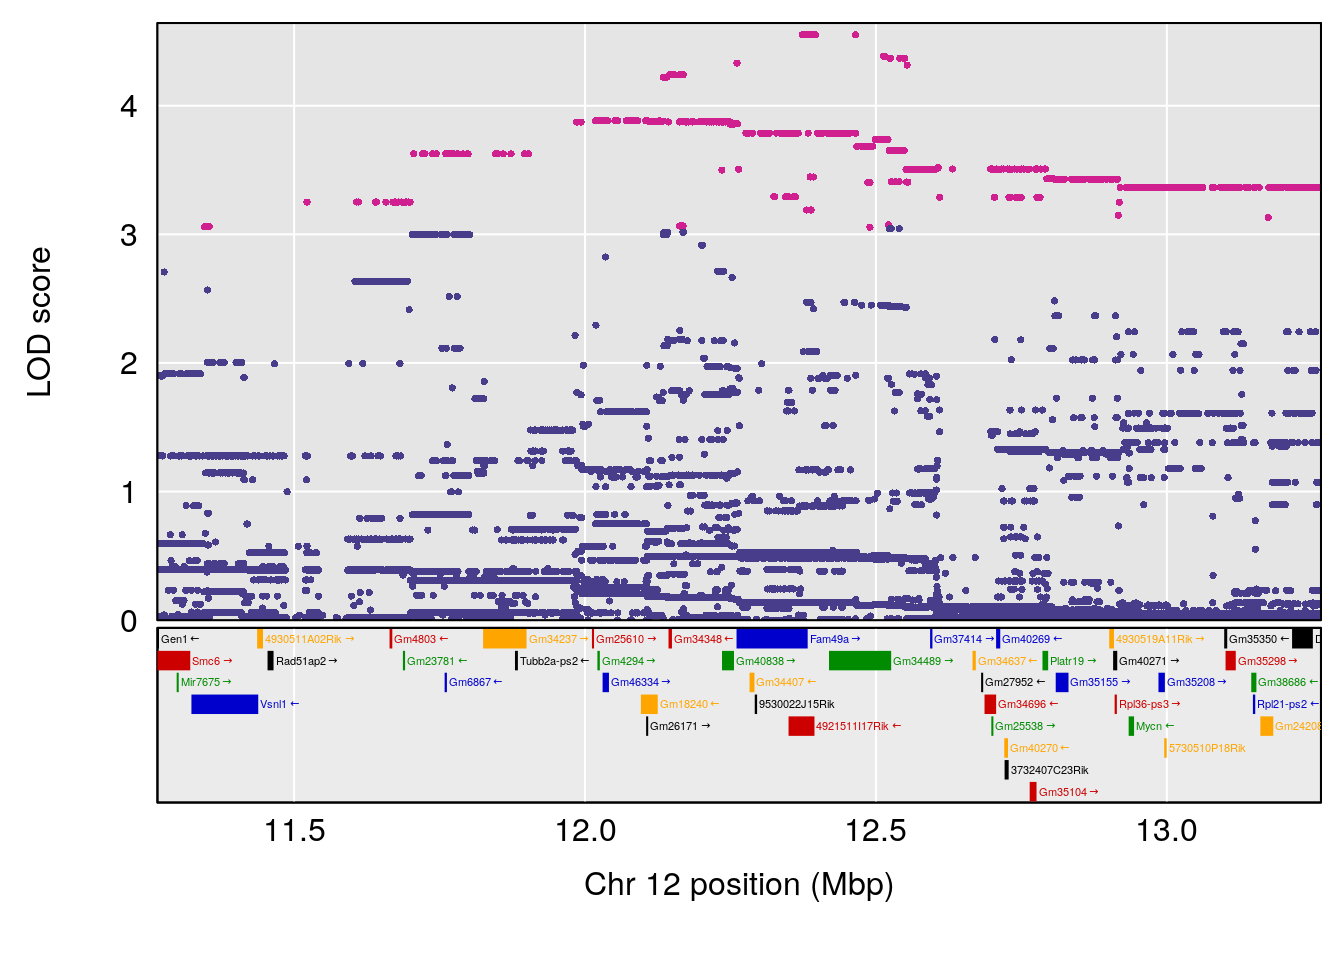
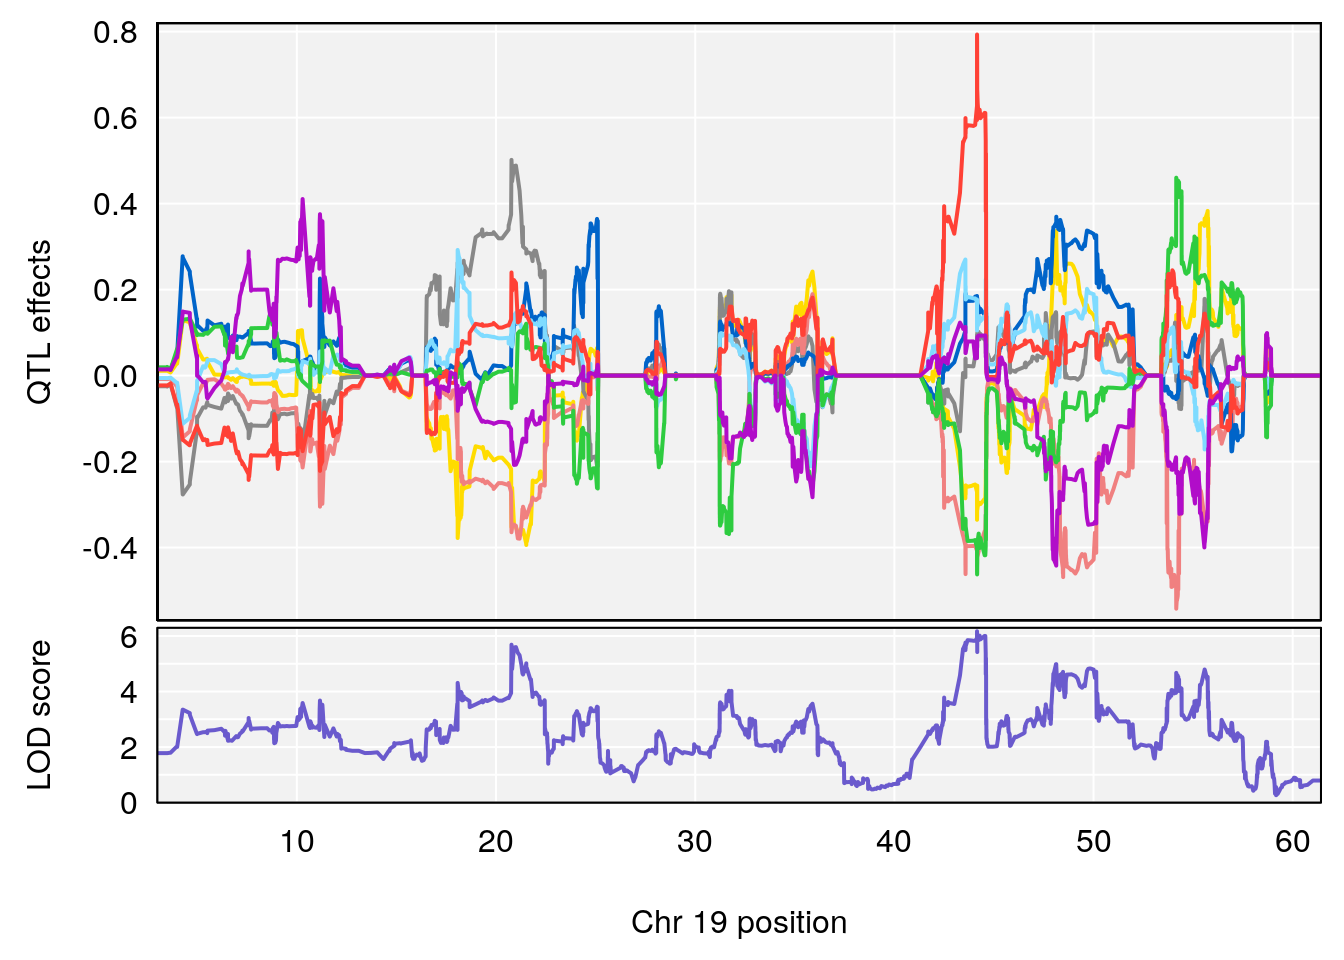
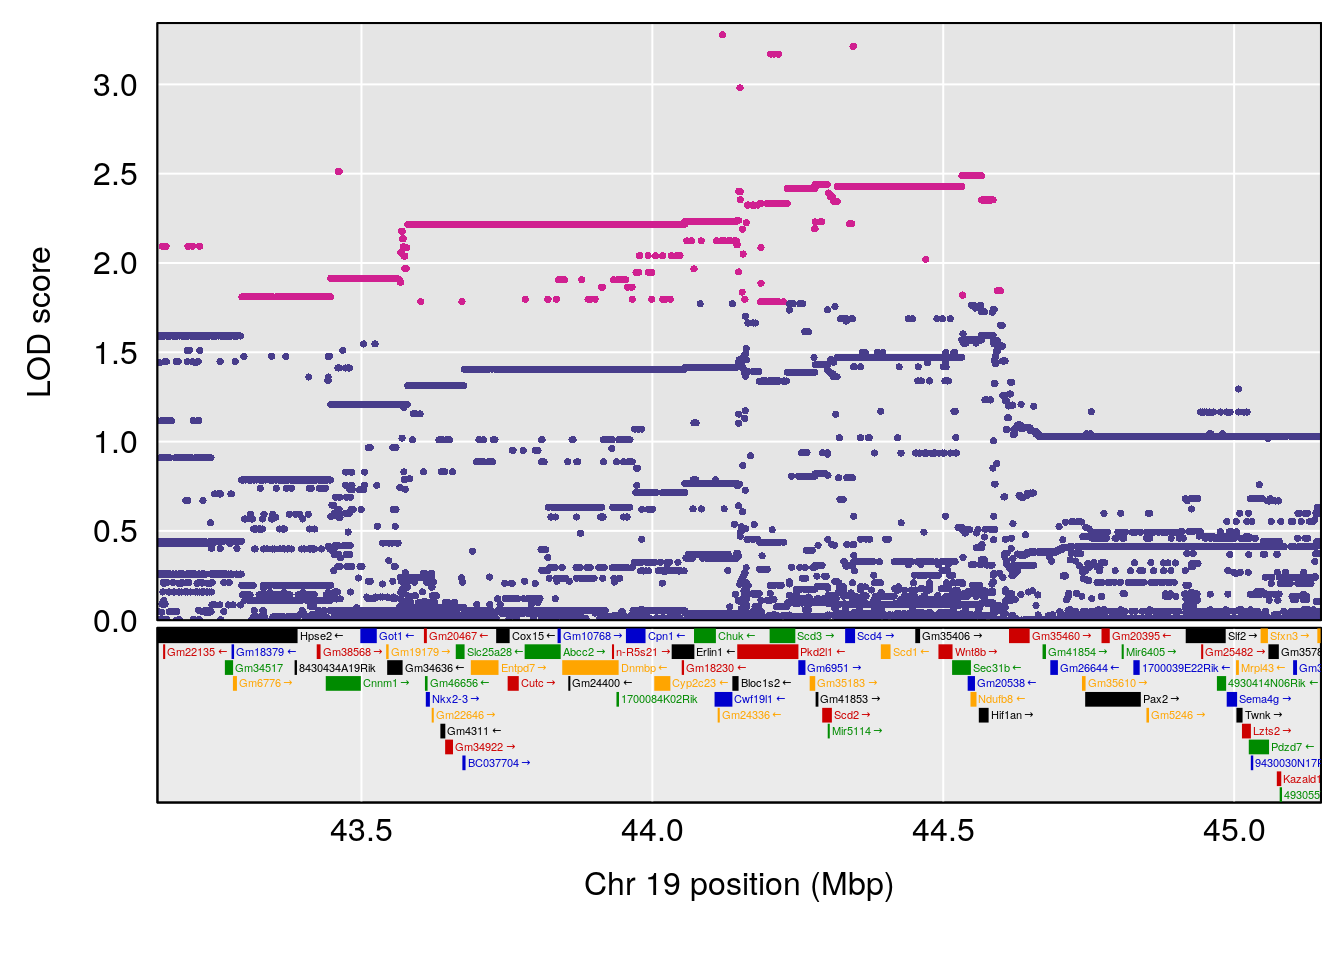
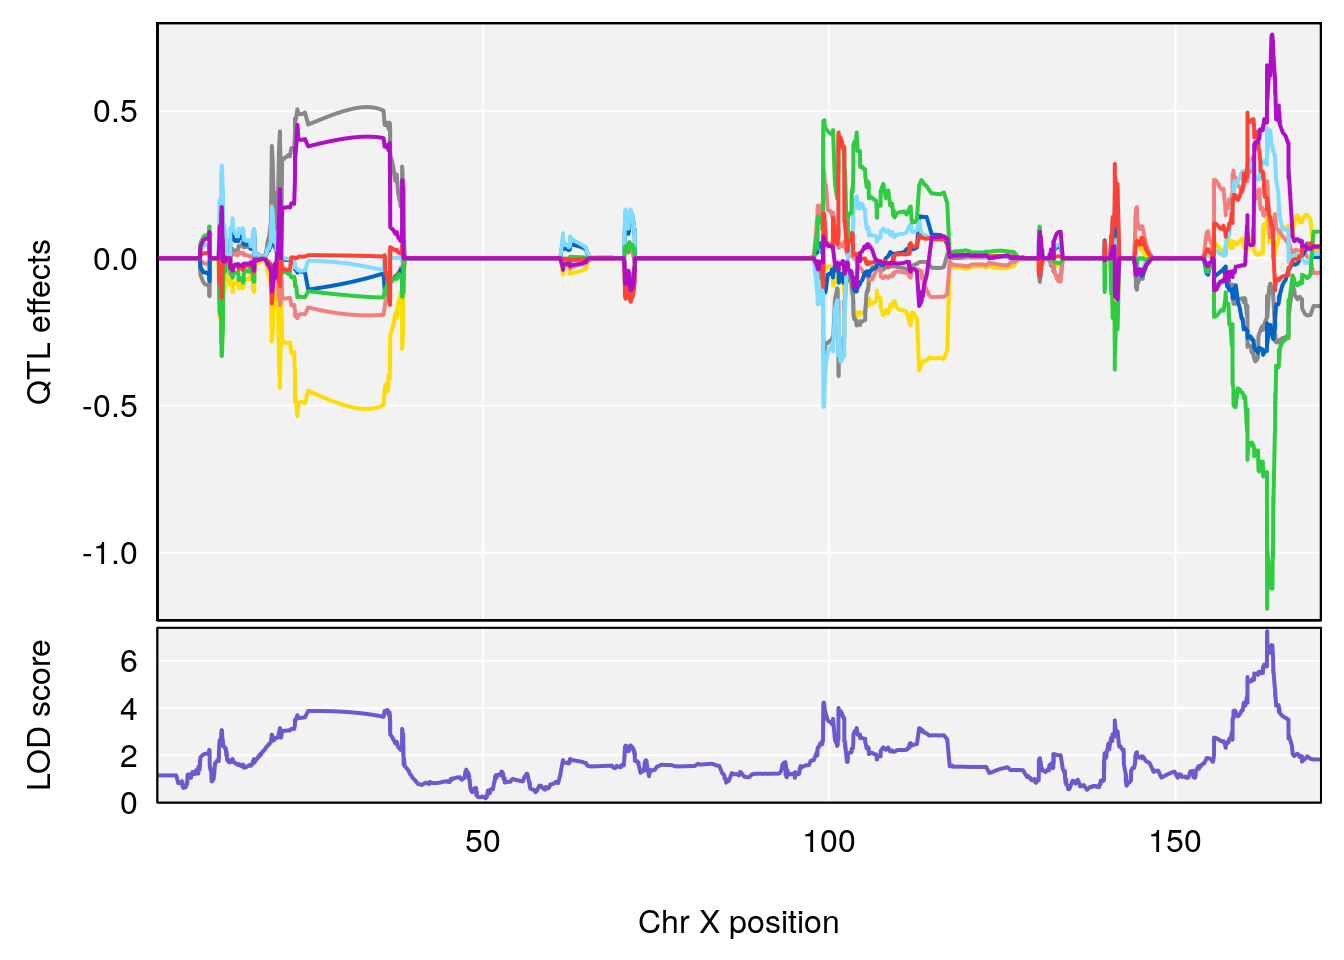
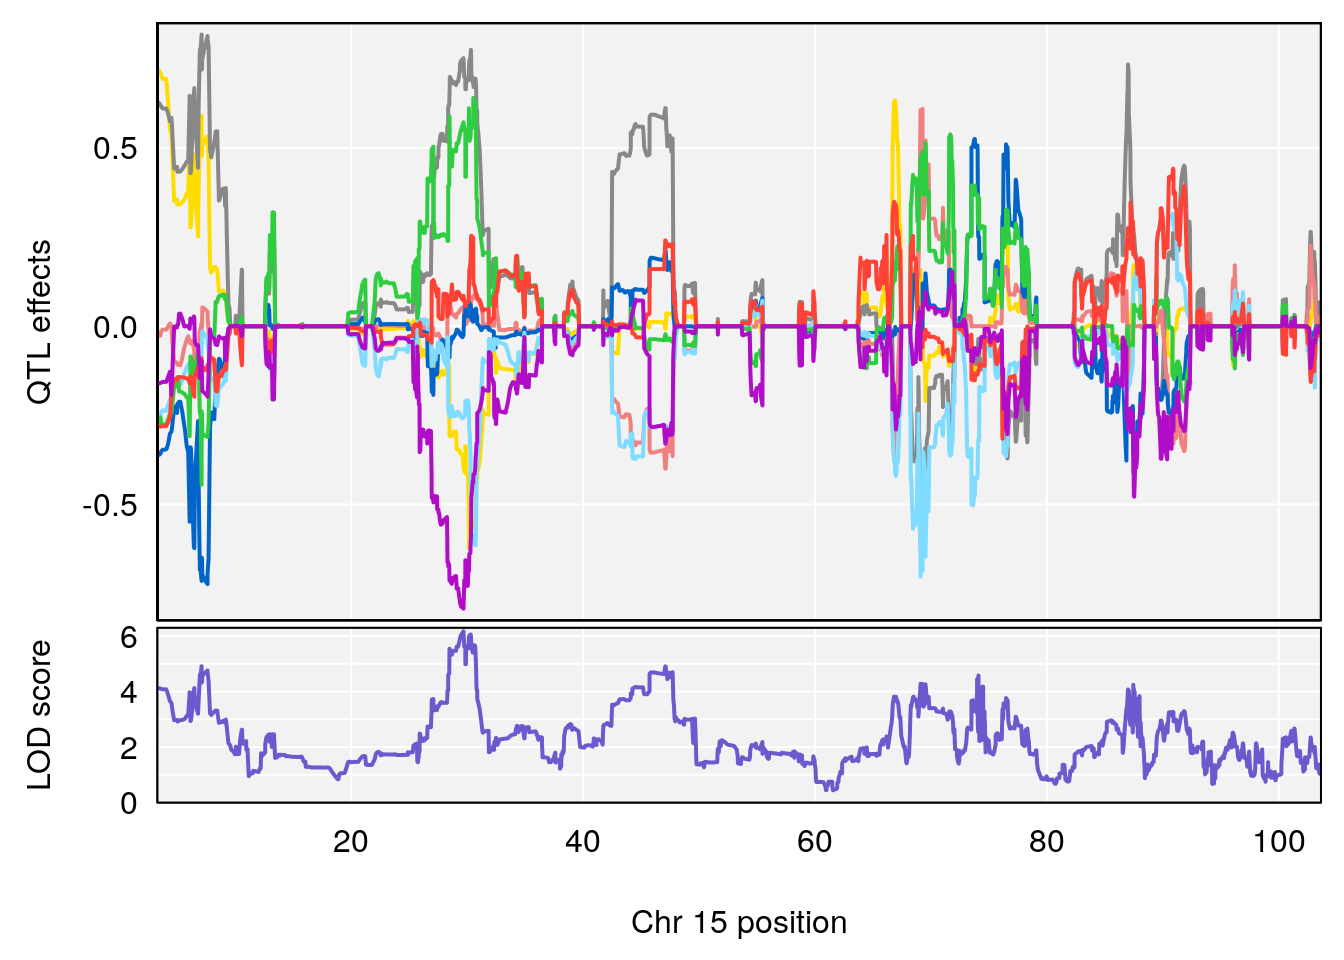
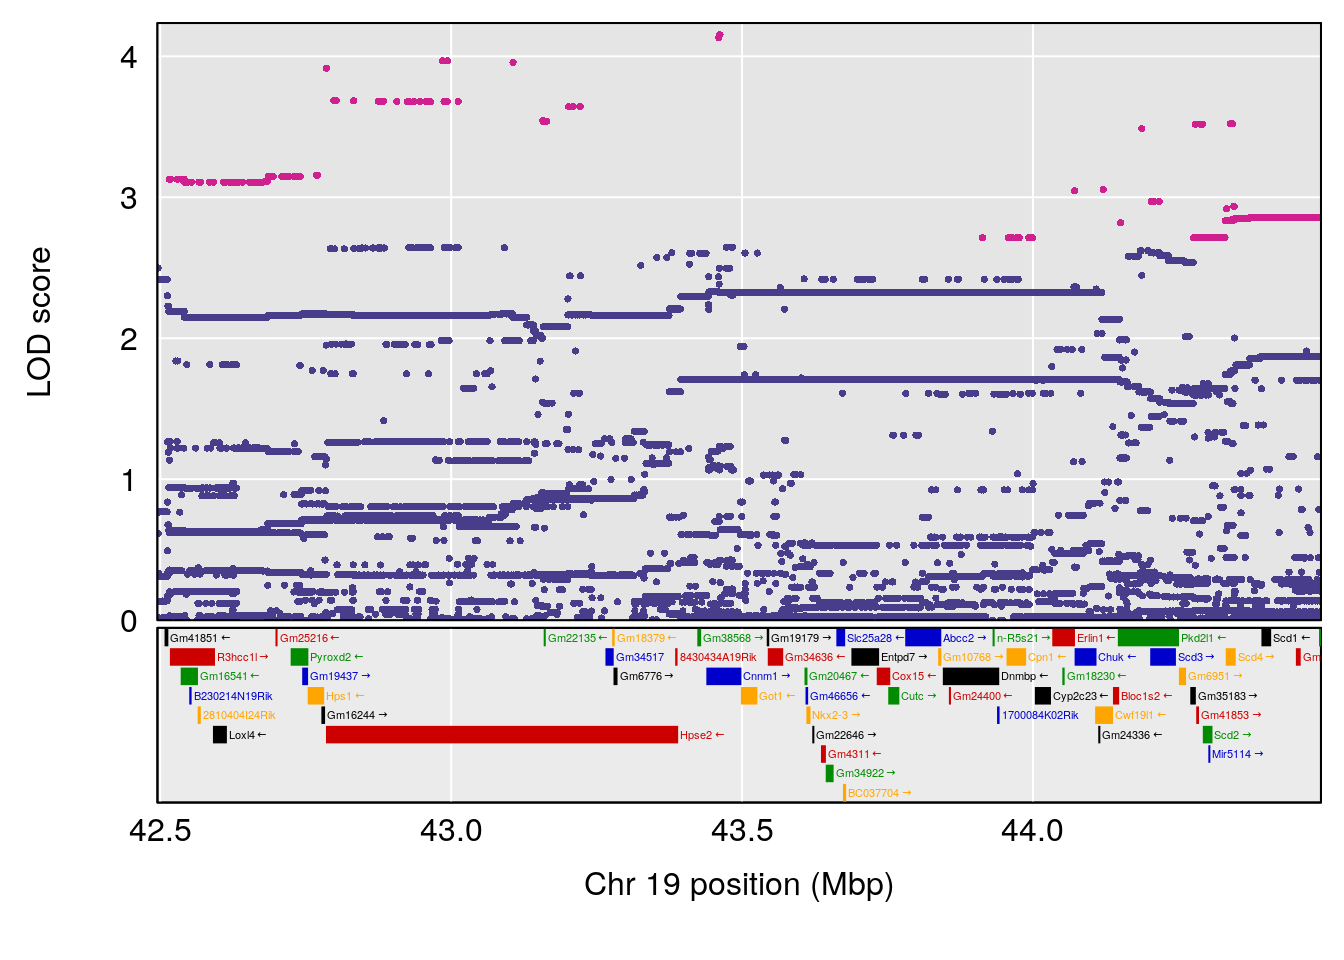
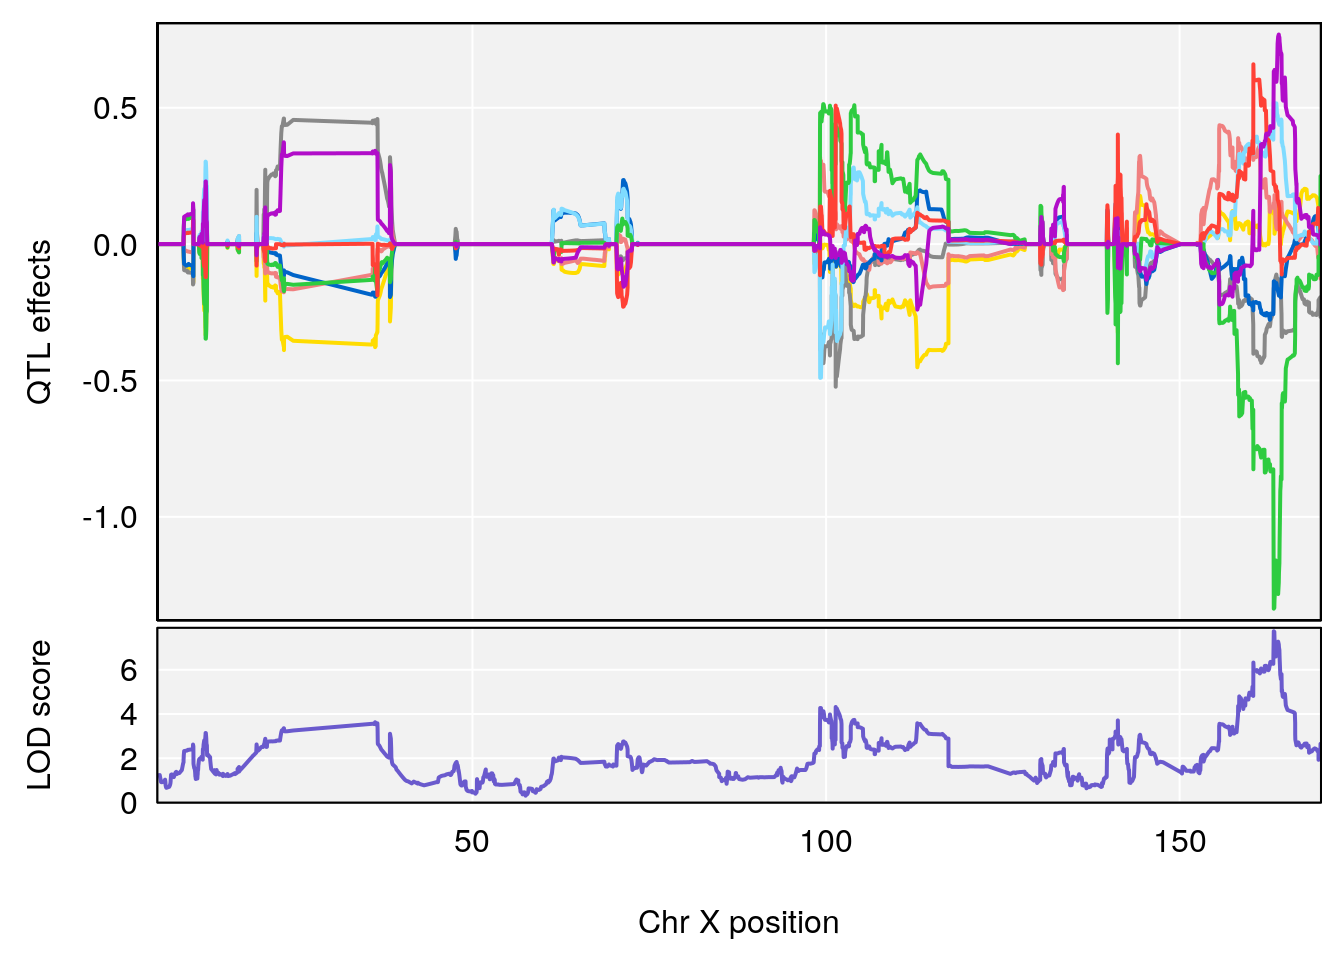
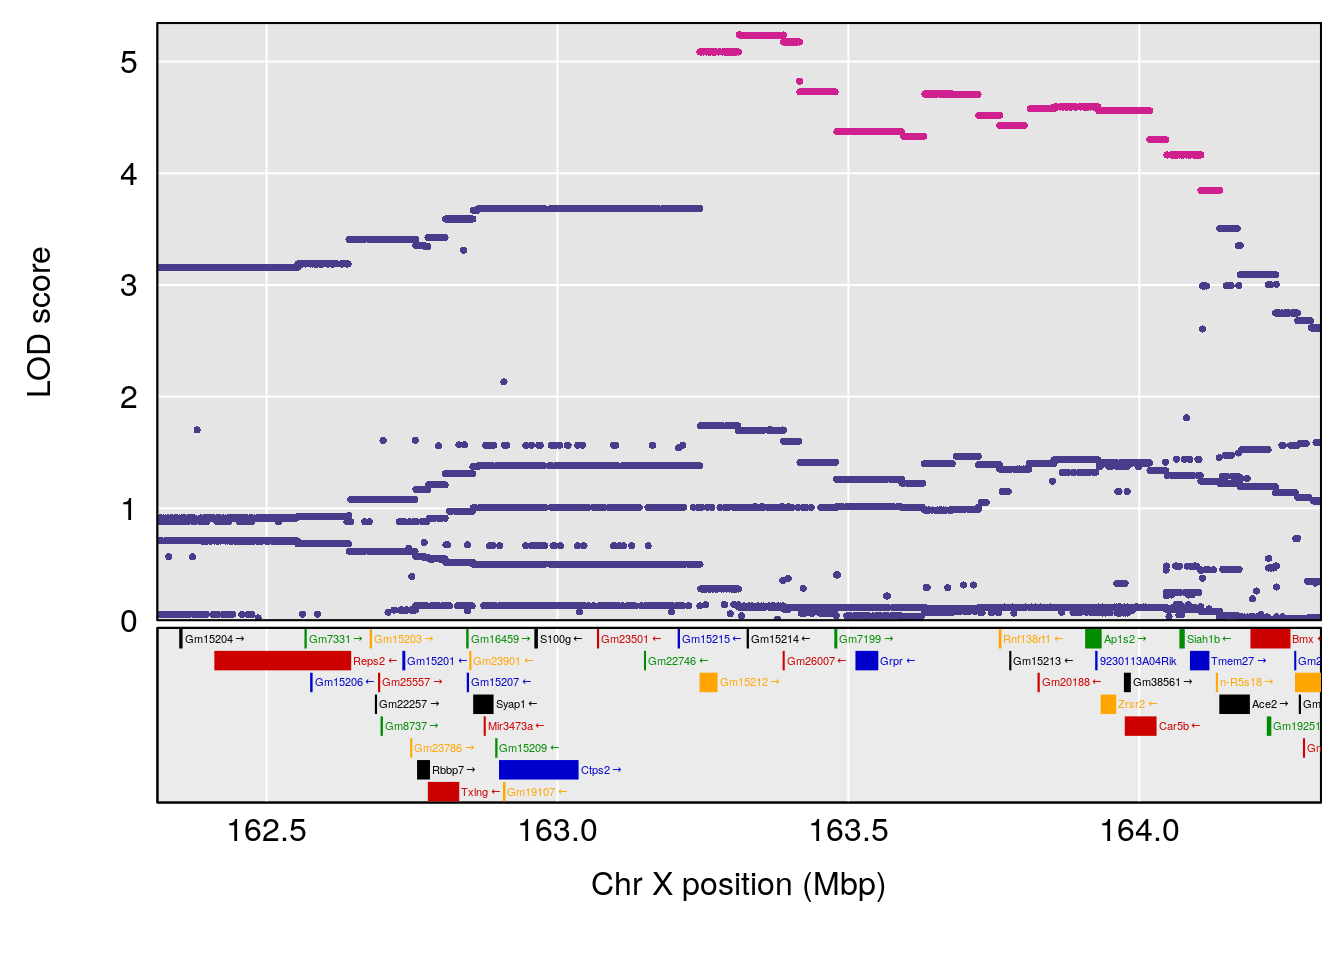
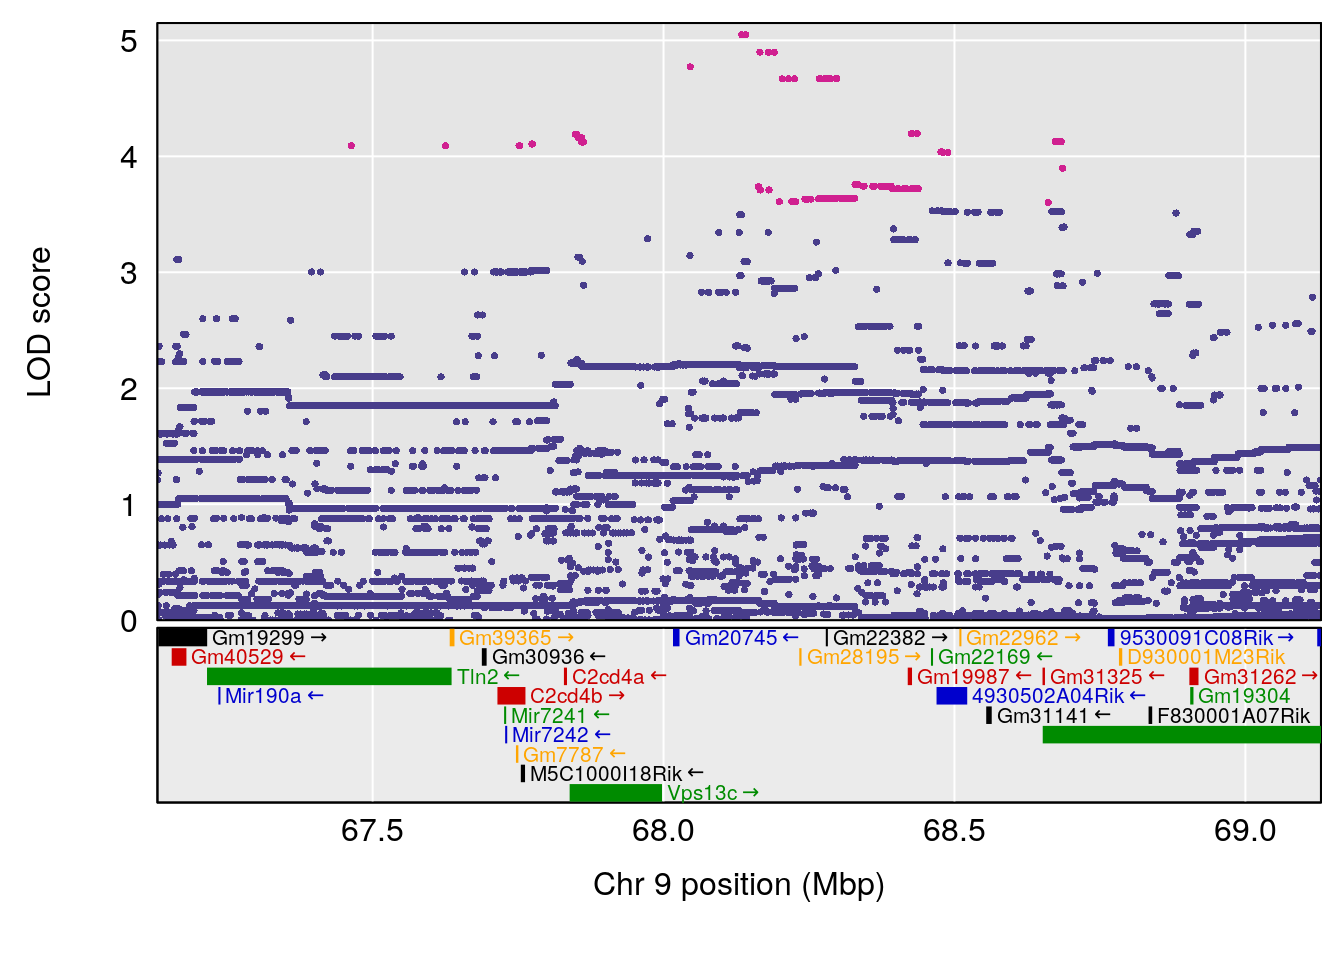
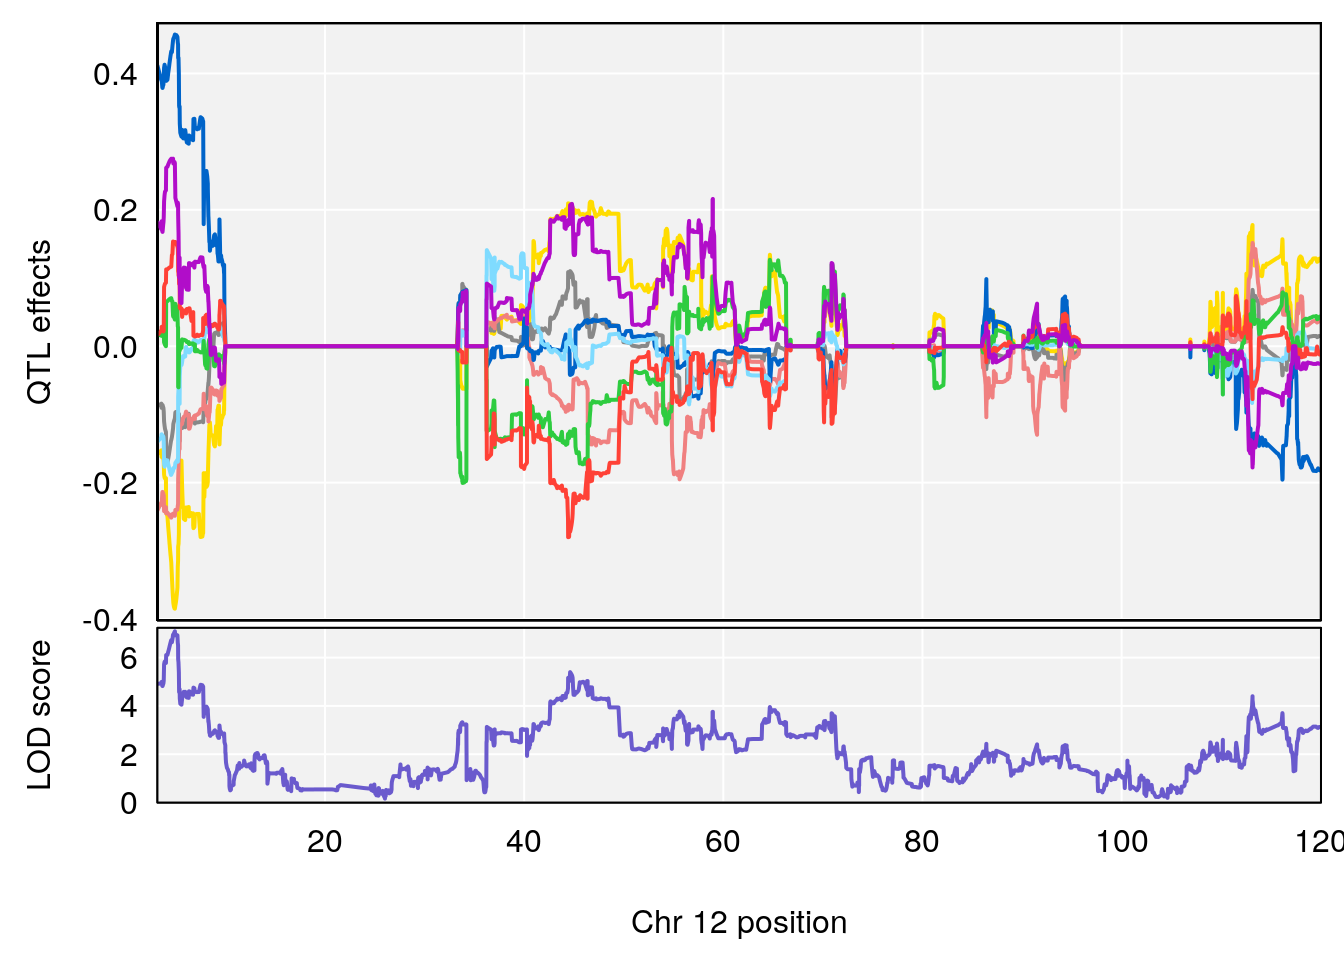
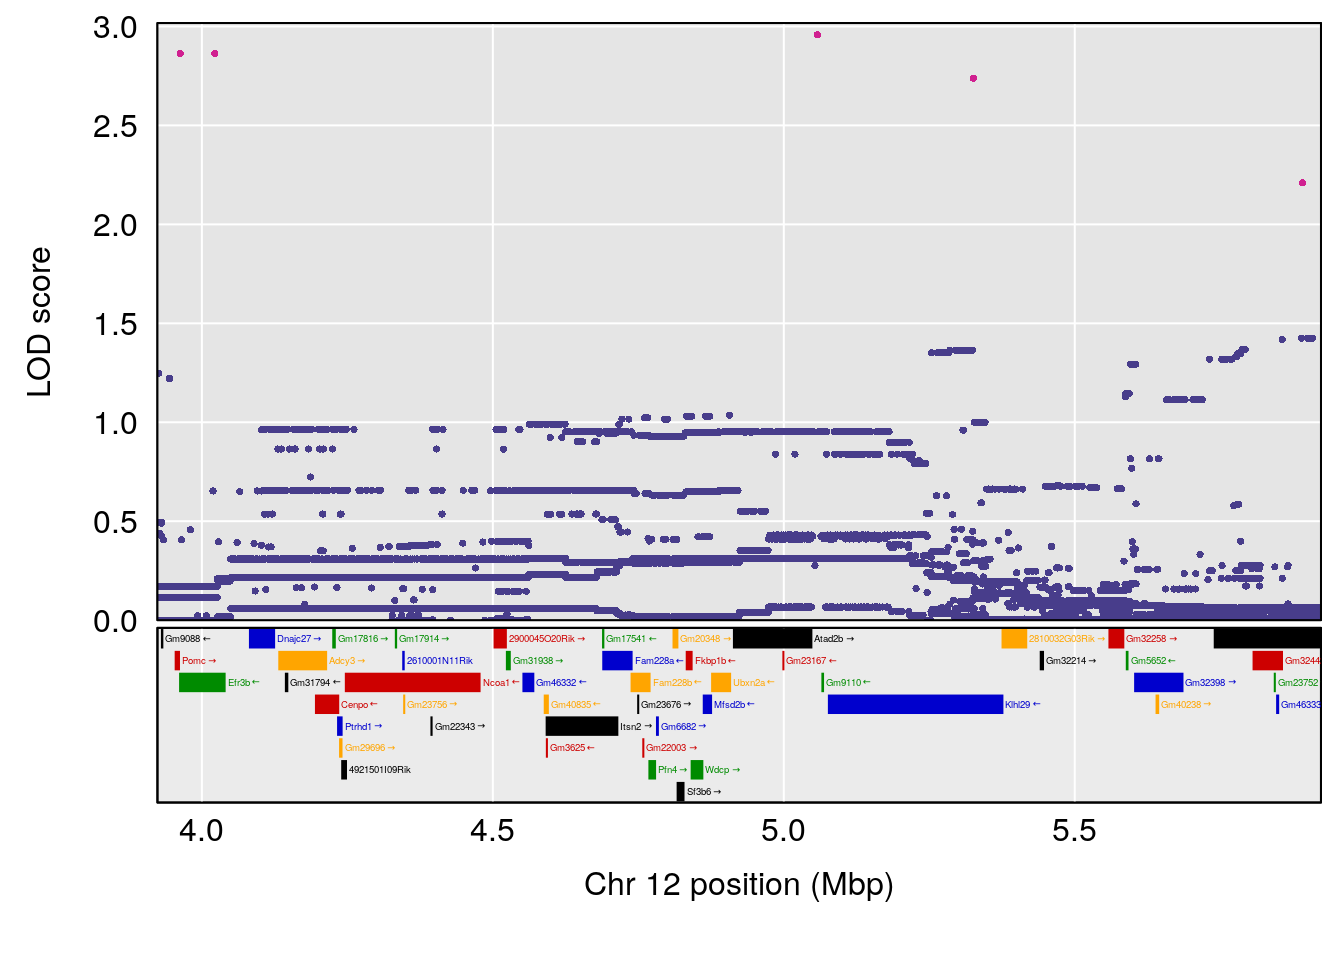
# [1] "Min.depression"
#   lodindex lodcolumn chr       pos      lod      ci_lo     ci_hi
# 1        1    pheno1   6  94.17733 6.736136  93.600320  94.87681
# 2        1    pheno1  12  12.26505 6.147825   9.396249  16.88098
# 3        1    pheno1  19  44.14928 6.171079  20.756178  55.72002
# 4        1    pheno1   X 163.26639 7.254464 162.637334 164.13916
# [1] 1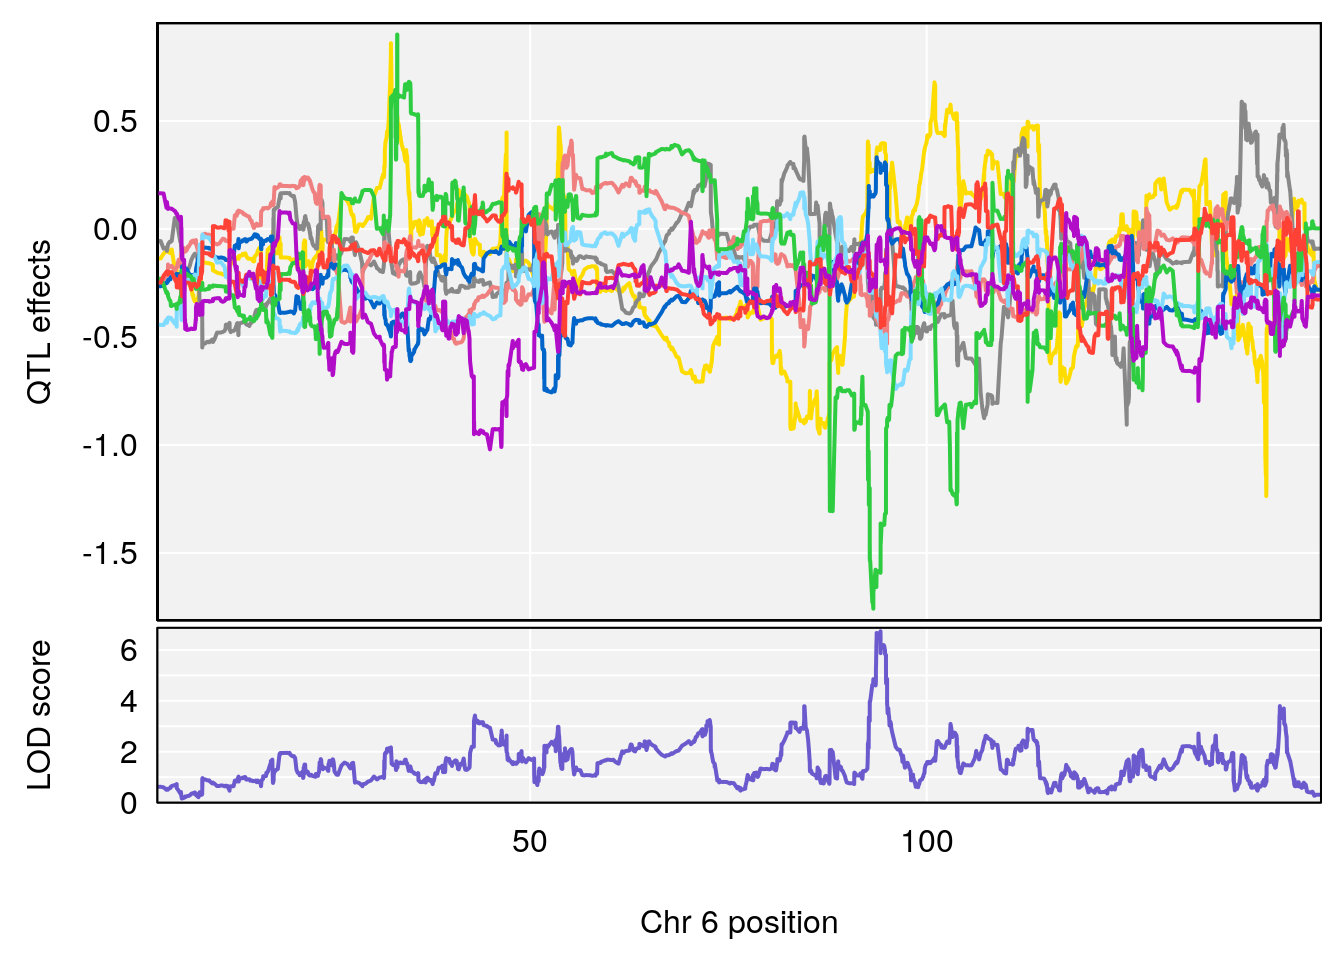
# [1] 2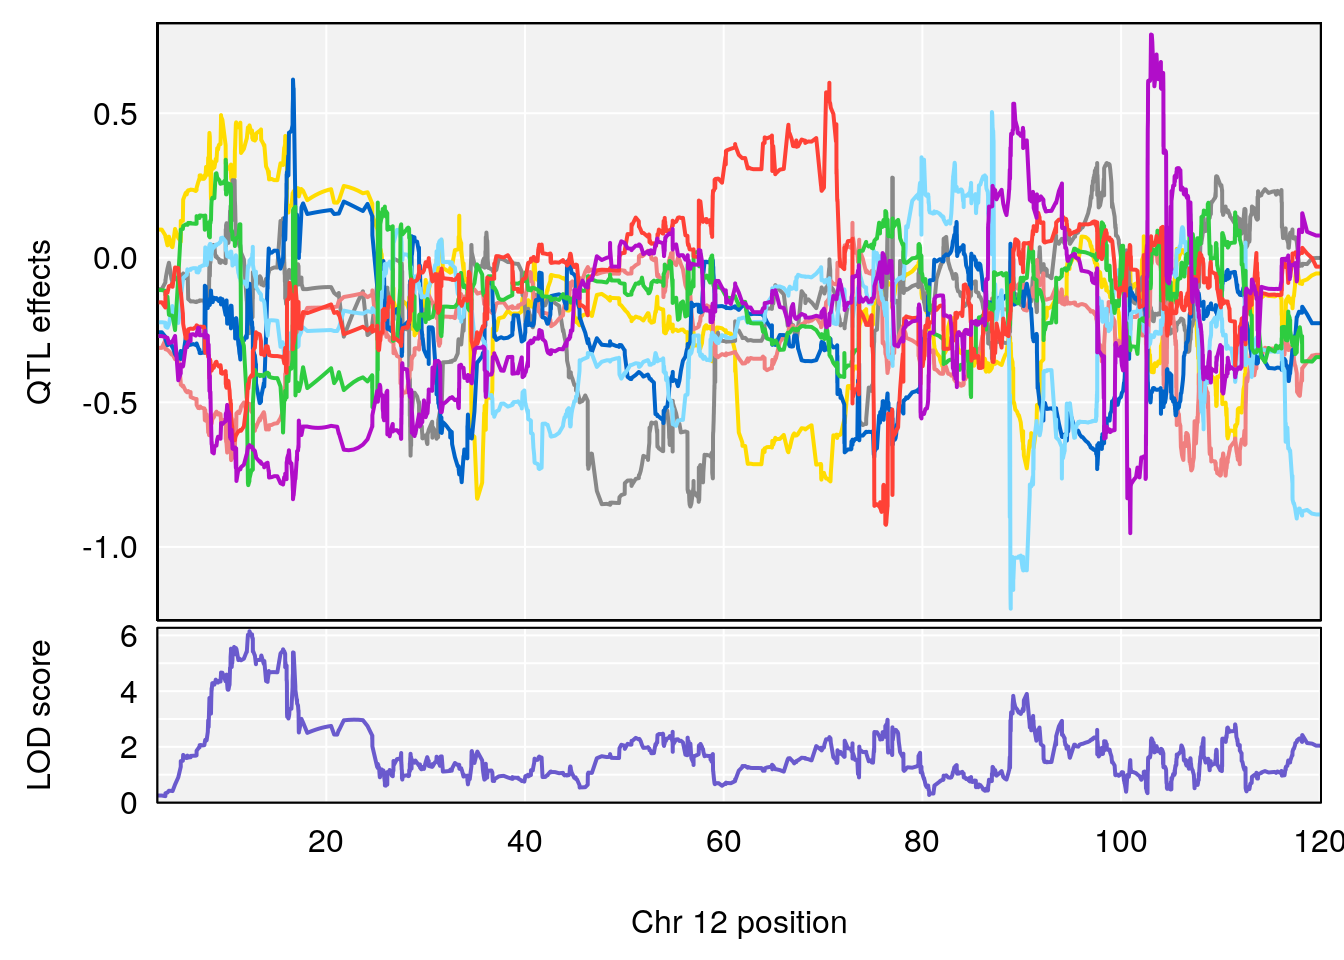
| Version | Author | Date |
|---|---|---|
| 9e4e3be | xhyuo | 2021-08-24 |
# [1] 3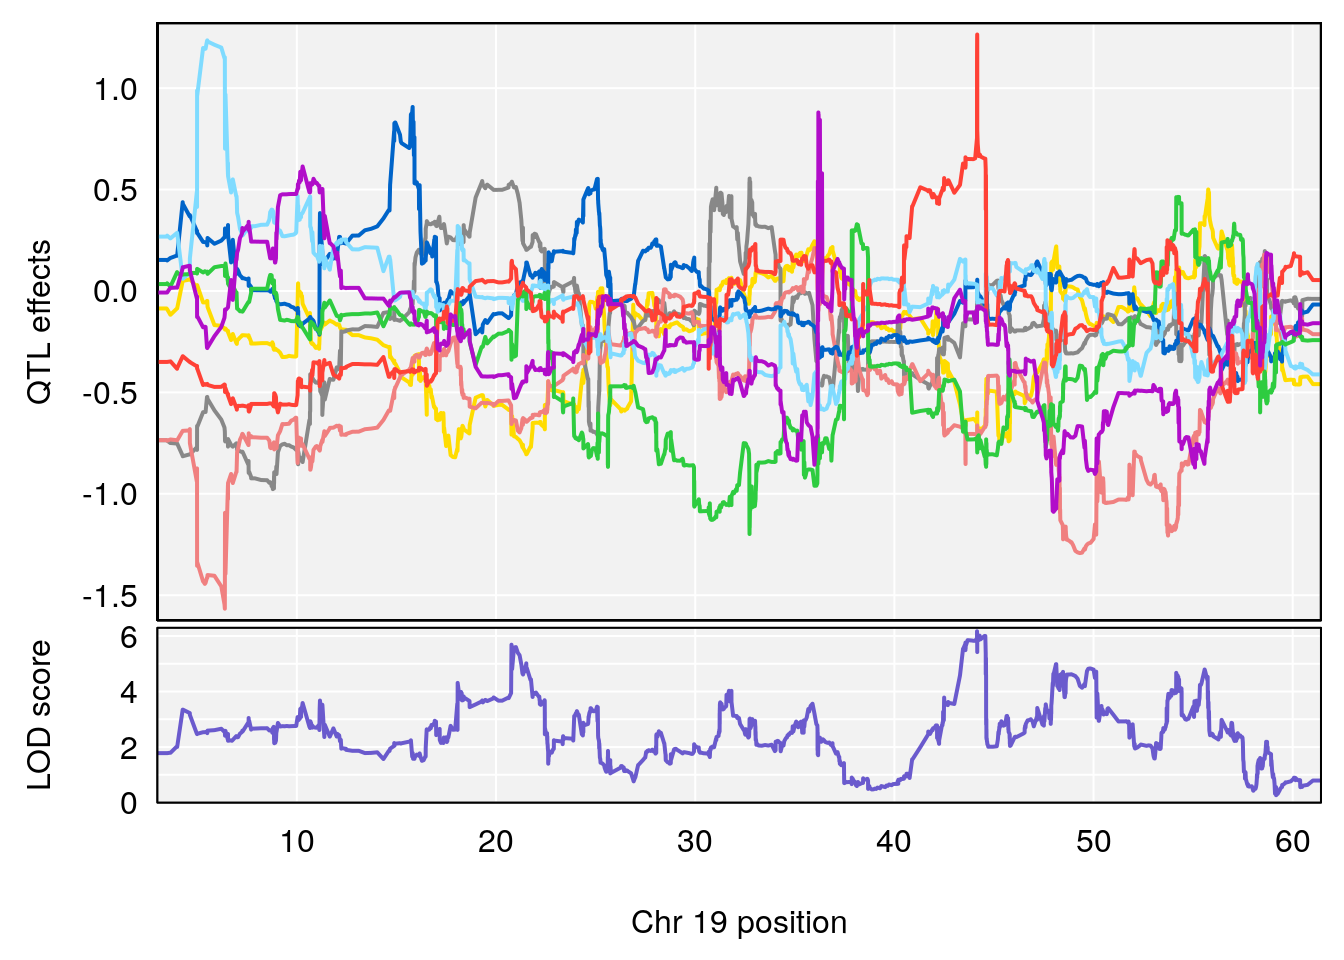
| Version | Author | Date |
|---|---|---|
| 9e4e3be | xhyuo | 2021-08-24 |
| Version | Author | Date |
|---|---|---|
| 9e4e3be | xhyuo | 2021-08-24 |
| Version | Author | Date |
|---|---|---|
| 9e4e3be | xhyuo | 2021-08-24 |
# [1] 4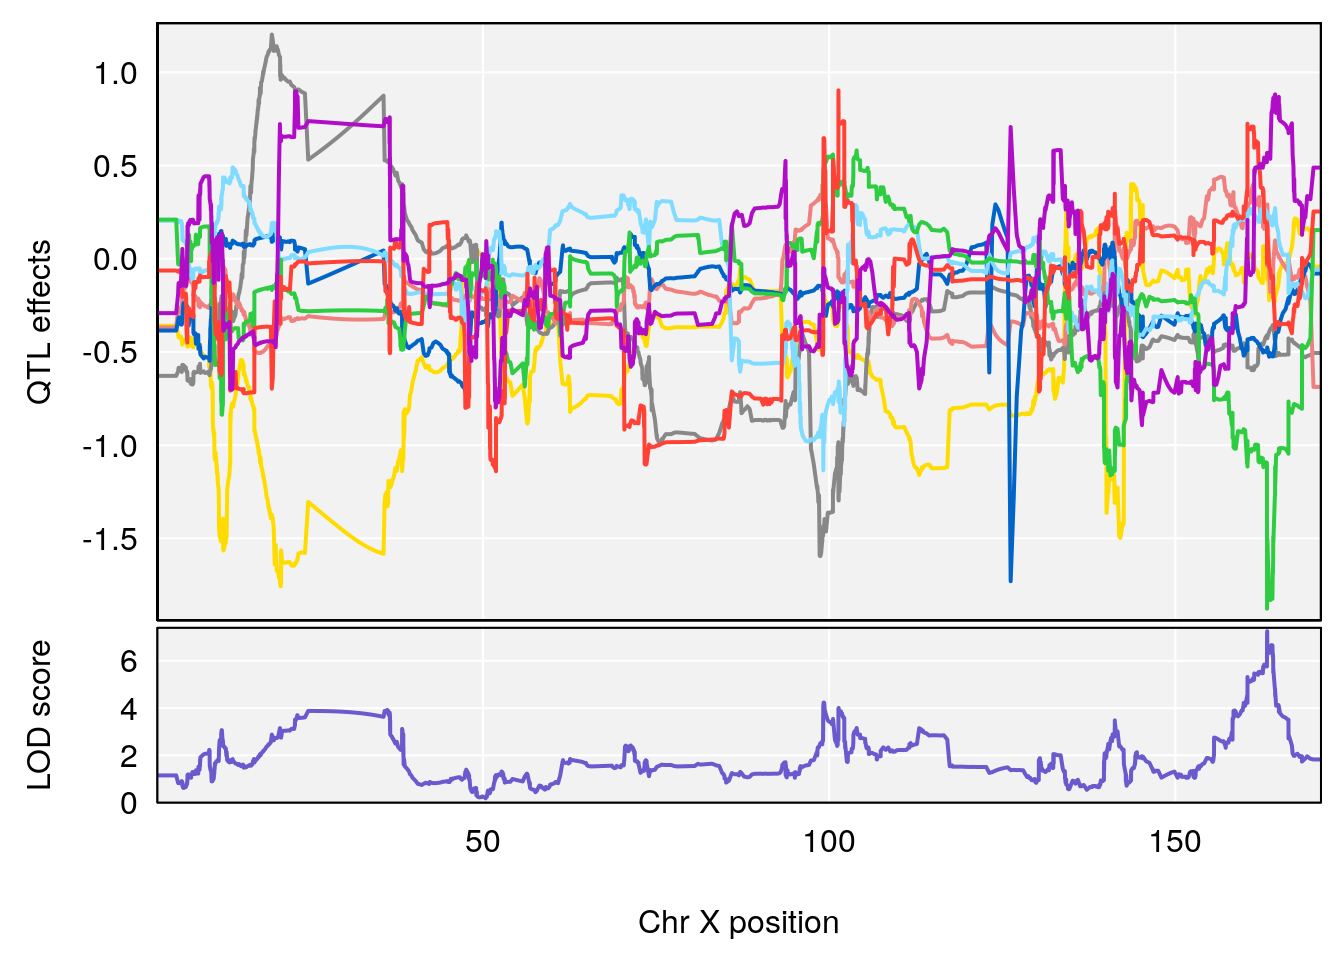
| Version | Author | Date |
|---|---|---|
| 9e4e3be | xhyuo | 2021-08-24 |
| Version | Author | Date |
|---|---|---|
| 9e4e3be | xhyuo | 2021-08-24 |
| Version | Author | Date |
|---|---|---|
| 9e4e3be | xhyuo | 2021-08-24 |
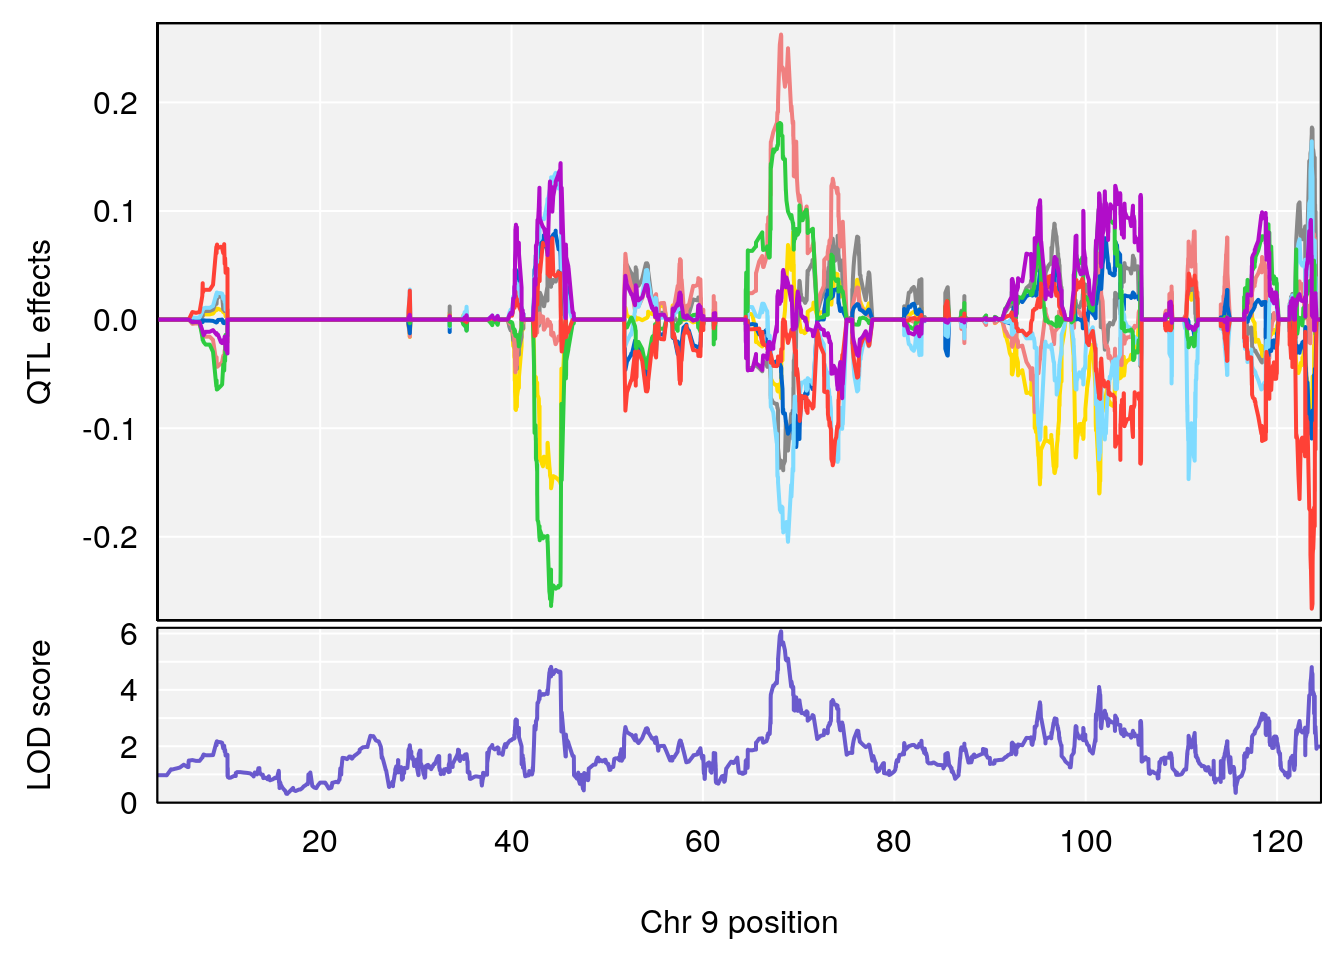
# [1] "Status_bin"
#   lodindex lodcolumn chr      pos      lod    ci_lo    ci_hi
# 1        1    pheno1   9 68.16325 6.081293 43.77453 123.6993
# [1] 1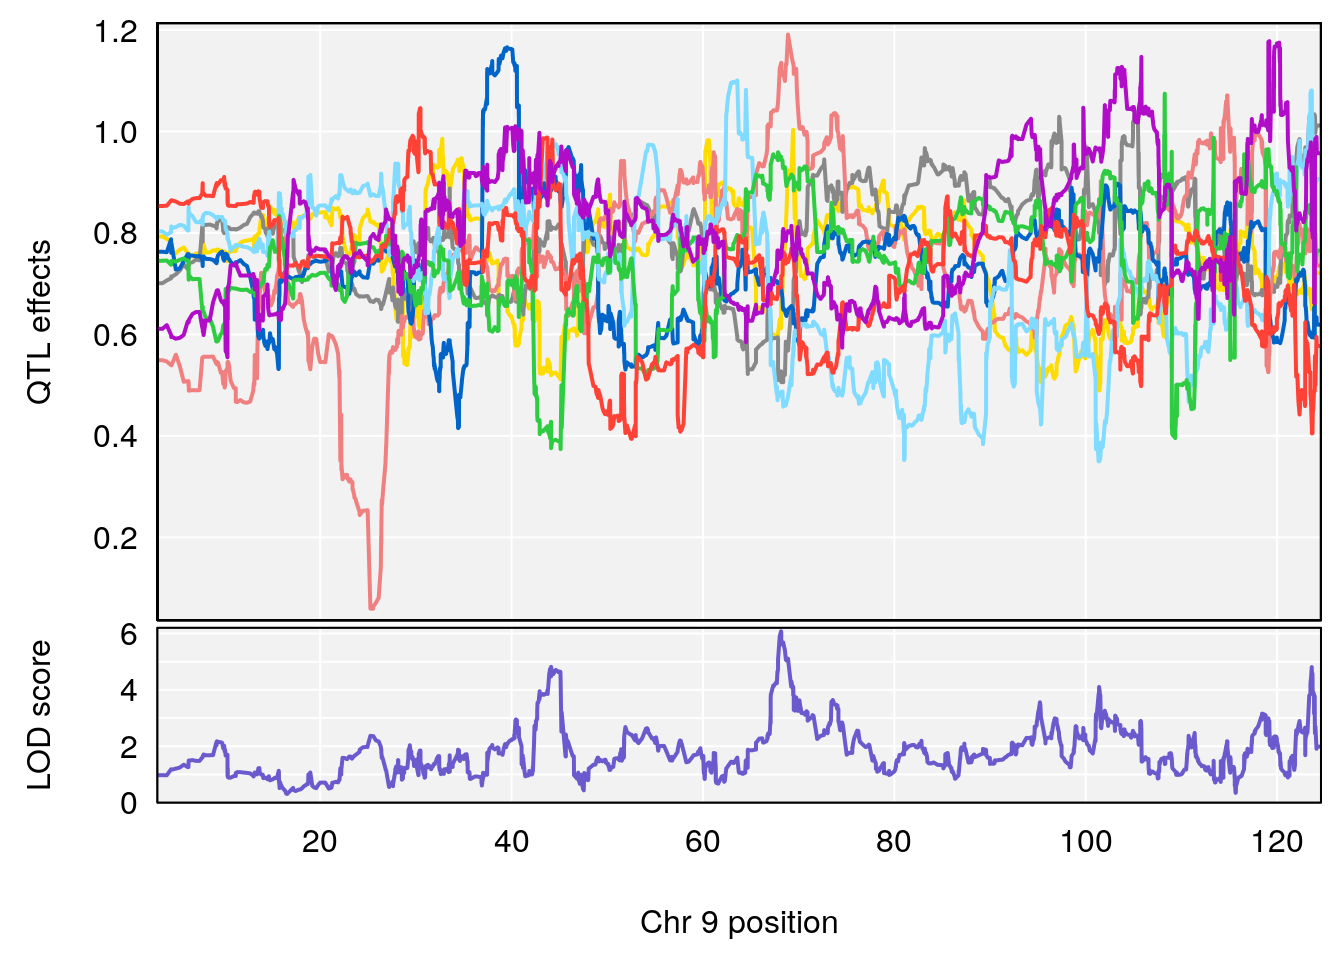
| Version | Author | Date |
|---|---|---|
| 9e4e3be | xhyuo | 2021-08-24 |
| Version | Author | Date |
|---|---|---|
| 9e4e3be | xhyuo | 2021-08-24 |
| Version | Author | Date |
|---|---|---|
| 9e4e3be | xhyuo | 2021-08-24 |
#save peaks coeff plot
for(i in names(qtl.morphine.out)){
  print(i)
  peaks <- find_peaks(qtl.morphine.out[[i]], map=pmap, threshold=6, drop=1.5)
  fname <- paste("output/DO_morphine_secondbatch_69k_",i,"_coefplot.pdf",sep="")
  pdf(file = fname, width = 16, height =8)
  for(p in 1:dim(peaks)[1]) {
    print(p)
    chr <-peaks[p,3]
    #coeff plot
    par(mar=c(4.1, 4.1, 0.6, 0.6))
    plot_coefCC(coef_c1[[i]][[p]], pmap[chr], scan1_output=qtl.morphine.out[[i]], bgcolor="gray95", legend=NULL)
    plot(out_snps[[i]][[p]]$lod, out_snps[[i]][[p]]$snpinfo, drop_hilit=1.5, genes=out_genes[[i]][[p]])
  }
  dev.off()
}
# [1] "Survival.Time"
# [1] 1
# [1] 2
# [1] "Recovery.Time"
# [1] 1
# [1] 2
# [1] 3
# [1] "Min.depression"
# [1] 1
# [1] 2
# [1] 3
# [1] 4
# [1] "Status_bin"
# [1] 1

#save peaks coeff blup plot
for(i in names(qtl.morphine.out)){
  print(i)
  peaks <- find_peaks(qtl.morphine.out[[i]], map=pmap, threshold=6, drop=1.5)
  fname <- paste("output/DO_morphine_secondbatch_69k_",i,"_coefplot_blup.pdf",sep="")
  pdf(file = fname, width = 16, height =8)
  for(p in 1:dim(peaks)[1]) {
    print(p)
    chr <-peaks[p,3]
    #coeff plot
    par(mar=c(4.1, 4.1, 0.6, 0.6))
    plot_coefCC(coef_c2[[i]][[p]], pmap[chr], scan1_output=qtl.morphine.out[[i]], bgcolor="gray95", legend=NULL)
    plot(out_snps[[i]][[p]]$lod, out_snps[[i]][[p]]$snpinfo, drop_hilit=1.5, genes=out_genes[[i]][[p]])
  }
  dev.off()
}
# [1] "Survival.Time"
# [1] 1
# [1] 2
# [1] "Recovery.Time"
# [1] 1
# [1] 2
# [1] 3
# [1] "Min.depression"
# [1] 1
# [1] 2
# [1] 3
# [1] 4
# [1] "Status_bin"
# [1] 1
Plot qtl mapping on array male
load("output/qtl.morphine.out.second_set.male.RData")
#pmap and gmap
chr.names <- c("1","2","3","4","5","6","7","8","9","10","11","12","13","14","15","16","17","18","19", "X")
gmap <- list()
pmap <- list()
for (chr in chr.names){
  gmap[[chr]] <-  do.morphine$gmap[[chr]]
  pmap[[chr]] <-  do.morphine$pmap[[chr]]
}
attr(gmap, "is_x_chr") <- structure(c(rep(FALSE,19),TRUE), names=1:20)
attr(pmap, "is_x_chr") <- structure(c(rep(FALSE,19),TRUE), names=1:20)

#genome-wide plot
for(i in names(qtl.morphine.out)){
  par(mar=c(5.1, 4.1, 1.1, 1.1))
  ymx <- maxlod(qtl.morphine.out[[i]]) # overall maximum LOD score
  plot(qtl.morphine.out[[i]], map=pmap, lodcolumn=1, col="slateblue", ylim=c(0, max(sapply(qtl.morphine.out, maxlod)) +2))
  abline(h=summary(qtl.morphine.operm[[i]], alpha=c(0.10, 0.05, 0.01))[[1]], col="red")
  abline(h=summary(qtl.morphine.operm[[i]], alpha=c(0.10, 0.05, 0.01))[[2]], col="red")
  abline(h=summary(qtl.morphine.operm[[i]], alpha=c(0.10, 0.05, 0.01))[[3]], col="red")
  title(main = paste0("DO_morphine_",i))
}
| Version | Author | Date |
|---|---|---|
| 8fe8543 | xhyuo | 2023-02-20 |

| Version | Author | Date |
|---|---|---|
| 8fe8543 | xhyuo | 2023-02-20 |
| Version | Author | Date |
|---|---|---|
| 8fe8543 | xhyuo | 2023-02-20 |
| Version | Author | Date |
|---|---|---|
| 8fe8543 | xhyuo | 2023-02-20 |
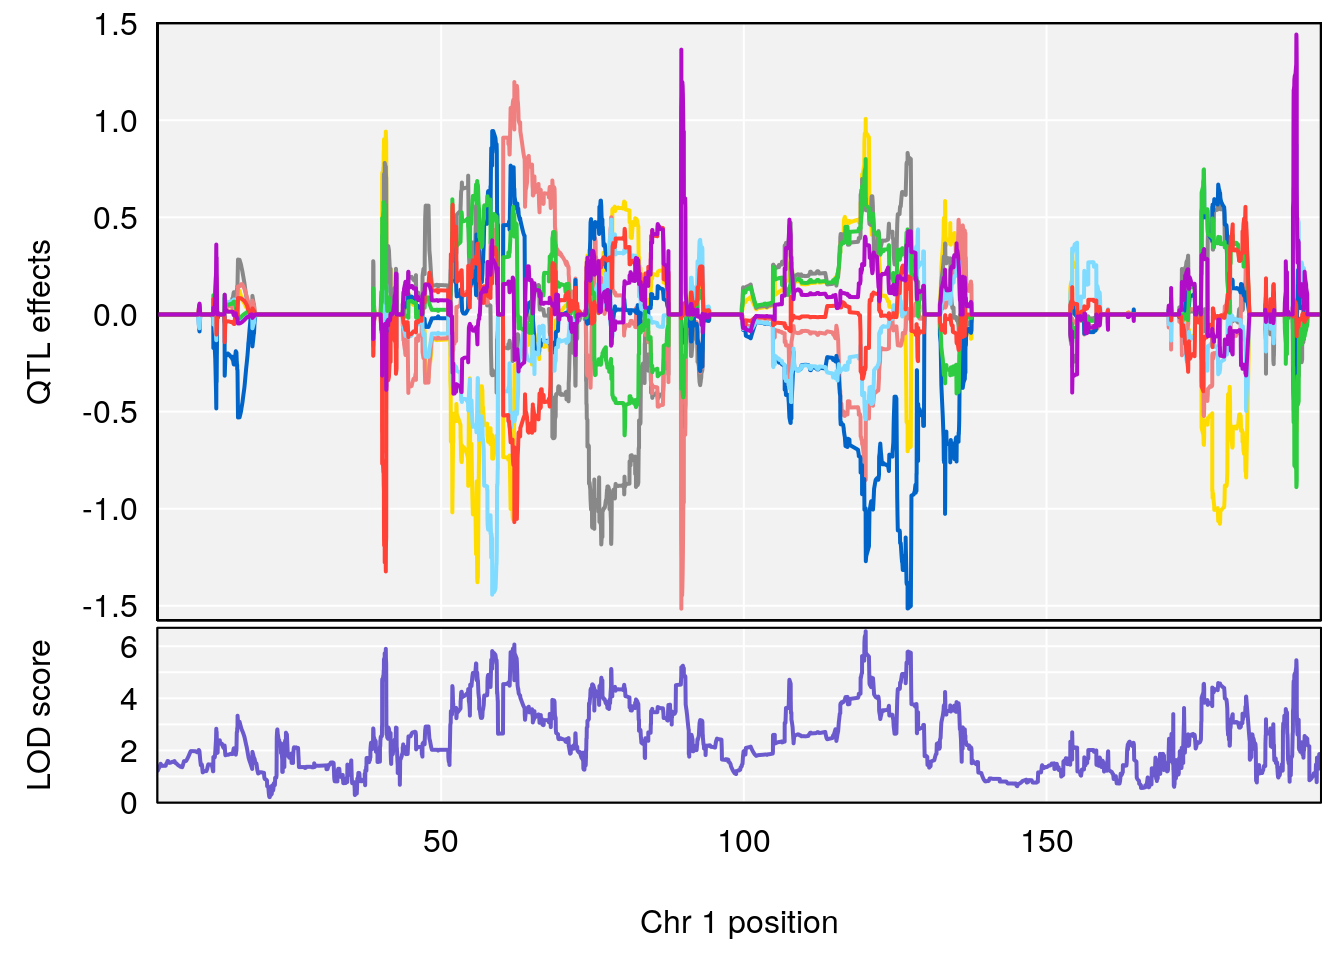
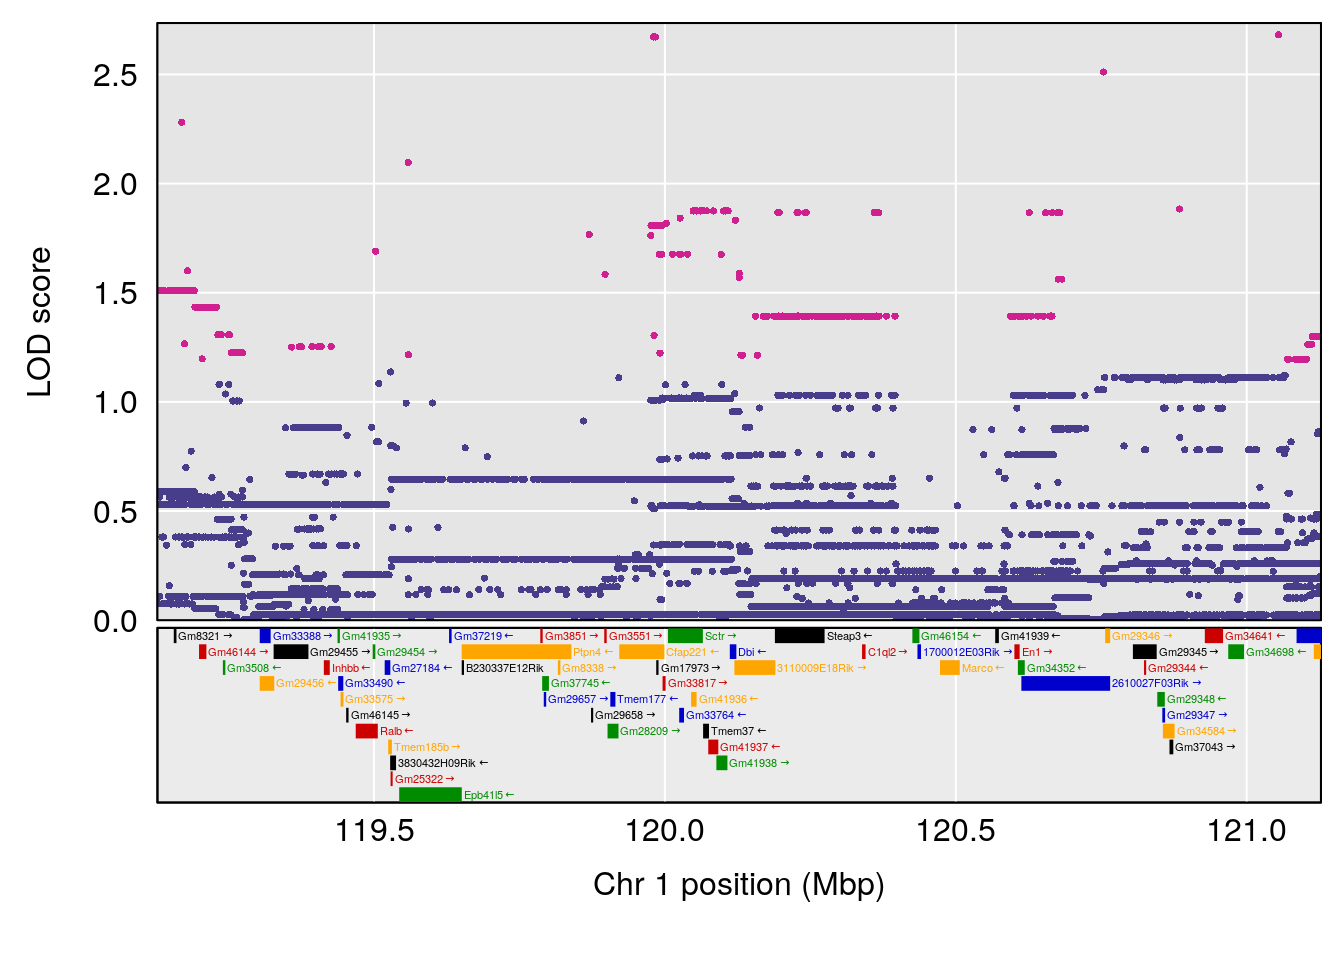
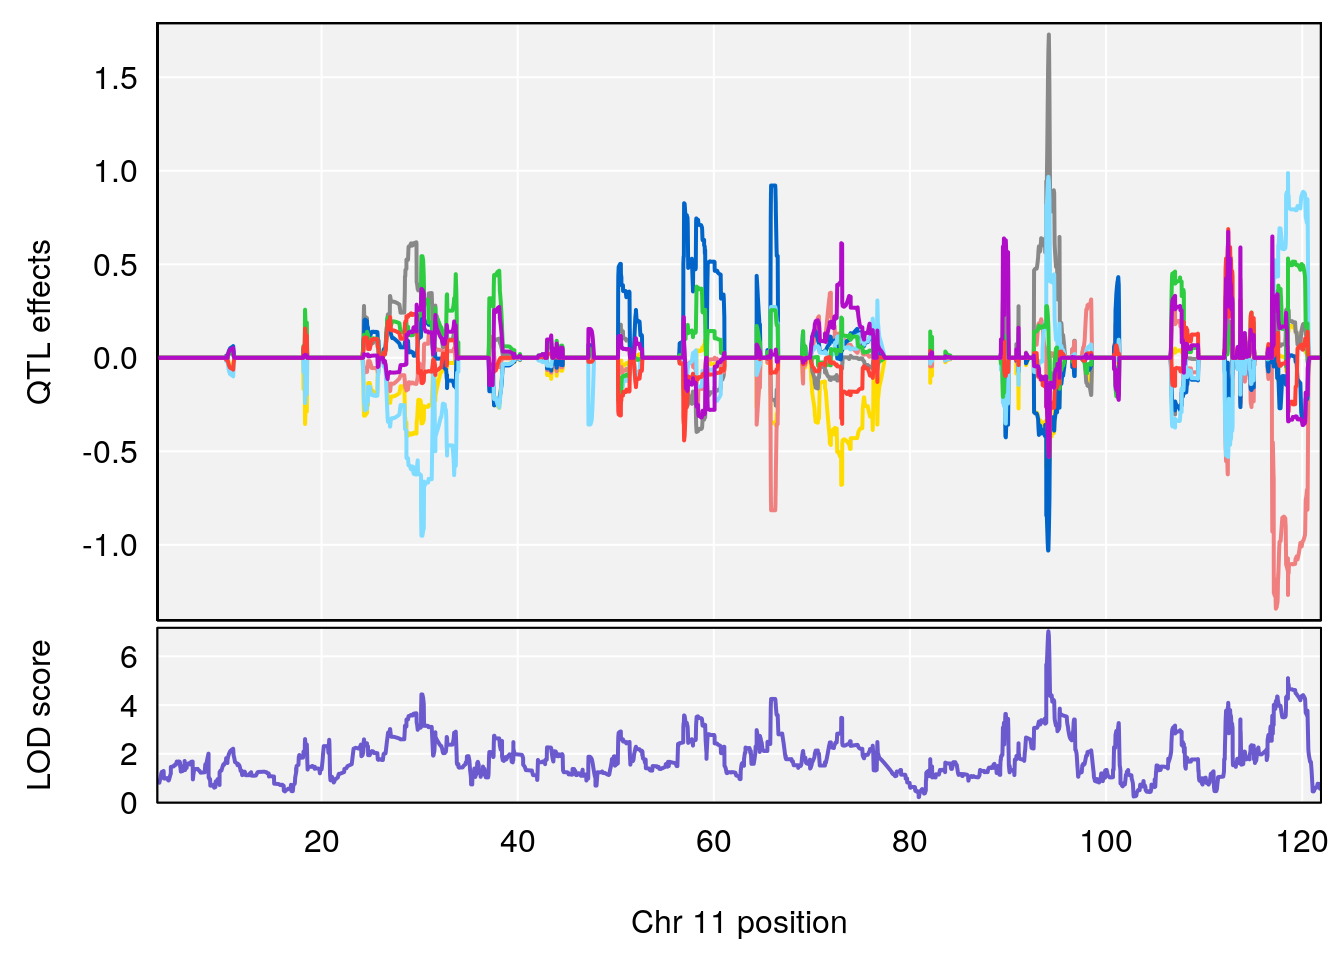
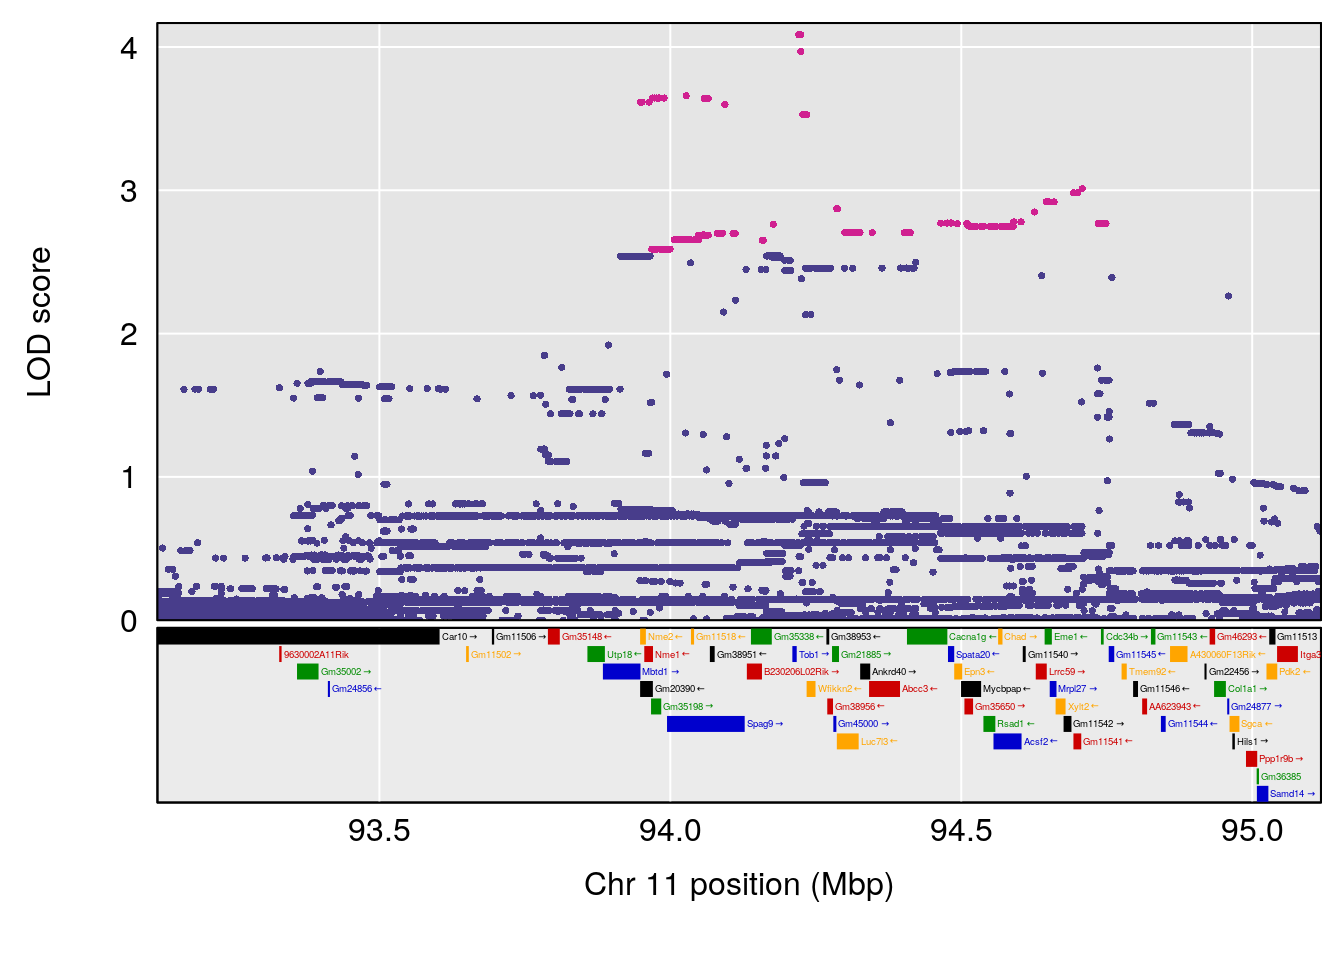
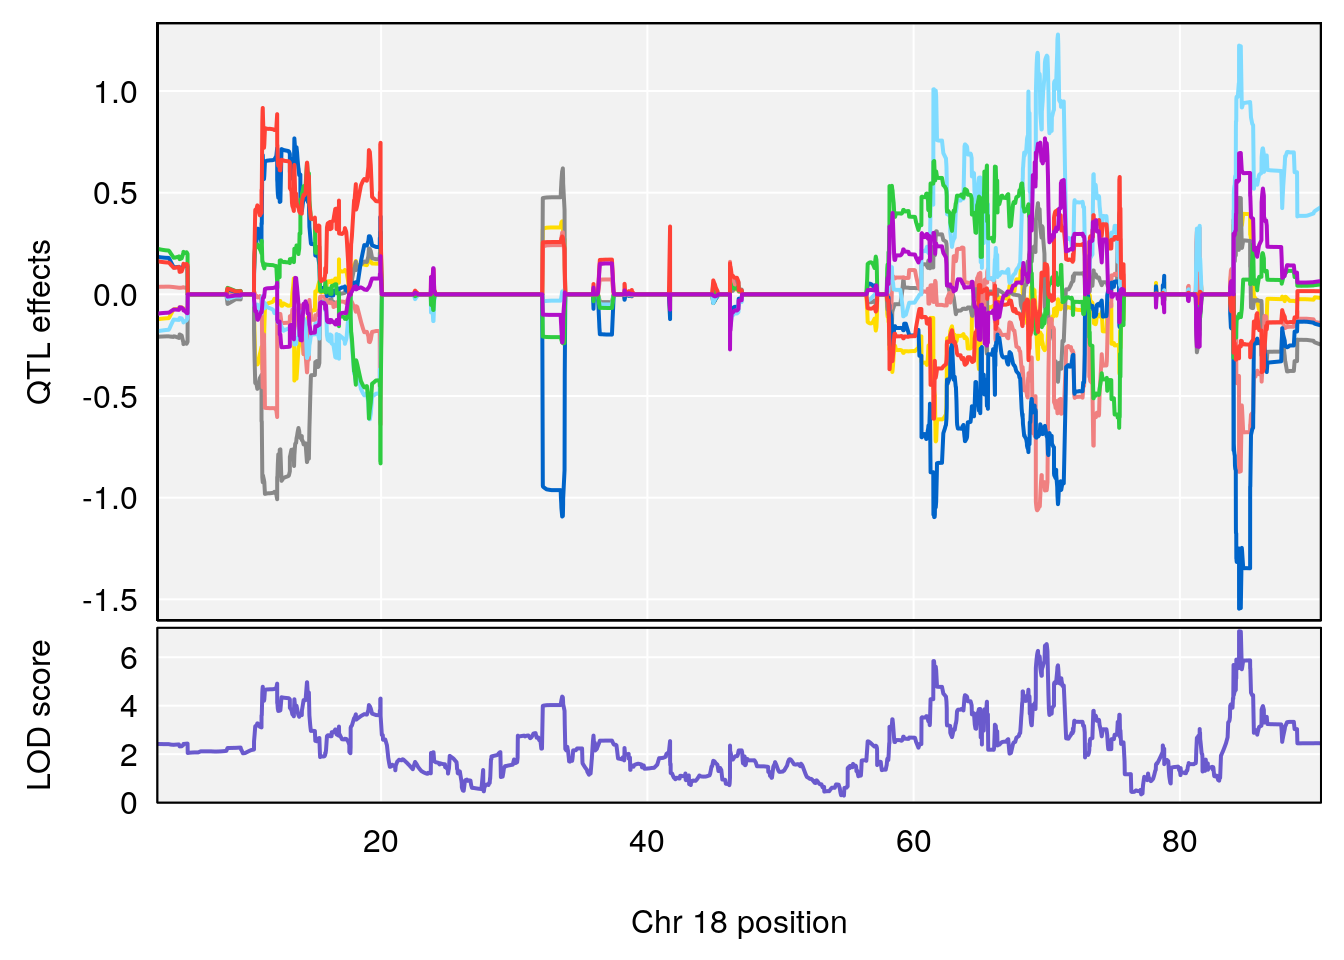
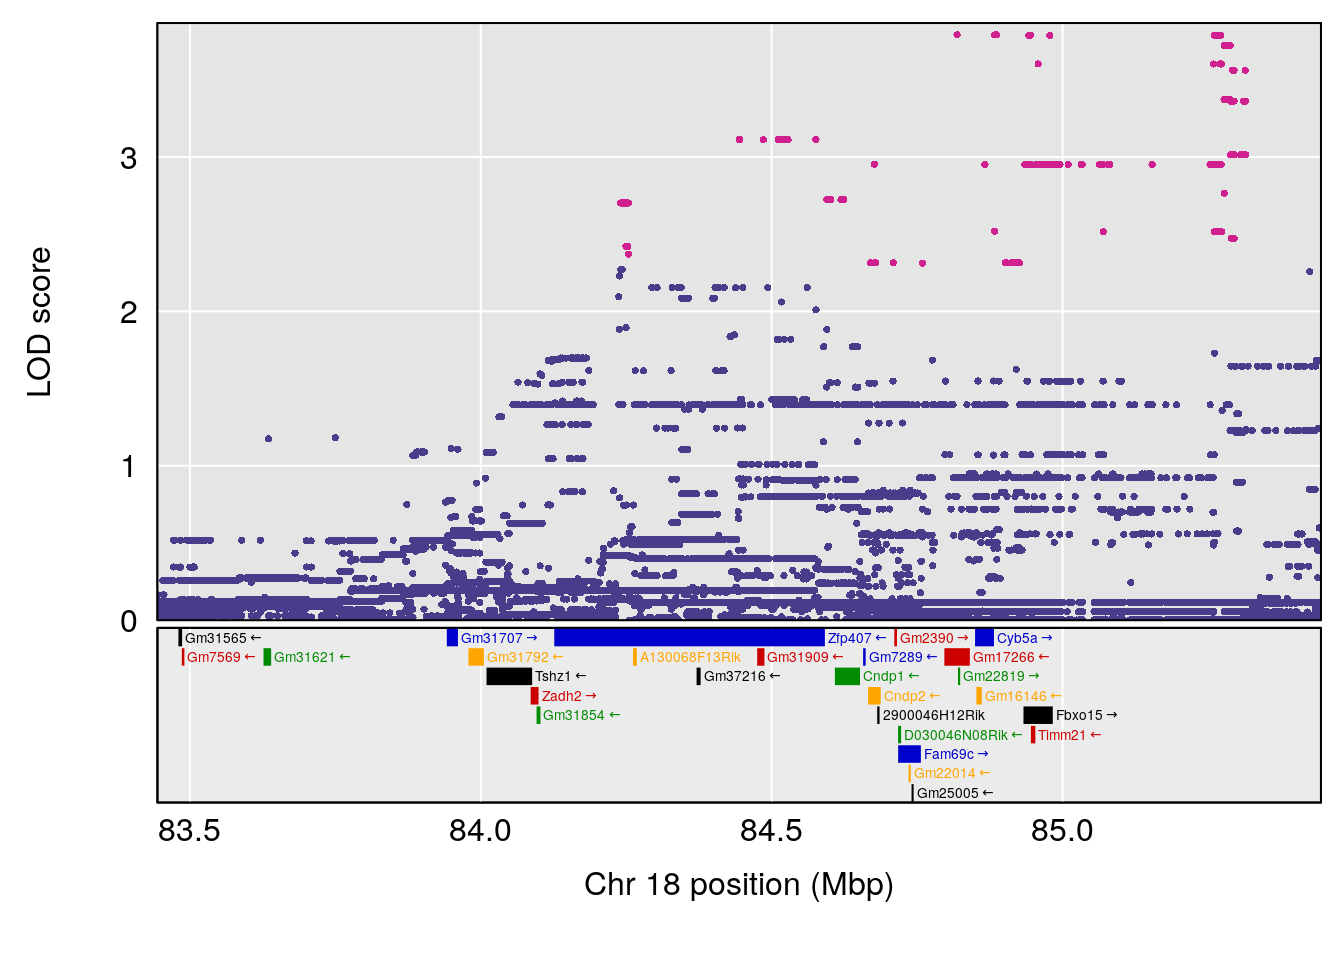
#peaks coeff plot
for(i in names(qtl.morphine.out)){
  print(i)
  peaks <- find_peaks(qtl.morphine.out[[i]], map=pmap, threshold=6, drop=1.5)
  print(peaks)
  for(p in 1:dim(peaks)[1]) {
    print(p)
    chr <-peaks[p,3]
    #coeff plot
    par(mar=c(4.1, 4.1, 0.6, 0.6))
    plot_coefCC(coef_c1[[i]][[p]], pmap[chr], scan1_output=qtl.morphine.out[[i]], bgcolor="gray95", legend=NULL)
    plot_coefCC(coef_c2[[i]][[p]], pmap[chr], scan1_output=qtl.morphine.out[[i]], bgcolor="gray95", legend=NULL)
    plot(out_snps[[i]][[p]]$lod, out_snps[[i]][[p]]$snpinfo, drop_hilit=1.5, genes=out_genes[[i]][[p]])
  }
}
# [1] "Survival.Time"
#   lodindex lodcolumn chr       pos      lod     ci_lo     ci_hi
# 1        1    pheno1   1 120.12762 6.572499  40.49547 191.33153
# 2        1    pheno1   3 125.94945 6.714517 107.22292 127.25264
# 3        1    pheno1   6  93.28072 6.085423  92.70653 139.26401
# 4        1    pheno1  10  77.27719 6.883233  55.59002  78.16454
# 5        1    pheno1  11  94.11858 7.028132  93.89976  94.27434
# 6        1    pheno1  18  84.44421 7.071786  61.47853  85.27749
# 7        1    pheno1  19  11.86392 6.344164  11.74479  17.03980
# [1] 1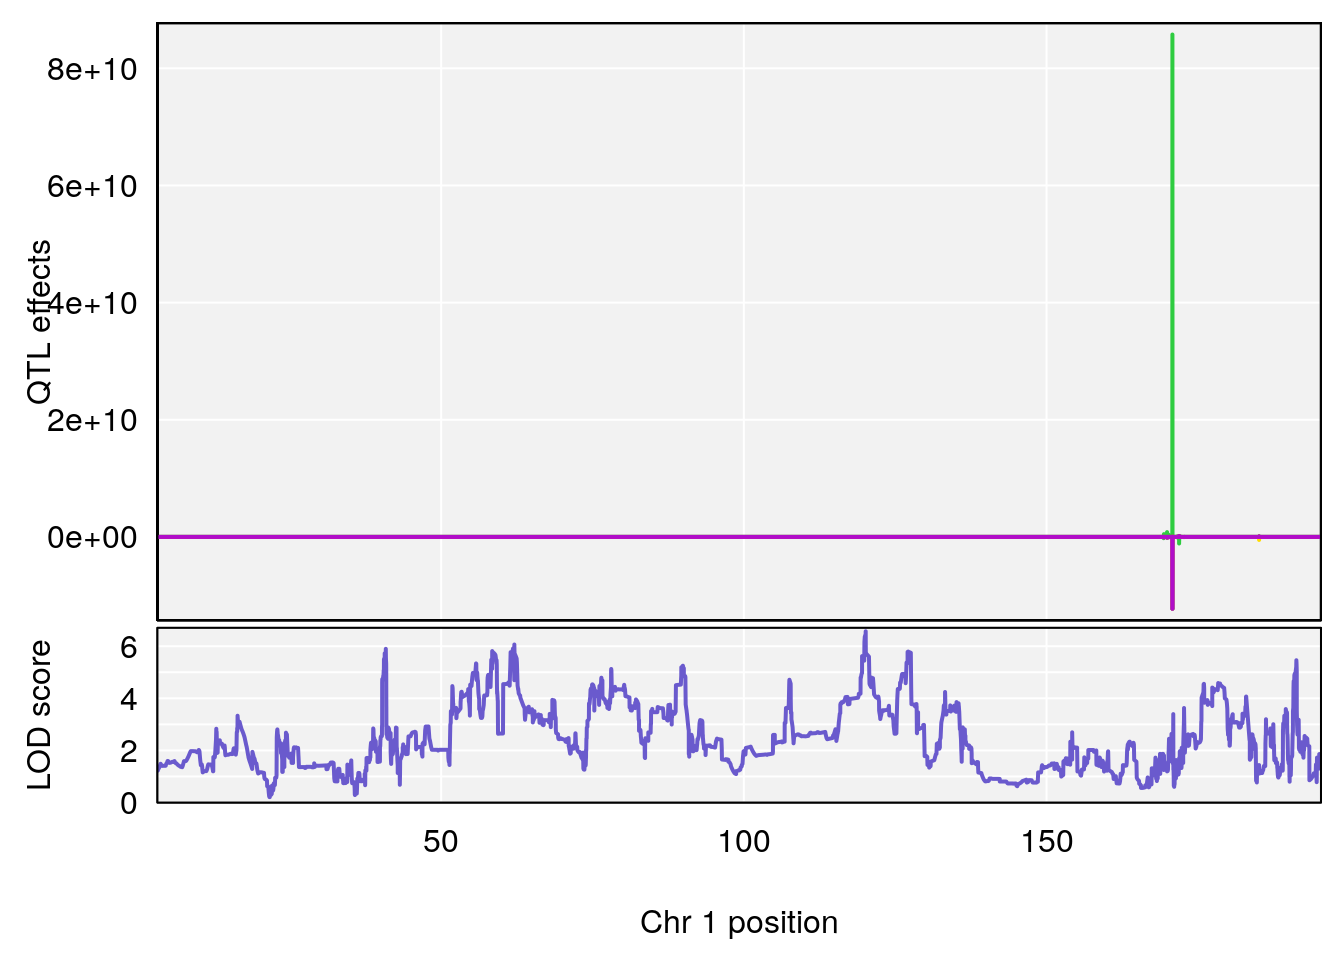
| Version | Author | Date |
|---|---|---|
| 8fe8543 | xhyuo | 2023-02-20 |
| Version | Author | Date |
|---|---|---|
| 8fe8543 | xhyuo | 2023-02-20 |
| Version | Author | Date |
|---|---|---|
| 8fe8543 | xhyuo | 2023-02-20 |
# [1] 2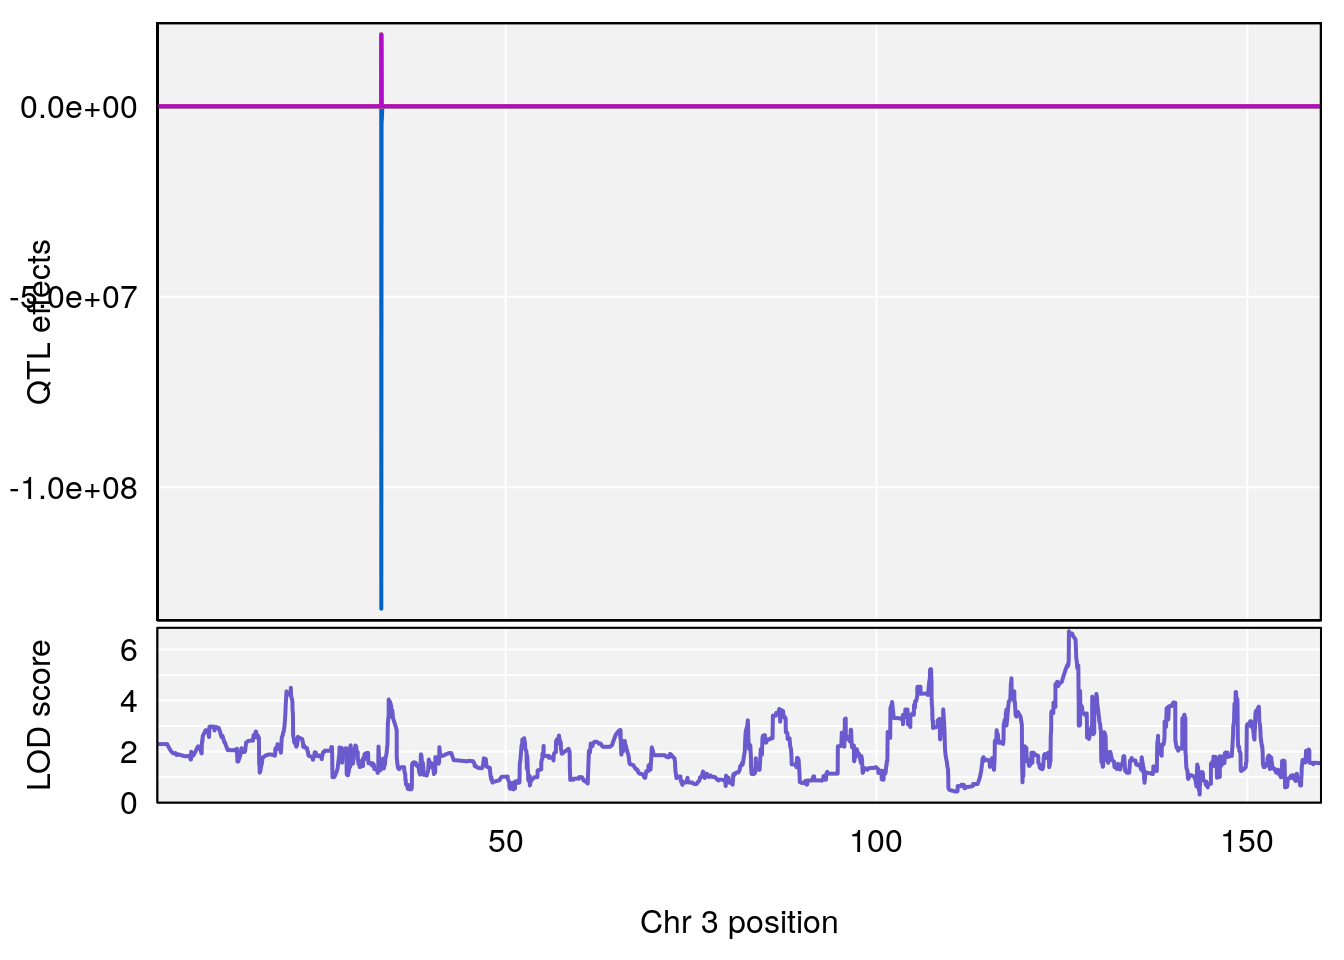
| Version | Author | Date |
|---|---|---|
| 8fe8543 | xhyuo | 2023-02-20 |
| Version | Author | Date |
|---|---|---|
| 8fe8543 | xhyuo | 2023-02-20 |
| Version | Author | Date |
|---|---|---|
| 8fe8543 | xhyuo | 2023-02-20 |
# [1] 3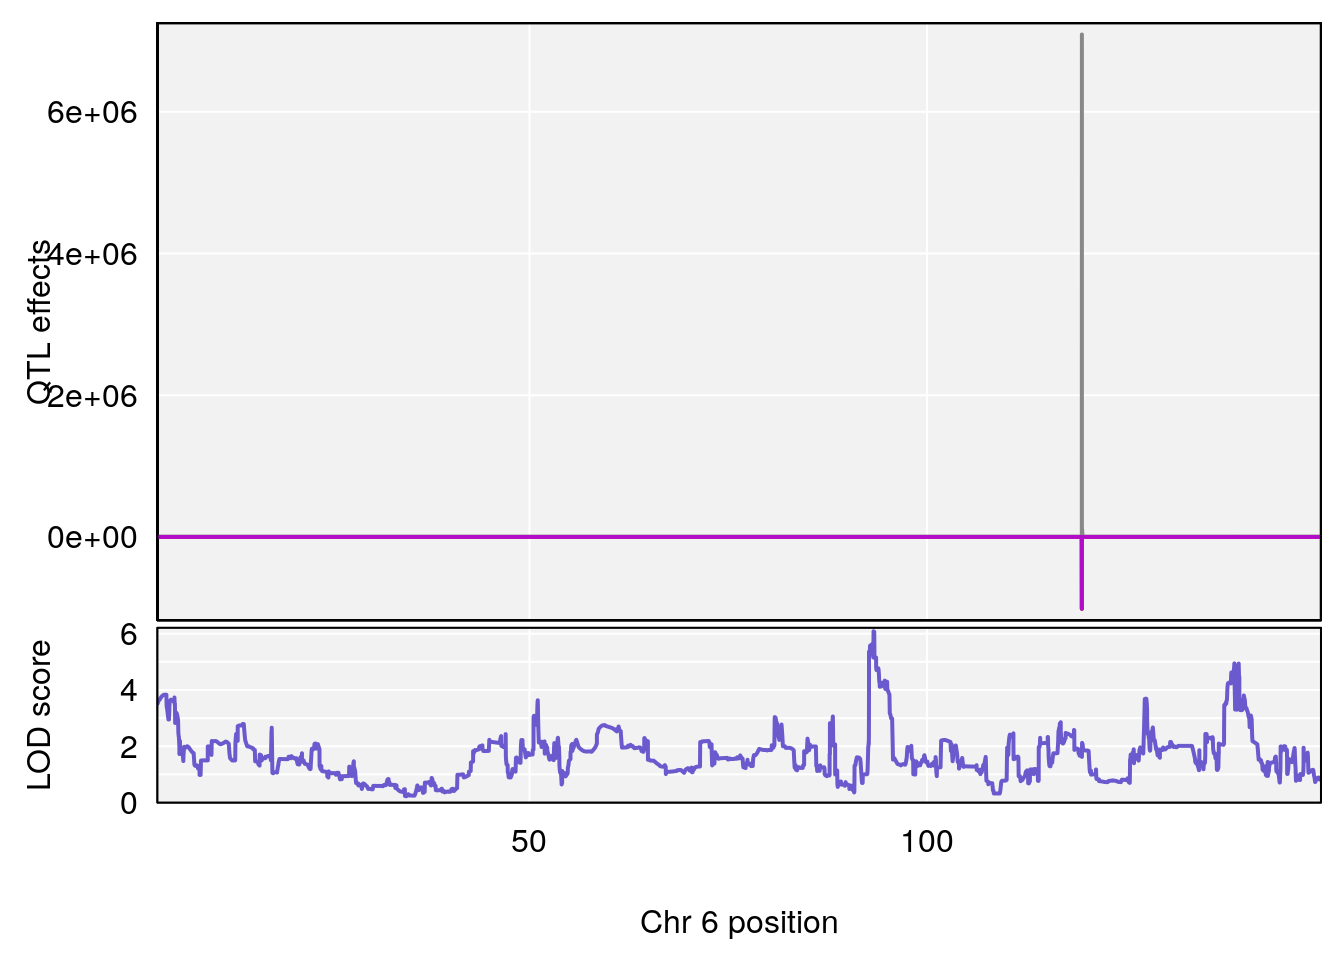
| Version | Author | Date |
|---|---|---|
| 8fe8543 | xhyuo | 2023-02-20 |
| Version | Author | Date |
|---|---|---|
| 8fe8543 | xhyuo | 2023-02-20 |
| Version | Author | Date |
|---|---|---|
| 8fe8543 | xhyuo | 2023-02-20 |
# [1] 4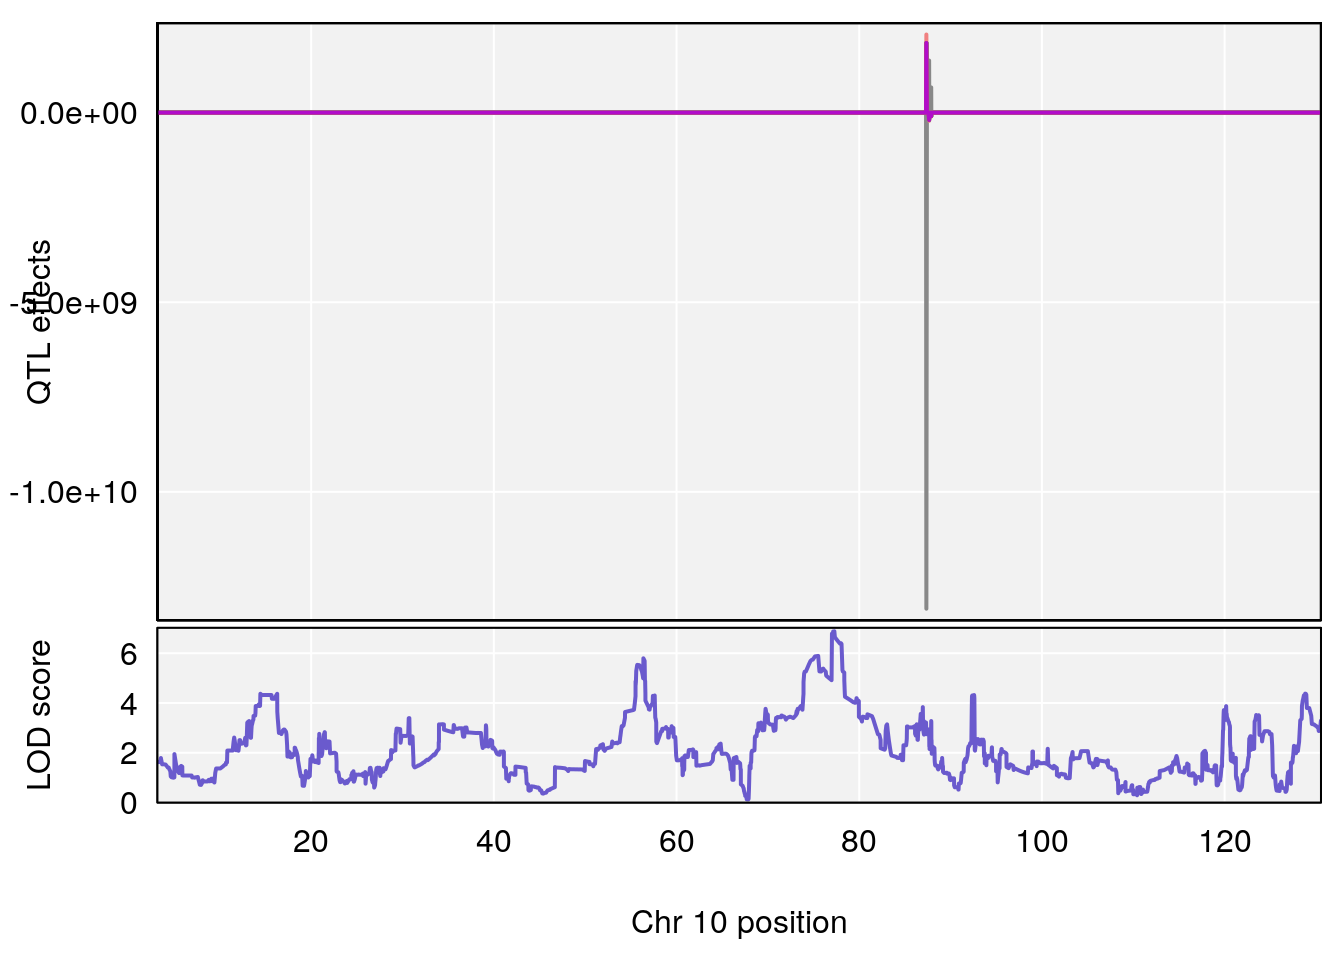
| Version | Author | Date |
|---|---|---|
| 8fe8543 | xhyuo | 2023-02-20 |
| Version | Author | Date |
|---|---|---|
| 8fe8543 | xhyuo | 2023-02-20 |
| Version | Author | Date |
|---|---|---|
| 8fe8543 | xhyuo | 2023-02-20 |
# [1] 5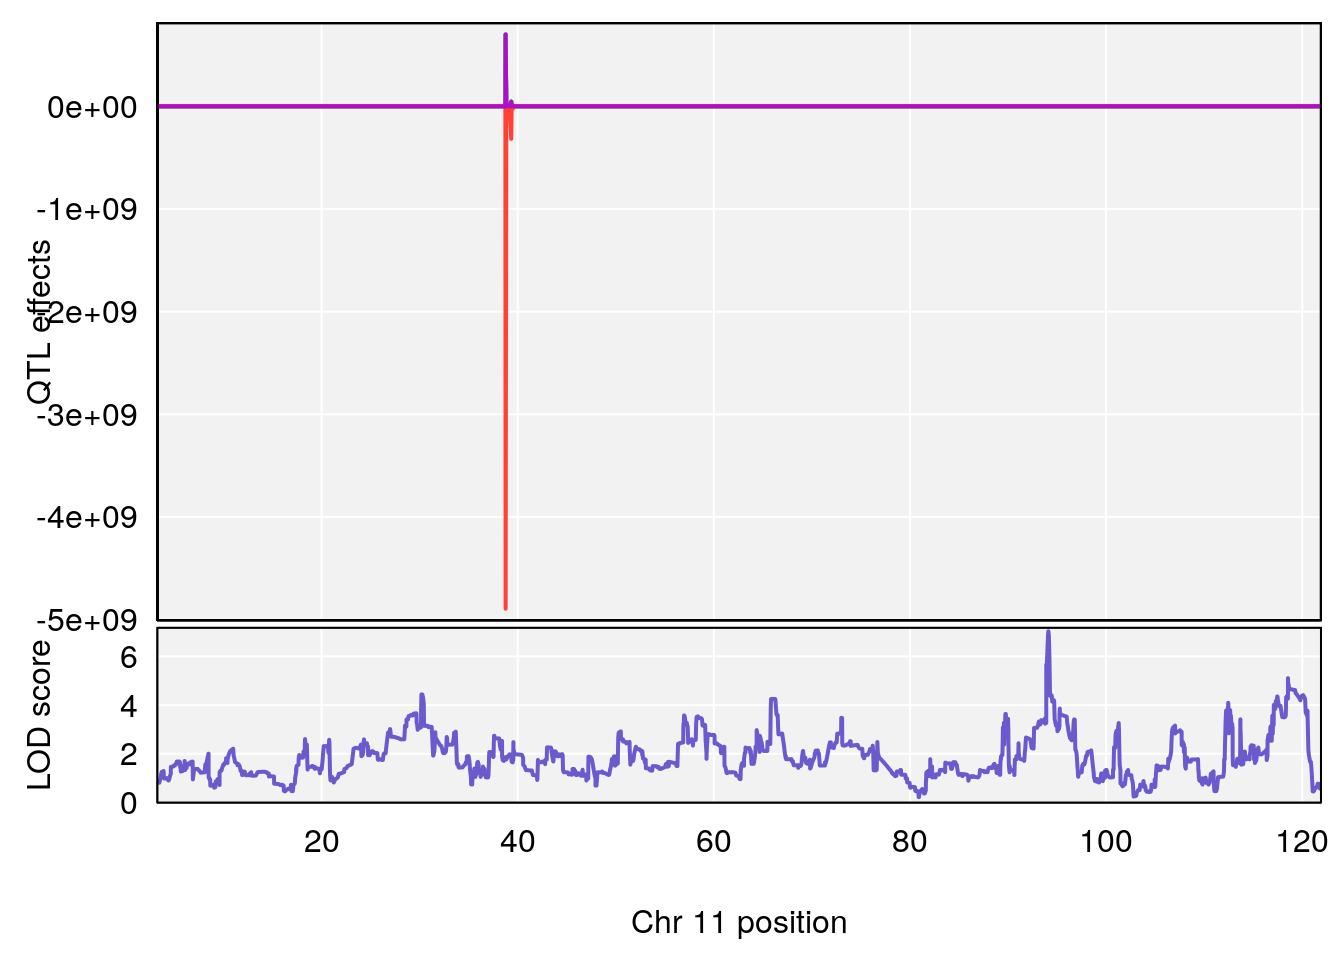
| Version | Author | Date |
|---|---|---|
| 8fe8543 | xhyuo | 2023-02-20 |
| Version | Author | Date |
|---|---|---|
| 8fe8543 | xhyuo | 2023-02-20 |
| Version | Author | Date |
|---|---|---|
| 8fe8543 | xhyuo | 2023-02-20 |
# [1] 6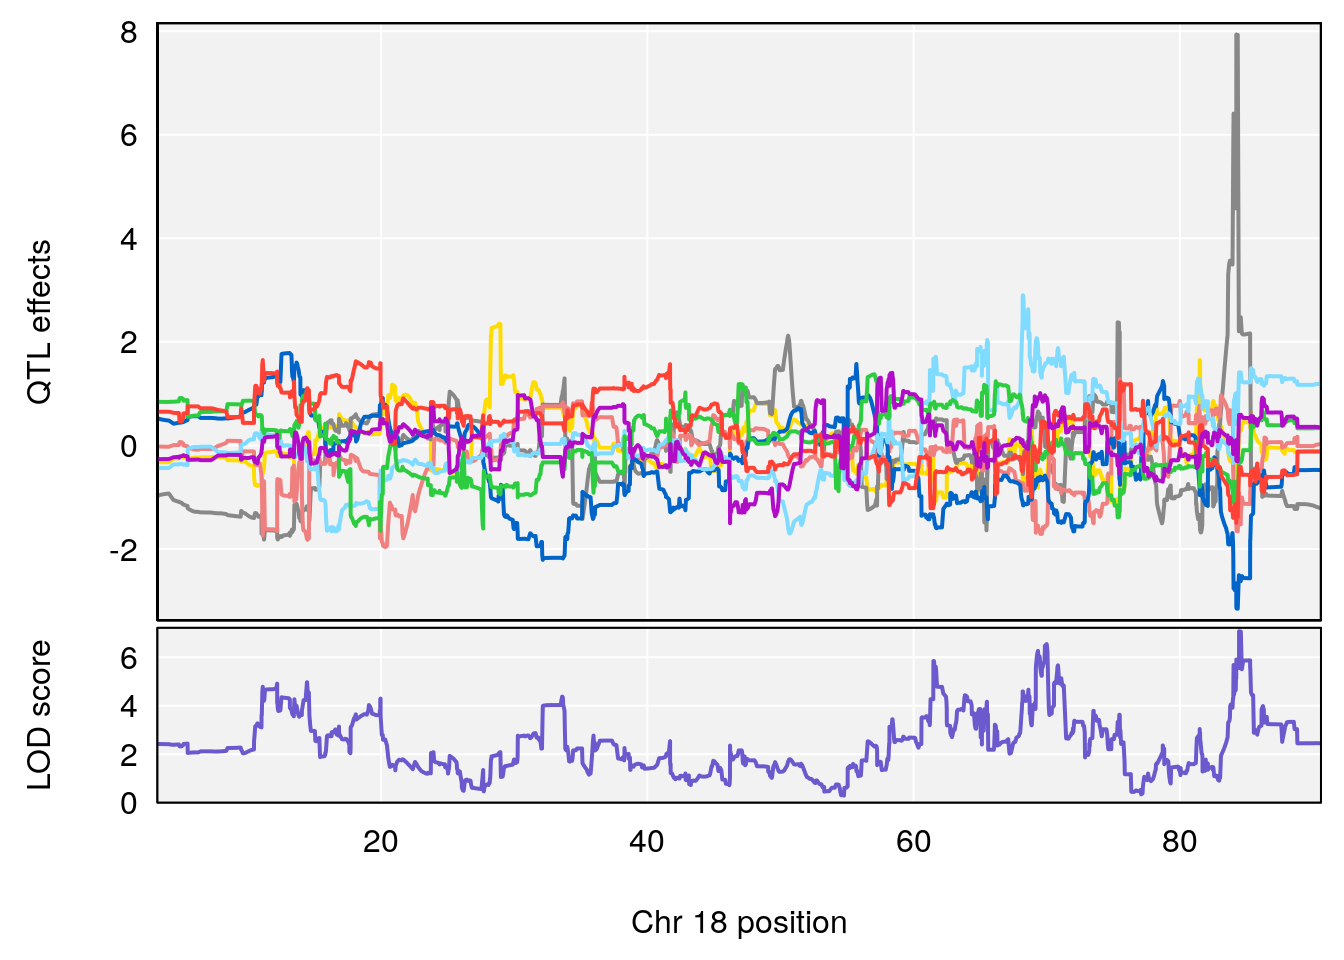
| Version | Author | Date |
|---|---|---|
| 8fe8543 | xhyuo | 2023-02-20 |
| Version | Author | Date |
|---|---|---|
| 8fe8543 | xhyuo | 2023-02-20 |
| Version | Author | Date |
|---|---|---|
| 8fe8543 | xhyuo | 2023-02-20 |
# [1] 7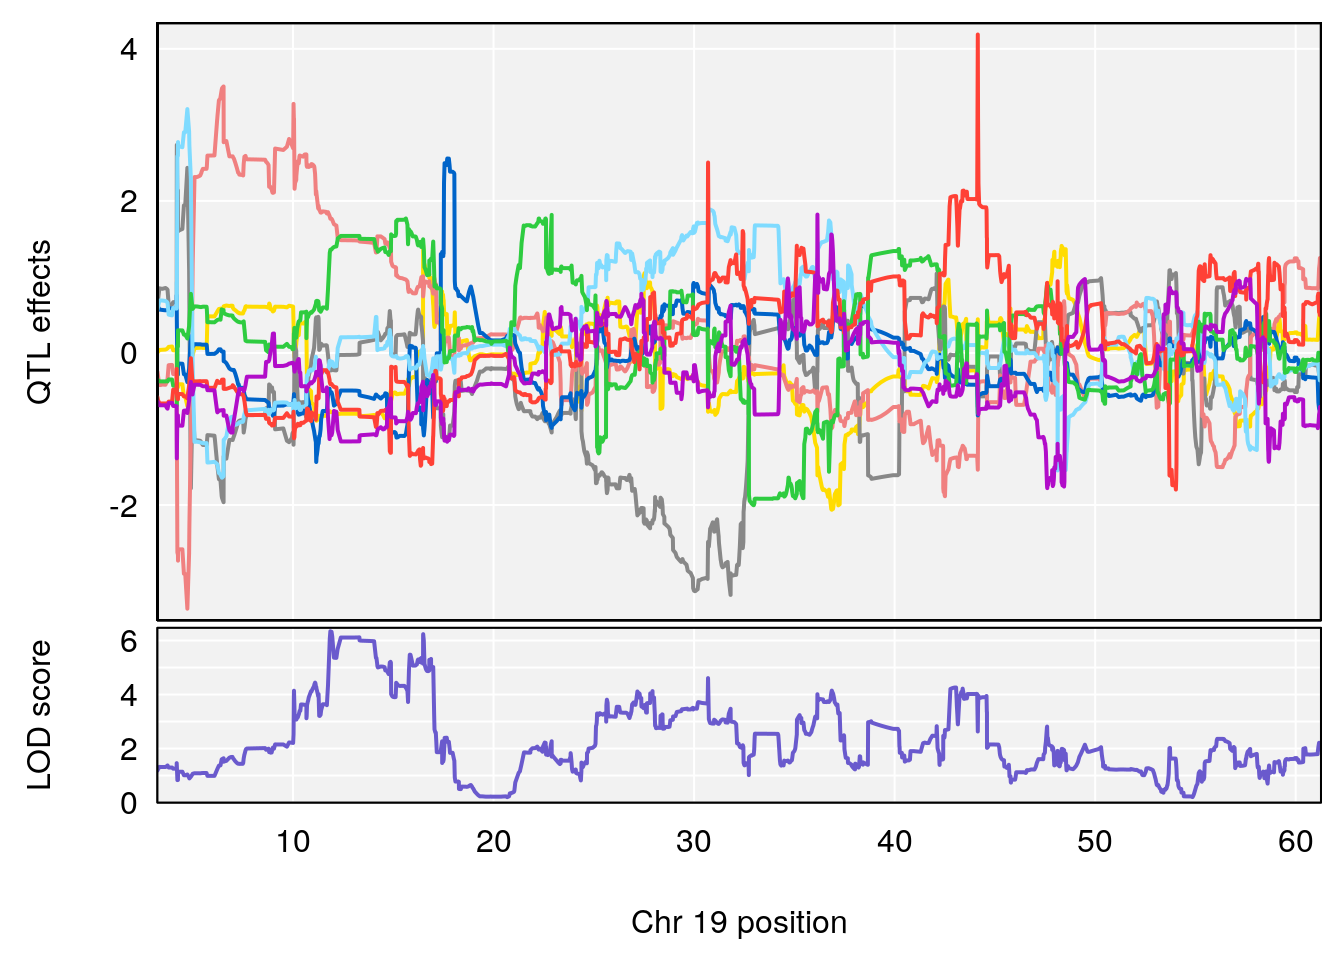
| Version | Author | Date |
|---|---|---|
| 8fe8543 | xhyuo | 2023-02-20 |
| Version | Author | Date |
|---|---|---|
| 8fe8543 | xhyuo | 2023-02-20 |
| Version | Author | Date |
|---|---|---|
| 8fe8543 | xhyuo | 2023-02-20 |
# [1] "Recovery.Time"
#   lodindex lodcolumn chr     pos      lod    ci_lo    ci_hi
# 1        1    pheno1   2 45.6708 6.041384 43.98518 167.0778
# [1] 1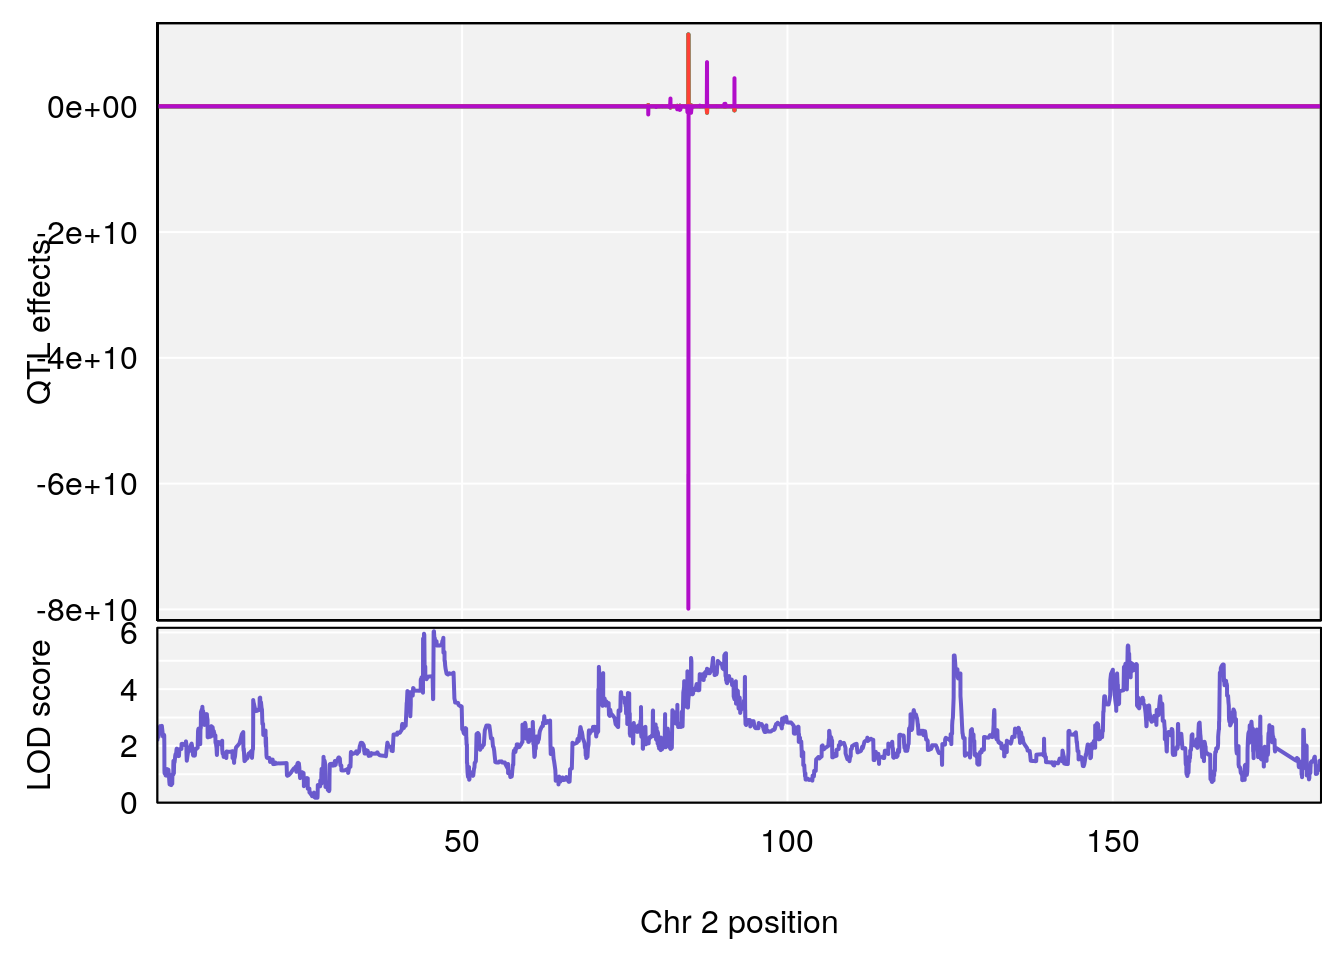
| Version | Author | Date |
|---|---|---|
| 8fe8543 | xhyuo | 2023-02-20 |
| Version | Author | Date |
|---|---|---|
| 8fe8543 | xhyuo | 2023-02-20 |
| Version | Author | Date |
|---|---|---|
| 8fe8543 | xhyuo | 2023-02-20 |
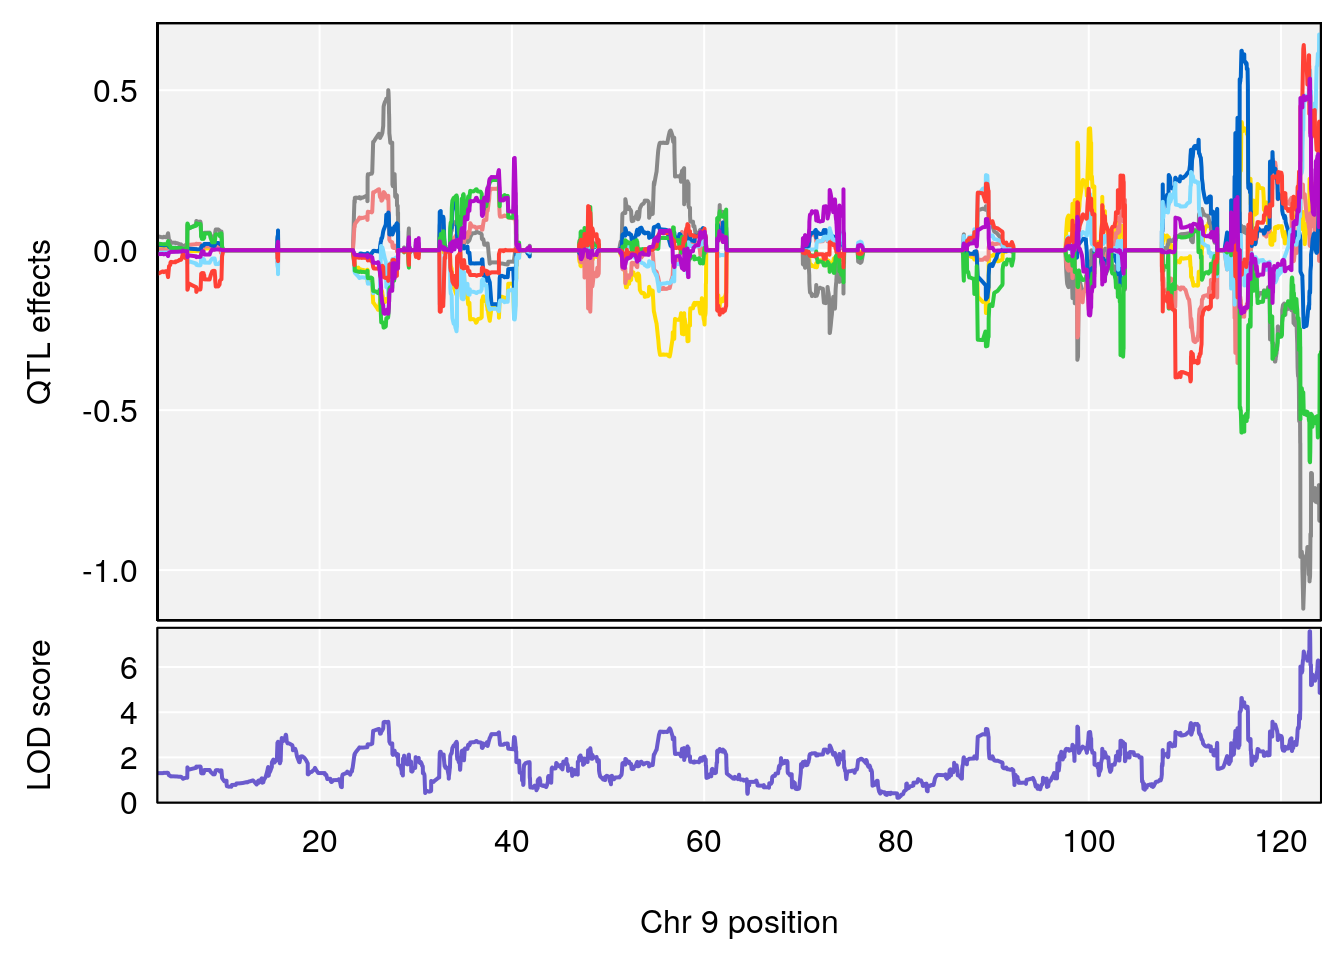
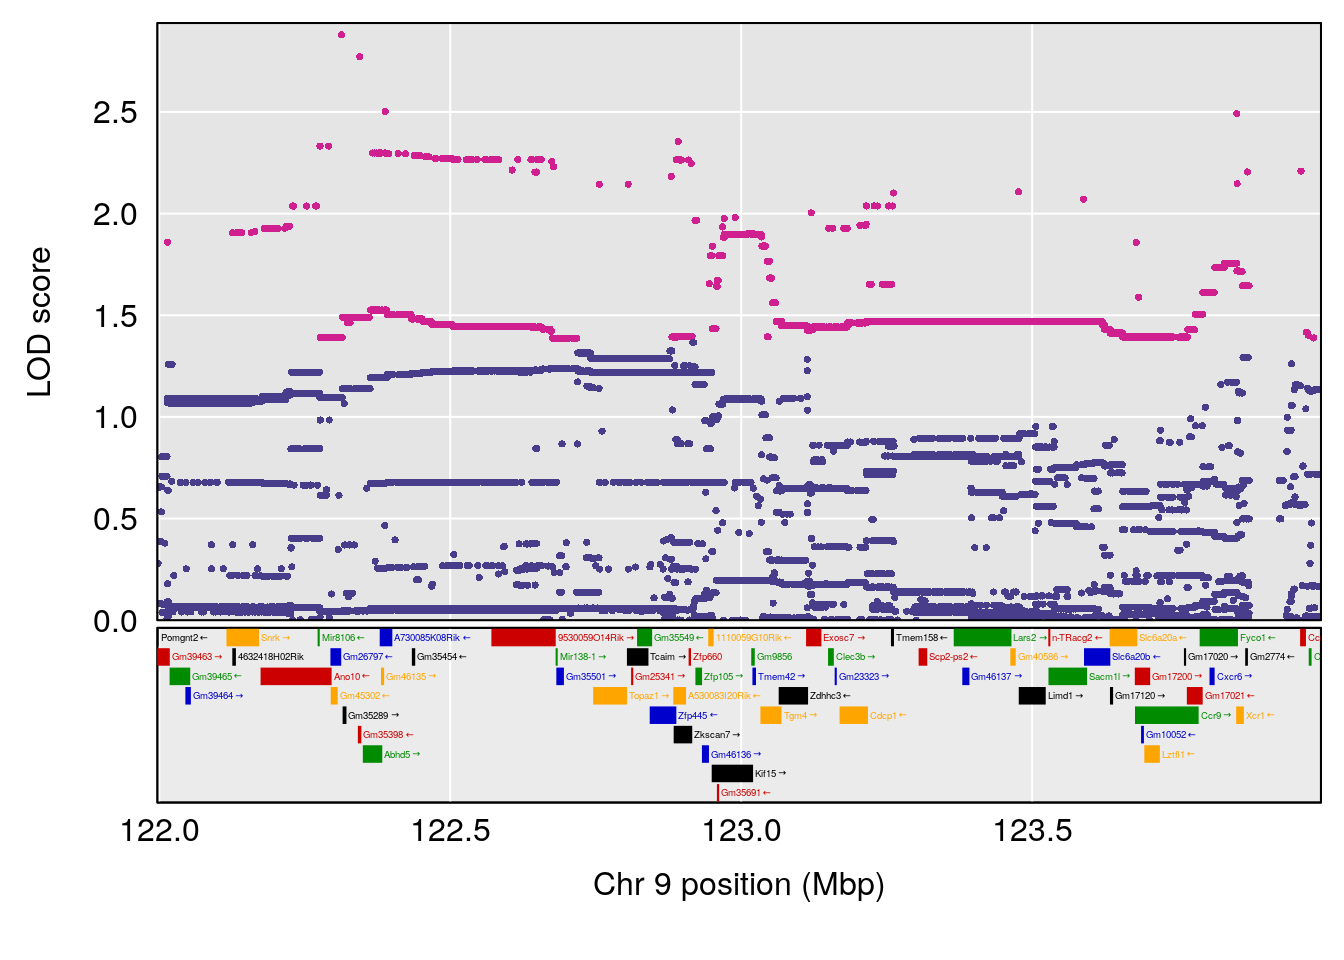
# [1] "Min.depression"
#   lodindex lodcolumn chr      pos      lod    ci_lo    ci_hi
# 1        1    pheno1   9 122.9964 7.582778 122.2267 124.0099
# [1] 1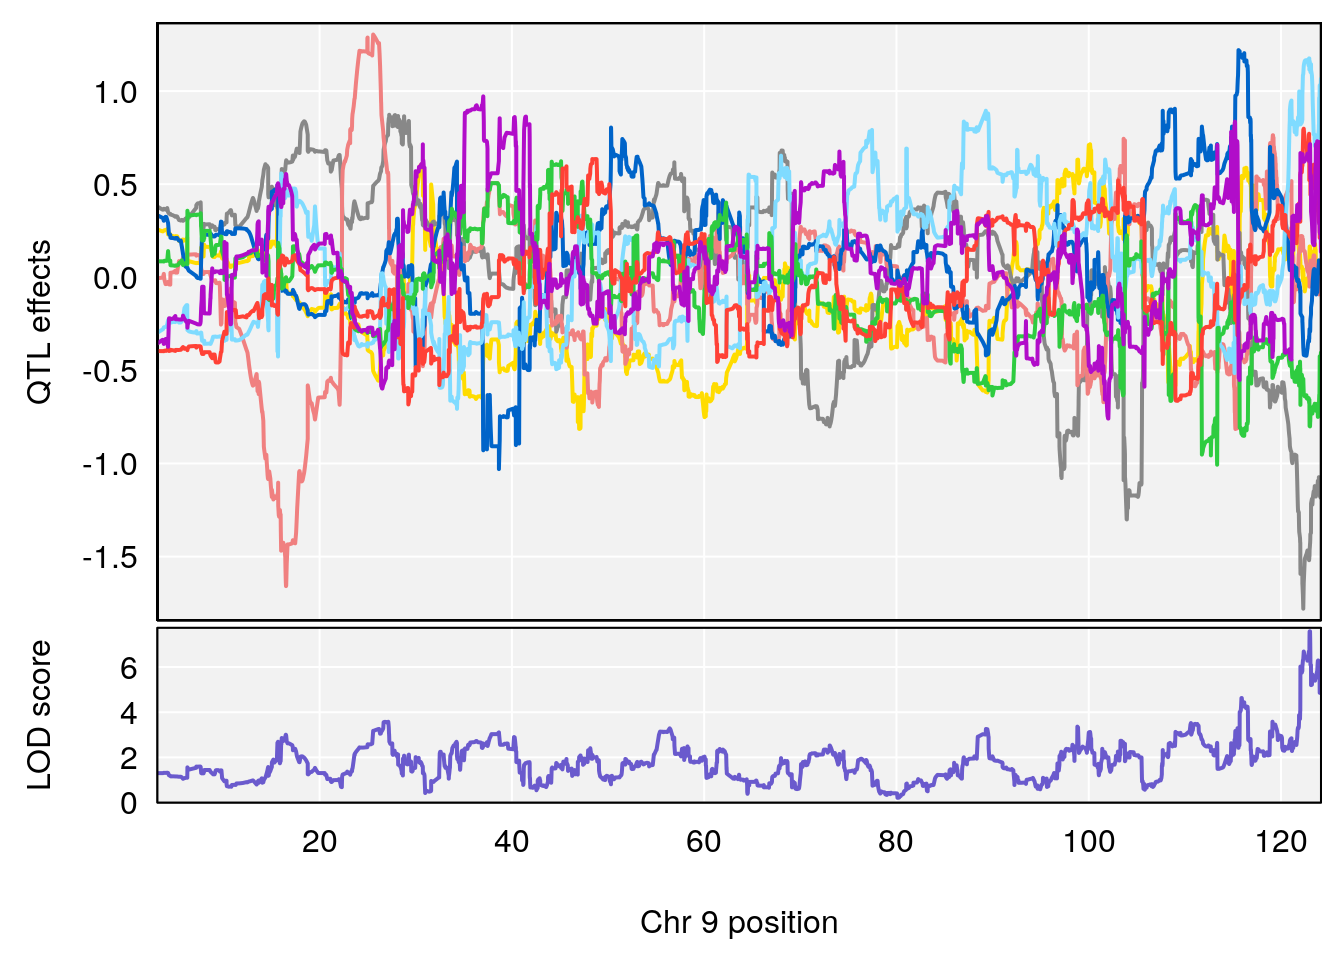
| Version | Author | Date |
|---|---|---|
| 8fe8543 | xhyuo | 2023-02-20 |
| Version | Author | Date |
|---|---|---|
| 8fe8543 | xhyuo | 2023-02-20 |
| Version | Author | Date |
|---|---|---|
| 8fe8543 | xhyuo | 2023-02-20 |
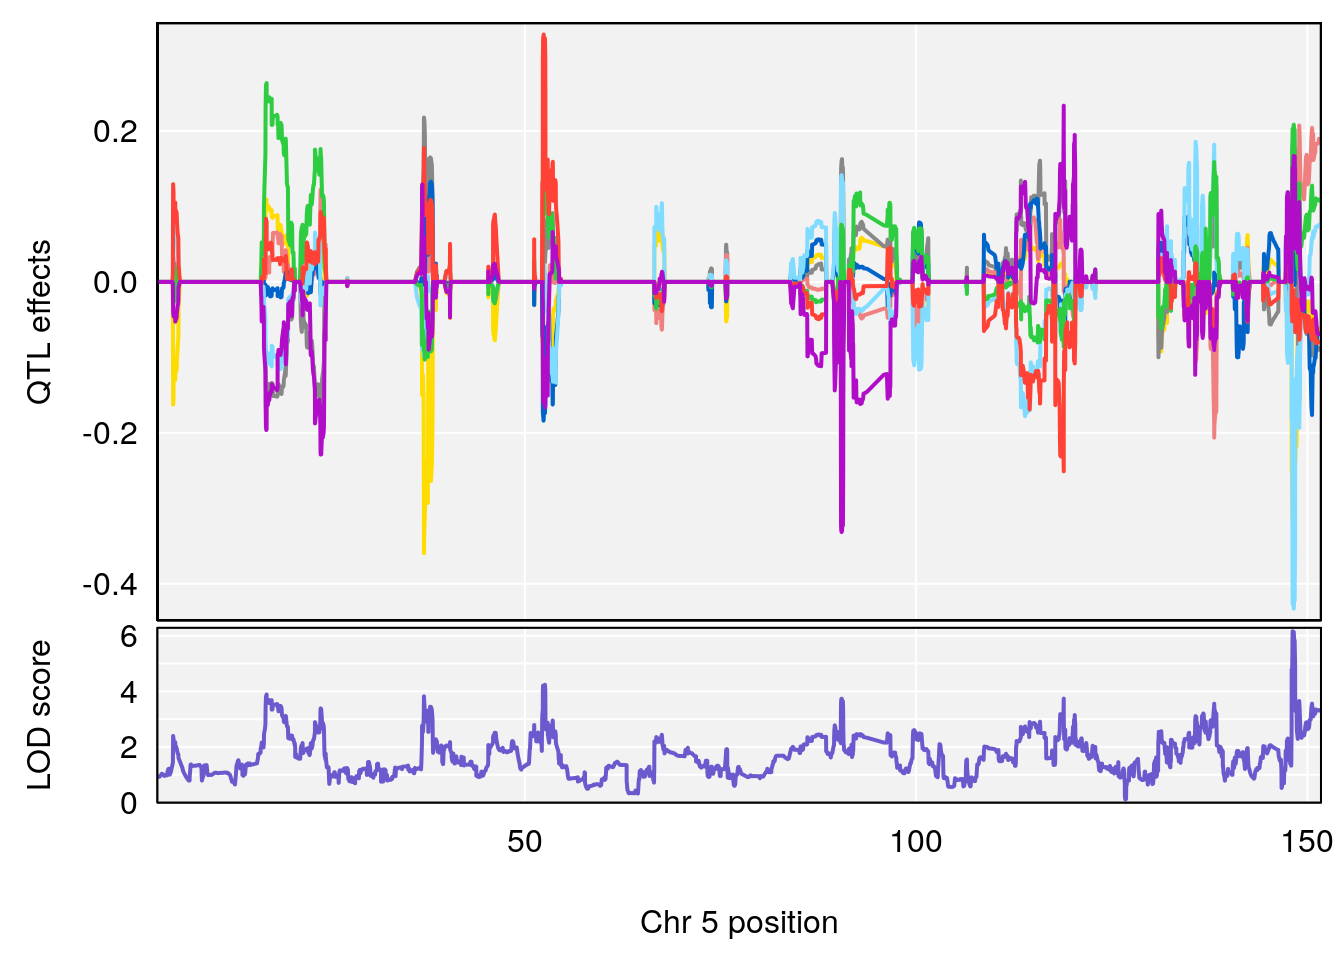
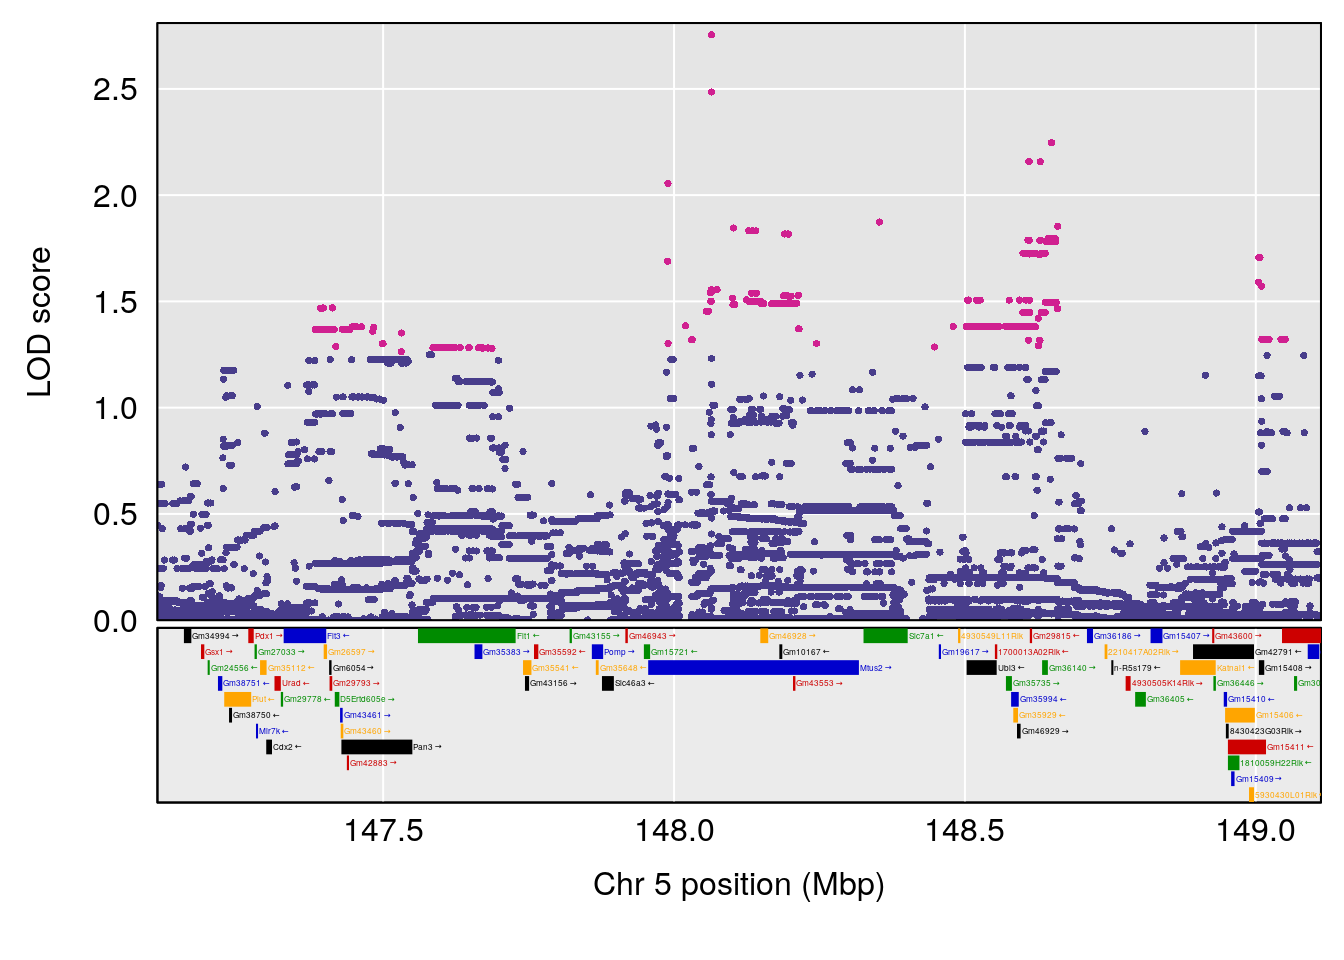
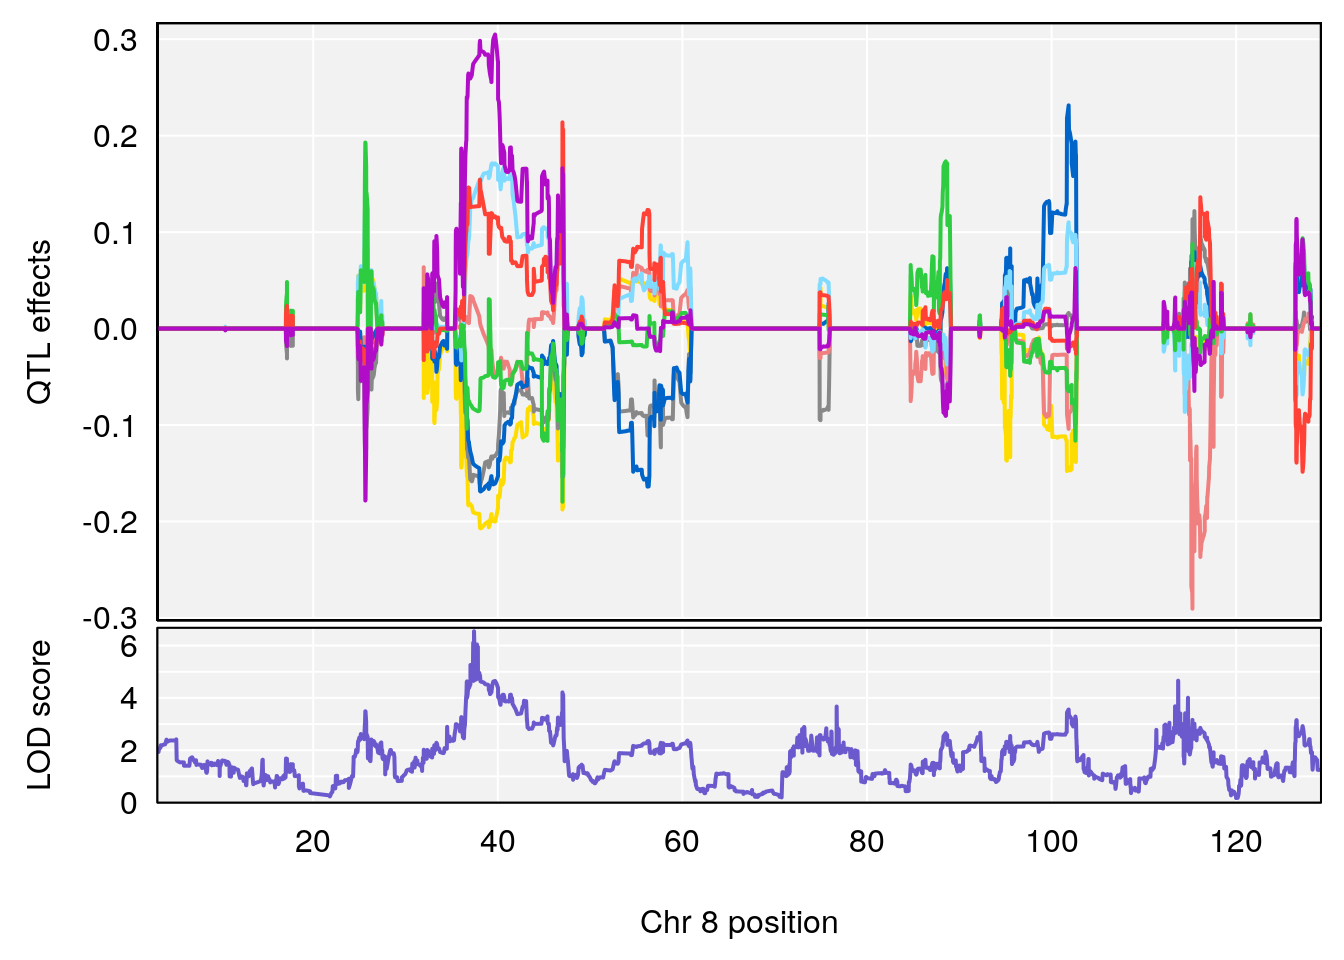
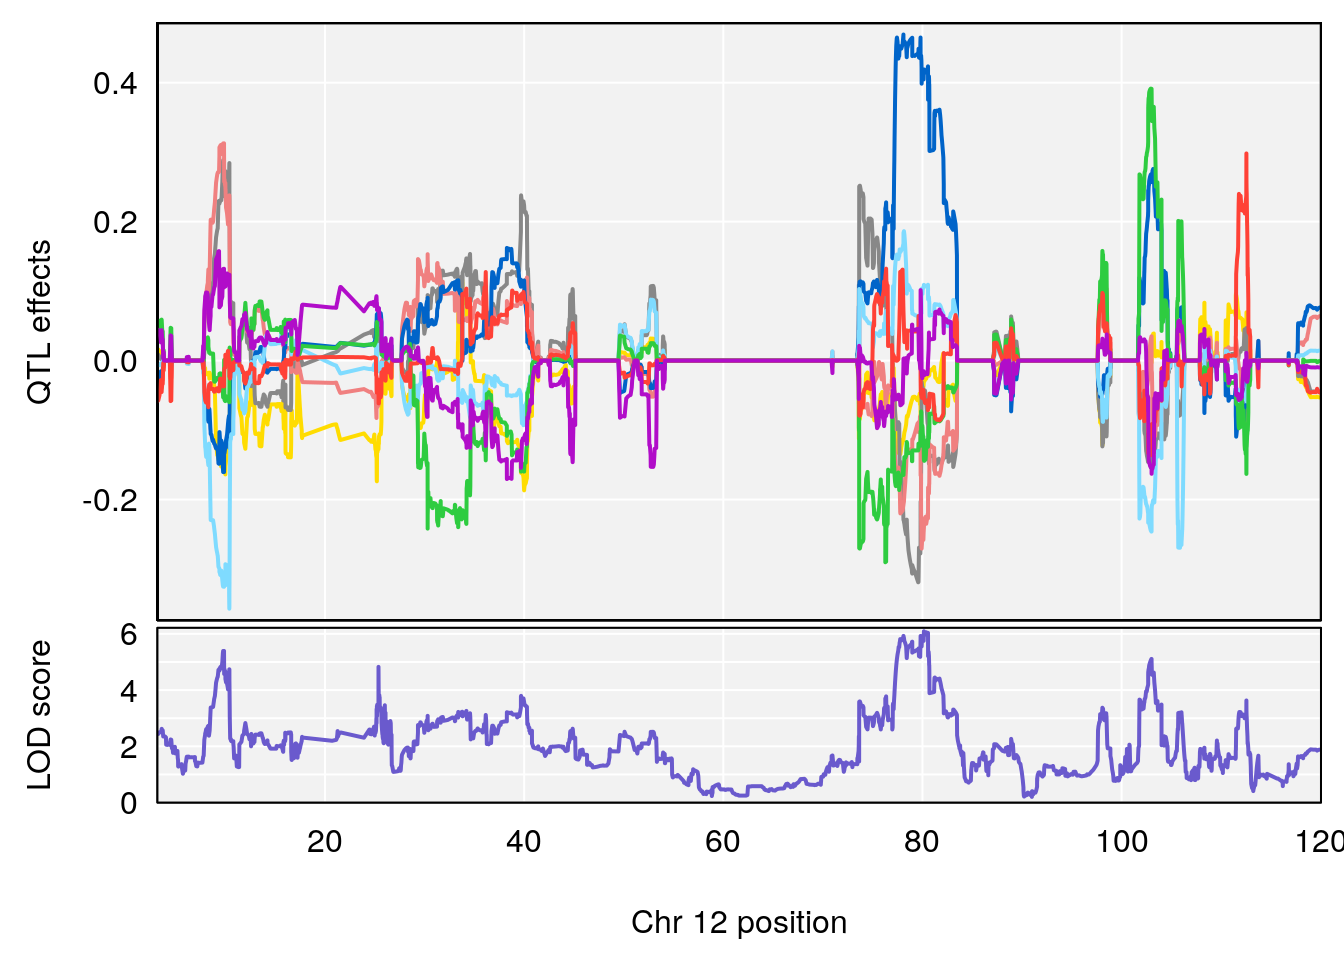
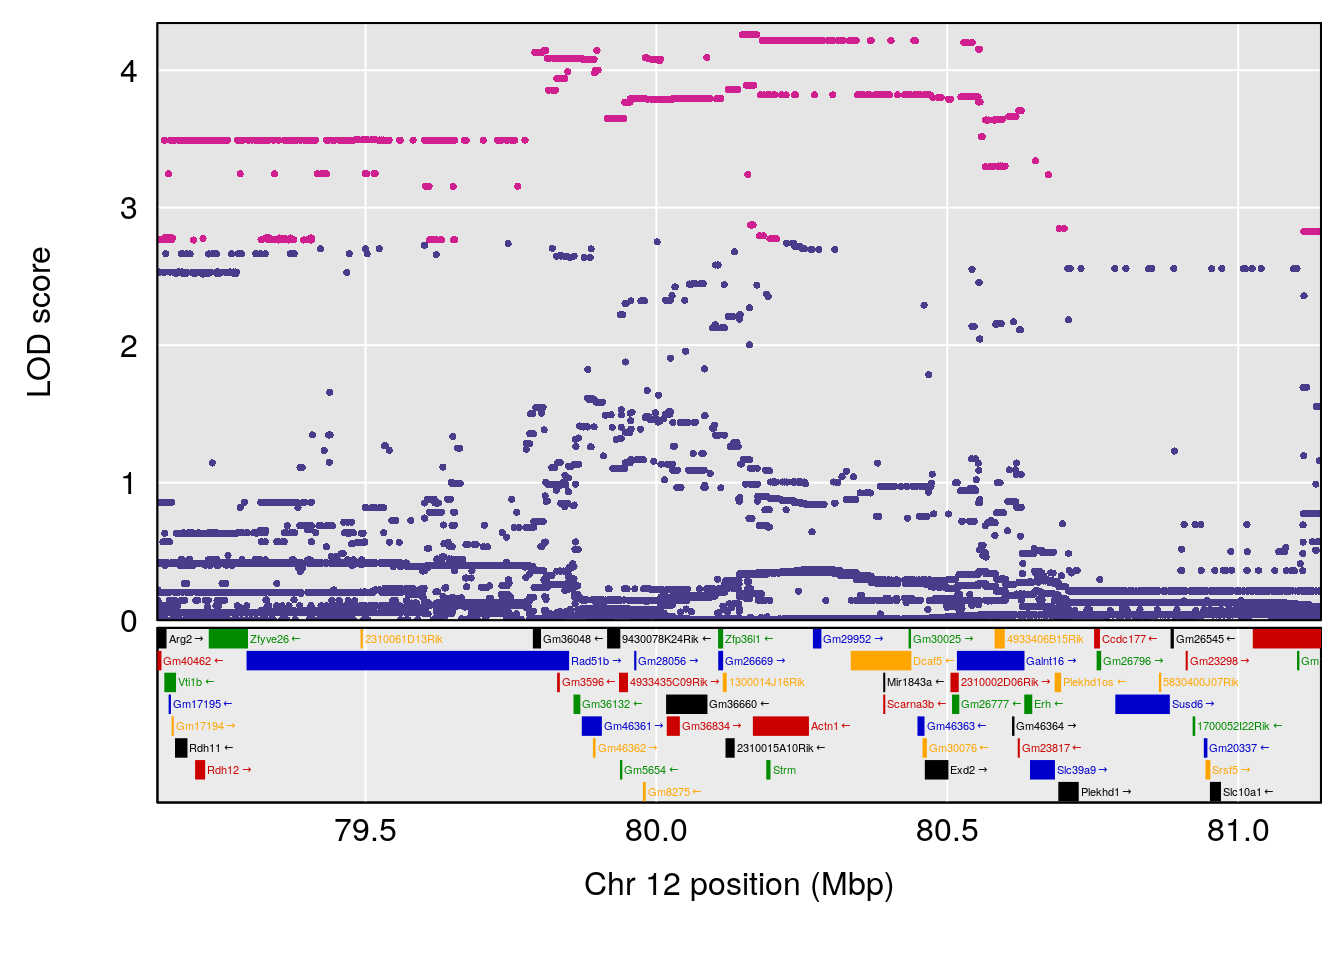
# [1] "Status_bin"
# lodindex lodcolumn chr pos lod ci_lo ci_hi
# 1 1 pheno1 5 148.11200 6.160116 147.986160 148.43807
# 2 1 pheno1 8 37.41968 6.546587 37.029877 37.85219
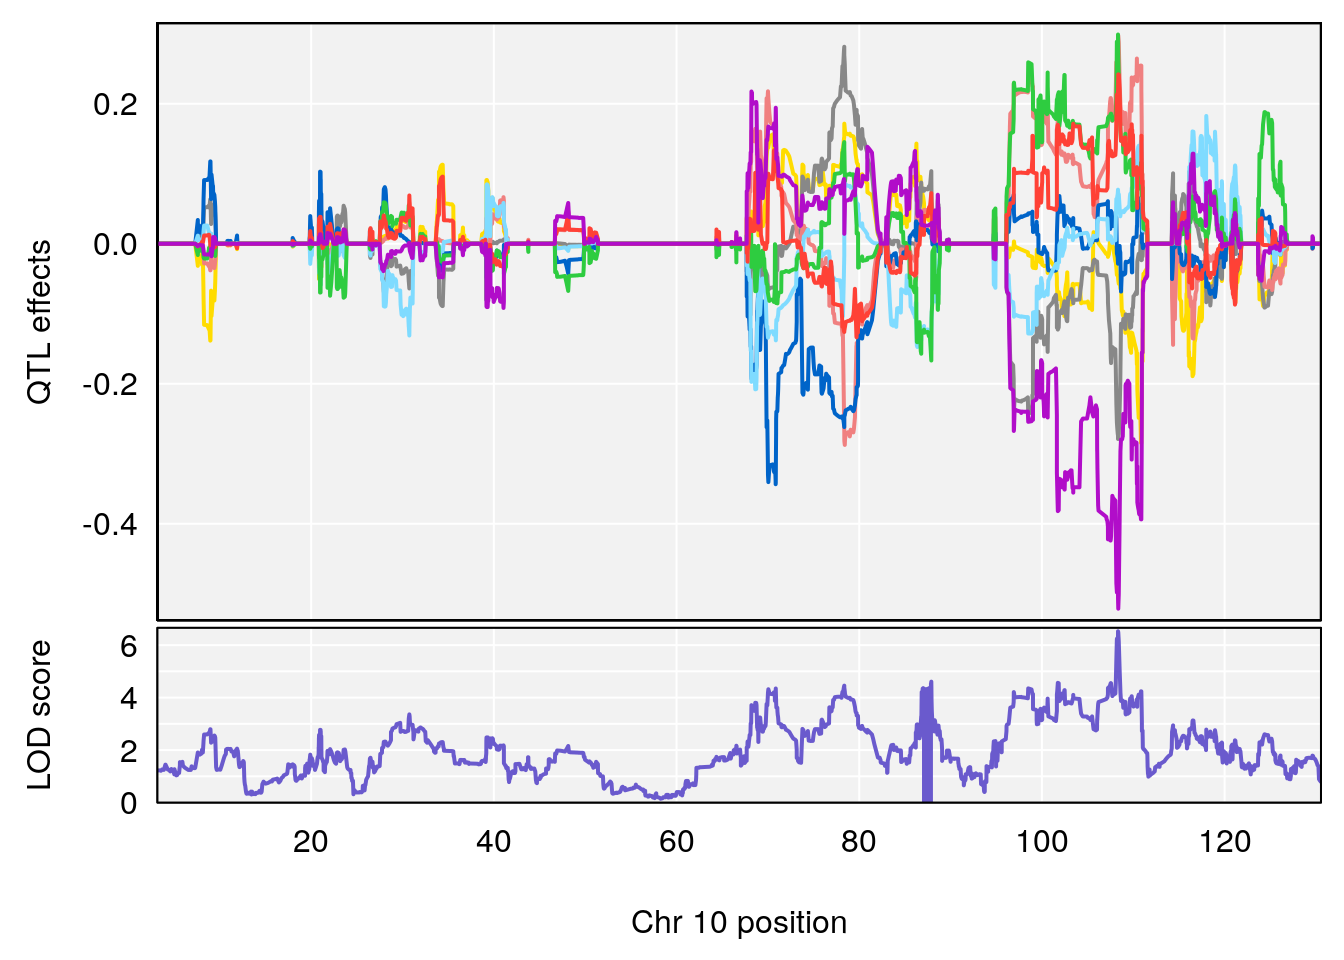
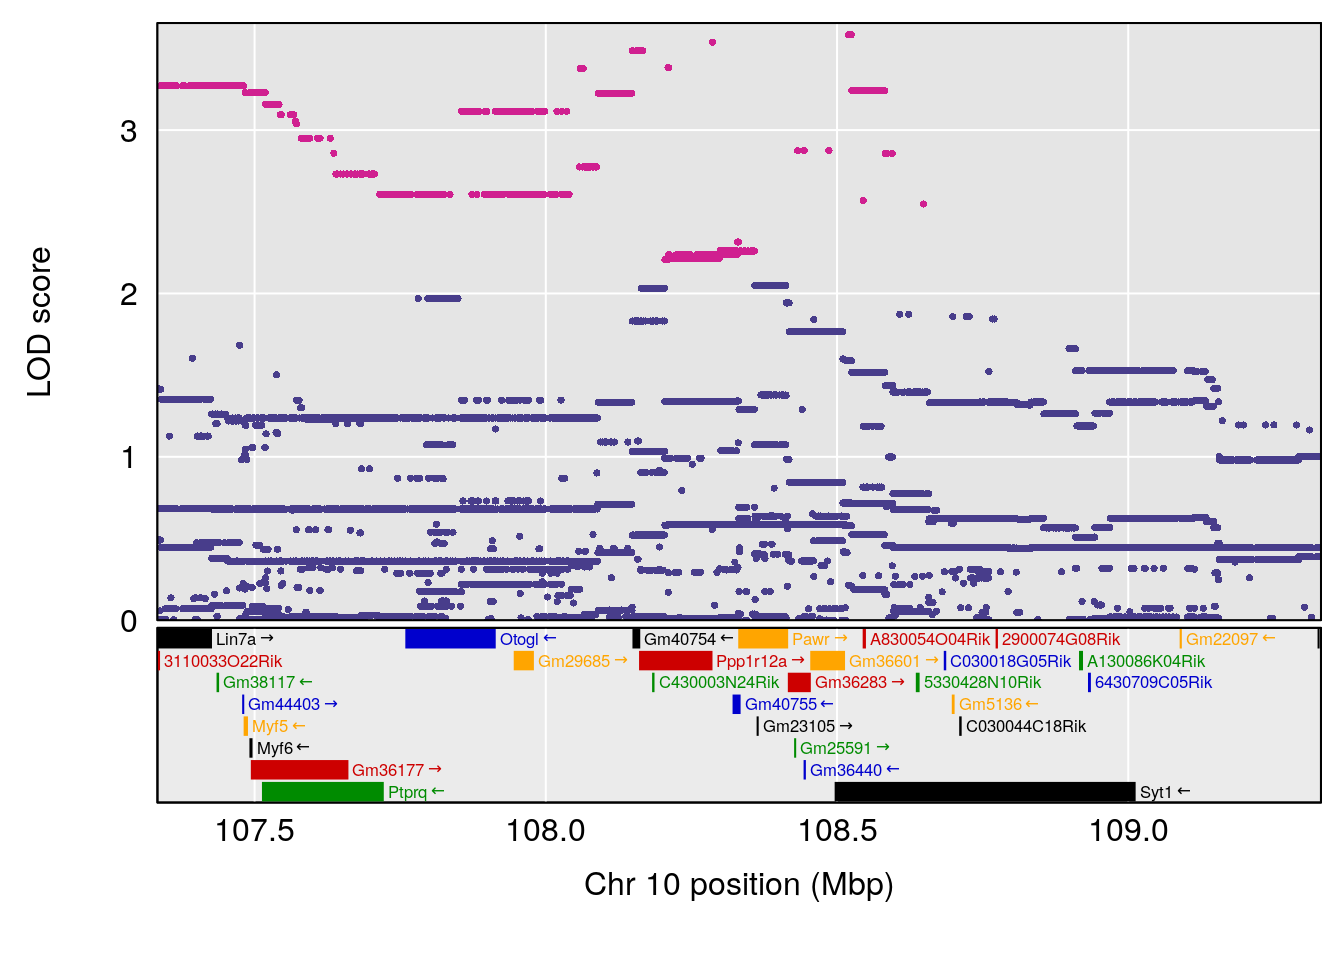
# 3 1 pheno1 10 108.33120 6.527988 108.088576 108.51289
# 4 1 pheno1 12 80.14229 6.091948 9.247594 103.28398
# 5 1 pheno1 15 88.17969 8.118696 87.323190 88.41707
# [1] 1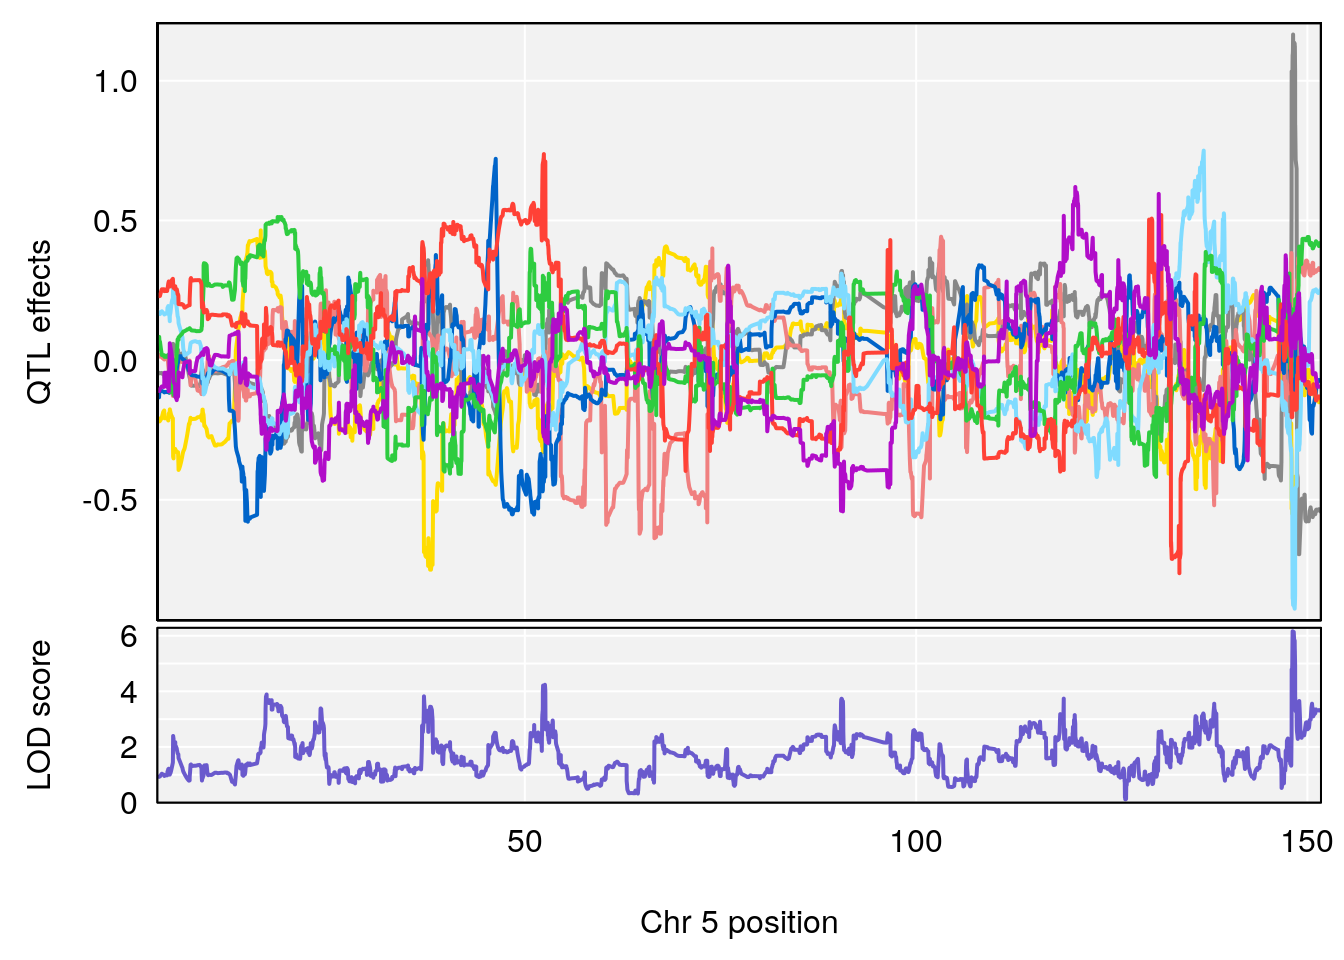
| Version | Author | Date |
|---|---|---|
| 8fe8543 | xhyuo | 2023-02-20 |
| Version | Author | Date |
|---|---|---|
| 8fe8543 | xhyuo | 2023-02-20 |
| Version | Author | Date |
|---|---|---|
| 8fe8543 | xhyuo | 2023-02-20 |
# [1] 2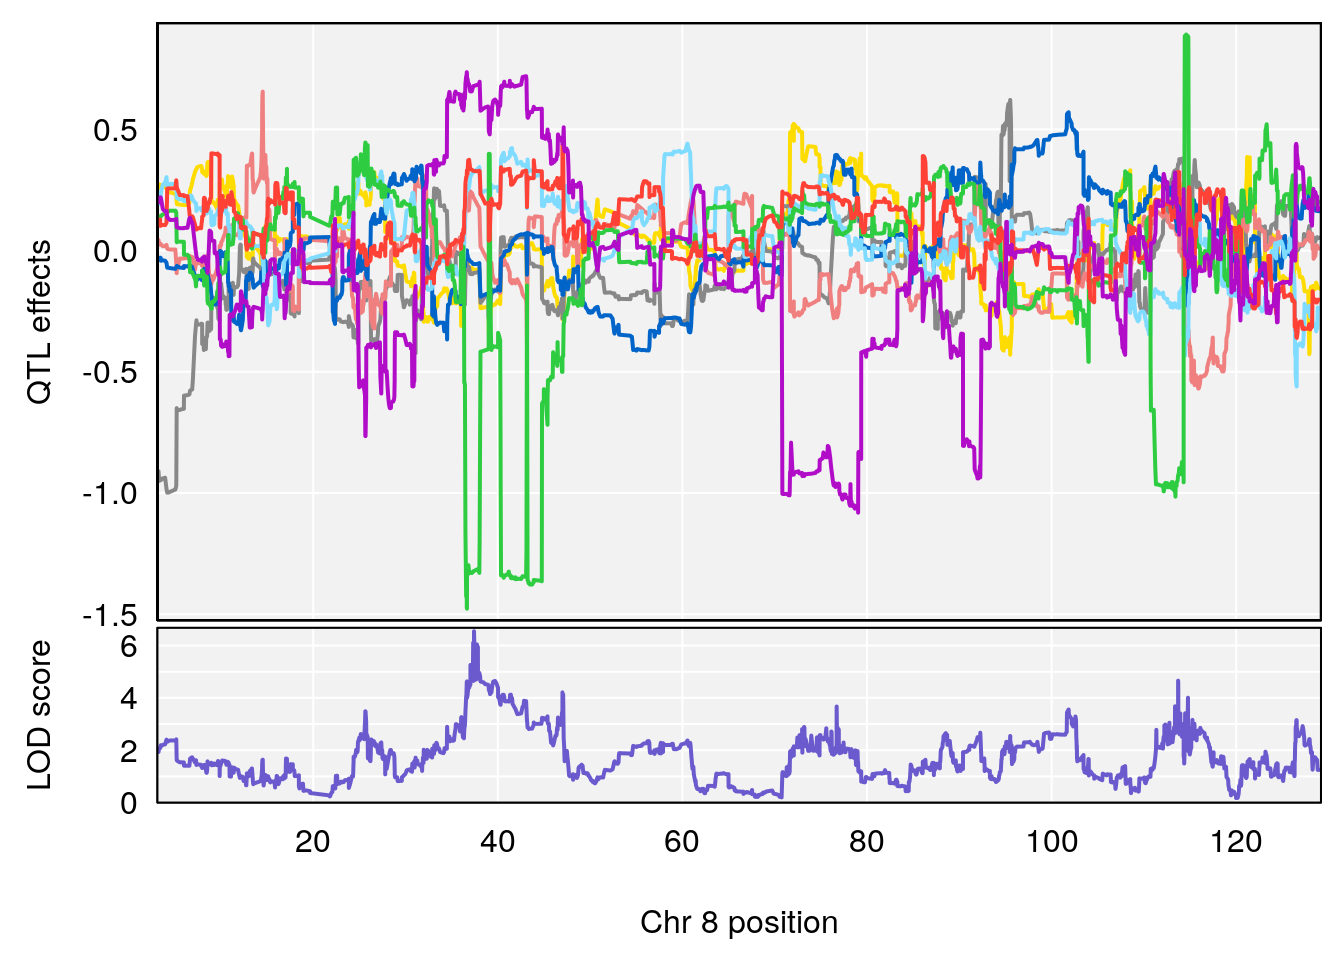
| Version | Author | Date |
|---|---|---|
| 8fe8543 | xhyuo | 2023-02-20 |
| Version | Author | Date |
|---|---|---|
| 8fe8543 | xhyuo | 2023-02-20 |
| Version | Author | Date |
|---|---|---|
| 8fe8543 | xhyuo | 2023-02-20 |
# [1] 3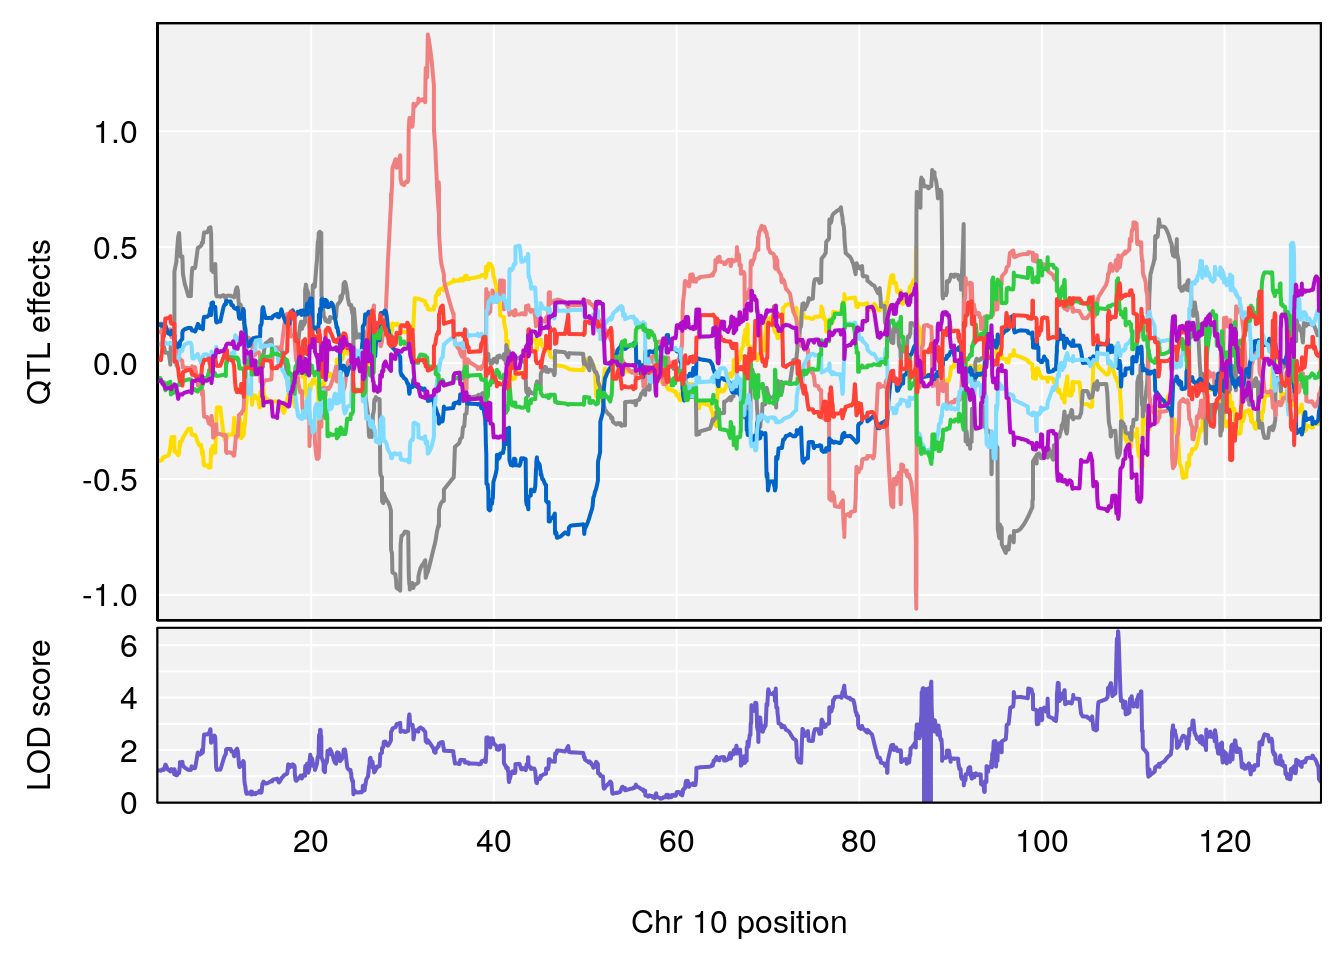
| Version | Author | Date |
|---|---|---|
| 8fe8543 | xhyuo | 2023-02-20 |
| Version | Author | Date |
|---|---|---|
| 8fe8543 | xhyuo | 2023-02-20 |
| Version | Author | Date |
|---|---|---|
| 8fe8543 | xhyuo | 2023-02-20 |
# [1] 4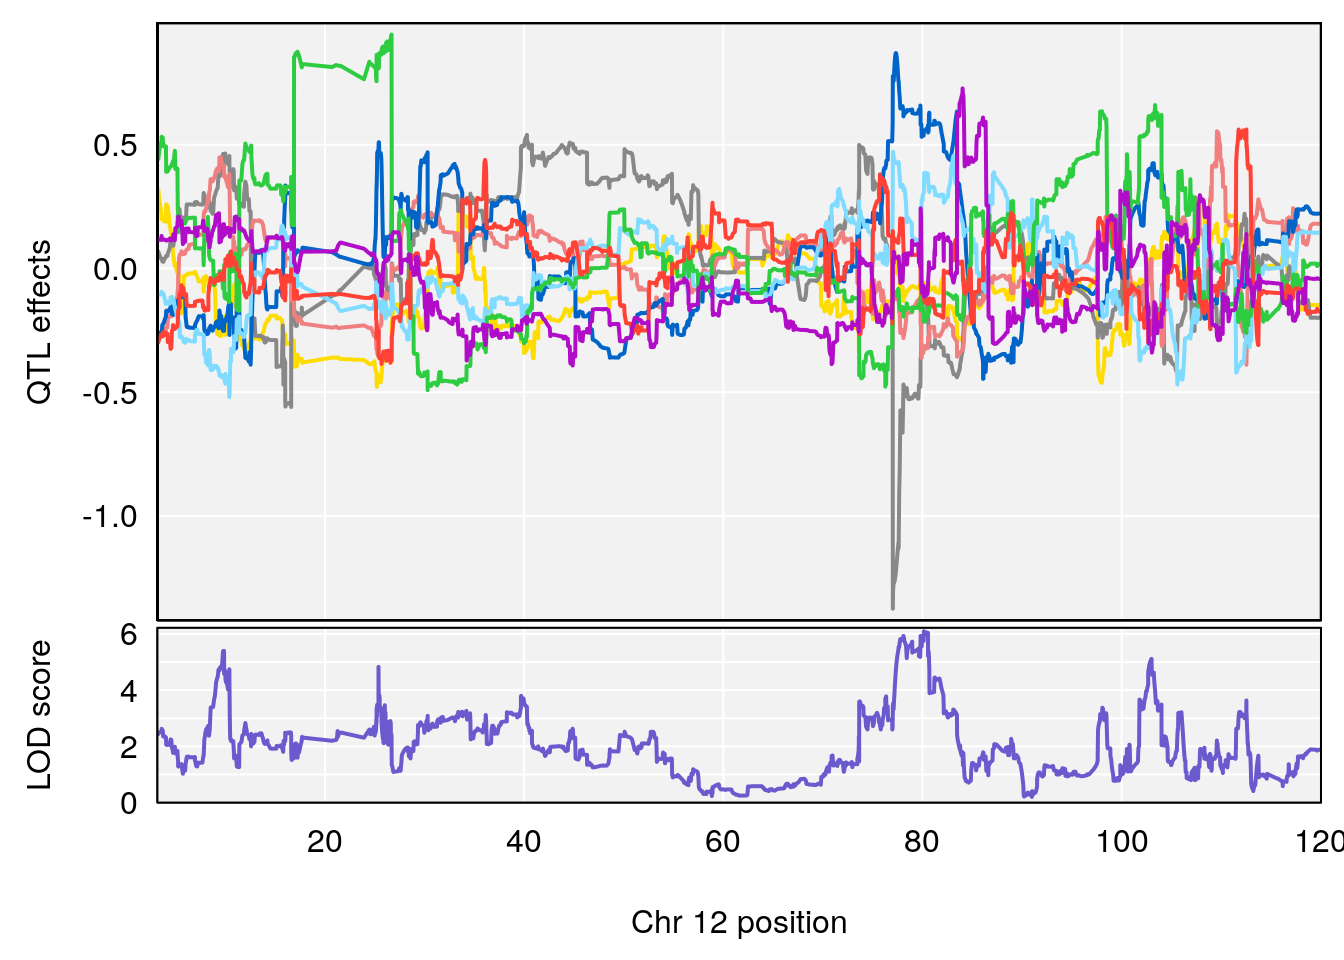
| Version | Author | Date |
|---|---|---|
| 8fe8543 | xhyuo | 2023-02-20 |
| Version | Author | Date |
|---|---|---|
| 8fe8543 | xhyuo | 2023-02-20 |
| Version | Author | Date |
|---|---|---|
| 8fe8543 | xhyuo | 2023-02-20 |
# [1] 5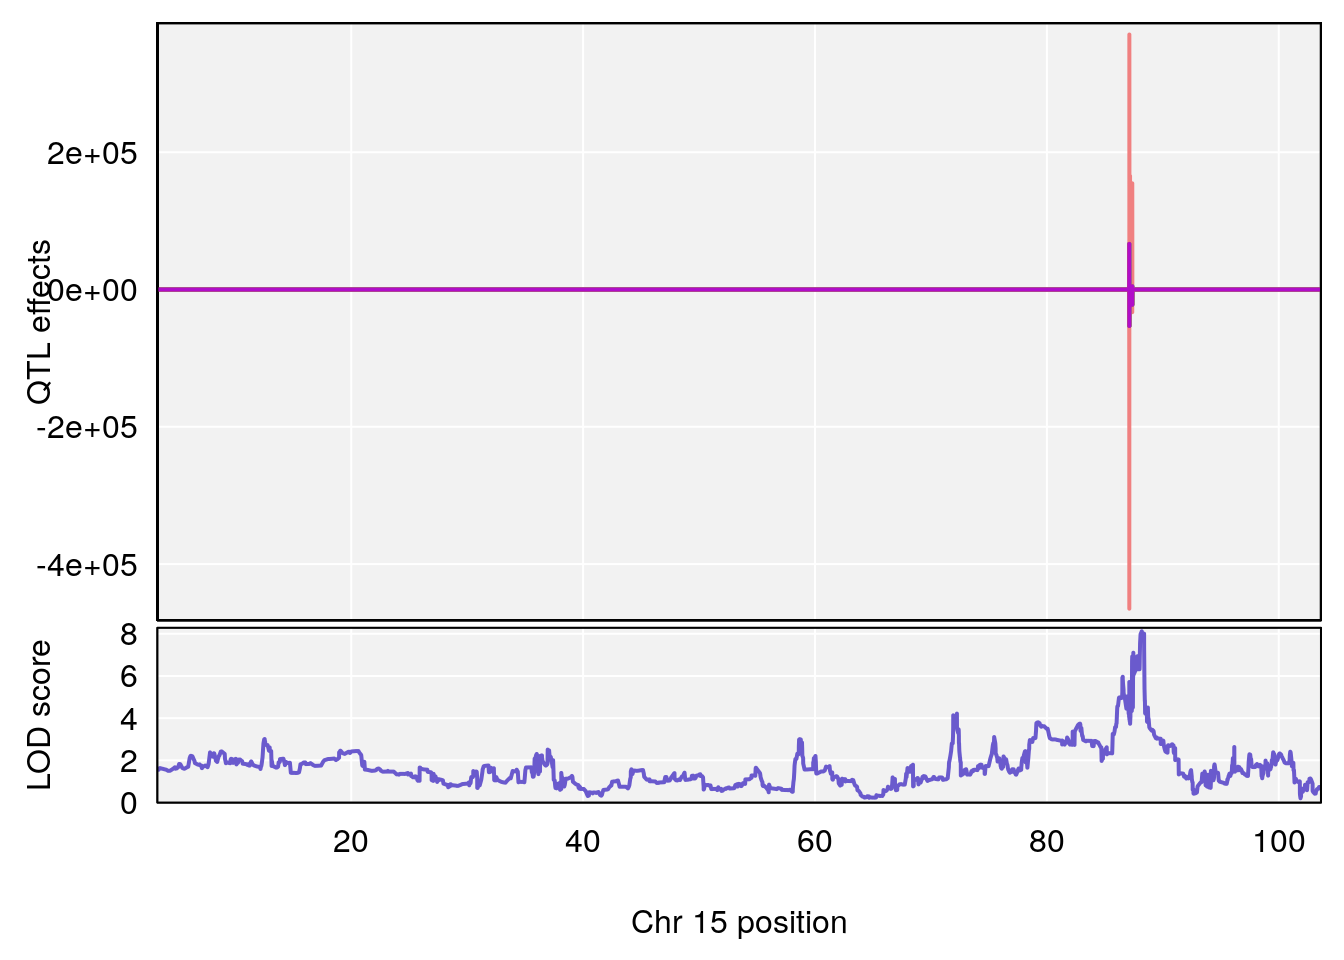
| Version | Author | Date |
|---|---|---|
| 8fe8543 | xhyuo | 2023-02-20 |
| Version | Author | Date |
|---|---|---|
| 8fe8543 | xhyuo | 2023-02-20 |
| Version | Author | Date |
|---|---|---|
| 8fe8543 | xhyuo | 2023-02-20 |
Plot qtl mapping on array female
load("output/qtl.morphine.out.second_set.female.RData")
#pmap and gmap
chr.names <- c("1","2","3","4","5","6","7","8","9","10","11","12","13","14","15","16","17","18","19", "X")
gmap <- list()
pmap <- list()
for (chr in chr.names){
  gmap[[chr]] <-  do.morphine$gmap[[chr]]
  pmap[[chr]] <-  do.morphine$pmap[[chr]]
}
attr(gmap, "is_x_chr") <- structure(c(rep(FALSE,19),TRUE), names=1:20)
attr(pmap, "is_x_chr") <- structure(c(rep(FALSE,19),TRUE), names=1:20)

#genome-wide plot
for(i in names(qtl.morphine.out)){
  par(mar=c(5.1, 4.1, 1.1, 1.1))
  ymx <- maxlod(qtl.morphine.out[[i]]) # overall maximum LOD score
  plot(qtl.morphine.out[[i]], map=pmap, lodcolumn=1, col="slateblue", ylim=c(0, max(sapply(qtl.morphine.out, maxlod)) +2))
  abline(h=summary(qtl.morphine.operm[[i]], alpha=c(0.10, 0.05, 0.01))[[1]], col="red")
  abline(h=summary(qtl.morphine.operm[[i]], alpha=c(0.10, 0.05, 0.01))[[2]], col="red")
  abline(h=summary(qtl.morphine.operm[[i]], alpha=c(0.10, 0.05, 0.01))[[3]], col="red")
  title(main = paste0("DO_morphine_",i))
}
| Version | Author | Date |
|---|---|---|
| 8fe8543 | xhyuo | 2023-02-20 |
| Version | Author | Date |
|---|---|---|
| 8fe8543 | xhyuo | 2023-02-20 |
| Version | Author | Date |
|---|---|---|
| 8fe8543 | xhyuo | 2023-02-20 |
| Version | Author | Date |
|---|---|---|
| 8fe8543 | xhyuo | 2023-02-20 |
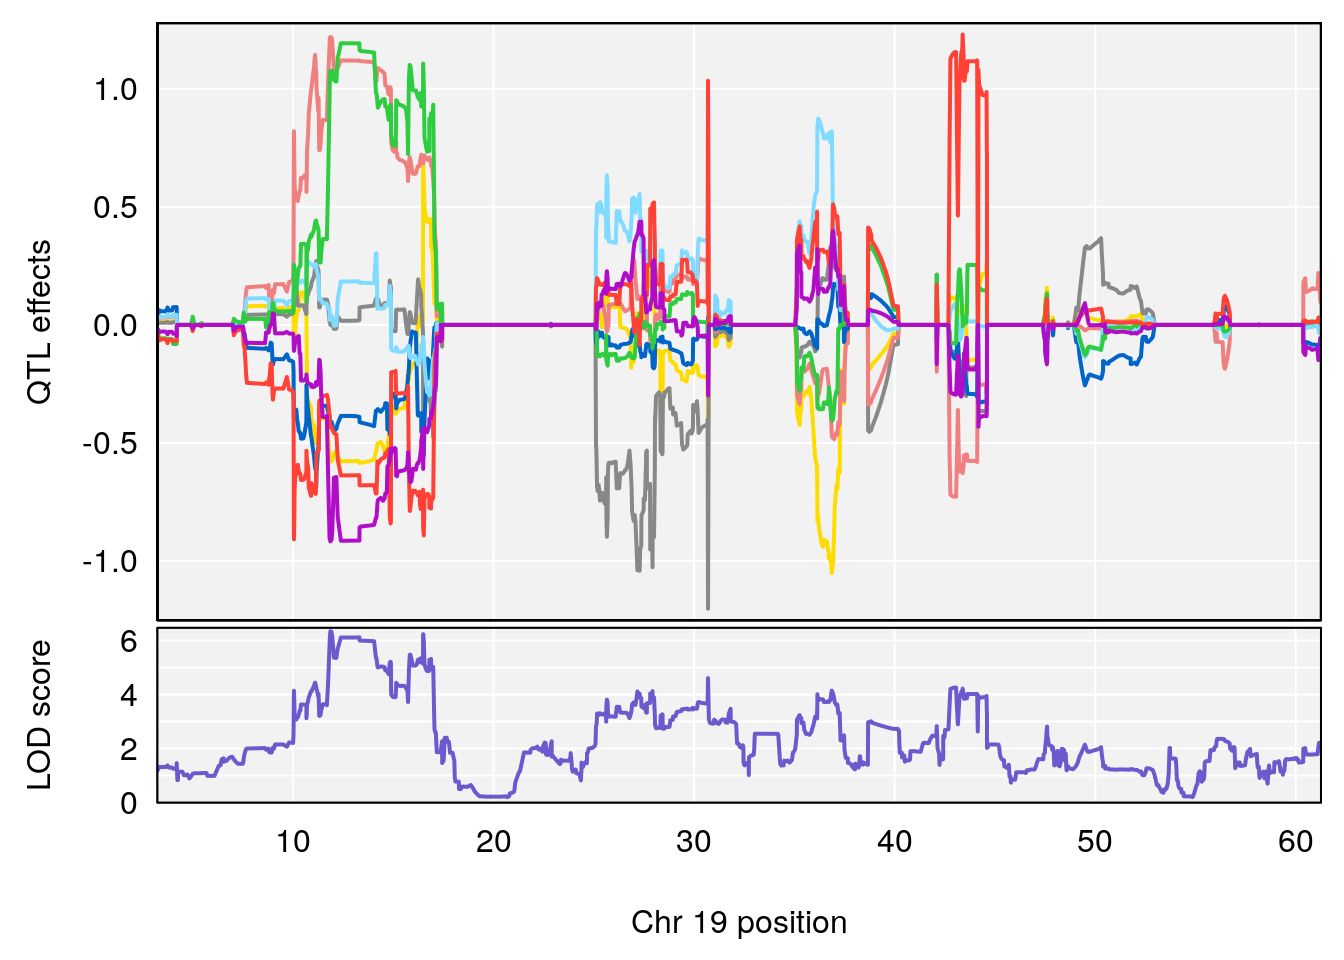
#peaks coeff plot
for(i in names(qtl.morphine.out)){
  print(i)
  peaks <- find_peaks(qtl.morphine.out[[i]], map=pmap, threshold=6, drop=1.5)
  print(peaks)
  for(p in 1:dim(peaks)[1]) {
    print(p)
    chr <-peaks[p,3]
    #coeff plot
    par(mar=c(4.1, 4.1, 0.6, 0.6))
    plot_coefCC(coef_c1[[i]][[p]], pmap[chr], scan1_output=qtl.morphine.out[[i]], bgcolor="gray95", legend=NULL)
    plot_coefCC(coef_c2[[i]][[p]], pmap[chr], scan1_output=qtl.morphine.out[[i]], bgcolor="gray95", legend=NULL)
    plot(out_snps[[i]][[p]]$lod, out_snps[[i]][[p]]$snpinfo, drop_hilit=1.5, genes=out_genes[[i]][[p]])
  }
}
# [1] "Survival.Time"
#   lodindex lodcolumn chr       pos      lod      ci_lo     ci_hi
# 1        1    pheno1   2  70.95263 6.278855  57.899382 173.54300
# 2        1    pheno1   3  97.98775 6.445479  35.675687 130.29440
# 3        1    pheno1   4  30.34673 6.677948  28.777007  30.81005
# 4        1    pheno1   8 115.44116 7.553628 115.137119 115.98481
# 5        1    pheno1  15  29.67993 6.173329   7.017907  47.72534
# 6        1    pheno1  19  37.85897 6.861602  37.488231  38.17204
# [1] 1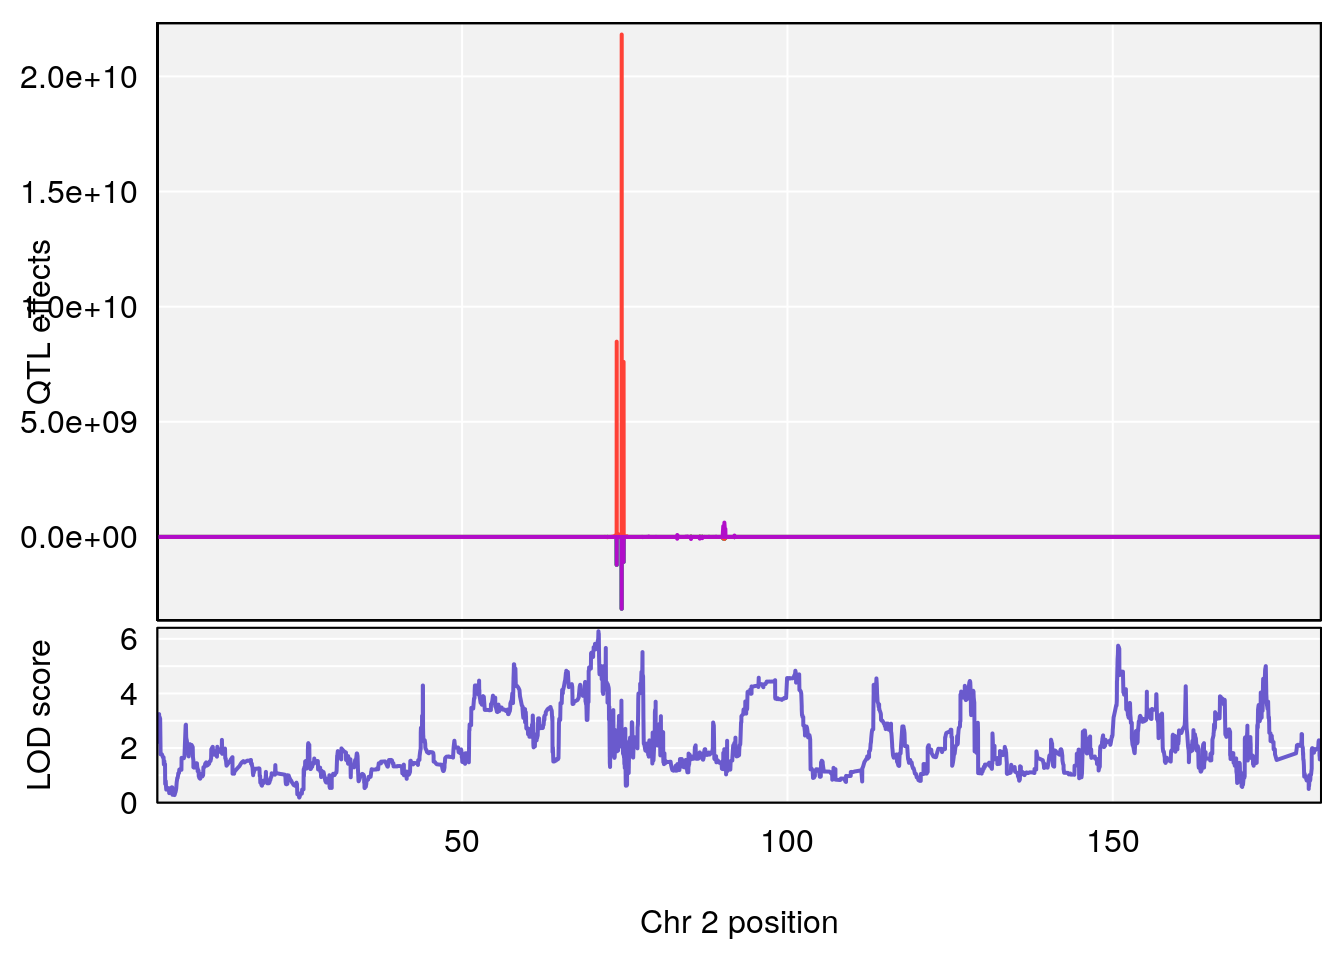
| Version | Author | Date |
|---|---|---|
| 8fe8543 | xhyuo | 2023-02-20 |
| Version | Author | Date |
|---|---|---|
| 8fe8543 | xhyuo | 2023-02-20 |
| Version | Author | Date |
|---|---|---|
| 8fe8543 | xhyuo | 2023-02-20 |
# [1] 2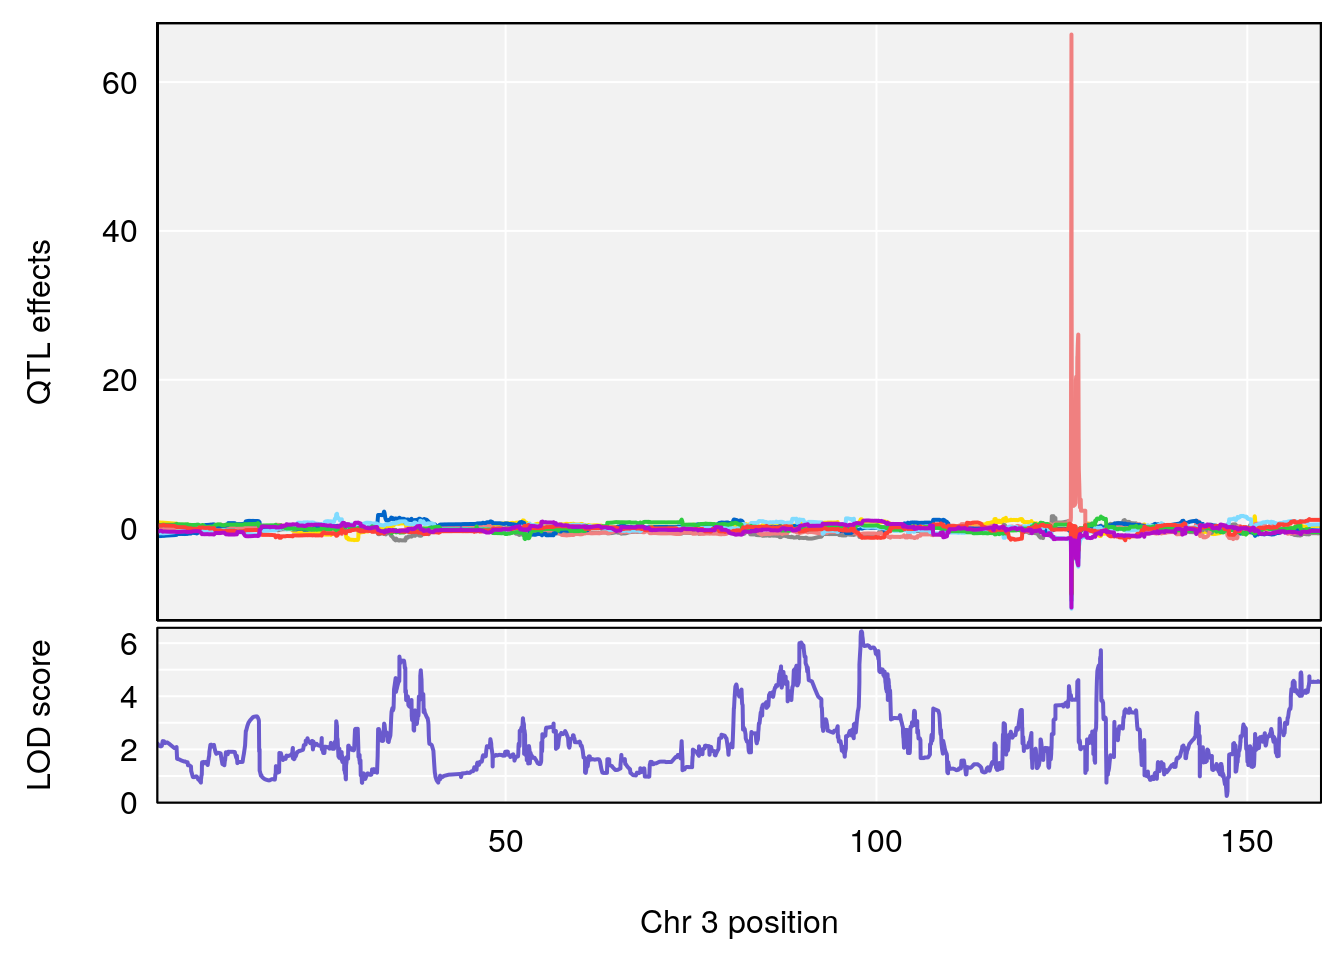
| Version | Author | Date |
|---|---|---|
| 8fe8543 | xhyuo | 2023-02-20 |
| Version | Author | Date |
|---|---|---|
| 8fe8543 | xhyuo | 2023-02-20 |
| Version | Author | Date |
|---|---|---|
| 8fe8543 | xhyuo | 2023-02-20 |
# [1] 3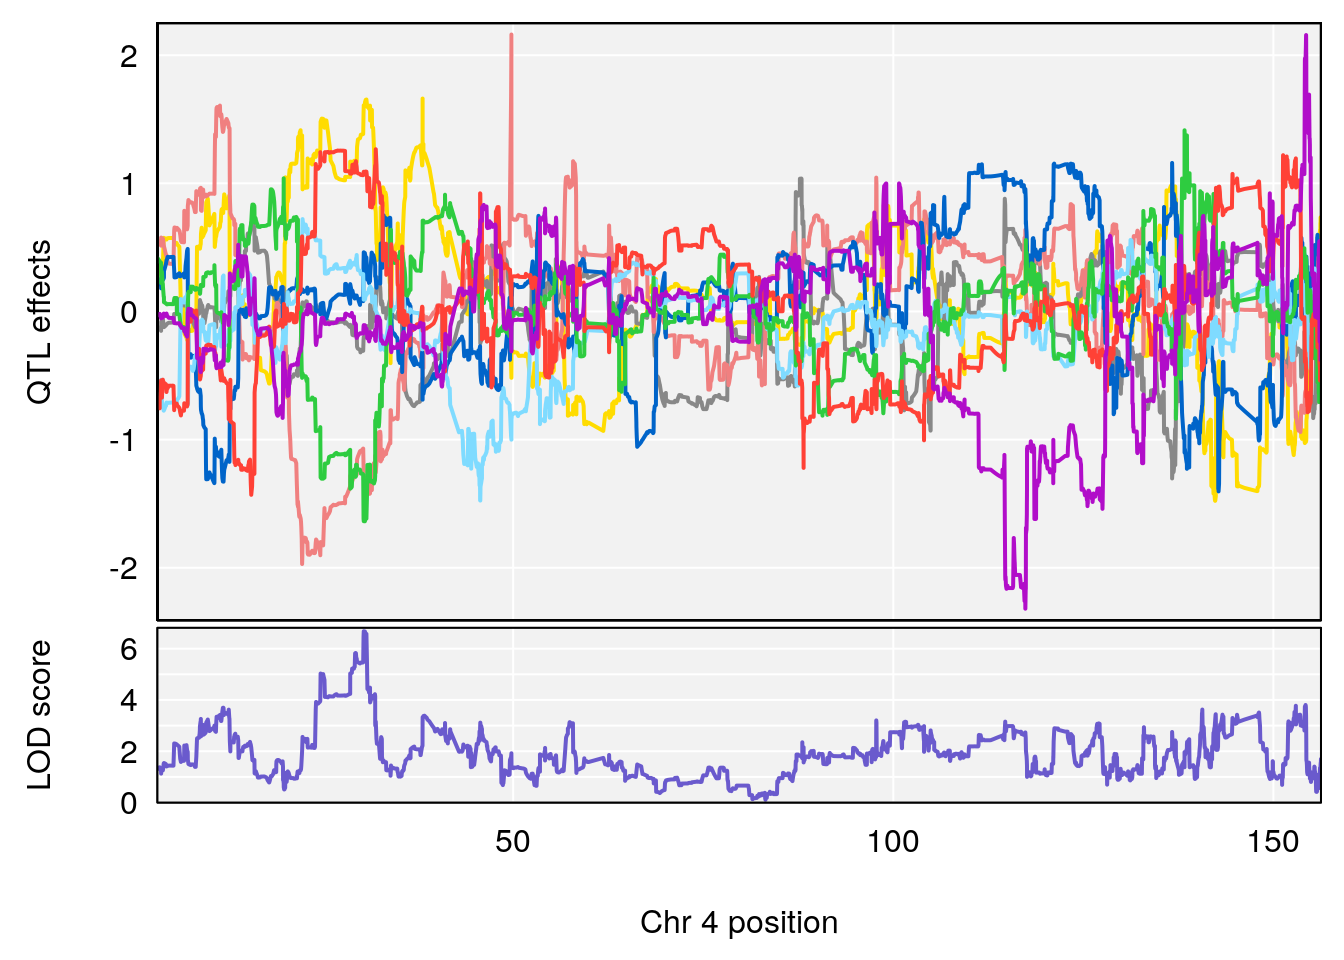
| Version | Author | Date |
|---|---|---|
| 8fe8543 | xhyuo | 2023-02-20 |
| Version | Author | Date |
|---|---|---|
| 8fe8543 | xhyuo | 2023-02-20 |
| Version | Author | Date |
|---|---|---|
| 8fe8543 | xhyuo | 2023-02-20 |
# [1] 4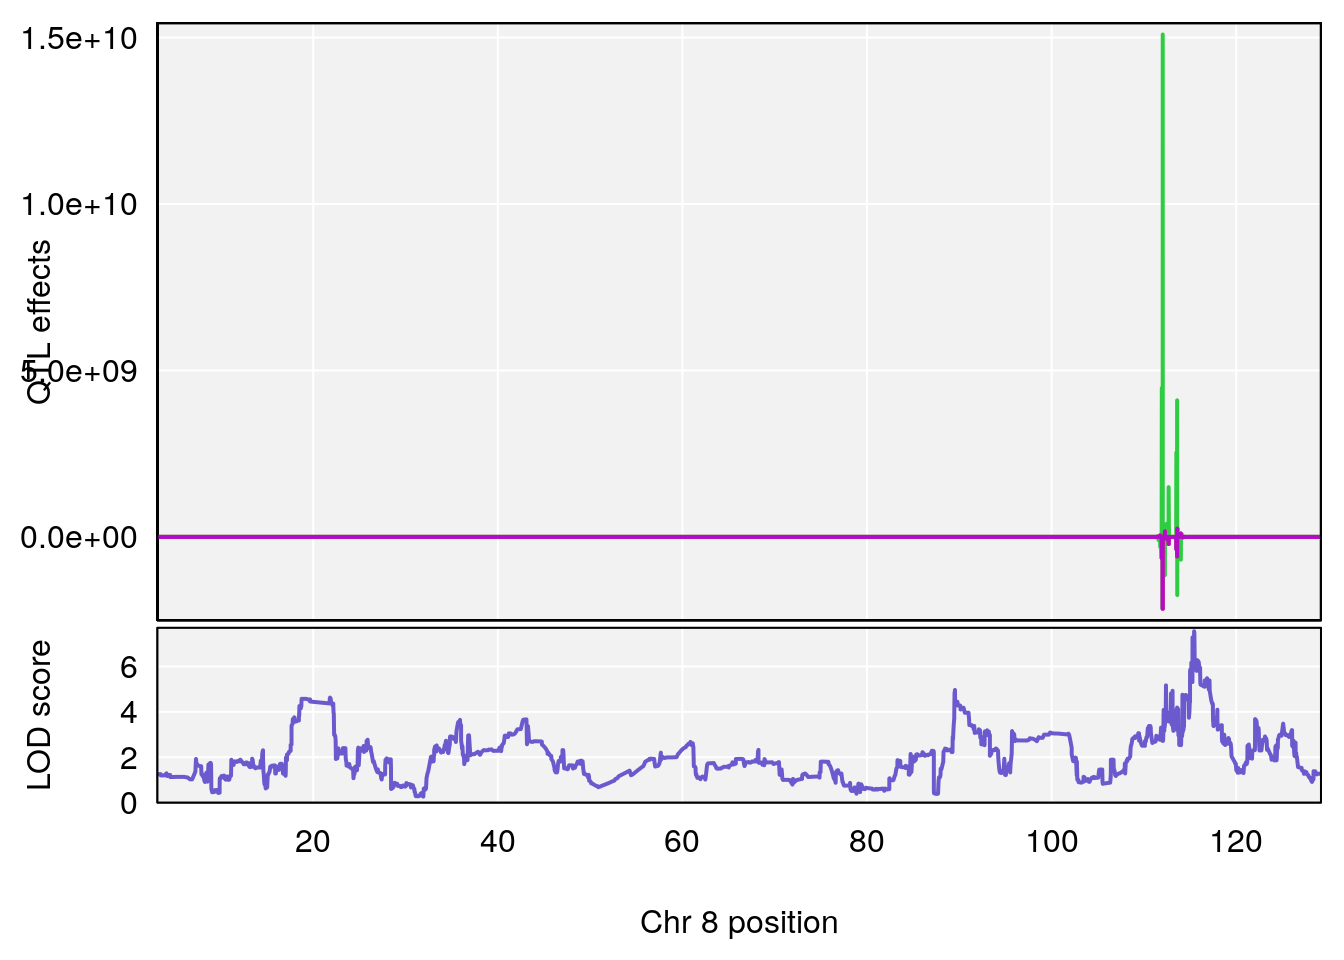
| Version | Author | Date |
|---|---|---|
| 8fe8543 | xhyuo | 2023-02-20 |
| Version | Author | Date |
|---|---|---|
| 8fe8543 | xhyuo | 2023-02-20 |
| Version | Author | Date |
|---|---|---|
| 8fe8543 | xhyuo | 2023-02-20 |
# [1] 5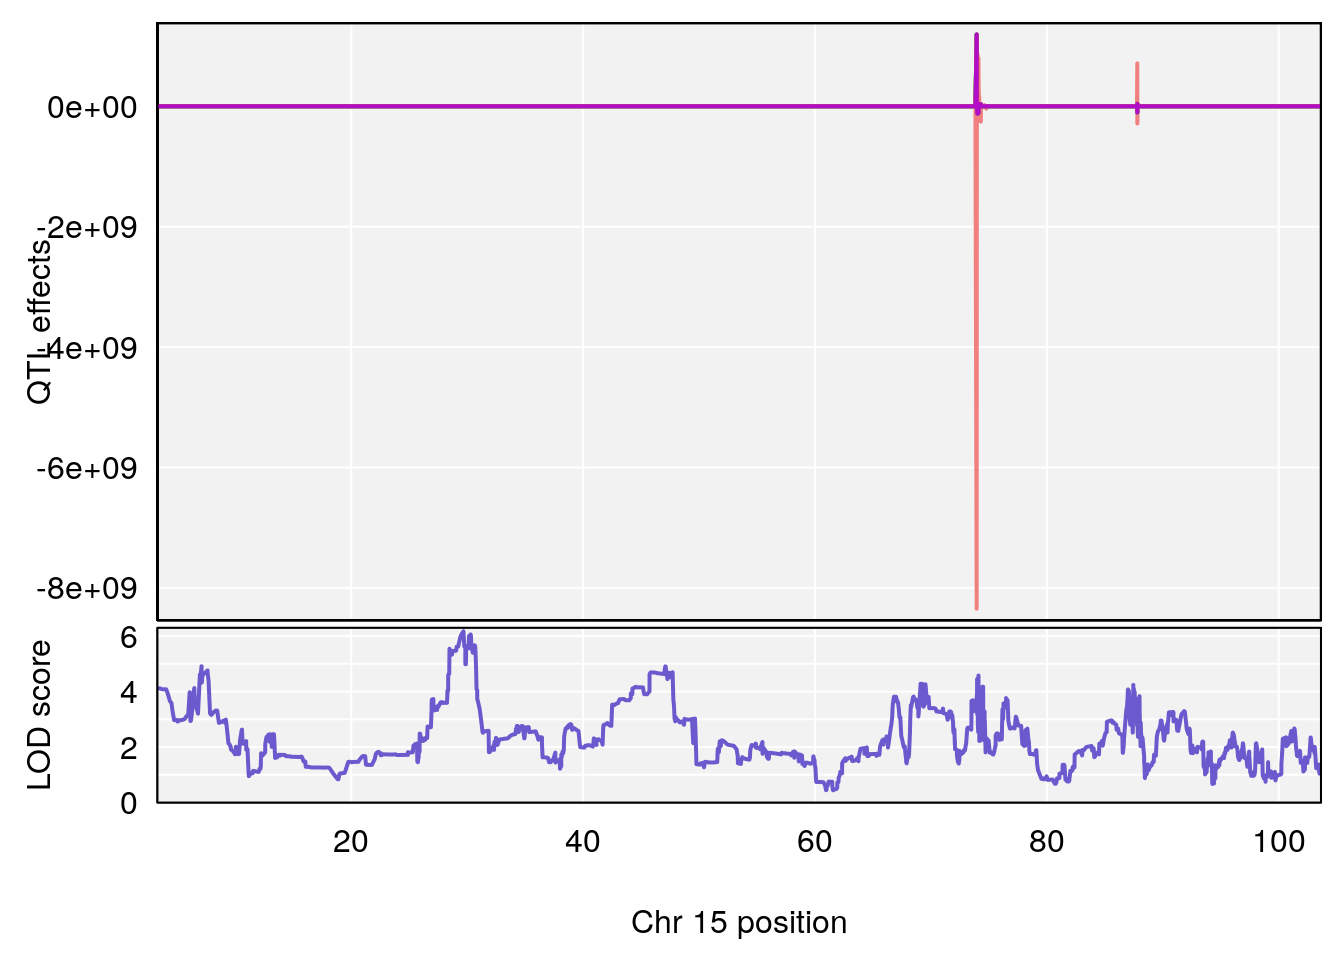
| Version | Author | Date |
|---|---|---|
| 8fe8543 | xhyuo | 2023-02-20 |
| Version | Author | Date |
|---|---|---|
| 8fe8543 | xhyuo | 2023-02-20 |
| Version | Author | Date |
|---|---|---|
| 8fe8543 | xhyuo | 2023-02-20 |
# [1] 6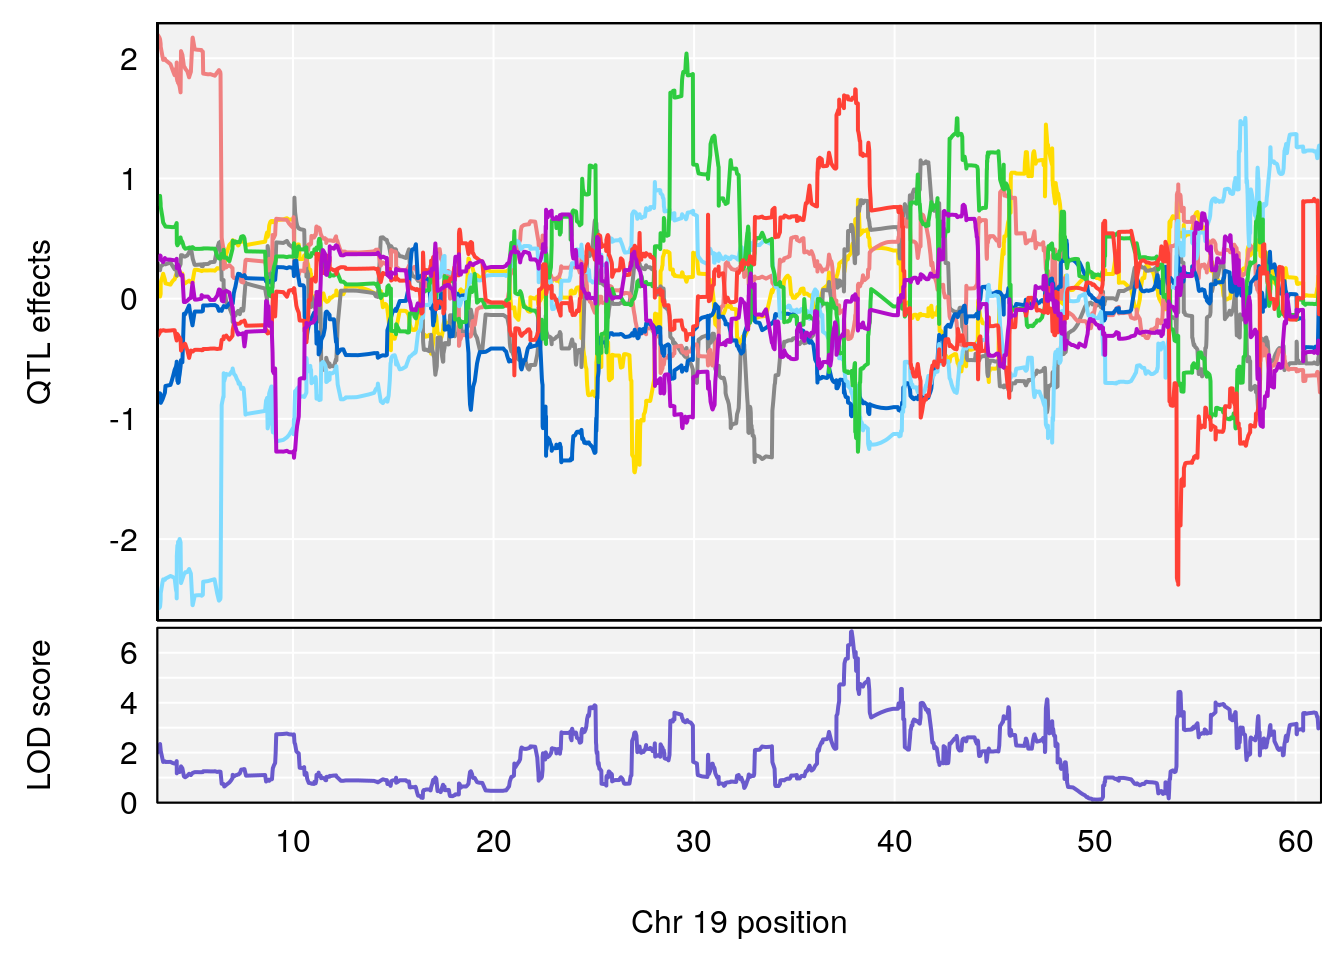
| Version | Author | Date |
|---|---|---|
| 8fe8543 | xhyuo | 2023-02-20 |
| Version | Author | Date |
|---|---|---|
| 8fe8543 | xhyuo | 2023-02-20 |
| Version | Author | Date |
|---|---|---|
| 8fe8543 | xhyuo | 2023-02-20 |
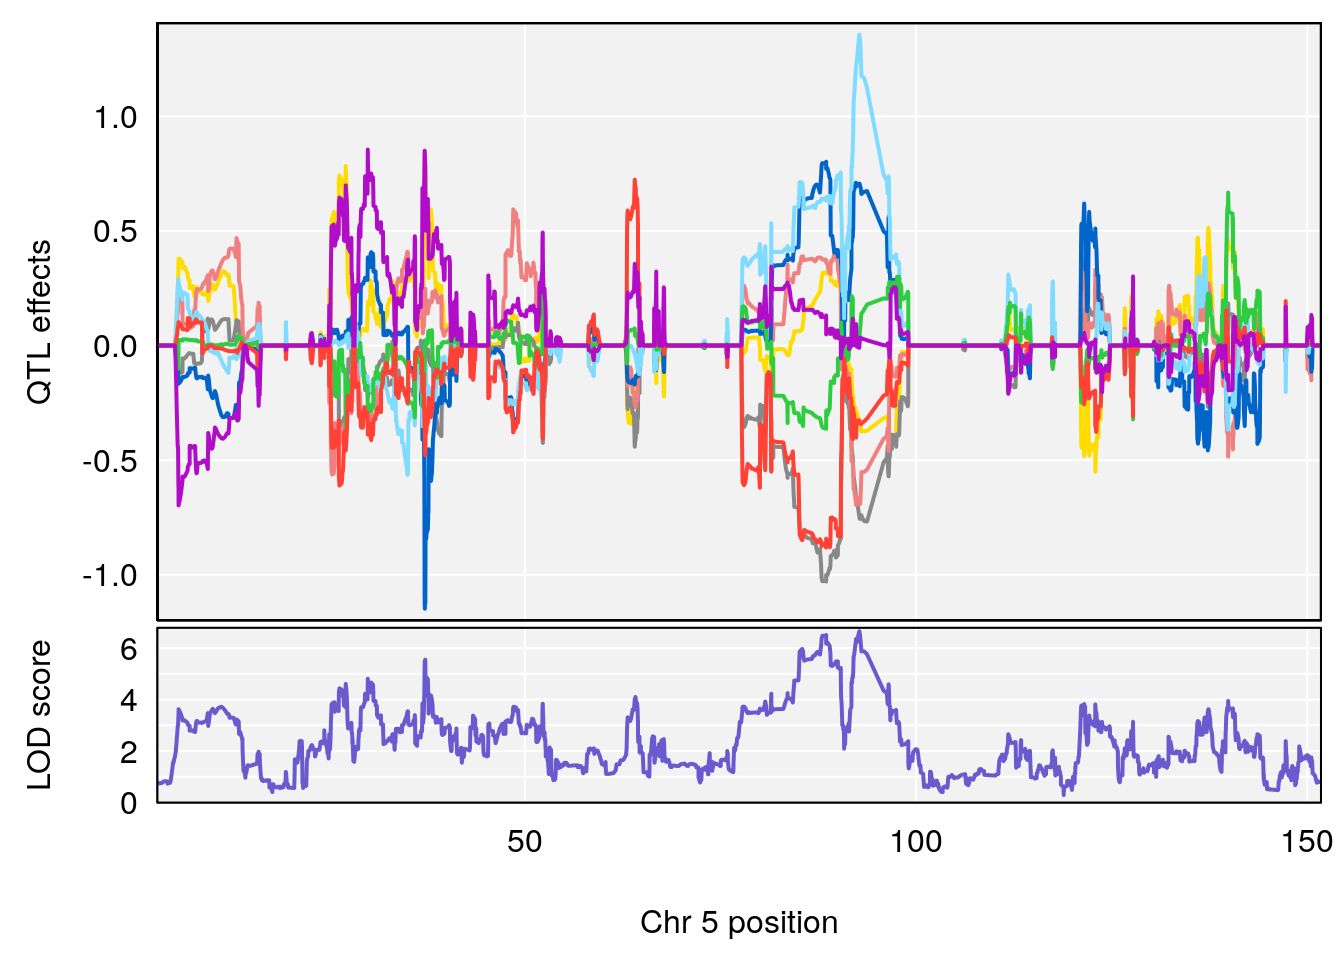
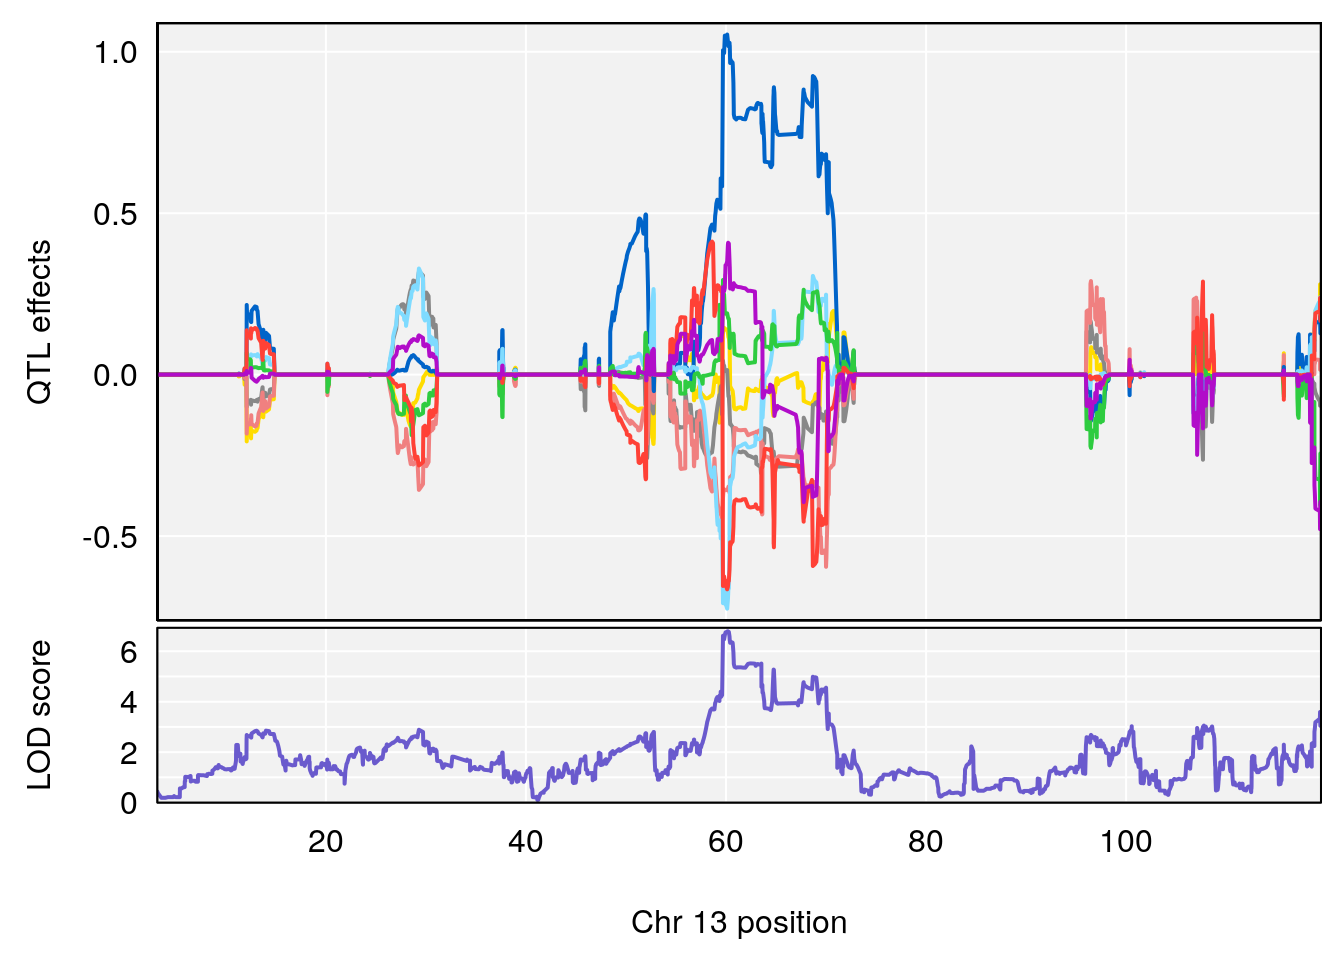
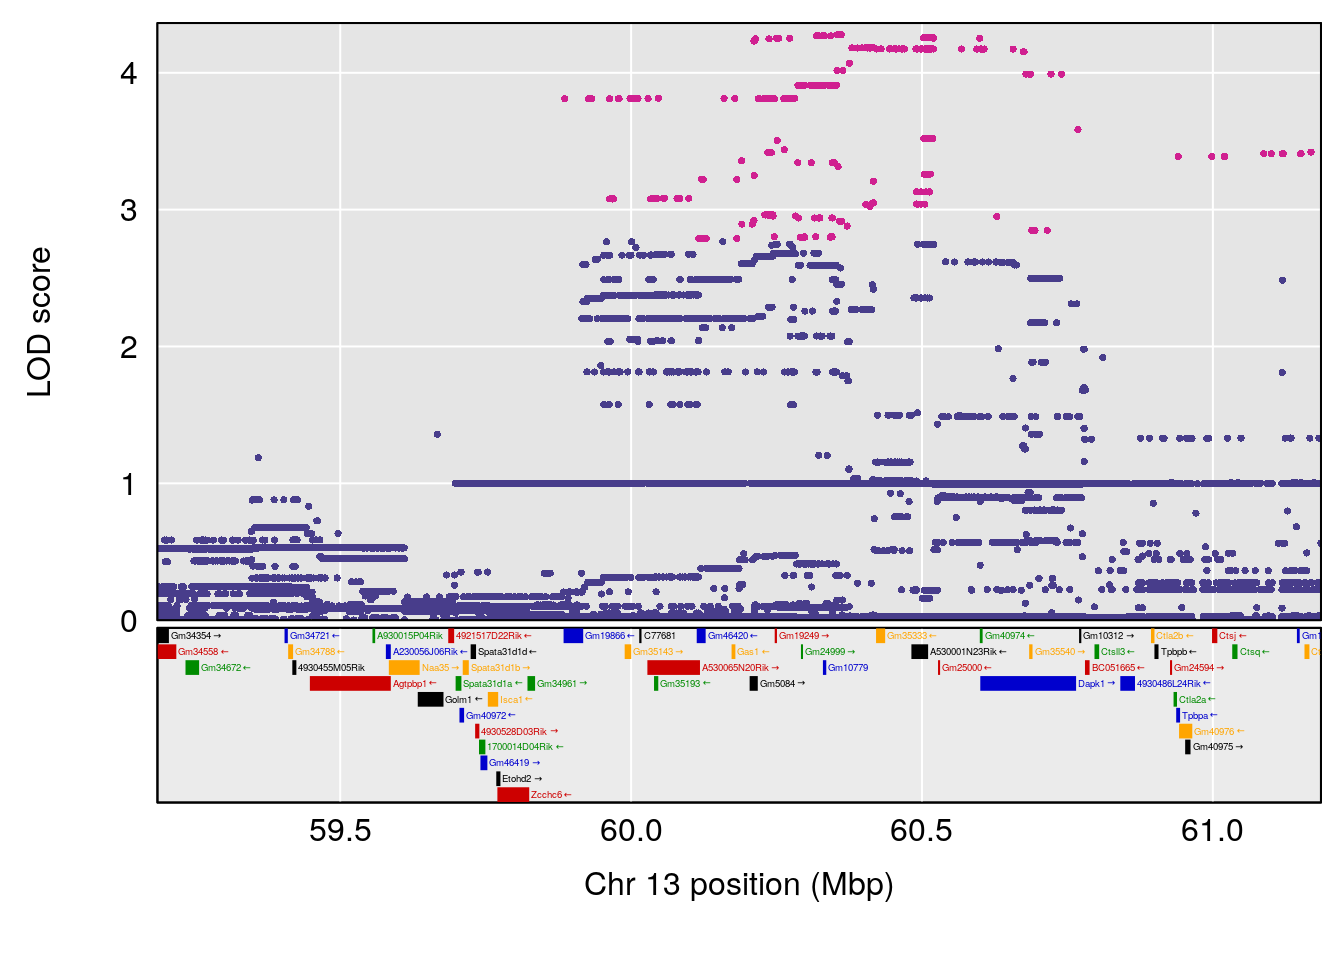
# [1] "Recovery.Time"
#   lodindex lodcolumn chr        pos      lod      ci_lo      ci_hi
# 1        1    pheno1   3 123.593760 6.464420 117.457785 123.638818
# 2        1    pheno1   4 156.048178 6.417408 114.723317 156.119928
# 3        1    pheno1   5  92.743909 6.654942  37.152061  95.838678
# 4        1    pheno1  10   5.988497 7.279613   5.445056   8.819529
# 5        1    pheno1  13  60.185807 6.793807  59.610678  63.542749
# [1] 1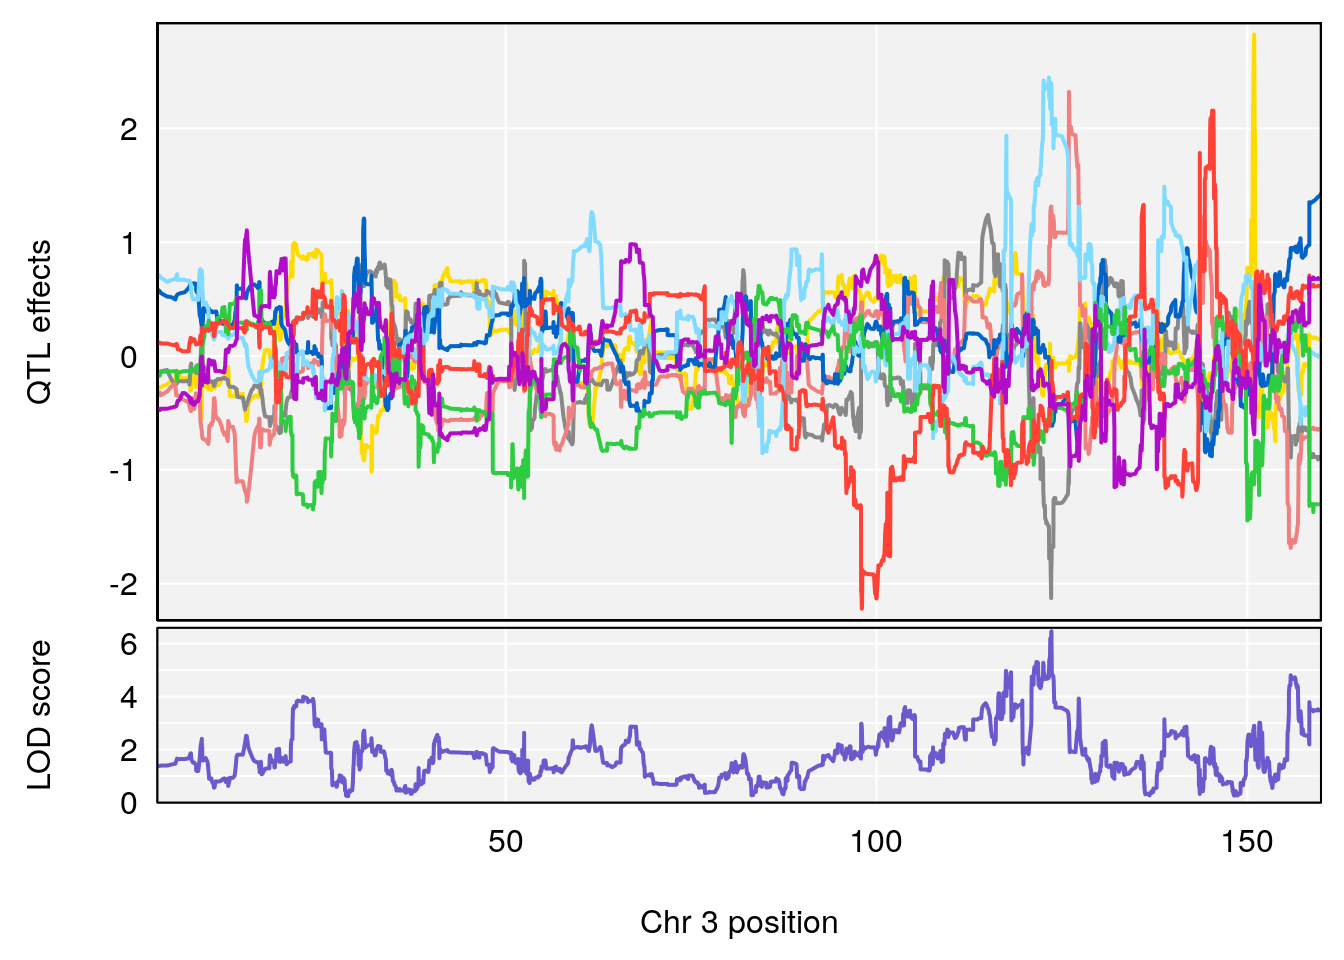
| Version | Author | Date |
|---|---|---|
| 8fe8543 | xhyuo | 2023-02-20 |
| Version | Author | Date |
|---|---|---|
| 8fe8543 | xhyuo | 2023-02-20 |
| Version | Author | Date |
|---|---|---|
| 8fe8543 | xhyuo | 2023-02-20 |
# [1] 2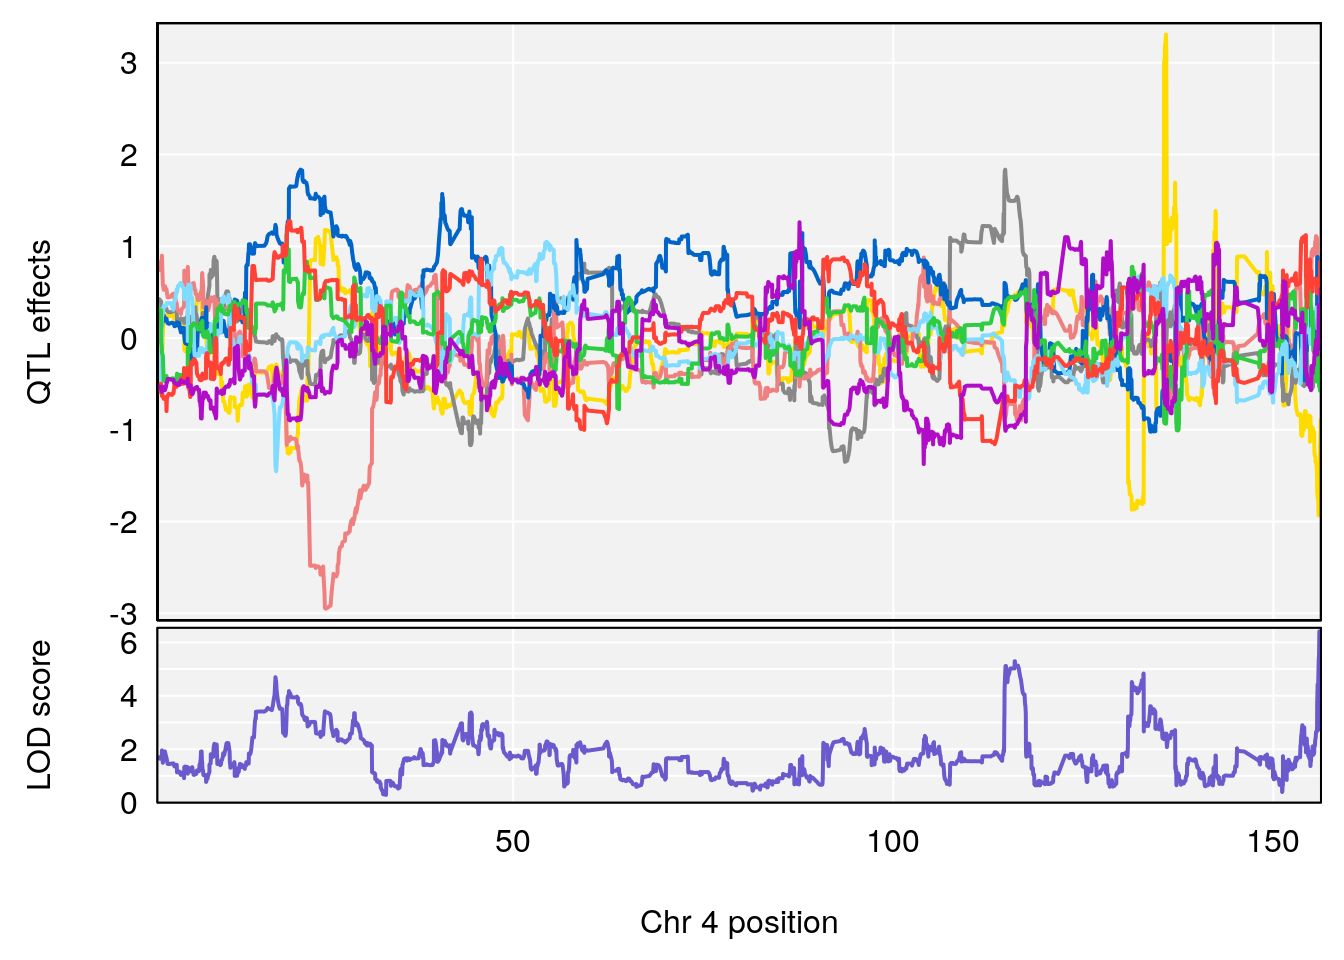
| Version | Author | Date |
|---|---|---|
| 8fe8543 | xhyuo | 2023-02-20 |
| Version | Author | Date |
|---|---|---|
| 8fe8543 | xhyuo | 2023-02-20 |
| Version | Author | Date |
|---|---|---|
| 8fe8543 | xhyuo | 2023-02-20 |
# [1] 3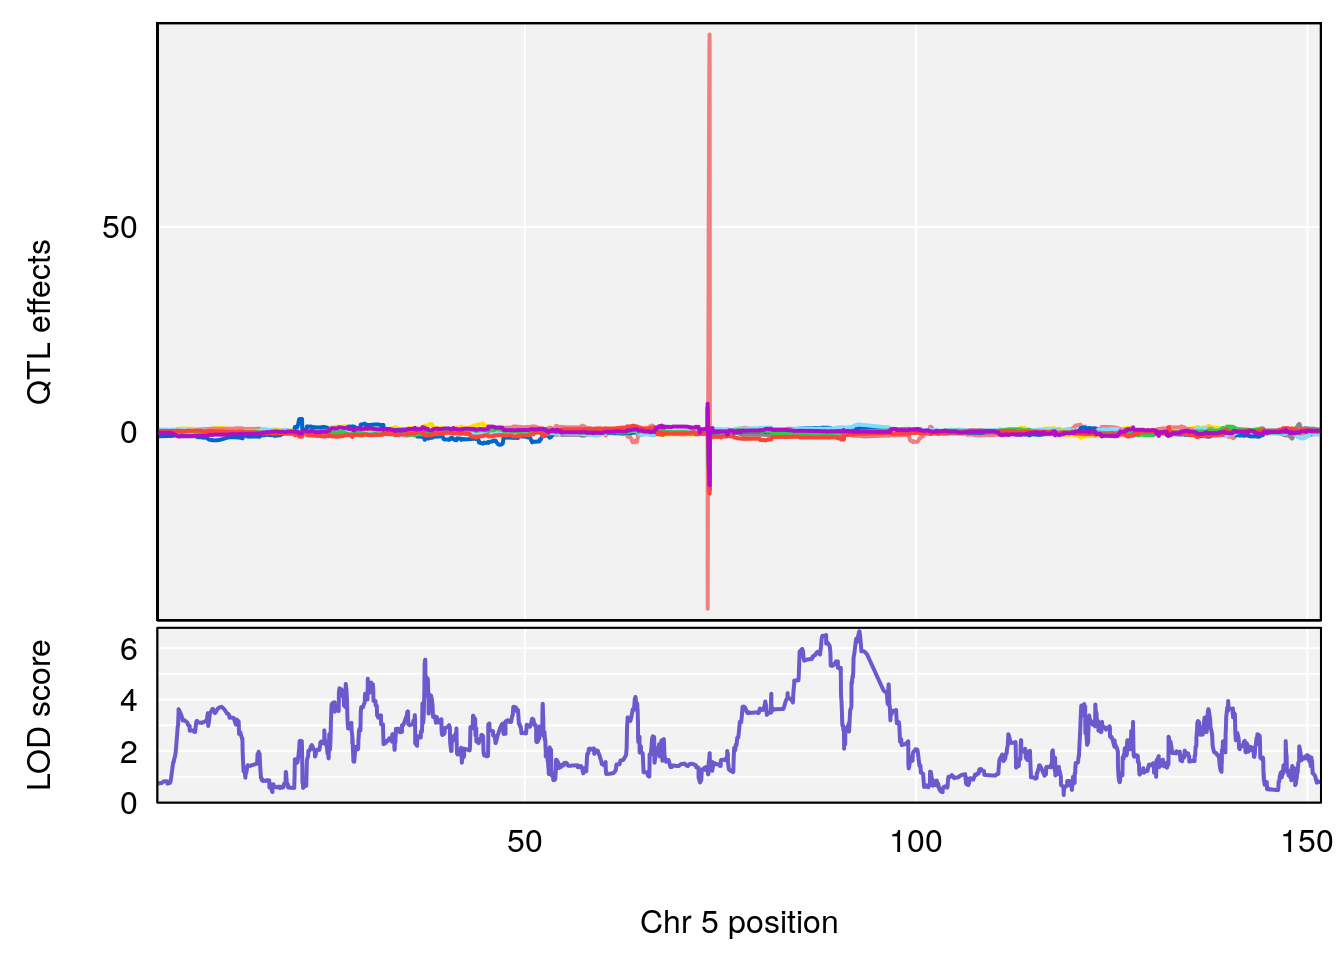
| Version | Author | Date |
|---|---|---|
| 8fe8543 | xhyuo | 2023-02-20 |
| Version | Author | Date |
|---|---|---|
| 8fe8543 | xhyuo | 2023-02-20 |
| Version | Author | Date |
|---|---|---|
| 8fe8543 | xhyuo | 2023-02-20 |
# [1] 4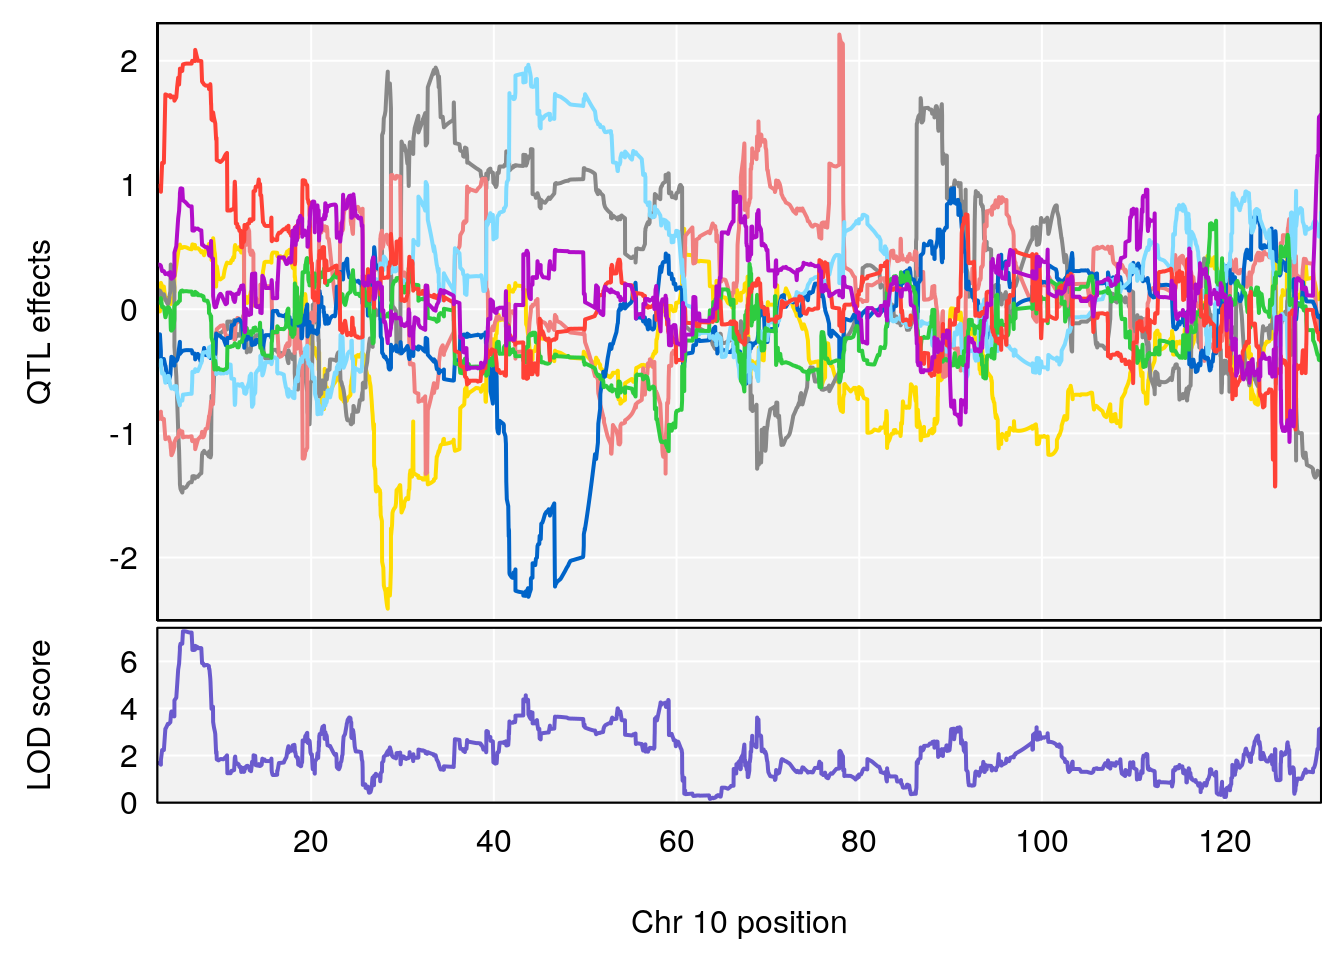
| Version | Author | Date |
|---|---|---|
| 8fe8543 | xhyuo | 2023-02-20 |
| Version | Author | Date |
|---|---|---|
| 8fe8543 | xhyuo | 2023-02-20 |
| Version | Author | Date |
|---|---|---|
| 8fe8543 | xhyuo | 2023-02-20 |
# [1] 5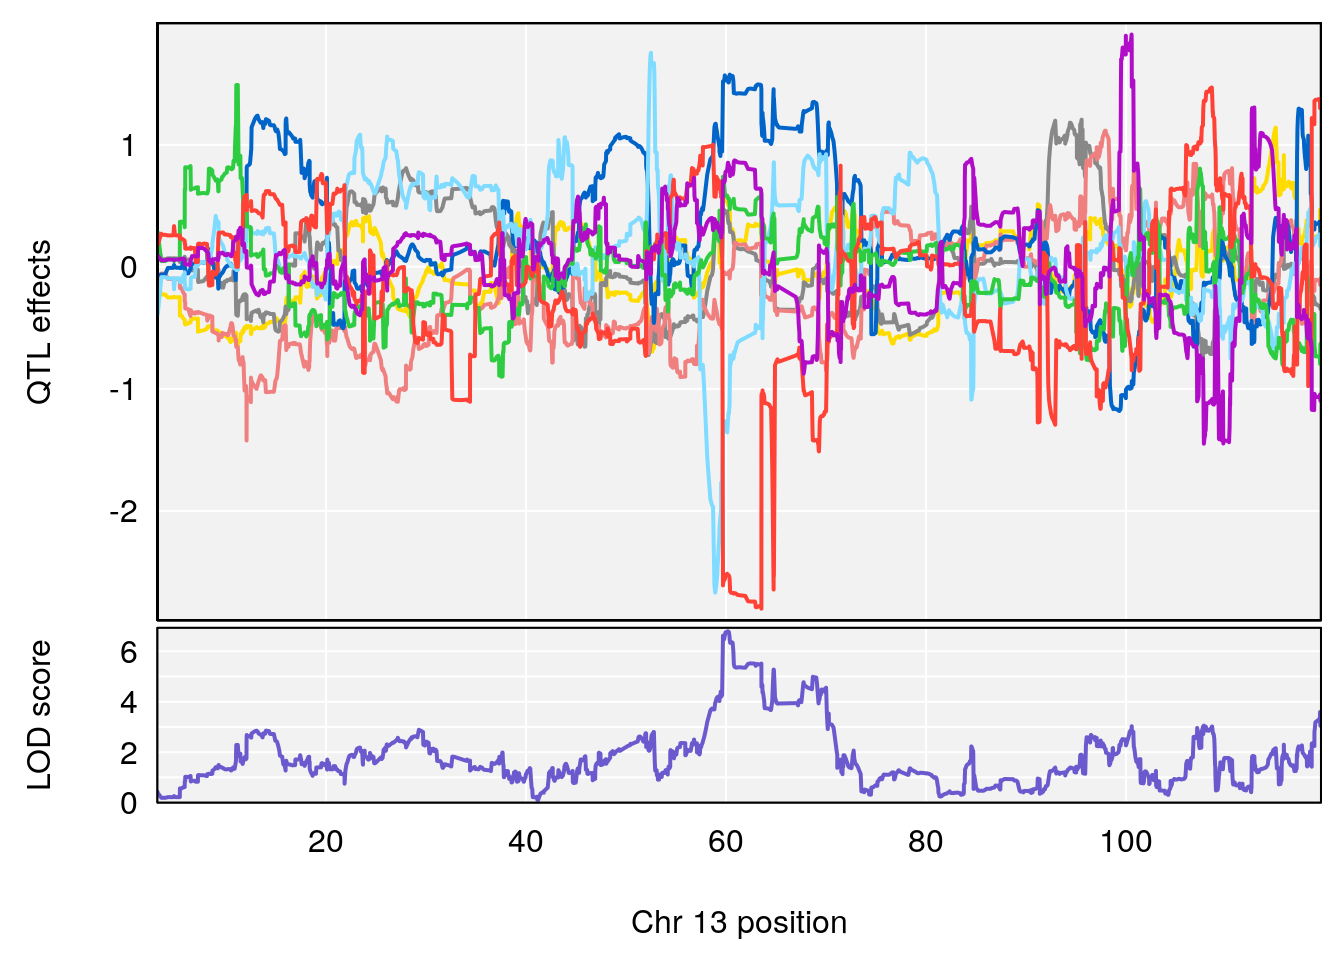
| Version | Author | Date |
|---|---|---|
| 8fe8543 | xhyuo | 2023-02-20 |
| Version | Author | Date |
|---|---|---|
| 8fe8543 | xhyuo | 2023-02-20 |
| Version | Author | Date |
|---|---|---|
| 8fe8543 | xhyuo | 2023-02-20 |
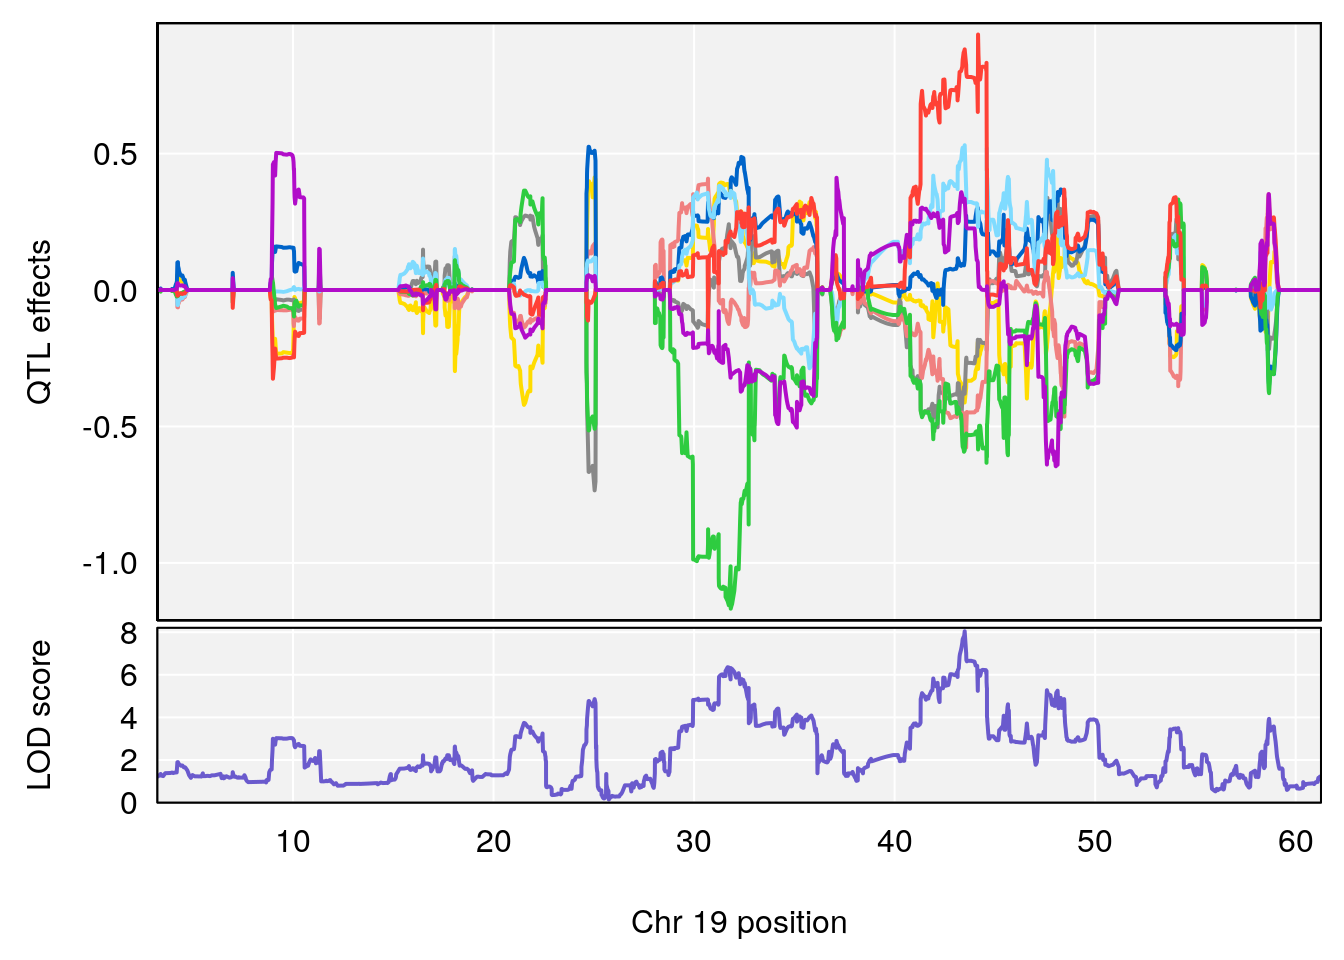
# [1] "Min.depression"
#   lodindex lodcolumn chr       pos      lod     ci_lo     ci_hi
# 1        1    pheno1   6  93.69909 6.430461  93.60934  94.86810
# 2        1    pheno1  19  43.49508 8.046388  43.20074  44.03063
# 3        1    pheno1   X 163.31238 7.736391 160.41596 164.23444
# [1] 1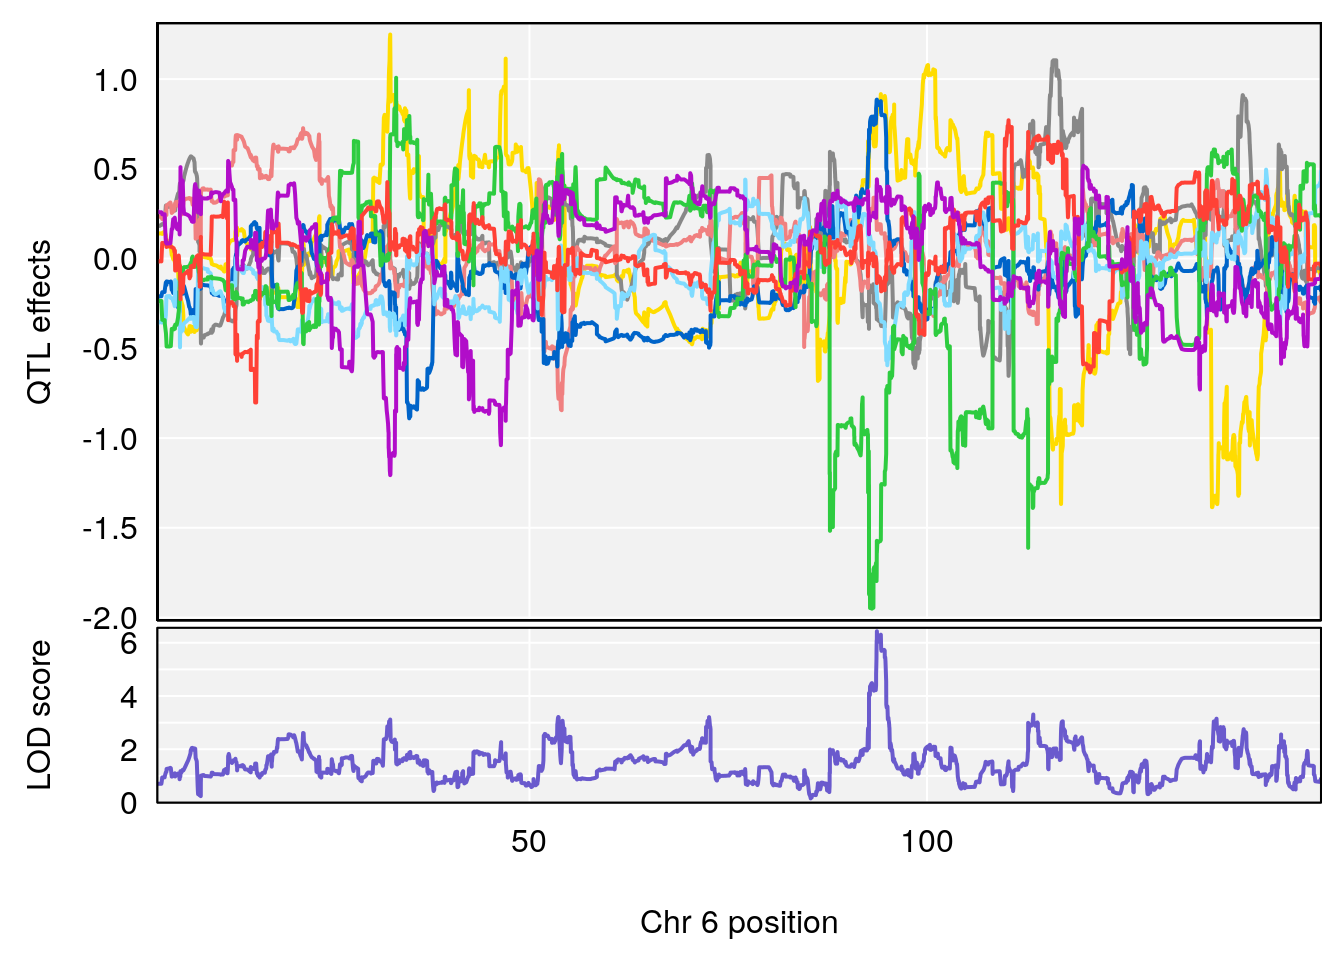
| Version | Author | Date |
|---|---|---|
| 8fe8543 | xhyuo | 2023-02-20 |
| Version | Author | Date |
|---|---|---|
| 8fe8543 | xhyuo | 2023-02-20 |
| Version | Author | Date |
|---|---|---|
| 8fe8543 | xhyuo | 2023-02-20 |
# [1] 2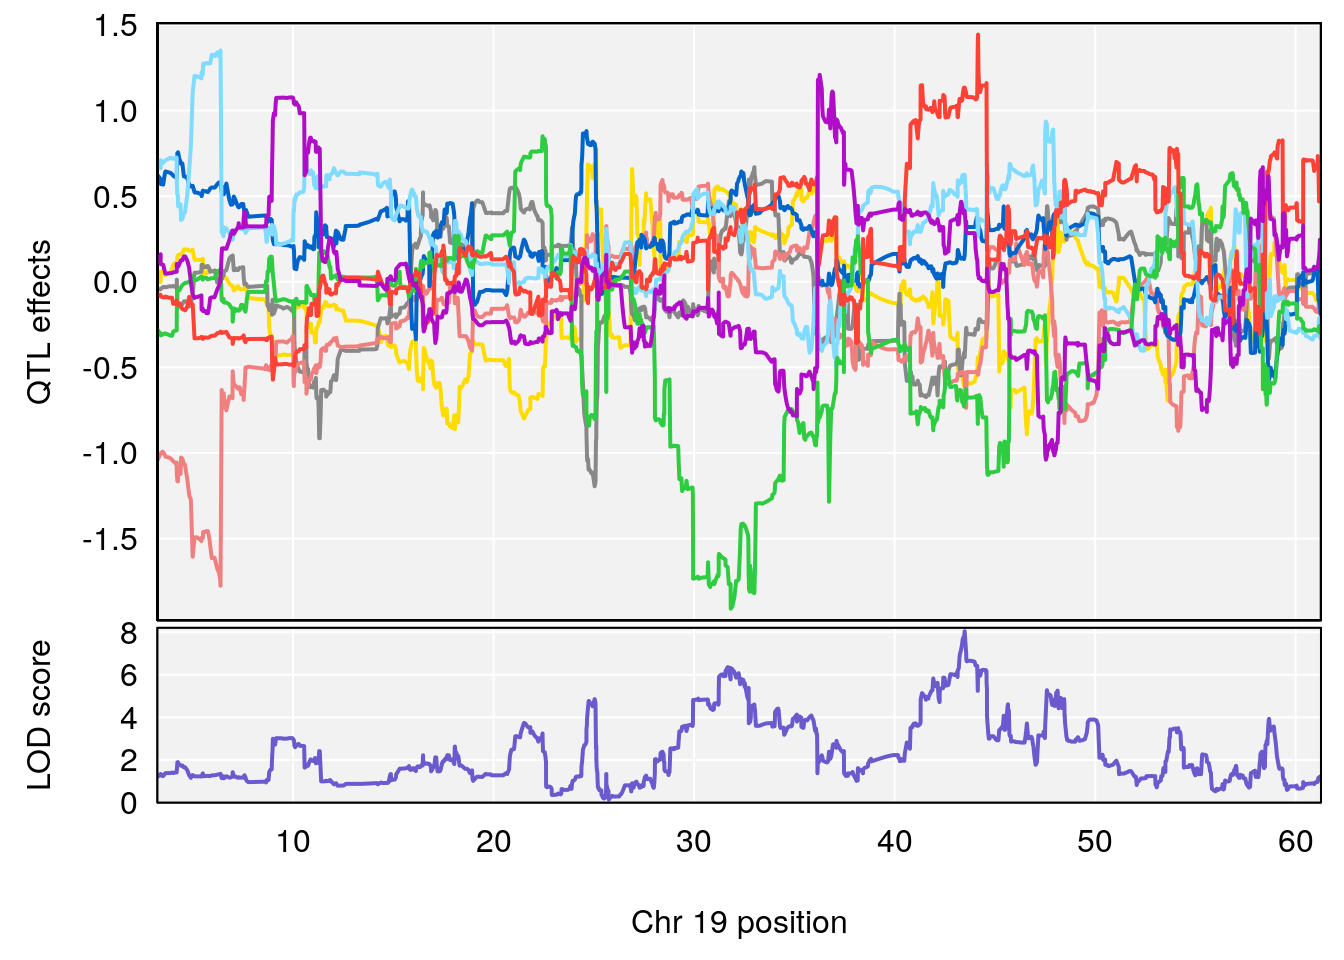
| Version | Author | Date |
|---|---|---|
| 8fe8543 | xhyuo | 2023-02-20 |
| Version | Author | Date |
|---|---|---|
| 8fe8543 | xhyuo | 2023-02-20 |
| Version | Author | Date |
|---|---|---|
| 8fe8543 | xhyuo | 2023-02-20 |
# [1] 3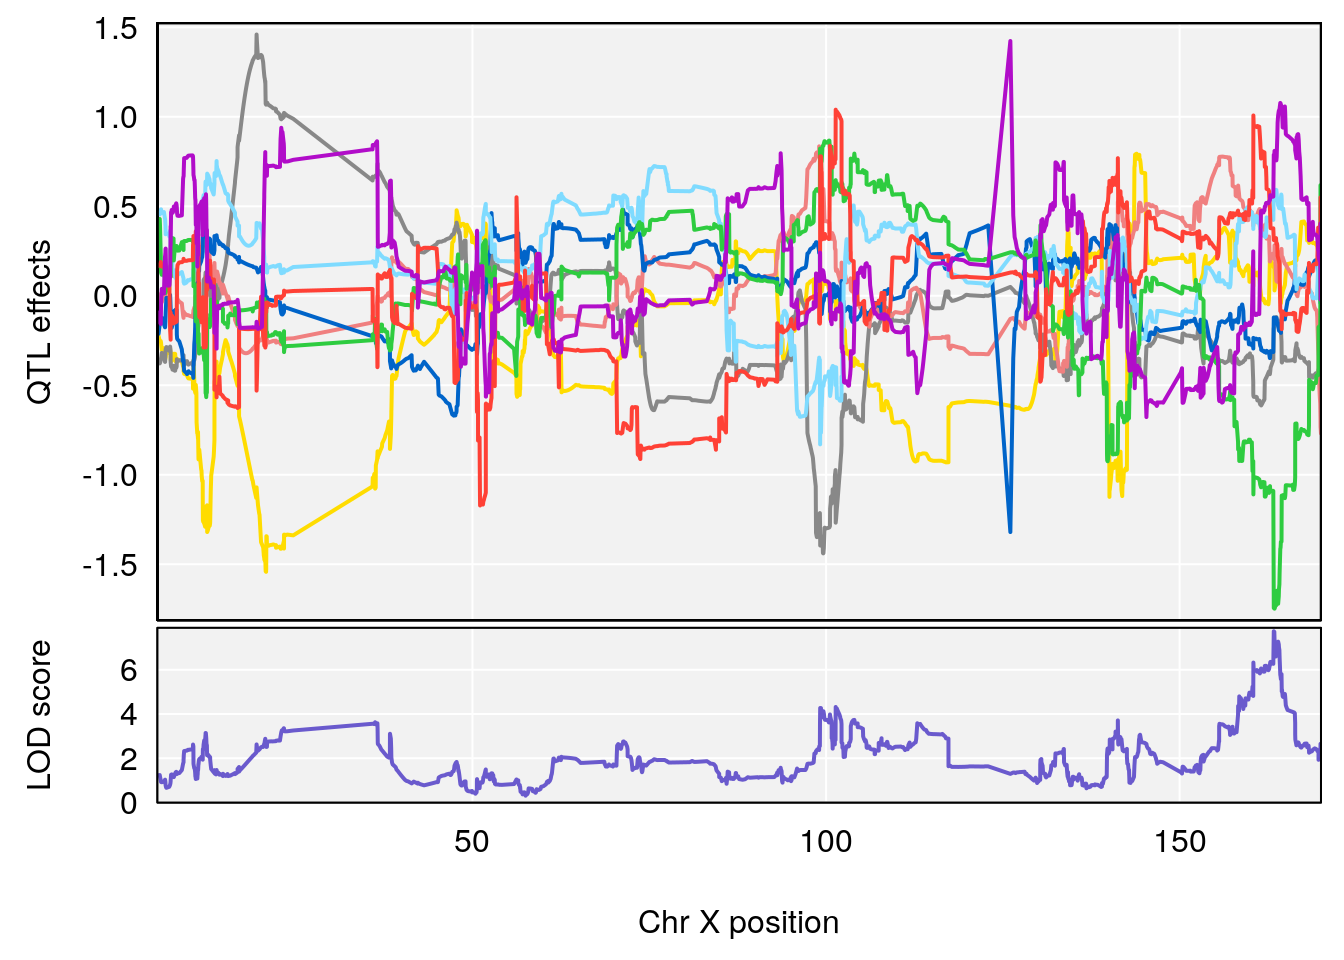
| Version | Author | Date |
|---|---|---|
| 8fe8543 | xhyuo | 2023-02-20 |
| Version | Author | Date |
|---|---|---|
| 8fe8543 | xhyuo | 2023-02-20 |
| Version | Author | Date |
|---|---|---|
| 8fe8543 | xhyuo | 2023-02-20 |
# [1] "Status_bin"
#   lodindex lodcolumn chr       pos      lod     ci_lo     ci_hi
# 1        1    pheno1   3 53.017859 6.760367 52.833289 53.290619
# 2        1    pheno1   6  4.124793 6.678702  3.200188  5.832646
# 3        1    pheno1   9 68.129978 6.719334 67.169326 68.687010
# 4        1    pheno1  12  4.923560 7.088994  3.804905  5.324666
# [1] 1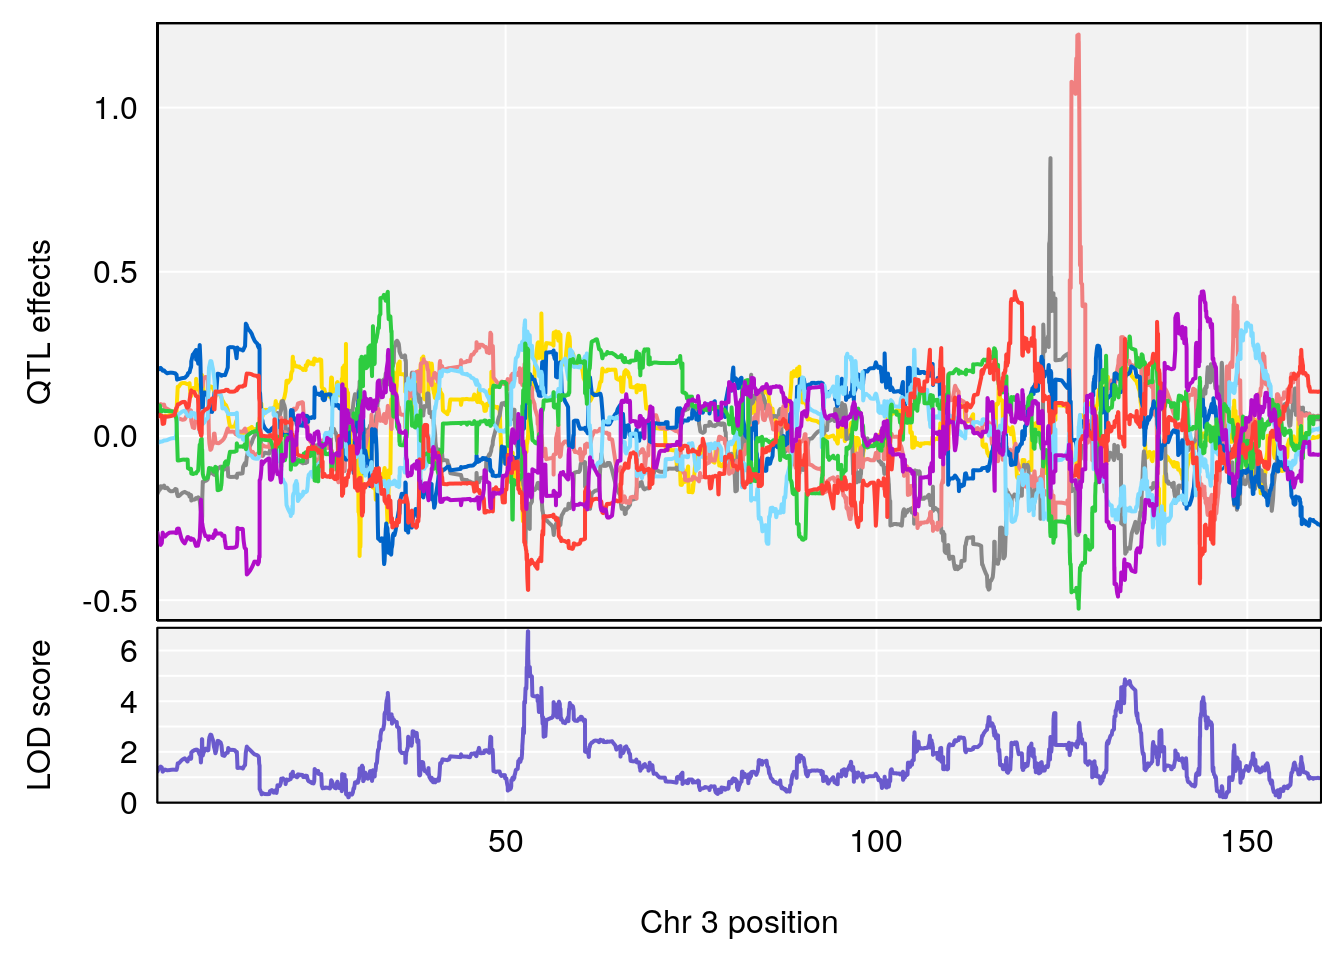
| Version | Author | Date |
|---|---|---|
| 8fe8543 | xhyuo | 2023-02-20 |
| Version | Author | Date |
|---|---|---|
| 8fe8543 | xhyuo | 2023-02-20 |
| Version | Author | Date |
|---|---|---|
| 8fe8543 | xhyuo | 2023-02-20 |
# [1] 2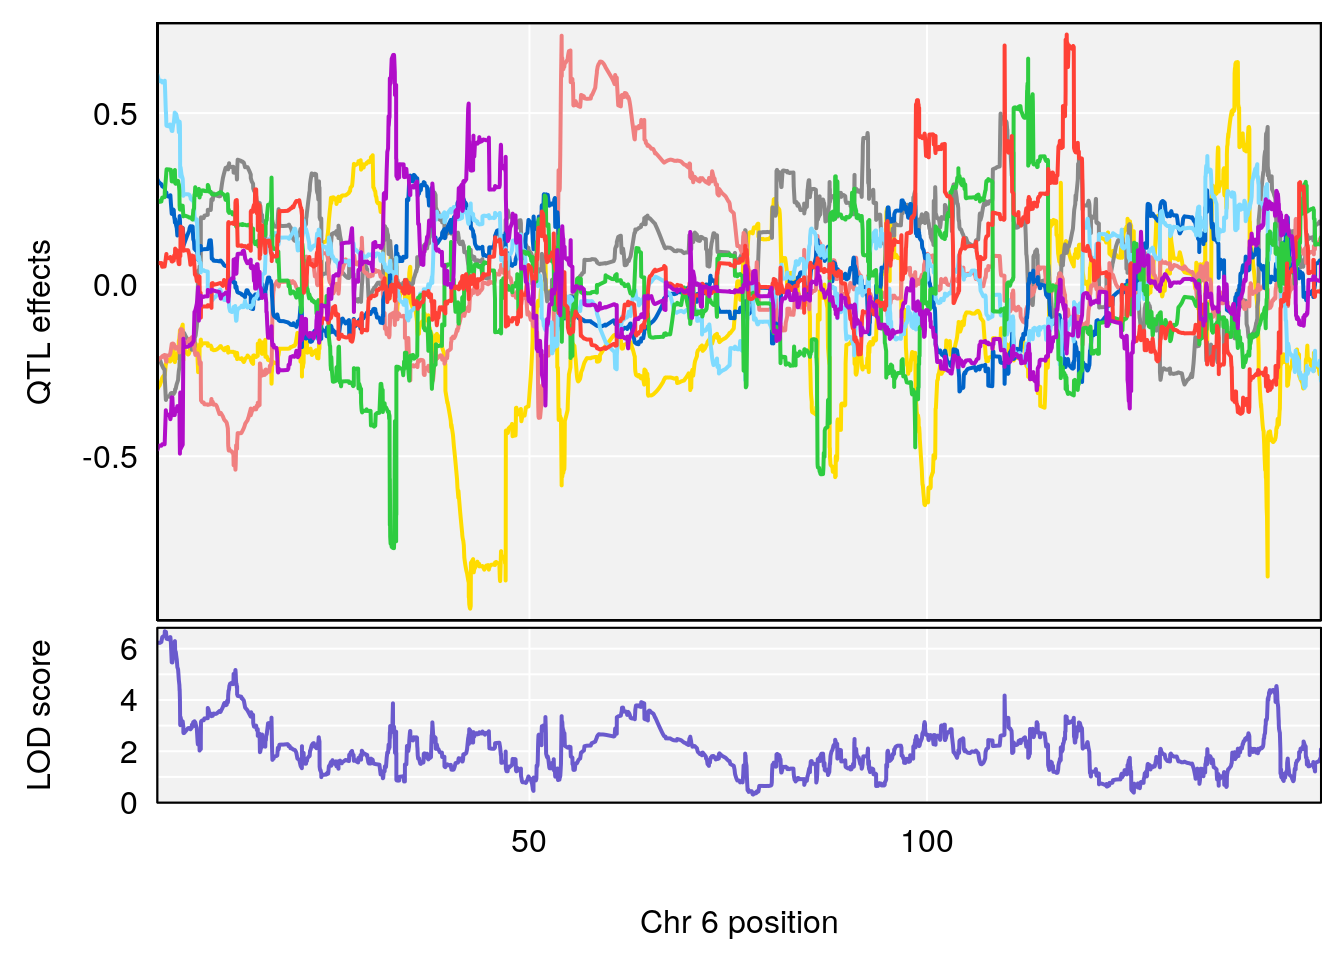
| Version | Author | Date |
|---|---|---|
| 8fe8543 | xhyuo | 2023-02-20 |
| Version | Author | Date |
|---|---|---|
| 8fe8543 | xhyuo | 2023-02-20 |
| Version | Author | Date |
|---|---|---|
| 8fe8543 | xhyuo | 2023-02-20 |
# [1] 3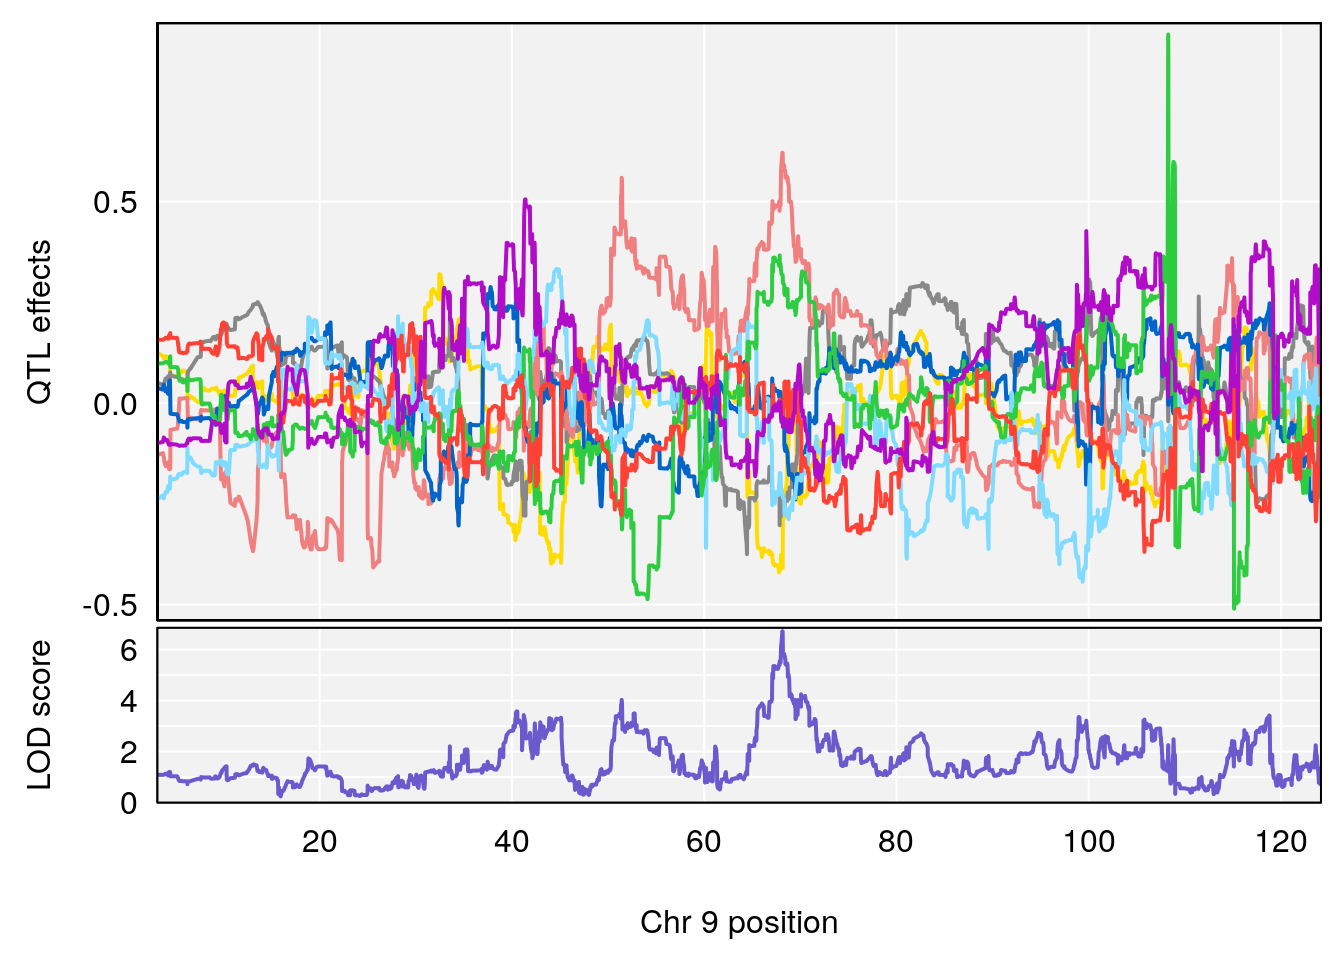
| Version | Author | Date |
|---|---|---|
| 8fe8543 | xhyuo | 2023-02-20 |
| Version | Author | Date |
|---|---|---|
| 8fe8543 | xhyuo | 2023-02-20 |
| Version | Author | Date |
|---|---|---|
| 8fe8543 | xhyuo | 2023-02-20 |
# [1] 4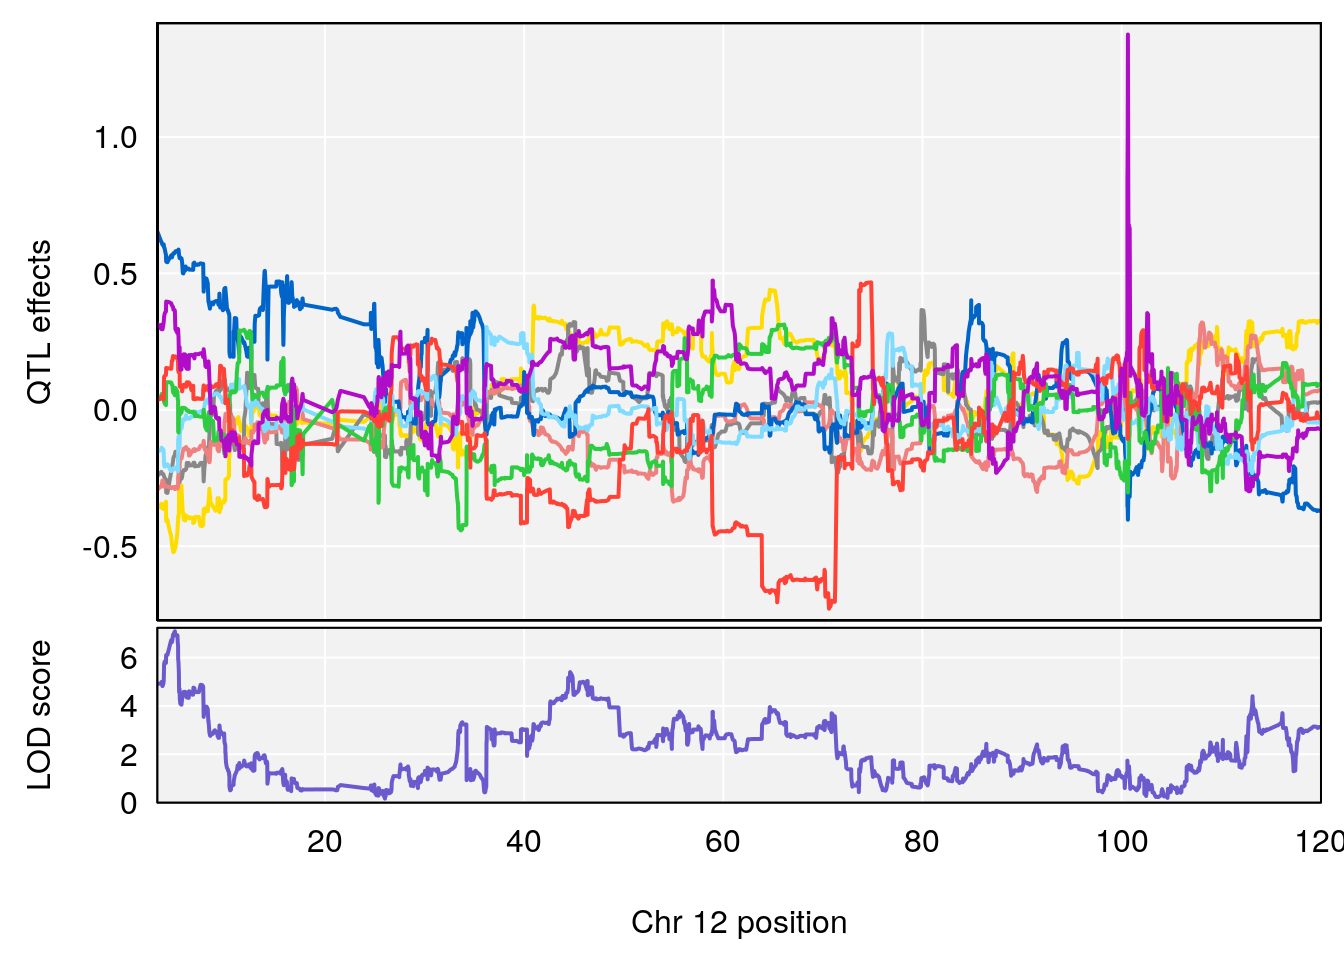
| Version | Author | Date |
|---|---|---|
| 8fe8543 | xhyuo | 2023-02-20 |
| Version | Author | Date |
|---|---|---|
| 8fe8543 | xhyuo | 2023-02-20 |
| Version | Author | Date |
|---|---|---|
| 8fe8543 | xhyuo | 2023-02-20 |
sessionInfo()
# R version 4.0.3 (2020-10-10)
# Platform: x86_64-pc-linux-gnu (64-bit)
# Running under: Ubuntu 20.04.2 LTS
#
# Matrix products: default
# BLAS/LAPACK: /usr/lib/x86_64-linux-gnu/openblas-pthread/libopenblasp-r0.3.8.so
#
# locale:
#  [1] LC_CTYPE=en_US.UTF-8       LC_NUMERIC=C
#  [3] LC_TIME=en_US.UTF-8        LC_COLLATE=en_US.UTF-8
#  [5] LC_MONETARY=en_US.UTF-8    LC_MESSAGES=C
#  [7] LC_PAPER=en_US.UTF-8       LC_NAME=C
#  [9] LC_ADDRESS=C               LC_TELEPHONE=C
# [11] LC_MEASUREMENT=en_US.UTF-8 LC_IDENTIFICATION=C
#
# attached base packages:
# [1] parallel  stats     graphics  grDevices utils     datasets  methods
# [8] base
#
# other attached packages:
# [1] openxlsx_4.2.3  abind_1.4-5     regress_1.3-21  survival_3.2-7
# [5] qtl2_0.24       GGally_2.1.0    gridExtra_2.3   ggplot2_3.3.3
# [9] workflowr_1.6.2
#
# loaded via a namespace (and not attached):
#  [1] tidyselect_1.1.0   xfun_0.21          purrr_0.3.4        lattice_0.20-41
#  [5] splines_4.0.3      colorspace_2.0-0   vctrs_0.3.6        generics_0.1.0
#  [9] htmltools_0.5.1.1  yaml_2.2.1         blob_1.2.1         rlang_1.0.2
# [13] later_1.1.0.1      pillar_1.4.7       glue_1.4.2         withr_2.4.1
# [17] DBI_1.1.1          bit64_4.0.5        RColorBrewer_1.1-2 lifecycle_1.0.0
# [21] plyr_1.8.6         stringr_1.4.0      munsell_0.5.0      gtable_0.3.0
# [25] zip_2.1.1          evaluate_0.14      memoise_2.0.0      labeling_0.4.2
# [29] knitr_1.31         fastmap_1.1.0      httpuv_1.5.5       highr_0.8
# [33] Rcpp_1.0.6         promises_1.2.0.1   scales_1.1.1       cachem_1.0.4
# [37] farver_2.0.3       fs_1.5.0           bit_4.0.4          digest_0.6.27
# [41] stringi_1.5.3      dplyr_1.0.4        grid_4.0.3         rprojroot_2.0.2
# [45] cli_2.3.0          tools_4.0.3        magrittr_2.0.1     tibble_3.0.6
# [49] RSQLite_2.2.3      crayon_1.4.1       whisker_0.4        pkgconfig_2.0.3
# [53] Matrix_1.3-2       ellipsis_0.3.1     data.table_1.13.6  assertthat_0.2.1
# [57] rmarkdown_2.6      reshape_0.8.8      R6_2.5.0           git2r_0.28.0
# [61] compiler_4.0.3
This R Markdown site was created with workflowr