DO_Fentanyl_combining2Cohort_mapping
Hao He
2023-02-21
Last updated: 2023-02-21
Checks: 7 0
Knit directory: DO_Opioid/
This reproducible R Markdown analysis was created with workflowr (version 1.6.2). The Checks tab describes the reproducibility checks that were applied when the results were created. The Past versions tab lists the development history.
Great! Since the R Markdown file has been committed to the Git repository, you know the exact version of the code that produced these results.
Great job! The global environment was empty. Objects defined in the global environment can affect the analysis in your R Markdown file in unknown ways. For reproduciblity it’s best to always run the code in an empty environment.
The command set.seed(20200504) was run prior to running the code in the R Markdown file. Setting a seed ensures that any results that rely on randomness, e.g. subsampling or permutations, are reproducible.
Great job! Recording the operating system, R version, and package versions is critical for reproducibility.
Nice! There were no cached chunks for this analysis, so you can be confident that you successfully produced the results during this run.
Great job! Using relative paths to the files within your workflowr project makes it easier to run your code on other machines.
Great! You are using Git for version control. Tracking code development and connecting the code version to the results is critical for reproducibility.
The results in this page were generated with repository version 2200f95. See the Past versions tab to see a history of the changes made to the R Markdown and HTML files.
Note that you need to be careful to ensure that all relevant files for the analysis have been committed to Git prior to generating the results (you can use wflow_publish or wflow_git_commit). workflowr only checks the R Markdown file, but you know if there are other scripts or data files that it depends on. Below is the status of the Git repository when the results were generated:
Ignored files:
    Ignored:    .RData
    Ignored:    .Rhistory
    Ignored:    .Rproj.user/
    Ignored:    analysis/Picture1.png

Untracked files:
    Untracked:  Rplot_rz.png
    Untracked:  TIMBR.test.prop.bm.MN.RET.RData
    Untracked:  TIMBR.test.random.RData
    Untracked:  TIMBR.test.rz.transformed_TVb_ml.RData
    Untracked:  analysis/DDO_morphine1_second_set_69k.stdout
    Untracked:  analysis/DO_Fentanyl.R
    Untracked:  analysis/DO_Fentanyl.err
    Untracked:  analysis/DO_Fentanyl.out
    Untracked:  analysis/DO_Fentanyl.sh
    Untracked:  analysis/DO_Fentanyl_69k.R
    Untracked:  analysis/DO_Fentanyl_69k.err
    Untracked:  analysis/DO_Fentanyl_69k.out
    Untracked:  analysis/DO_Fentanyl_69k.sh
    Untracked:  analysis/DO_Fentanyl_Cohort2_GCTA_herit.R
    Untracked:  analysis/DO_Fentanyl_Cohort2_gemma.R
    Untracked:  analysis/DO_Fentanyl_Cohort2_mapping.R
    Untracked:  analysis/DO_Fentanyl_Cohort2_mapping.err
    Untracked:  analysis/DO_Fentanyl_Cohort2_mapping.out
    Untracked:  analysis/DO_Fentanyl_Cohort2_mapping.sh
    Untracked:  analysis/DO_Fentanyl_GCTA_herit.R
    Untracked:  analysis/DO_Fentanyl_alternate_metrics_69k.R
    Untracked:  analysis/DO_Fentanyl_alternate_metrics_69k.err
    Untracked:  analysis/DO_Fentanyl_alternate_metrics_69k.out
    Untracked:  analysis/DO_Fentanyl_alternate_metrics_69k.sh
    Untracked:  analysis/DO_Fentanyl_alternate_metrics_array.R
    Untracked:  analysis/DO_Fentanyl_alternate_metrics_array.err
    Untracked:  analysis/DO_Fentanyl_alternate_metrics_array.out
    Untracked:  analysis/DO_Fentanyl_alternate_metrics_array.sh
    Untracked:  analysis/DO_Fentanyl_array.R
    Untracked:  analysis/DO_Fentanyl_array.err
    Untracked:  analysis/DO_Fentanyl_array.out
    Untracked:  analysis/DO_Fentanyl_array.sh
    Untracked:  analysis/DO_Fentanyl_combining2Cohort_GCTA_herit.R
    Untracked:  analysis/DO_Fentanyl_combining2Cohort_gemma.R
    Untracked:  analysis/DO_Fentanyl_combining2Cohort_mapping.R
    Untracked:  analysis/DO_Fentanyl_combining2Cohort_mapping.err
    Untracked:  analysis/DO_Fentanyl_combining2Cohort_mapping.out
    Untracked:  analysis/DO_Fentanyl_combining2Cohort_mapping.sh
    Untracked:  analysis/DO_Fentanyl_combining2Cohort_mapping_CoxPH.R
    Untracked:  analysis/DO_Fentanyl_finalreport_to_plink.sh
    Untracked:  analysis/DO_Fentanyl_gemma.R
    Untracked:  analysis/DO_Fentanyl_gemma.err
    Untracked:  analysis/DO_Fentanyl_gemma.out
    Untracked:  analysis/DO_Fentanyl_gemma.sh
    Untracked:  analysis/DO_morphine1.R
    Untracked:  analysis/DO_morphine1.Rout
    Untracked:  analysis/DO_morphine1.sh
    Untracked:  analysis/DO_morphine1.stderr
    Untracked:  analysis/DO_morphine1.stdout
    Untracked:  analysis/DO_morphine1_SNP.R
    Untracked:  analysis/DO_morphine1_SNP.Rout
    Untracked:  analysis/DO_morphine1_SNP.sh
    Untracked:  analysis/DO_morphine1_SNP.stderr
    Untracked:  analysis/DO_morphine1_SNP.stdout
    Untracked:  analysis/DO_morphine1_combined.R
    Untracked:  analysis/DO_morphine1_combined.Rout
    Untracked:  analysis/DO_morphine1_combined.sh
    Untracked:  analysis/DO_morphine1_combined.stderr
    Untracked:  analysis/DO_morphine1_combined.stdout
    Untracked:  analysis/DO_morphine1_combined_69k.R
    Untracked:  analysis/DO_morphine1_combined_69k.Rout
    Untracked:  analysis/DO_morphine1_combined_69k.sh
    Untracked:  analysis/DO_morphine1_combined_69k.stderr
    Untracked:  analysis/DO_morphine1_combined_69k.stdout
    Untracked:  analysis/DO_morphine1_combined_69k_m2.R
    Untracked:  analysis/DO_morphine1_combined_69k_m2.Rout
    Untracked:  analysis/DO_morphine1_combined_69k_m2.sh
    Untracked:  analysis/DO_morphine1_combined_69k_m2.stderr
    Untracked:  analysis/DO_morphine1_combined_69k_m2.stdout
    Untracked:  analysis/DO_morphine1_combined_weight_DOB.R
    Untracked:  analysis/DO_morphine1_combined_weight_DOB.Rout
    Untracked:  analysis/DO_morphine1_combined_weight_DOB.err
    Untracked:  analysis/DO_morphine1_combined_weight_DOB.out
    Untracked:  analysis/DO_morphine1_combined_weight_DOB.sh
    Untracked:  analysis/DO_morphine1_combined_weight_DOB.stderr
    Untracked:  analysis/DO_morphine1_combined_weight_DOB.stdout
    Untracked:  analysis/DO_morphine1_combined_weight_age.R
    Untracked:  analysis/DO_morphine1_combined_weight_age.err
    Untracked:  analysis/DO_morphine1_combined_weight_age.out
    Untracked:  analysis/DO_morphine1_combined_weight_age.sh
    Untracked:  analysis/DO_morphine1_combined_weight_age_GAMMT.R
    Untracked:  analysis/DO_morphine1_combined_weight_age_GAMMT.err
    Untracked:  analysis/DO_morphine1_combined_weight_age_GAMMT.out
    Untracked:  analysis/DO_morphine1_combined_weight_age_GAMMT.sh
    Untracked:  analysis/DO_morphine1_combined_weight_age_GAMMT_chr19.R
    Untracked:  analysis/DO_morphine1_combined_weight_age_GAMMT_chr19.err
    Untracked:  analysis/DO_morphine1_combined_weight_age_GAMMT_chr19.out
    Untracked:  analysis/DO_morphine1_combined_weight_age_GAMMT_chr19.sh
    Untracked:  analysis/DO_morphine1_cph.R
    Untracked:  analysis/DO_morphine1_cph.Rout
    Untracked:  analysis/DO_morphine1_cph.sh
    Untracked:  analysis/DO_morphine1_second_set.R
    Untracked:  analysis/DO_morphine1_second_set.Rout
    Untracked:  analysis/DO_morphine1_second_set.sh
    Untracked:  analysis/DO_morphine1_second_set.stderr
    Untracked:  analysis/DO_morphine1_second_set.stdout
    Untracked:  analysis/DO_morphine1_second_set_69k.R
    Untracked:  analysis/DO_morphine1_second_set_69k.Rout
    Untracked:  analysis/DO_morphine1_second_set_69k.sh
    Untracked:  analysis/DO_morphine1_second_set_69k.stderr
    Untracked:  analysis/DO_morphine1_second_set_SNP.R
    Untracked:  analysis/DO_morphine1_second_set_SNP.Rout
    Untracked:  analysis/DO_morphine1_second_set_SNP.sh
    Untracked:  analysis/DO_morphine1_second_set_SNP.stderr
    Untracked:  analysis/DO_morphine1_second_set_SNP.stdout
    Untracked:  analysis/DO_morphine1_second_set_weight_DOB.R
    Untracked:  analysis/DO_morphine1_second_set_weight_DOB.Rout
    Untracked:  analysis/DO_morphine1_second_set_weight_DOB.err
    Untracked:  analysis/DO_morphine1_second_set_weight_DOB.out
    Untracked:  analysis/DO_morphine1_second_set_weight_DOB.sh
    Untracked:  analysis/DO_morphine1_second_set_weight_DOB.stderr
    Untracked:  analysis/DO_morphine1_second_set_weight_DOB.stdout
    Untracked:  analysis/DO_morphine1_second_set_weight_age.R
    Untracked:  analysis/DO_morphine1_second_set_weight_age.Rout
    Untracked:  analysis/DO_morphine1_second_set_weight_age.err
    Untracked:  analysis/DO_morphine1_second_set_weight_age.out
    Untracked:  analysis/DO_morphine1_second_set_weight_age.sh
    Untracked:  analysis/DO_morphine1_second_set_weight_age.stderr
    Untracked:  analysis/DO_morphine1_second_set_weight_age.stdout
    Untracked:  analysis/DO_morphine1_weight_DOB.R
    Untracked:  analysis/DO_morphine1_weight_DOB.sh
    Untracked:  analysis/DO_morphine1_weight_age.R
    Untracked:  analysis/DO_morphine1_weight_age.sh
    Untracked:  analysis/DO_morphine_gemma.R
    Untracked:  analysis/DO_morphine_gemma.err
    Untracked:  analysis/DO_morphine_gemma.out
    Untracked:  analysis/DO_morphine_gemma.sh
    Untracked:  analysis/DO_morphine_gemma_firstmin.R
    Untracked:  analysis/DO_morphine_gemma_firstmin.err
    Untracked:  analysis/DO_morphine_gemma_firstmin.out
    Untracked:  analysis/DO_morphine_gemma_firstmin.sh
    Untracked:  analysis/DO_morphine_gemma_withpermu.R
    Untracked:  analysis/DO_morphine_gemma_withpermu.err
    Untracked:  analysis/DO_morphine_gemma_withpermu.out
    Untracked:  analysis/DO_morphine_gemma_withpermu.sh
    Untracked:  analysis/DO_morphine_gemma_withpermu_firstbatch_min.depression.R
    Untracked:  analysis/DO_morphine_gemma_withpermu_firstbatch_min.depression.err
    Untracked:  analysis/DO_morphine_gemma_withpermu_firstbatch_min.depression.out
    Untracked:  analysis/DO_morphine_gemma_withpermu_firstbatch_min.depression.sh
    Untracked:  analysis/Plot_DO_morphine1_SNP.R
    Untracked:  analysis/Plot_DO_morphine1_SNP.Rout
    Untracked:  analysis/Plot_DO_morphine1_SNP.sh
    Untracked:  analysis/Plot_DO_morphine1_SNP.stderr
    Untracked:  analysis/Plot_DO_morphine1_SNP.stdout
    Untracked:  analysis/Plot_DO_morphine1_second_set_SNP.R
    Untracked:  analysis/Plot_DO_morphine1_second_set_SNP.Rout
    Untracked:  analysis/Plot_DO_morphine1_second_set_SNP.sh
    Untracked:  analysis/Plot_DO_morphine1_second_set_SNP.stderr
    Untracked:  analysis/Plot_DO_morphine1_second_set_SNP.stdout
    Untracked:  analysis/download_GSE100356_sra.sh
    Untracked:  analysis/fentanyl_2cohorts_coxph.R
    Untracked:  analysis/fentanyl_2cohorts_coxph.err
    Untracked:  analysis/fentanyl_2cohorts_coxph.out
    Untracked:  analysis/fentanyl_2cohorts_coxph.sh
    Untracked:  analysis/fentanyl_scanone.cph.R
    Untracked:  analysis/fentanyl_scanone.cph.err
    Untracked:  analysis/fentanyl_scanone.cph.out
    Untracked:  analysis/fentanyl_scanone.cph.sh
    Untracked:  analysis/geo_rnaseq.R
    Untracked:  analysis/heritability_first_second_batch.R
    Untracked:  analysis/nf-rnaseq-b6.R
    Untracked:  analysis/plot_fentanyl_2cohorts_coxph.R
    Untracked:  analysis/scripts/
    Untracked:  analysis/tibmr.R
    Untracked:  analysis/timbr_demo.R
    Untracked:  analysis/workflow_proc.R
    Untracked:  analysis/workflow_proc.sh
    Untracked:  analysis/workflow_proc.stderr
    Untracked:  analysis/workflow_proc.stdout
    Untracked:  analysis/x.R
    Untracked:  code/cfw/
    Untracked:  code/gemma_plot.R
    Untracked:  code/process.sanger.snp.R
    Untracked:  code/reconst_utils.R
    Untracked:  data/69k_grid_pgmap.RData
    Untracked:  data/Composite Post Kevins Program Group 2 Fentanyl Prepped for Hao.xlsx
    Untracked:  data/DO_WBP_Data_JAB_to_map.xlsx
    Untracked:  data/Fentanyl_alternate_metrics.xlsx
    Untracked:  data/FinalReport/
    Untracked:  data/GM/
    Untracked:  data/GM_covar.csv
    Untracked:  data/GM_covar_07092018_morphine.csv
    Untracked:  data/Jackson_Lab_Bubier_MURGIGV01/
    Untracked:  data/MPD_Upload_October.csv
    Untracked:  data/MPD_Upload_October_updated_sex.csv
    Untracked:  data/Master Fentanyl DO Study Sheet.xlsx
    Untracked:  data/MasterMorphine Second Set DO w DOB2.xlsx
    Untracked:  data/MasterMorphine Second Set DO.xlsx
    Untracked:  data/Morphine CC DO mice Updated with Published inbred strains.csv
    Untracked:  data/Morphine_CC_DO_mice_Updated_with_Published_inbred_strains.csv
    Untracked:  data/cc_variants.sqlite
    Untracked:  data/combined/
    Untracked:  data/fentanyl/
    Untracked:  data/fentanyl2/
    Untracked:  data/fentanyl_1_2/
    Untracked:  data/fentanyl_2cohorts_coxph_data.Rdata
    Untracked:  data/first/
    Untracked:  data/founder_geno.csv
    Untracked:  data/genetic_map.csv
    Untracked:  data/gm.json
    Untracked:  data/gwas.sh
    Untracked:  data/marker_grid_0.02cM_plus.txt
    Untracked:  data/mouse_genes_mgi.sqlite
    Untracked:  data/pheno.csv
    Untracked:  data/pheno_qtl2.csv
    Untracked:  data/pheno_qtl2_07092018_morphine.csv
    Untracked:  data/pheno_qtl2_w_dob.csv
    Untracked:  data/physical_map.csv
    Untracked:  data/rnaseq/
    Untracked:  data/sample_geno.csv
    Untracked:  data/second/
    Untracked:  figure/
    Untracked:  glimma-plots/
    Untracked:  output/DO_Fentanyl_Cohort2_MinDepressionRR_coefplot.pdf
    Untracked:  output/DO_Fentanyl_Cohort2_MinDepressionRR_coefplot_blup.pdf
    Untracked:  output/DO_Fentanyl_Cohort2_RRDepressionRateHrSLOPE_coefplot.pdf
    Untracked:  output/DO_Fentanyl_Cohort2_RRRecoveryRateHrSLOPE_coefplot.pdf
    Untracked:  output/DO_Fentanyl_Cohort2_RRRecoveryRateHrSLOPE_coefplot_blup.pdf
    Untracked:  output/DO_Fentanyl_Cohort2_StartofRecoveryHr_coefplot.pdf
    Untracked:  output/DO_Fentanyl_Cohort2_StartofRecoveryHr_coefplot_blup.pdf
    Untracked:  output/DO_Fentanyl_Cohort2_Statusbin_coefplot.pdf
    Untracked:  output/DO_Fentanyl_Cohort2_Statusbin_coefplot_blup.pdf
    Untracked:  output/DO_Fentanyl_Cohort2_SteadyStateDepressionDurationHrINTERVAL_coefplot.pdf
    Untracked:  output/DO_Fentanyl_Cohort2_TimetoDead(Hr)_coefplot.pdf
    Untracked:  output/DO_Fentanyl_Cohort2_TimetoDeadHr_coefplot.pdf
    Untracked:  output/DO_Fentanyl_Cohort2_TimetoDeadHr_coefplot_blup.pdf
    Untracked:  output/DO_Fentanyl_Cohort2_TimetoProjectedRecoveryHr_coefplot.pdf
    Untracked:  output/DO_Fentanyl_Cohort2_TimetoProjectedRecoveryHr_coefplot_blup.pdf
    Untracked:  output/DO_Fentanyl_Cohort2_TimetoSteadyRRDepression(Hr)_coefplot.pdf
    Untracked:  output/DO_Fentanyl_Cohort2_TimetoSteadyRRDepressionHr_coefplot.pdf
    Untracked:  output/DO_Fentanyl_Cohort2_TimetoSteadyRRDepressionHr_coefplot_blup.pdf
    Untracked:  output/DO_Fentanyl_Cohort2_TimetoThresholdRecoveryHr_coefplot.pdf
    Untracked:  output/DO_Fentanyl_Cohort2_TimetoThresholdRecoveryHr_coefplot_blup.pdf
    Untracked:  output/DO_morphine_Min.depression.png
    Untracked:  output/DO_morphine_Min.depression22222_violin_chr5.pdf
    Untracked:  output/DO_morphine_Min.depression_coefplot.pdf
    Untracked:  output/DO_morphine_Min.depression_coefplot_blup.pdf
    Untracked:  output/DO_morphine_Min.depression_coefplot_blup_chr5.png
    Untracked:  output/DO_morphine_Min.depression_coefplot_blup_chrX.png
    Untracked:  output/DO_morphine_Min.depression_coefplot_chr5.png
    Untracked:  output/DO_morphine_Min.depression_coefplot_chrX.png
    Untracked:  output/DO_morphine_Min.depression_peak_genes_chr5.png
    Untracked:  output/DO_morphine_Min.depression_violin_chr5.png
    Untracked:  output/DO_morphine_Recovery.Time.png
    Untracked:  output/DO_morphine_Recovery.Time_coefplot.pdf
    Untracked:  output/DO_morphine_Recovery.Time_coefplot_blup.pdf
    Untracked:  output/DO_morphine_Recovery.Time_coefplot_blup_chr11.png
    Untracked:  output/DO_morphine_Recovery.Time_coefplot_blup_chr4.png
    Untracked:  output/DO_morphine_Recovery.Time_coefplot_blup_chr7.png
    Untracked:  output/DO_morphine_Recovery.Time_coefplot_blup_chr9.png
    Untracked:  output/DO_morphine_Recovery.Time_coefplot_chr11.png
    Untracked:  output/DO_morphine_Recovery.Time_coefplot_chr4.png
    Untracked:  output/DO_morphine_Recovery.Time_coefplot_chr7.png
    Untracked:  output/DO_morphine_Recovery.Time_coefplot_chr9.png
    Untracked:  output/DO_morphine_Status_bin.png
    Untracked:  output/DO_morphine_Status_bin_coefplot.pdf
    Untracked:  output/DO_morphine_Status_bin_coefplot_blup.pdf
    Untracked:  output/DO_morphine_Survival.Time.png
    Untracked:  output/DO_morphine_Survival.Time_coefplot.pdf
    Untracked:  output/DO_morphine_Survival.Time_coefplot_blup.pdf
    Untracked:  output/DO_morphine_Survival.Time_coefplot_blup_chr17.png
    Untracked:  output/DO_morphine_Survival.Time_coefplot_blup_chr8.png
    Untracked:  output/DO_morphine_Survival.Time_coefplot_chr17.png
    Untracked:  output/DO_morphine_Survival.Time_coefplot_chr8.png
    Untracked:  output/DO_morphine_combine_batch_peak_violin.pdf
    Untracked:  output/DO_morphine_combined_69k_m2_Min.depression.png
    Untracked:  output/DO_morphine_combined_69k_m2_Min.depression_coefplot.pdf
    Untracked:  output/DO_morphine_combined_69k_m2_Min.depression_coefplot_blup.pdf
    Untracked:  output/DO_morphine_combined_69k_m2_Recovery.Time.png
    Untracked:  output/DO_morphine_combined_69k_m2_Recovery.Time_coefplot.pdf
    Untracked:  output/DO_morphine_combined_69k_m2_Recovery.Time_coefplot_blup.pdf
    Untracked:  output/DO_morphine_combined_69k_m2_Status_bin.png
    Untracked:  output/DO_morphine_combined_69k_m2_Status_bin_coefplot.pdf
    Untracked:  output/DO_morphine_combined_69k_m2_Status_bin_coefplot_blup.pdf
    Untracked:  output/DO_morphine_combined_69k_m2_Survival.Time.png
    Untracked:  output/DO_morphine_combined_69k_m2_Survival.Time_coefplot.pdf
    Untracked:  output/DO_morphine_combined_69k_m2_Survival.Time_coefplot_blup.pdf
    Untracked:  output/DO_morphine_coxph_24hrs_kinship_QTL.png
    Untracked:  output/DO_morphine_cphout.RData
    Untracked:  output/DO_morphine_first_batch_peak_in_second_batch_violin.pdf
    Untracked:  output/DO_morphine_first_batch_peak_in_second_batch_violin_sidebyside.pdf
    Untracked:  output/DO_morphine_first_batch_peak_violin.pdf
    Untracked:  output/DO_morphine_operm.cph.RData
    Untracked:  output/DO_morphine_second_batch_on_first_batch_peak_violin.pdf
    Untracked:  output/DO_morphine_second_batch_peak_ch6surv_on_first_batchviolin.pdf
    Untracked:  output/DO_morphine_second_batch_peak_ch6surv_on_first_batchviolin2.pdf
    Untracked:  output/DO_morphine_second_batch_peak_in_first_batch_violin.pdf
    Untracked:  output/DO_morphine_second_batch_peak_in_first_batch_violin_sidebyside.pdf
    Untracked:  output/DO_morphine_second_batch_peak_violin.pdf
    Untracked:  output/DO_morphine_secondbatch_69k_Min.depression.png
    Untracked:  output/DO_morphine_secondbatch_69k_Min.depression_coefplot.pdf
    Untracked:  output/DO_morphine_secondbatch_69k_Min.depression_coefplot_blup.pdf
    Untracked:  output/DO_morphine_secondbatch_69k_Recovery.Time.png
    Untracked:  output/DO_morphine_secondbatch_69k_Recovery.Time_coefplot.pdf
    Untracked:  output/DO_morphine_secondbatch_69k_Recovery.Time_coefplot_blup.pdf
    Untracked:  output/DO_morphine_secondbatch_69k_Status_bin.png
    Untracked:  output/DO_morphine_secondbatch_69k_Status_bin_coefplot.pdf
    Untracked:  output/DO_morphine_secondbatch_69k_Status_bin_coefplot_blup.pdf
    Untracked:  output/DO_morphine_secondbatch_69k_Survival.Time.png
    Untracked:  output/DO_morphine_secondbatch_69k_Survival.Time_coefplot.pdf
    Untracked:  output/DO_morphine_secondbatch_69k_Survival.Time_coefplot_blup.pdf
    Untracked:  output/DO_morphine_secondbatch_Min.depression.png
    Untracked:  output/DO_morphine_secondbatch_Min.depression_coefplot.pdf
    Untracked:  output/DO_morphine_secondbatch_Min.depression_coefplot_blup.pdf
    Untracked:  output/DO_morphine_secondbatch_Recovery.Time.png
    Untracked:  output/DO_morphine_secondbatch_Recovery.Time_coefplot.pdf
    Untracked:  output/DO_morphine_secondbatch_Recovery.Time_coefplot_blup.pdf
    Untracked:  output/DO_morphine_secondbatch_Status_bin.png
    Untracked:  output/DO_morphine_secondbatch_Status_bin_coefplot.pdf
    Untracked:  output/DO_morphine_secondbatch_Status_bin_coefplot_blup.pdf
    Untracked:  output/DO_morphine_secondbatch_Survival.Time.png
    Untracked:  output/DO_morphine_secondbatch_Survival.Time_coefplot.pdf
    Untracked:  output/DO_morphine_secondbatch_Survival.Time_coefplot_blup.pdf
    Untracked:  output/Fentanyl/
    Untracked:  output/KPNA3.pdf
    Untracked:  output/SSC4D.pdf
    Untracked:  output/TIMBR.test.RData
    Untracked:  output/apr_69kchr_combined.RData
    Untracked:  output/apr_69kchr_k_loco_combined.rds
    Untracked:  output/apr_69kchr_second_set.RData
    Untracked:  output/combine_batch_variation.RData
    Untracked:  output/combined_gm.RData
    Untracked:  output/combined_gm.k_loco.rds
    Untracked:  output/combined_gm.k_overall.rds
    Untracked:  output/combined_gm.probs_8state.rds
    Untracked:  output/coxph/
    Untracked:  output/do.morphine.RData
    Untracked:  output/do.morphine.k_loco.rds
    Untracked:  output/do.morphine.probs_36state.rds
    Untracked:  output/do.morphine.probs_8state.rds
    Untracked:  output/do_Fentanyl_combine2cohort_MeanDepressionBR_coefplot.pdf
    Untracked:  output/do_Fentanyl_combine2cohort_MeanDepressionBR_coefplot_blup.pdf
    Untracked:  output/do_Fentanyl_combine2cohort_MinDepressionBR_coefplot.pdf
    Untracked:  output/do_Fentanyl_combine2cohort_MinDepressionBR_coefplot_blup.pdf
    Untracked:  output/do_Fentanyl_combine2cohort_MinDepressionRR_coefplot.pdf
    Untracked:  output/do_Fentanyl_combine2cohort_MinDepressionRR_coefplot_blup.pdf
    Untracked:  output/do_Fentanyl_combine2cohort_RRRecoveryRateHr_coefplot.pdf
    Untracked:  output/do_Fentanyl_combine2cohort_RRRecoveryRateHr_coefplot_blup.pdf
    Untracked:  output/do_Fentanyl_combine2cohort_StartofRecoveryHr_coefplot.pdf
    Untracked:  output/do_Fentanyl_combine2cohort_StartofRecoveryHr_coefplot_blup.pdf
    Untracked:  output/do_Fentanyl_combine2cohort_Statusbin_coefplot.pdf
    Untracked:  output/do_Fentanyl_combine2cohort_Statusbin_coefplot_blup.pdf
    Untracked:  output/do_Fentanyl_combine2cohort_SteadyStateDepressionDurationHr_coefplot.pdf
    Untracked:  output/do_Fentanyl_combine2cohort_SteadyStateDepressionDurationHr_coefplot_blup.pdf
    Untracked:  output/do_Fentanyl_combine2cohort_SurvivalTime_coefplot.pdf
    Untracked:  output/do_Fentanyl_combine2cohort_SurvivalTime_coefplot_blup.pdf
    Untracked:  output/do_Fentanyl_combine2cohort_TimetoDeadHr_coefplot.pdf
    Untracked:  output/do_Fentanyl_combine2cohort_TimetoDeadHr_coefplot_blup.pdf
    Untracked:  output/do_Fentanyl_combine2cohort_TimetoMostlyDeadHr_coefplot.pdf
    Untracked:  output/do_Fentanyl_combine2cohort_TimetoMostlyDeadHr_coefplot_blup.pdf
    Untracked:  output/do_Fentanyl_combine2cohort_TimetoProjectedRecoveryHr_coefplot.pdf
    Untracked:  output/do_Fentanyl_combine2cohort_TimetoProjectedRecoveryHr_coefplot_blup.pdf
    Untracked:  output/do_Fentanyl_combine2cohort_TimetoRecoveryHr_coefplot.pdf
    Untracked:  output/do_Fentanyl_combine2cohort_TimetoRecoveryHr_coefplot_blup.pdf
    Untracked:  output/first_batch_variation.RData
    Untracked:  output/first_second_survival_peak_chr.xlsx
    Untracked:  output/hsq_1_first_batch_herit_qtl2.RData
    Untracked:  output/hsq_2_second_batch_herit_qtl2.RData
    Untracked:  output/old_temp/
    Untracked:  output/pr_69kchr_combined.RData
    Untracked:  output/pr_69kchr_second_set.RData
    Untracked:  output/qtl.morphine.69k.out.combined.RData
    Untracked:  output/qtl.morphine.69k.out.combined_m2.RData
    Untracked:  output/qtl.morphine.69k.out.second_set.RData
    Untracked:  output/qtl.morphine.operm.RData
    Untracked:  output/qtl.morphine.out.RData
    Untracked:  output/qtl.morphine.out.combined_gm.RData
    Untracked:  output/qtl.morphine.out.combined_gm.female.RData
    Untracked:  output/qtl.morphine.out.combined_gm.male.RData
    Untracked:  output/qtl.morphine.out.combined_weight_DOB.RData
    Untracked:  output/qtl.morphine.out.combined_weight_age.RData
    Untracked:  output/qtl.morphine.out.female.RData
    Untracked:  output/qtl.morphine.out.male.RData
    Untracked:  output/qtl.morphine.out.second_set.RData
    Untracked:  output/qtl.morphine.out.second_set.female.RData
    Untracked:  output/qtl.morphine.out.second_set.male.RData
    Untracked:  output/qtl.morphine.out.second_set.weight_DOB.RData
    Untracked:  output/qtl.morphine.out.second_set.weight_age.RData
    Untracked:  output/qtl.morphine.out.weight_DOB.RData
    Untracked:  output/qtl.morphine.out.weight_age.RData
    Untracked:  output/qtl.morphine1.snpout.RData
    Untracked:  output/qtl.morphine2.snpout.RData
    Untracked:  output/second_batch_pheno.csv
    Untracked:  output/second_batch_variation.RData
    Untracked:  output/second_set_apr_69kchr_k_loco.rds
    Untracked:  output/second_set_gm.RData
    Untracked:  output/second_set_gm.k_loco.rds
    Untracked:  output/second_set_gm.probs_36state.rds
    Untracked:  output/second_set_gm.probs_8state.rds
    Untracked:  output/topSNP_chr5_mindepression.csv
    Untracked:  output/zoompeak_Min.depression_9.pdf
    Untracked:  output/zoompeak_Recovery.Time_16.pdf
    Untracked:  output/zoompeak_Status_bin_11.pdf
    Untracked:  output/zoompeak_Survival.Time_1.pdf
    Untracked:  output/zoompeak_fentanyl_Survival.Time_2.pdf
    Untracked:  sra-tools_v2.10.7.sif

Unstaged changes:
    Modified:   _workflowr.yml
    Modified:   analysis/marker_violin.Rmd
Note that any generated files, e.g. HTML, png, CSS, etc., are not included in this status report because it is ok for generated content to have uncommitted changes.
These are the previous versions of the repository in which changes were made to the R Markdown (analysis/Plot_DO_Fentanyl_combining2Cohort_mapping.Rmd) and HTML (docs/Plot_DO_Fentanyl_combining2Cohort_mapping.html) files. If you’ve configured a remote Git repository (see ?wflow_git_remote), click on the hyperlinks in the table below to view the files as they were in that past version.
| File | Version | Author | Date | Message |
|---|---|---|---|---|
| Rmd | 2200f95 | xhyuo | 2023-02-21 | update with sex specific Fentanyl plot |
| html | 8611541 | xhyuo | 2023-02-21 | Build site. |
| Rmd | d1a7028 | xhyuo | 2023-02-21 | update with sex specific Fentanyl |
| html | fd4dc88 | xhyuo | 2023-01-11 | Build site. |
| Rmd | aff7cd2 | xhyuo | 2023-01-11 | update with histogram |
| html | 6eeaa6a | xhyuo | 2023-01-06 | Build site. |
| Rmd | 6d89b79 | xhyuo | 2023-01-06 | update with histogram and gcta h2, figure size |
| html | fe30eec | xhyuo | 2023-01-06 | Build site. |
| Rmd | 15a2b6f | xhyuo | 2023-01-06 | update with histogram and gcta h2 |
| html | 0971ef2 | xhyuo | 2022-07-05 | Build site. |
| Rmd | 385dbb4 | xhyuo | 2022-07-05 | update Plot_DO_Fentanyl_combining2Cohort |
| html | d014111 | xhyuo | 2022-06-29 | Build site. |
| html | 773a9fa | xhyuo | 2022-06-29 | Build site. |
| Rmd | e97e172 | xhyuo | 2022-06-29 | Plot_DO_Fentanyl_combining2Cohort |
Last update: 2023-02-21
loading libraries
library(ggplot2)
library(gridExtra)
library(GGally)
library(parallel)
library(qtl2)
library(parallel)
library(survival)
library(regress)
library(abind)
library(openxlsx)
library(tidyverse)

rz.transform <- function(y) {
  rankY=rank(y, ties.method="average", na.last="keep")
  rzT=qnorm(rankY/(length(na.exclude(rankY))+1))
  return(rzT)
}
load("code/do.colors.RData")
Read phenotype data
# Read phenotype data Master Fentanyl DO Study Sheet.xlsx-----------------------------------------------------
do.pheno1 <- read.xlsx("data/Master Fentanyl DO Study Sheet.xlsx", sheet = 1,
rows = 1:399, na.strings = "NaN", detectDates = TRUE)
#remove zombie mice
do.pheno1 <- do.pheno1 %>%
dplyr::filter(is.na(Censor)) %>%
dplyr::mutate(ID = replace(ID, (ID == 31009 & File == 20210519), 31109)) %>% #second 31009 is really 31109
dplyr::mutate(Survival = replace(Survival, (ID %in% c(30931, 31084)), "ALIVE")) %>% #30931, 31084 should be ALIVE
dplyr::mutate(Survival = replace(Survival, (ID %in% c(31049,30901)), "DEAD")) %>% #31049,30901 should be DEAD
dplyr::mutate(Status_bin = ifelse(Survival == "ALIVE", 1, 0)) %>%
dplyr::mutate(ID = as.character(ID)) %>%
dplyr::arrange(ID, desc(File)) %>%
dplyr::distinct(ID, .keep_all = TRUE) %>%
dplyr::rename(., MouseID = ID)
#Fentanyl_alternate_metrics.xlsx
do.pheno.alt <- read.xlsx("data/Fentanyl_alternate_metrics.xlsx", sheet = 1,
na.strings = "NaN") %>%
dplyr::rename(., MouseID = Mouse.ID) %>%
dplyr::mutate(MouseID = as.character(MouseID)) %>%
dplyr::rename_with(., ~ str_replace(.x, "\\(", "")) %>%
dplyr::rename_with(., ~ str_replace(.x, "\\)", "")) %>%
dplyr::rename_with(., ~ str_replace(.x, "\\%/", "")) %>%
dplyr::rename_with(., ~ str_replace(.x, "\\.%", "")) %>%
dplyr::filter(!(if_all(2:11, is.na))) %>%
dplyr::distinct(MouseID, .keep_all = TRUE)
#get sex and dob
do.pheno1 <- left_join(do.pheno.alt, do.pheno1) %>%
dplyr::rename_with(., ~ str_replace(.x, "\\(", "")) %>%
dplyr::rename_with(., ~ str_replace(.x, "\\)", "")) %>%
dplyr::rename_with(., ~ str_replace(.x, "\\.%", "")) %>%
dplyr::rename_with(., ~ str_replace(.x, "\\-", "")) %>%
dplyr::select(MouseID, Sex, dob, Generation,
Time.to.Dead.Hr:RR.Recovery.Rate.Hr,
Min.Depression.BR, Time.to.Mostly.Dead.Hr, Time.to.Recovery.Hr,
Status_bin, Survival) %>%
dplyr::mutate(Survival = replace(Survival, (!is.na(Time.to.Dead.Hr) & is.na(Survival)), "DEAD")) %>%
dplyr::mutate(event = ifelse(Survival == "DEAD", 1, 0)) %>% #event 0=alive, 1=dead.
dplyr::mutate(Survival.Time48 = replace(Time.to.Dead.Hr, (Survival == "ALIVE" & is.na(Time.to.Dead.Hr)), 24.00)) %>%
dplyr::mutate(cohort = "cohort1")
# Read phenotype data Composite Post Kevins Program Group 2 Fentanyl Prepped for Hao.xlsx-----------------------------------------------------
#batch 20220502
do.pheno2 <- readxl::read_excel(path = "data/Composite Post Kevins Program Group 2 Fentanyl Prepped for Hao.xlsx",
col_types = c("text", "text", "text", "date", "numeric", "numeric", "date", rep("numeric", 9), "date"))
# Warning in read_fun(path = enc2native(normalizePath(path)), sheet_i = sheet, :
# Expecting date in D263 / R263C4: got 'BLANK'
# Warning in read_fun(path = enc2native(normalizePath(path)), sheet_i = sheet, :
# Expecting numeric in F263 / R263C6: got 'BLANK'
do.pheno2 <- do.pheno2 %>%
dplyr::rename_with(., ~str_remove_all(.x, " ")) %>%
dplyr::filter(!is.na(MouseID)) %>%
dplyr::filter(MouseID != "BLANK") %>%
dplyr::mutate(EarTag = replace(EarTag, (MouseID == 35151), "ALIVE")) %>% #35151 should be ALIVE
dplyr::mutate(EarTag = replace(EarTag, (MouseID %in% c(35263, 35108)), "DEAD")) %>% # 35263 35108 should be DEAD
dplyr::mutate(Status_bin = case_when(
EarTag == "DEAD" ~ 0,
(EarTag == "ALIVE" | is.na(EarTag)) ~ 1
)) %>%
dplyr::rename_with(., ~ str_replace(.x, "\\(", "")) %>%
dplyr::rename_with(., ~ str_replace(.x, "\\)", "")) %>%
dplyr::rename_with(., ~ str_replace(.x, "\\%/", "")) %>%
dplyr::rename_with(., ~ str_replace(.x, "\\.%", "")) %>%
dplyr::rename_with(., ~ str_replace(.x, "\\%", "")) %>%
dplyr::rename_with(., ~ str_replace(.x, "\\-", "")) %>%
dplyr::select(MouseID,
Survival = EarTag,
Sex,
dob = DOB,
Time.to.Dead.Hr = TimetoDeadHr,
RR.Depression.Rate.Hr = RRDepressionRateHrSLOPE,
Time.to.Steady.RR.Depression.Hr = TimetoSteadyRRDepressionHr,
Min.Depression.RR = MinDepressionRR,
SteadyState.Depression.Duration.Hr = SteadyStateDepressionDurationHrINTERVAL,
Time.to.Threshold.Recovery.Hr = TimetoThresholdRecoveryHr,
Time.to.Projected.Recovery.Hr = TimetoProjectedRecoveryHr,
Start.of.Recovery.Hr = StartofRecoveryHr,
RR.Recovery.Rate.Hr = RRRecoveryRateHrSLOPE,
Status_bin) %>%
dplyr::mutate(Survival = replace(Survival, is.na(Survival), "ALIVE")) %>%
dplyr::mutate(event = ifelse(Survival == "DEAD", 1, 0)) %>% #event 0=alive, 1=dead.
dplyr::mutate(Survival.Time48 = replace(Time.to.Dead.Hr, (Survival == "ALIVE" & is.na(Time.to.Dead.Hr)), 48.00)) %>%
dplyr::mutate(cohort = "cohort2")
#truncated greater than 24 hrs as missing
do.pheno2 <- do.pheno2 %>%
dplyr::mutate(Time.to.Dead.Hr = ifelse(Time.to.Dead.Hr > 24, NA_real_, Time.to.Dead.Hr)) %>%
dplyr::mutate(SteadyState.Depression.Duration.Hr = ifelse(SteadyState.Depression.Duration.Hr > 24, NA_real_, SteadyState.Depression.Duration.Hr)) %>%
dplyr::mutate(Time.to.Threshold.Recovery.Hr = ifelse(Time.to.Threshold.Recovery.Hr > 24, NA_real_, Time.to.Threshold.Recovery.Hr)) %>%
dplyr::mutate(Time.to.Projected.Recovery.Hr = ifelse(Time.to.Projected.Recovery.Hr > 24, NA_real_, Time.to.Projected.Recovery.Hr)) %>%
dplyr::mutate(Start.of.Recovery.Hr = ifelse(Start.of.Recovery.Hr > 24, NA_real_, Start.of.Recovery.Hr))
#merge with do.pheno
do.pheno <- bind_rows(do.pheno1, do.pheno2)
#data point
table(do.pheno[is.na(do.pheno$Time.to.Dead.Hr), ]$cohort)
#
# cohort1 cohort2
# 212 138
# Read genotype data -----------------------------------------------------------
load("data/Jackson_Lab_Bubier_MURGIGV01/gm_DO765_qc_newid.RData")#gm_after_qc
overlap.id = intersect(ind_ids(gm_after_qc), as.character(do.pheno$MouseID))
#subset
gm = gm_after_qc[overlap.id, ]
do.pheno = do.pheno[do.pheno$MouseID %in% overlap.id, ]
do.pheno = do.pheno[match(ind_ids(gm), do.pheno$MouseID) , ]
rownames(do.pheno) = do.pheno$MouseID
all.equal(ind_ids(gm), do.pheno$MouseID)
# [1] TRUE
#covar
do.pheno$Sex <- as.factor(do.pheno$Sex)
#addcovar
options(na.action='na.pass')
addcovar = model.matrix(~Sex, data = do.pheno[, c("Sex"), drop=F])[,-1, drop=F]
colnames(addcovar) <- c("sex")
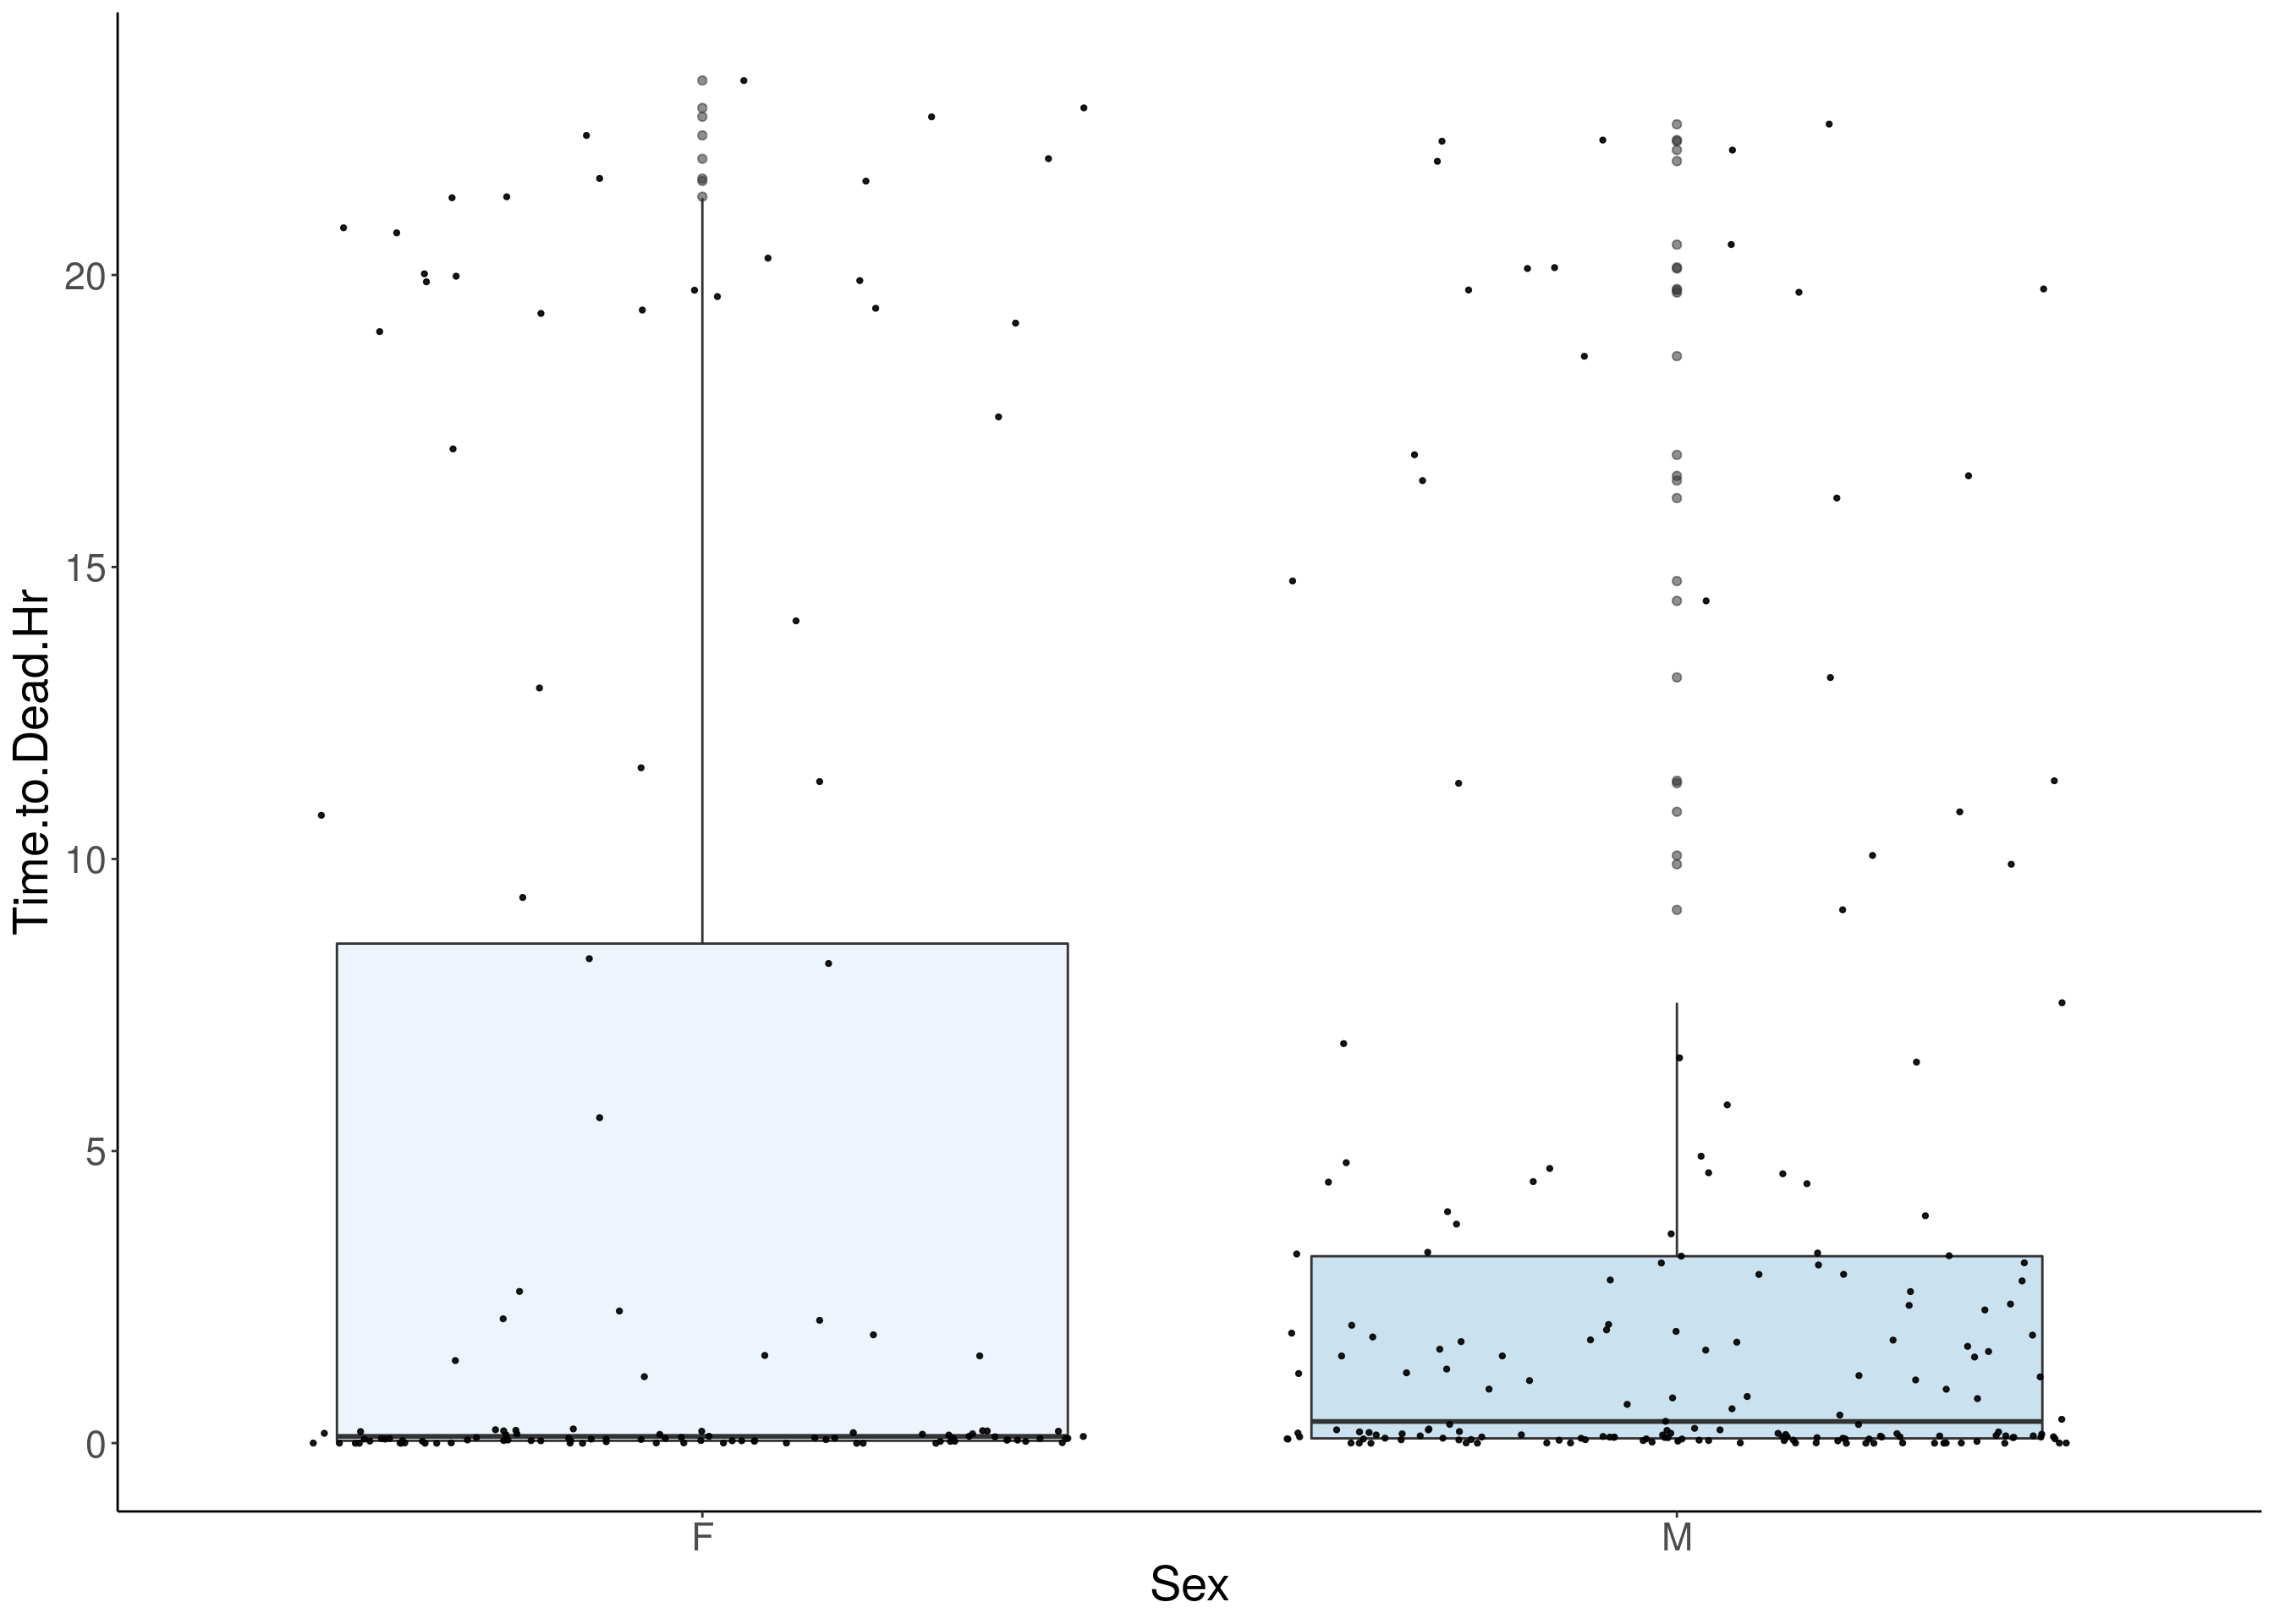
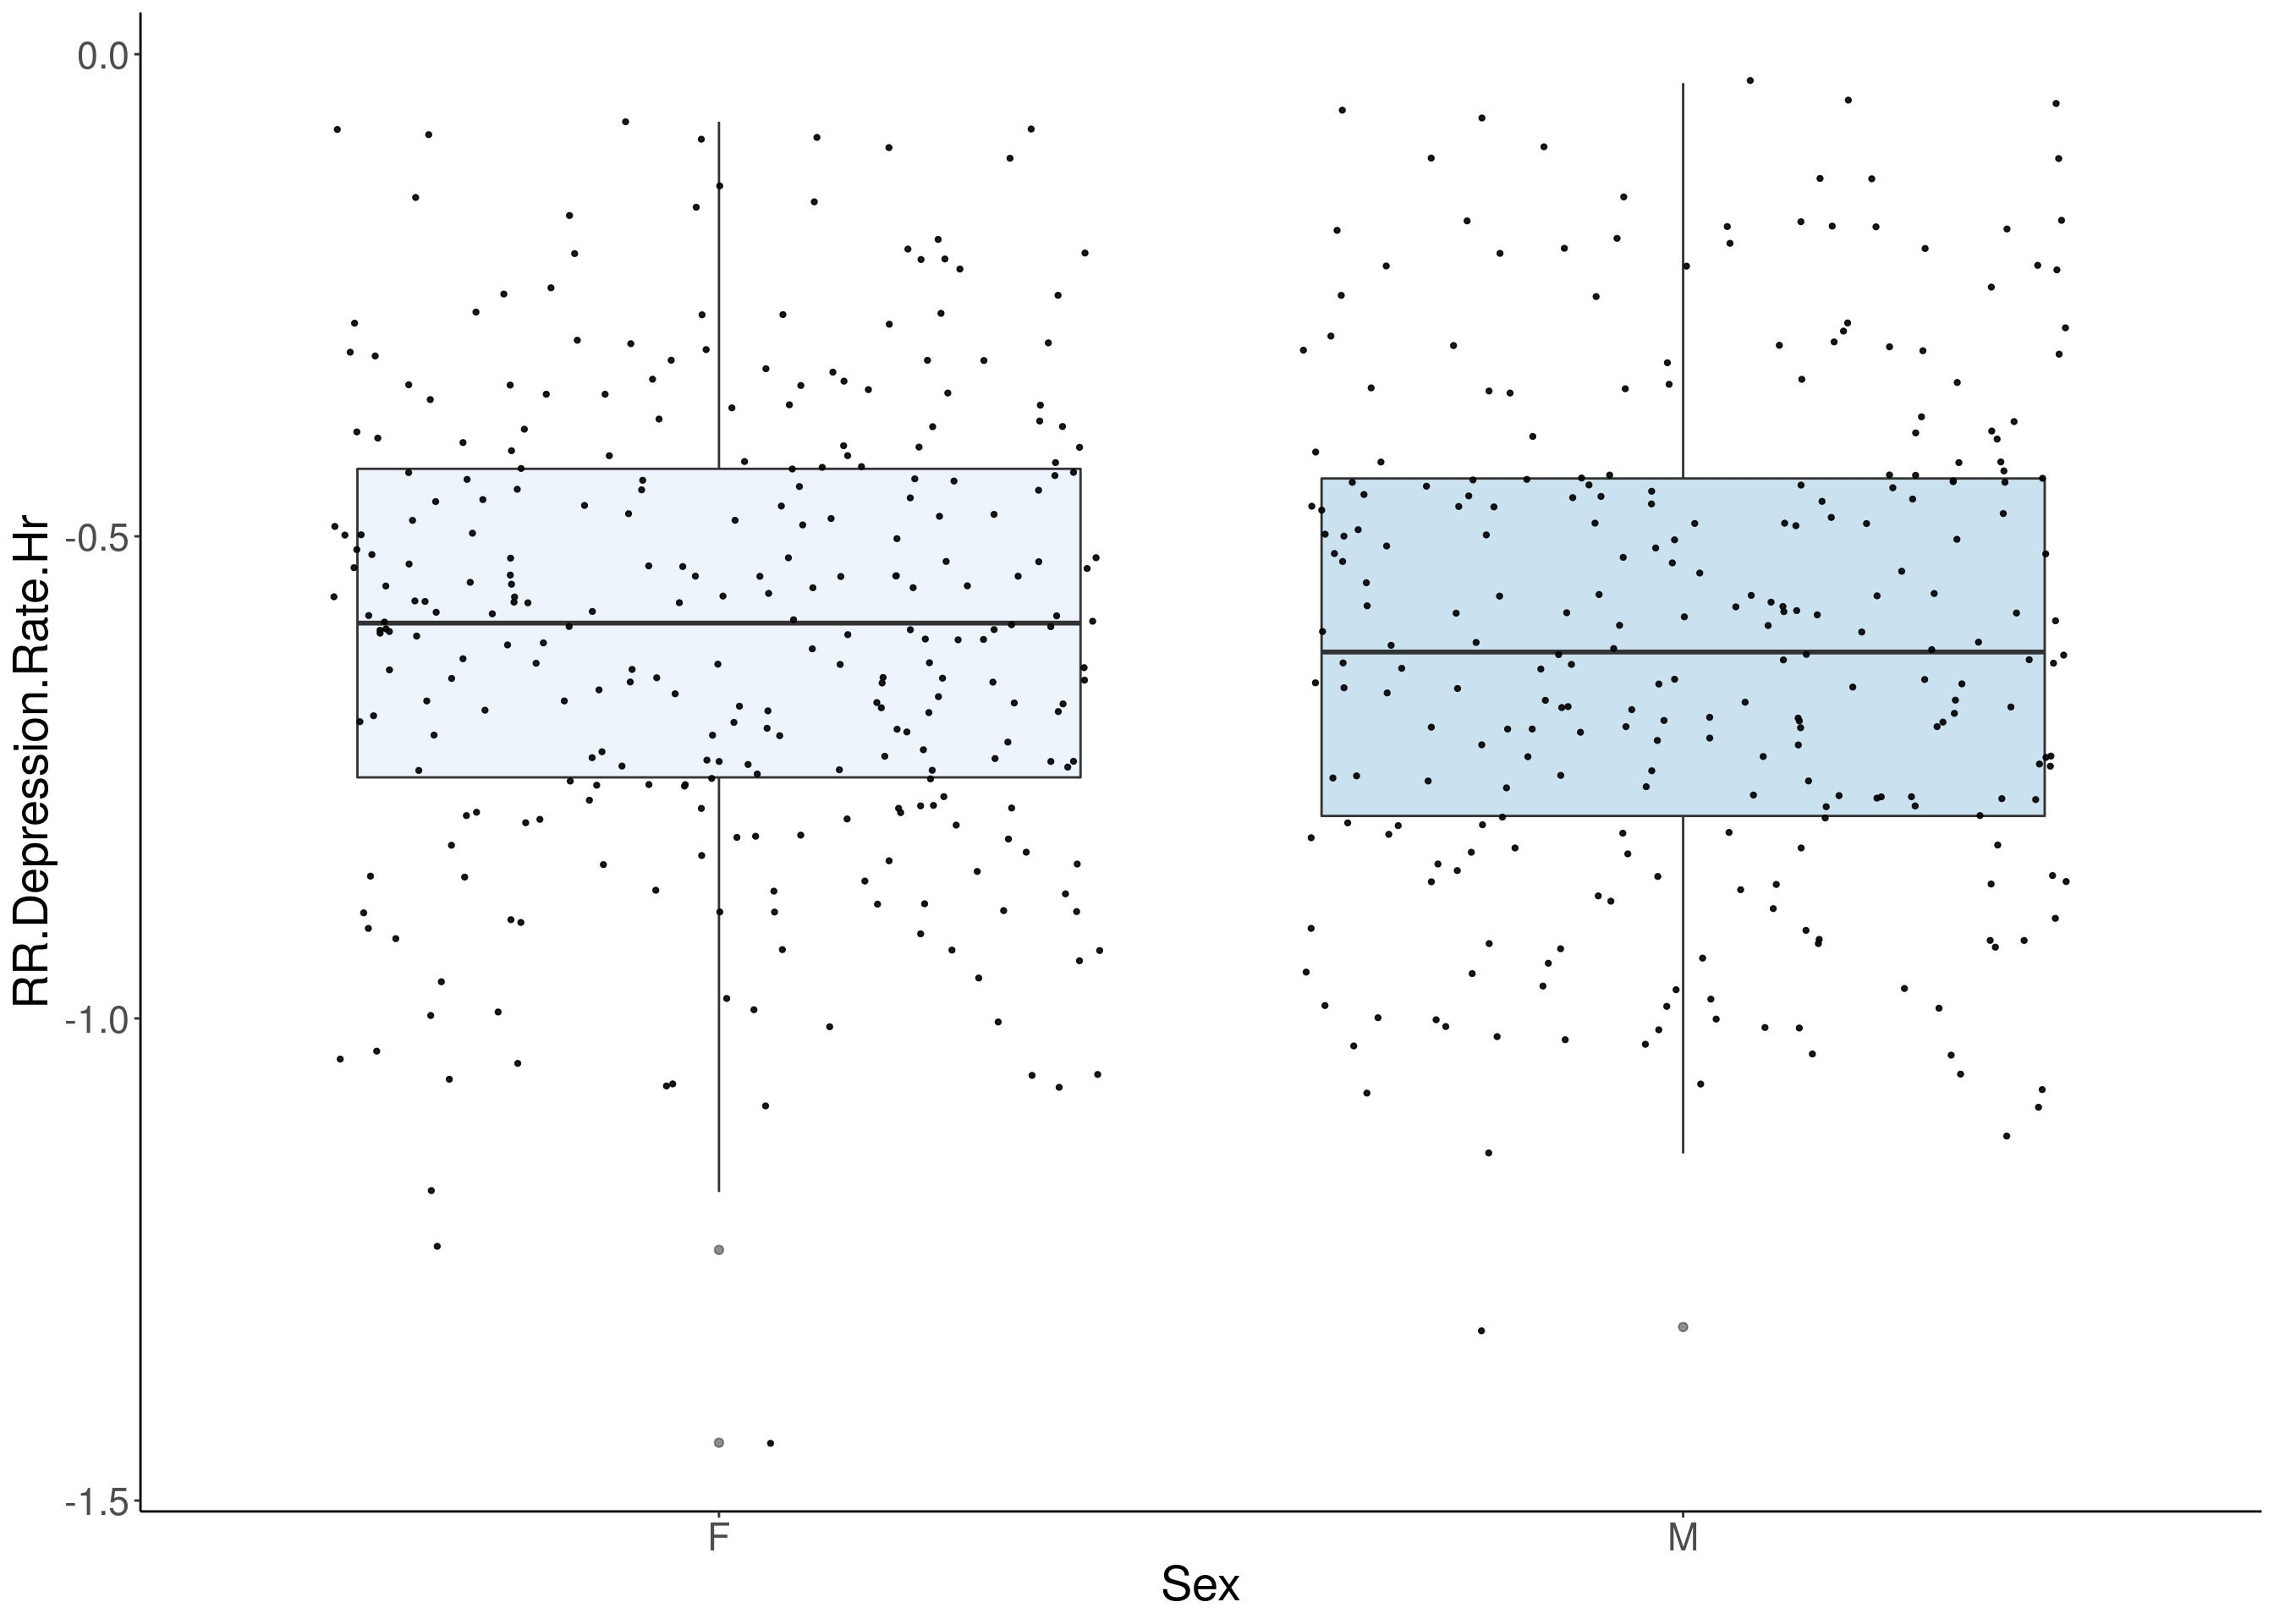
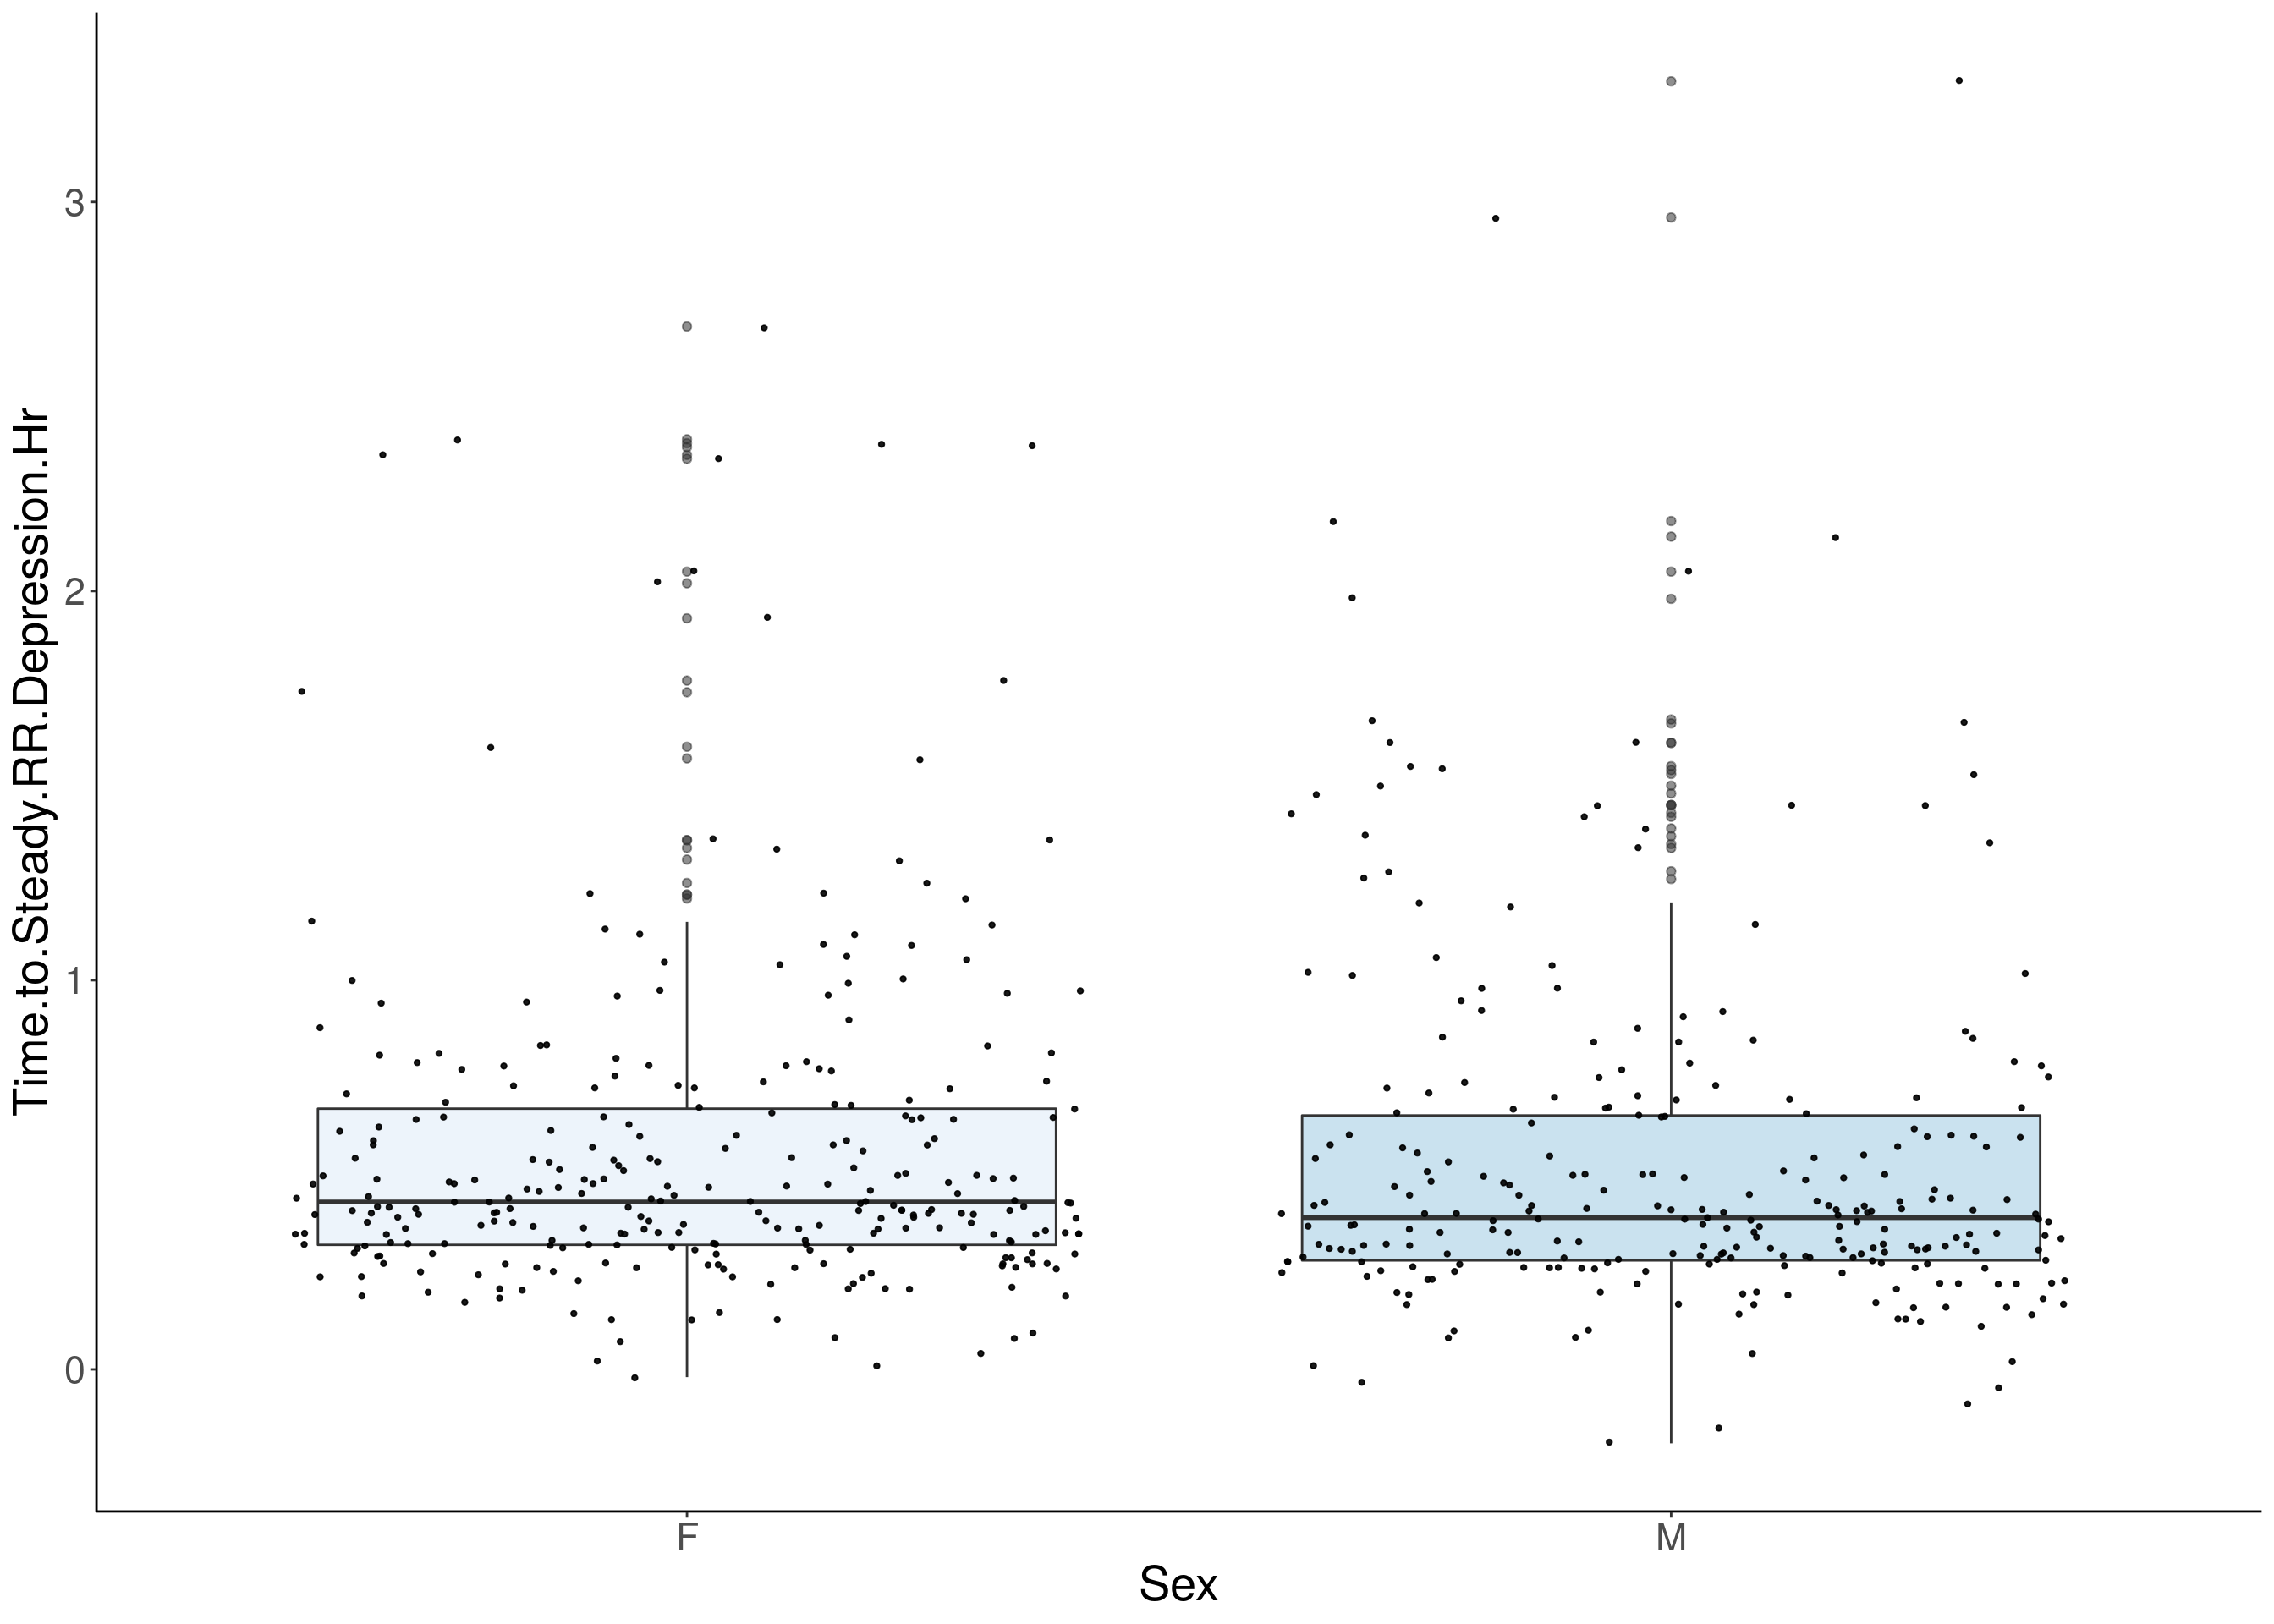
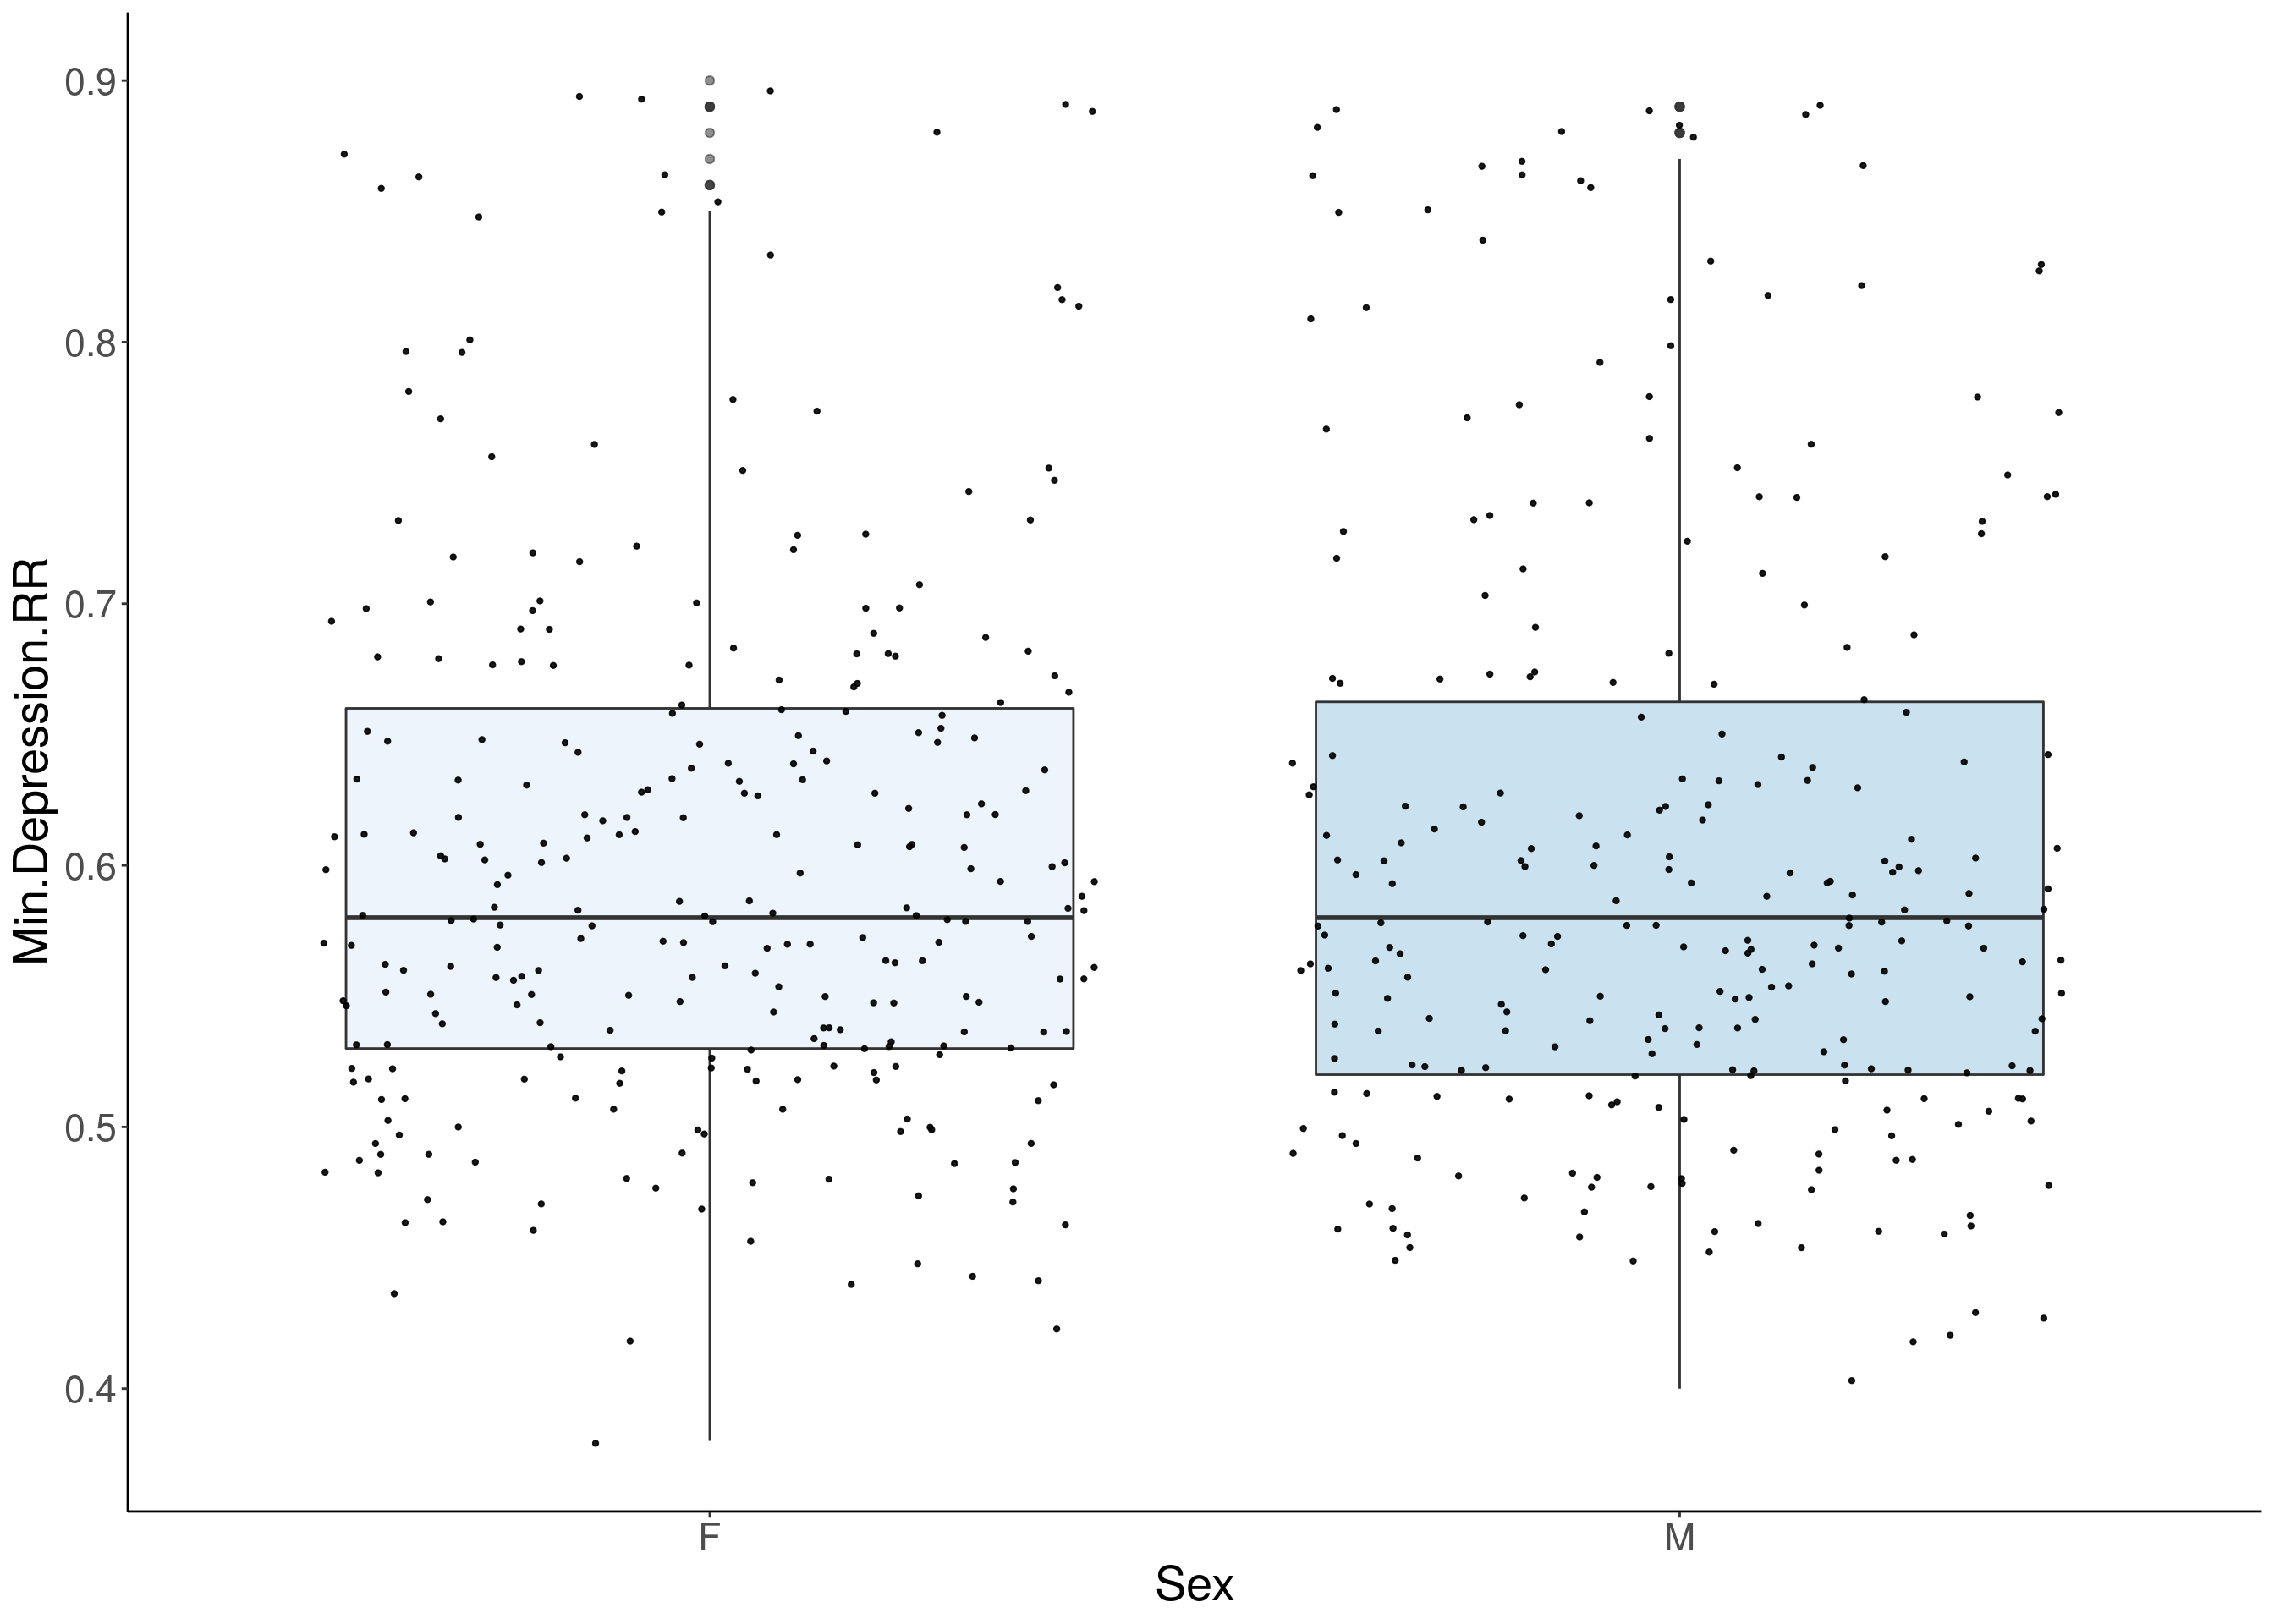
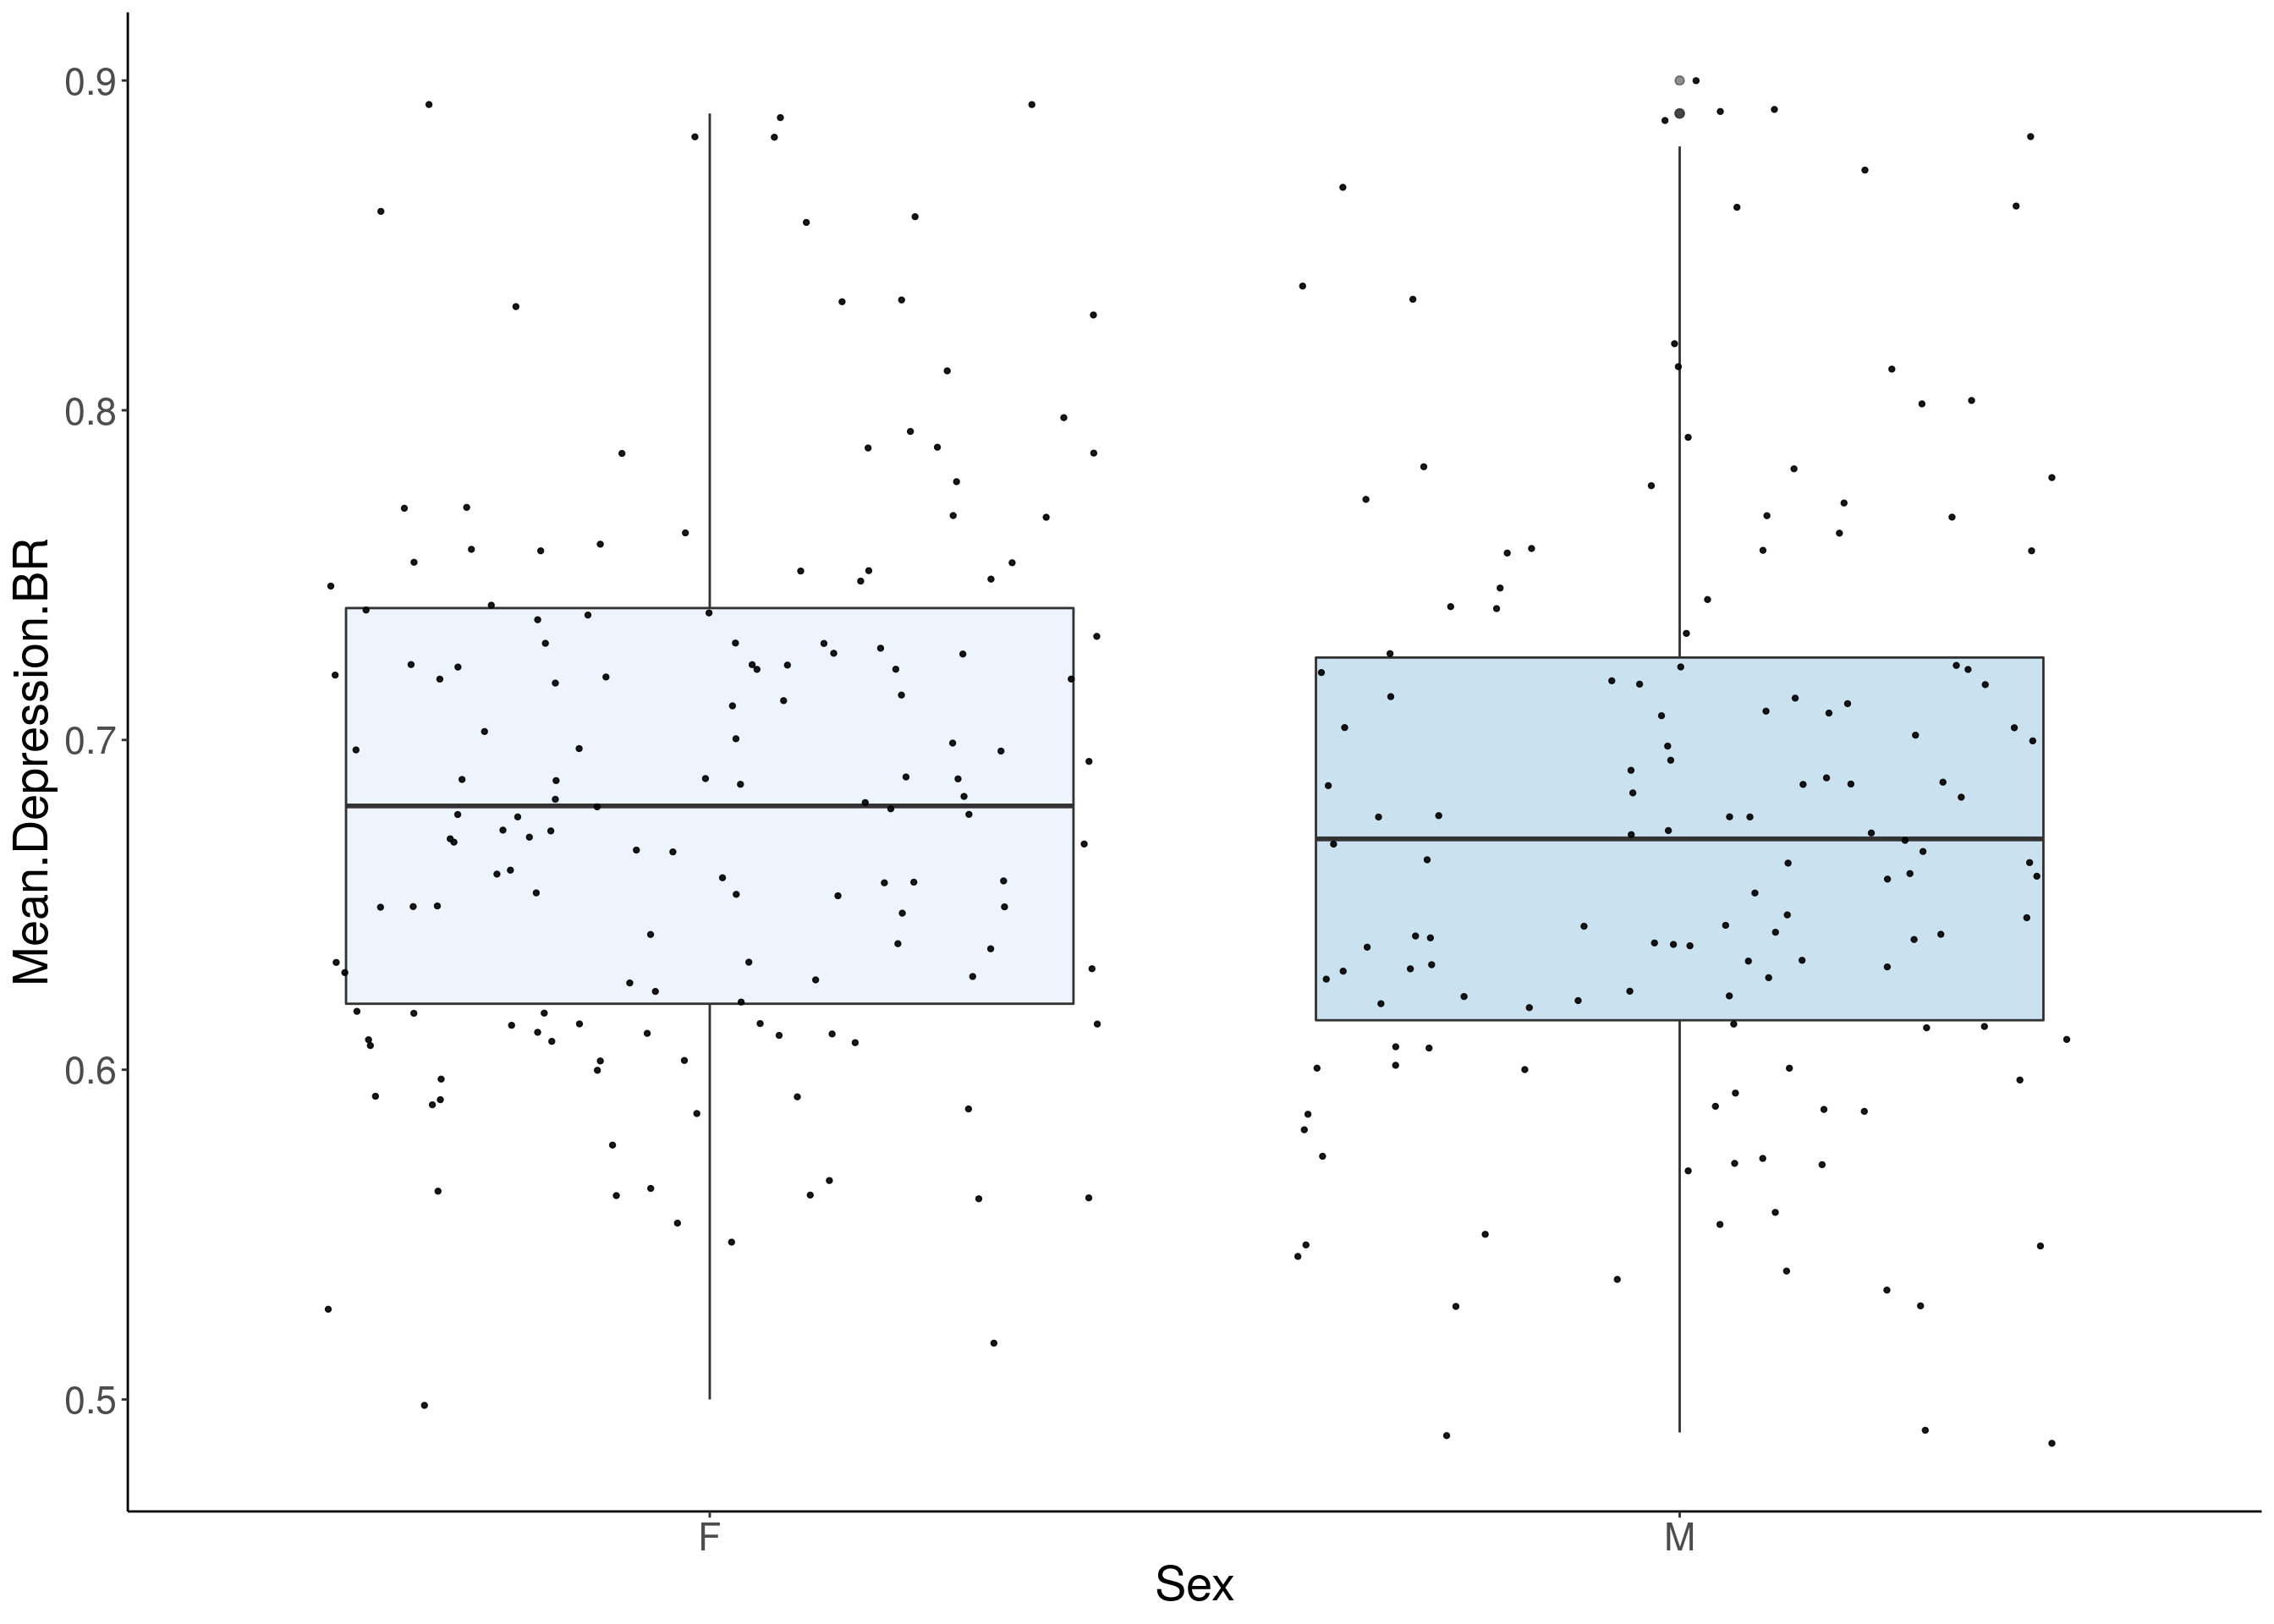
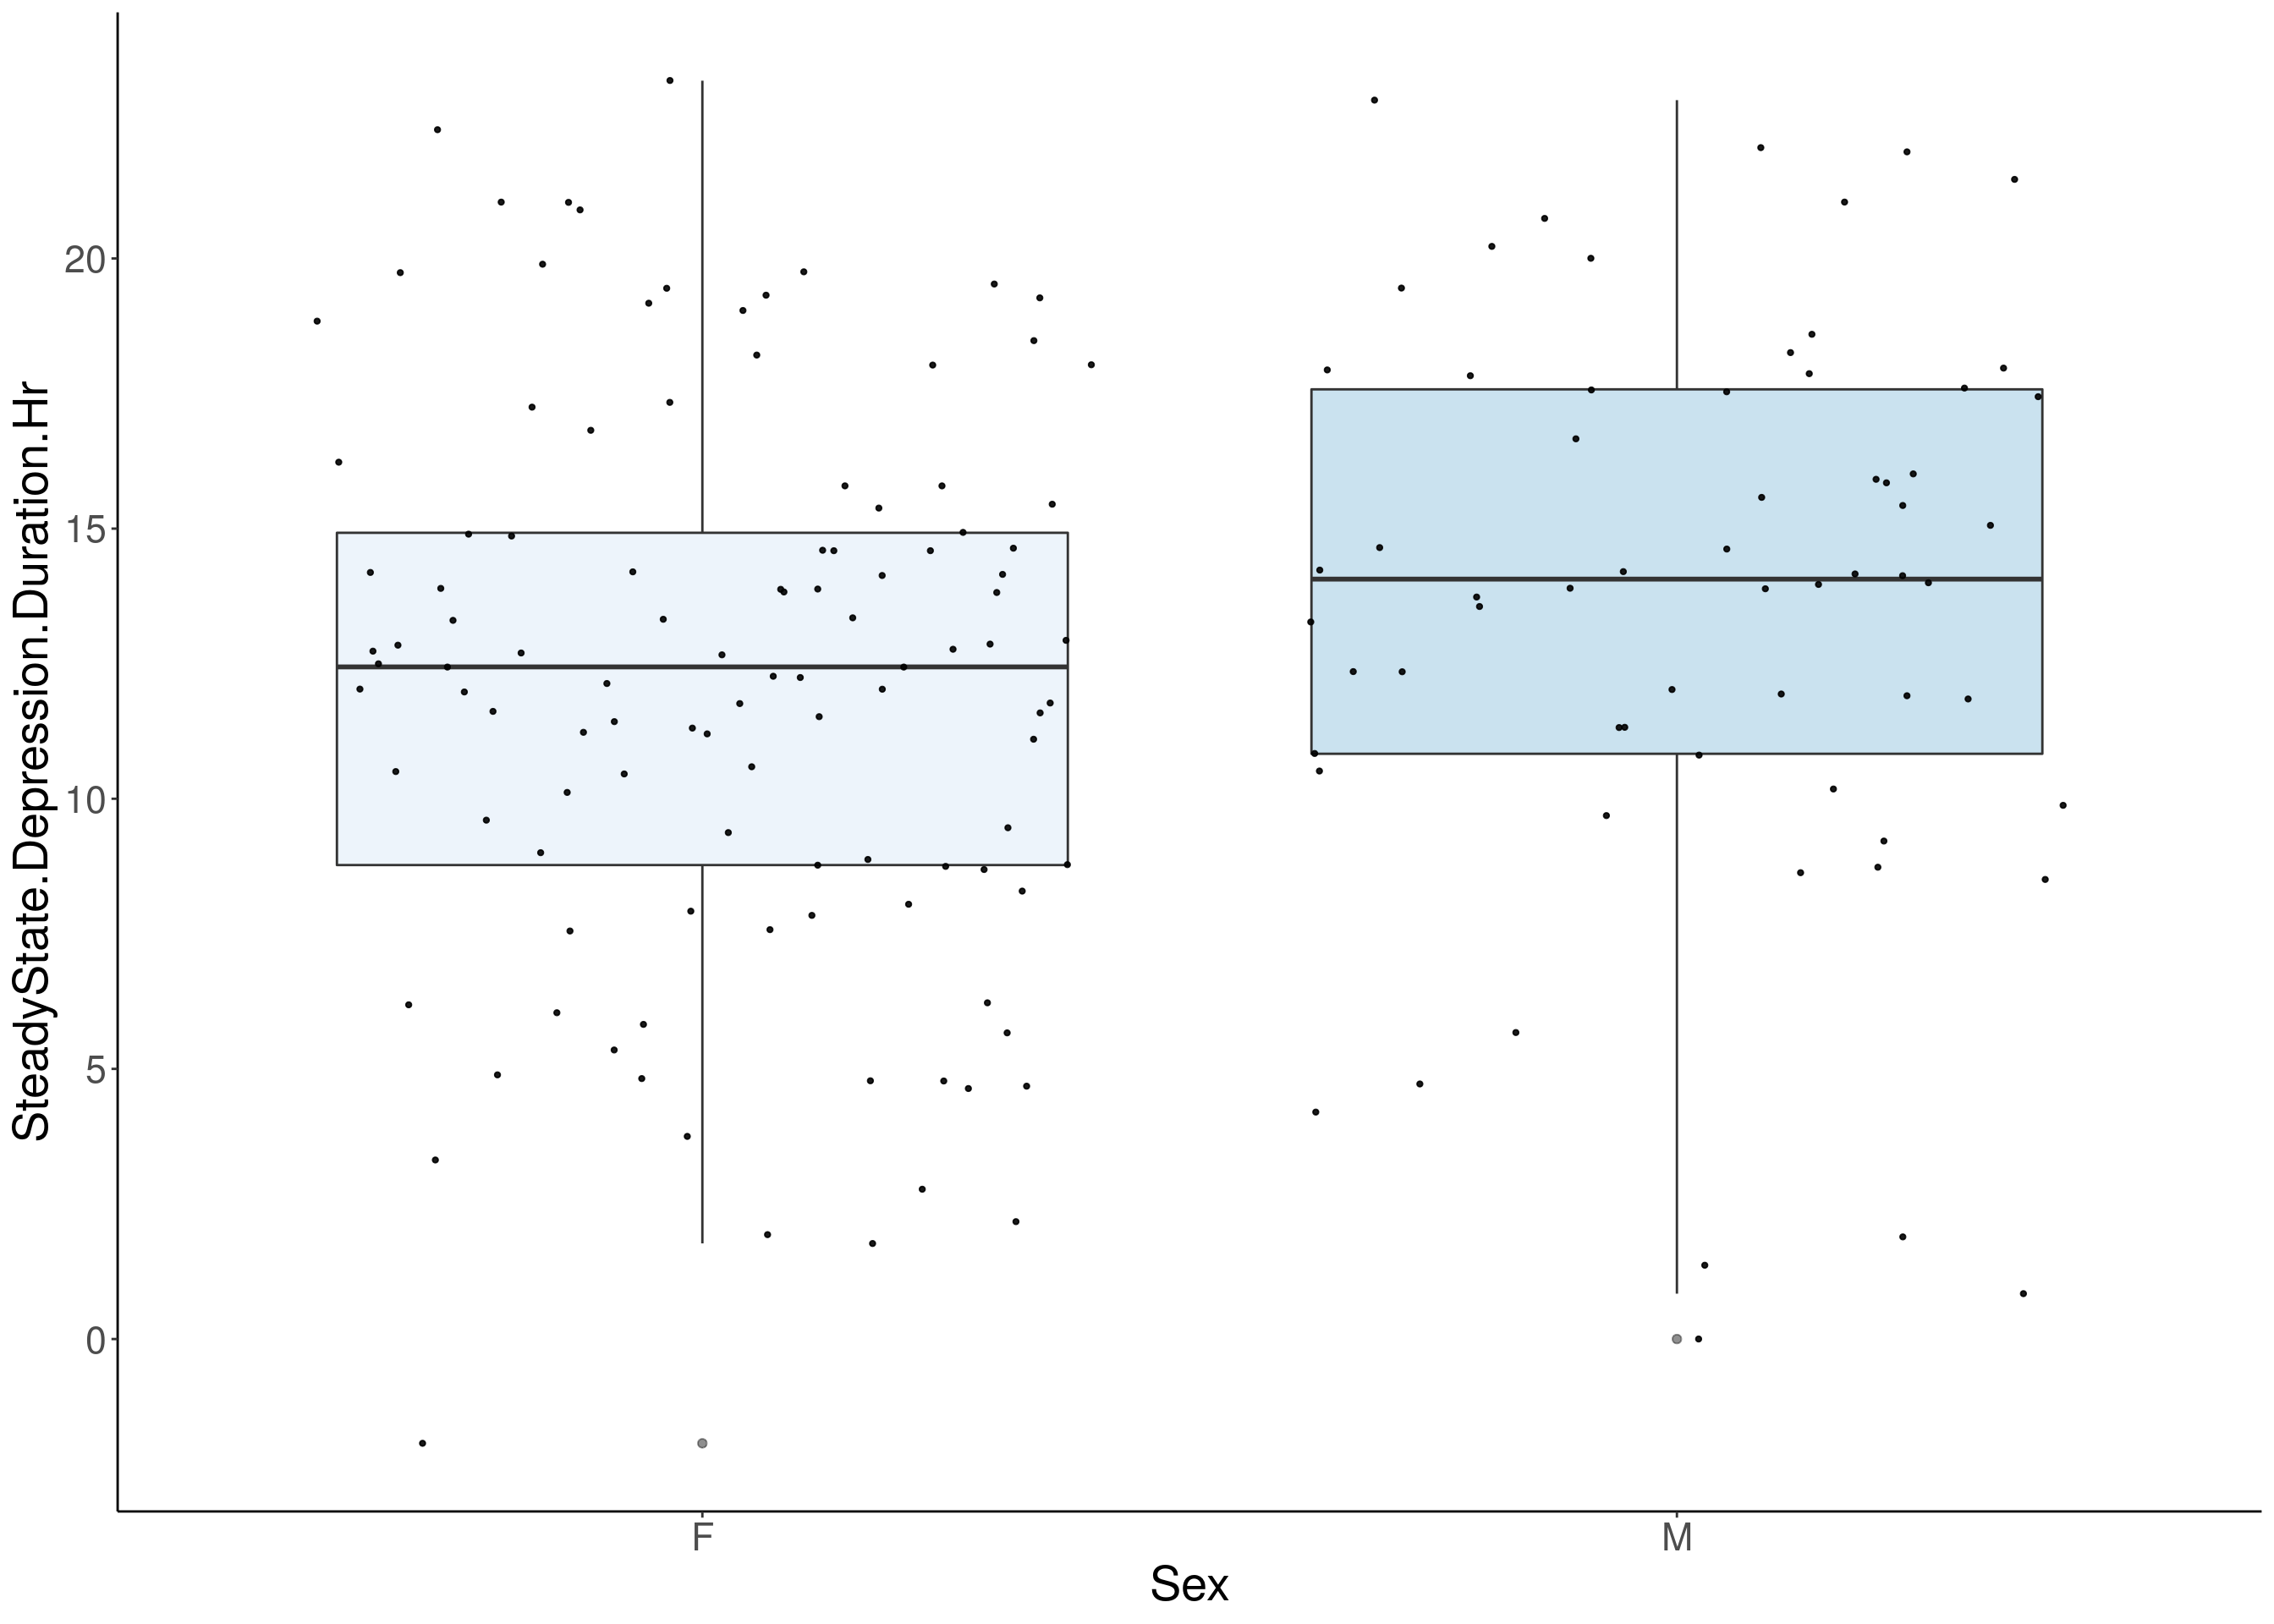
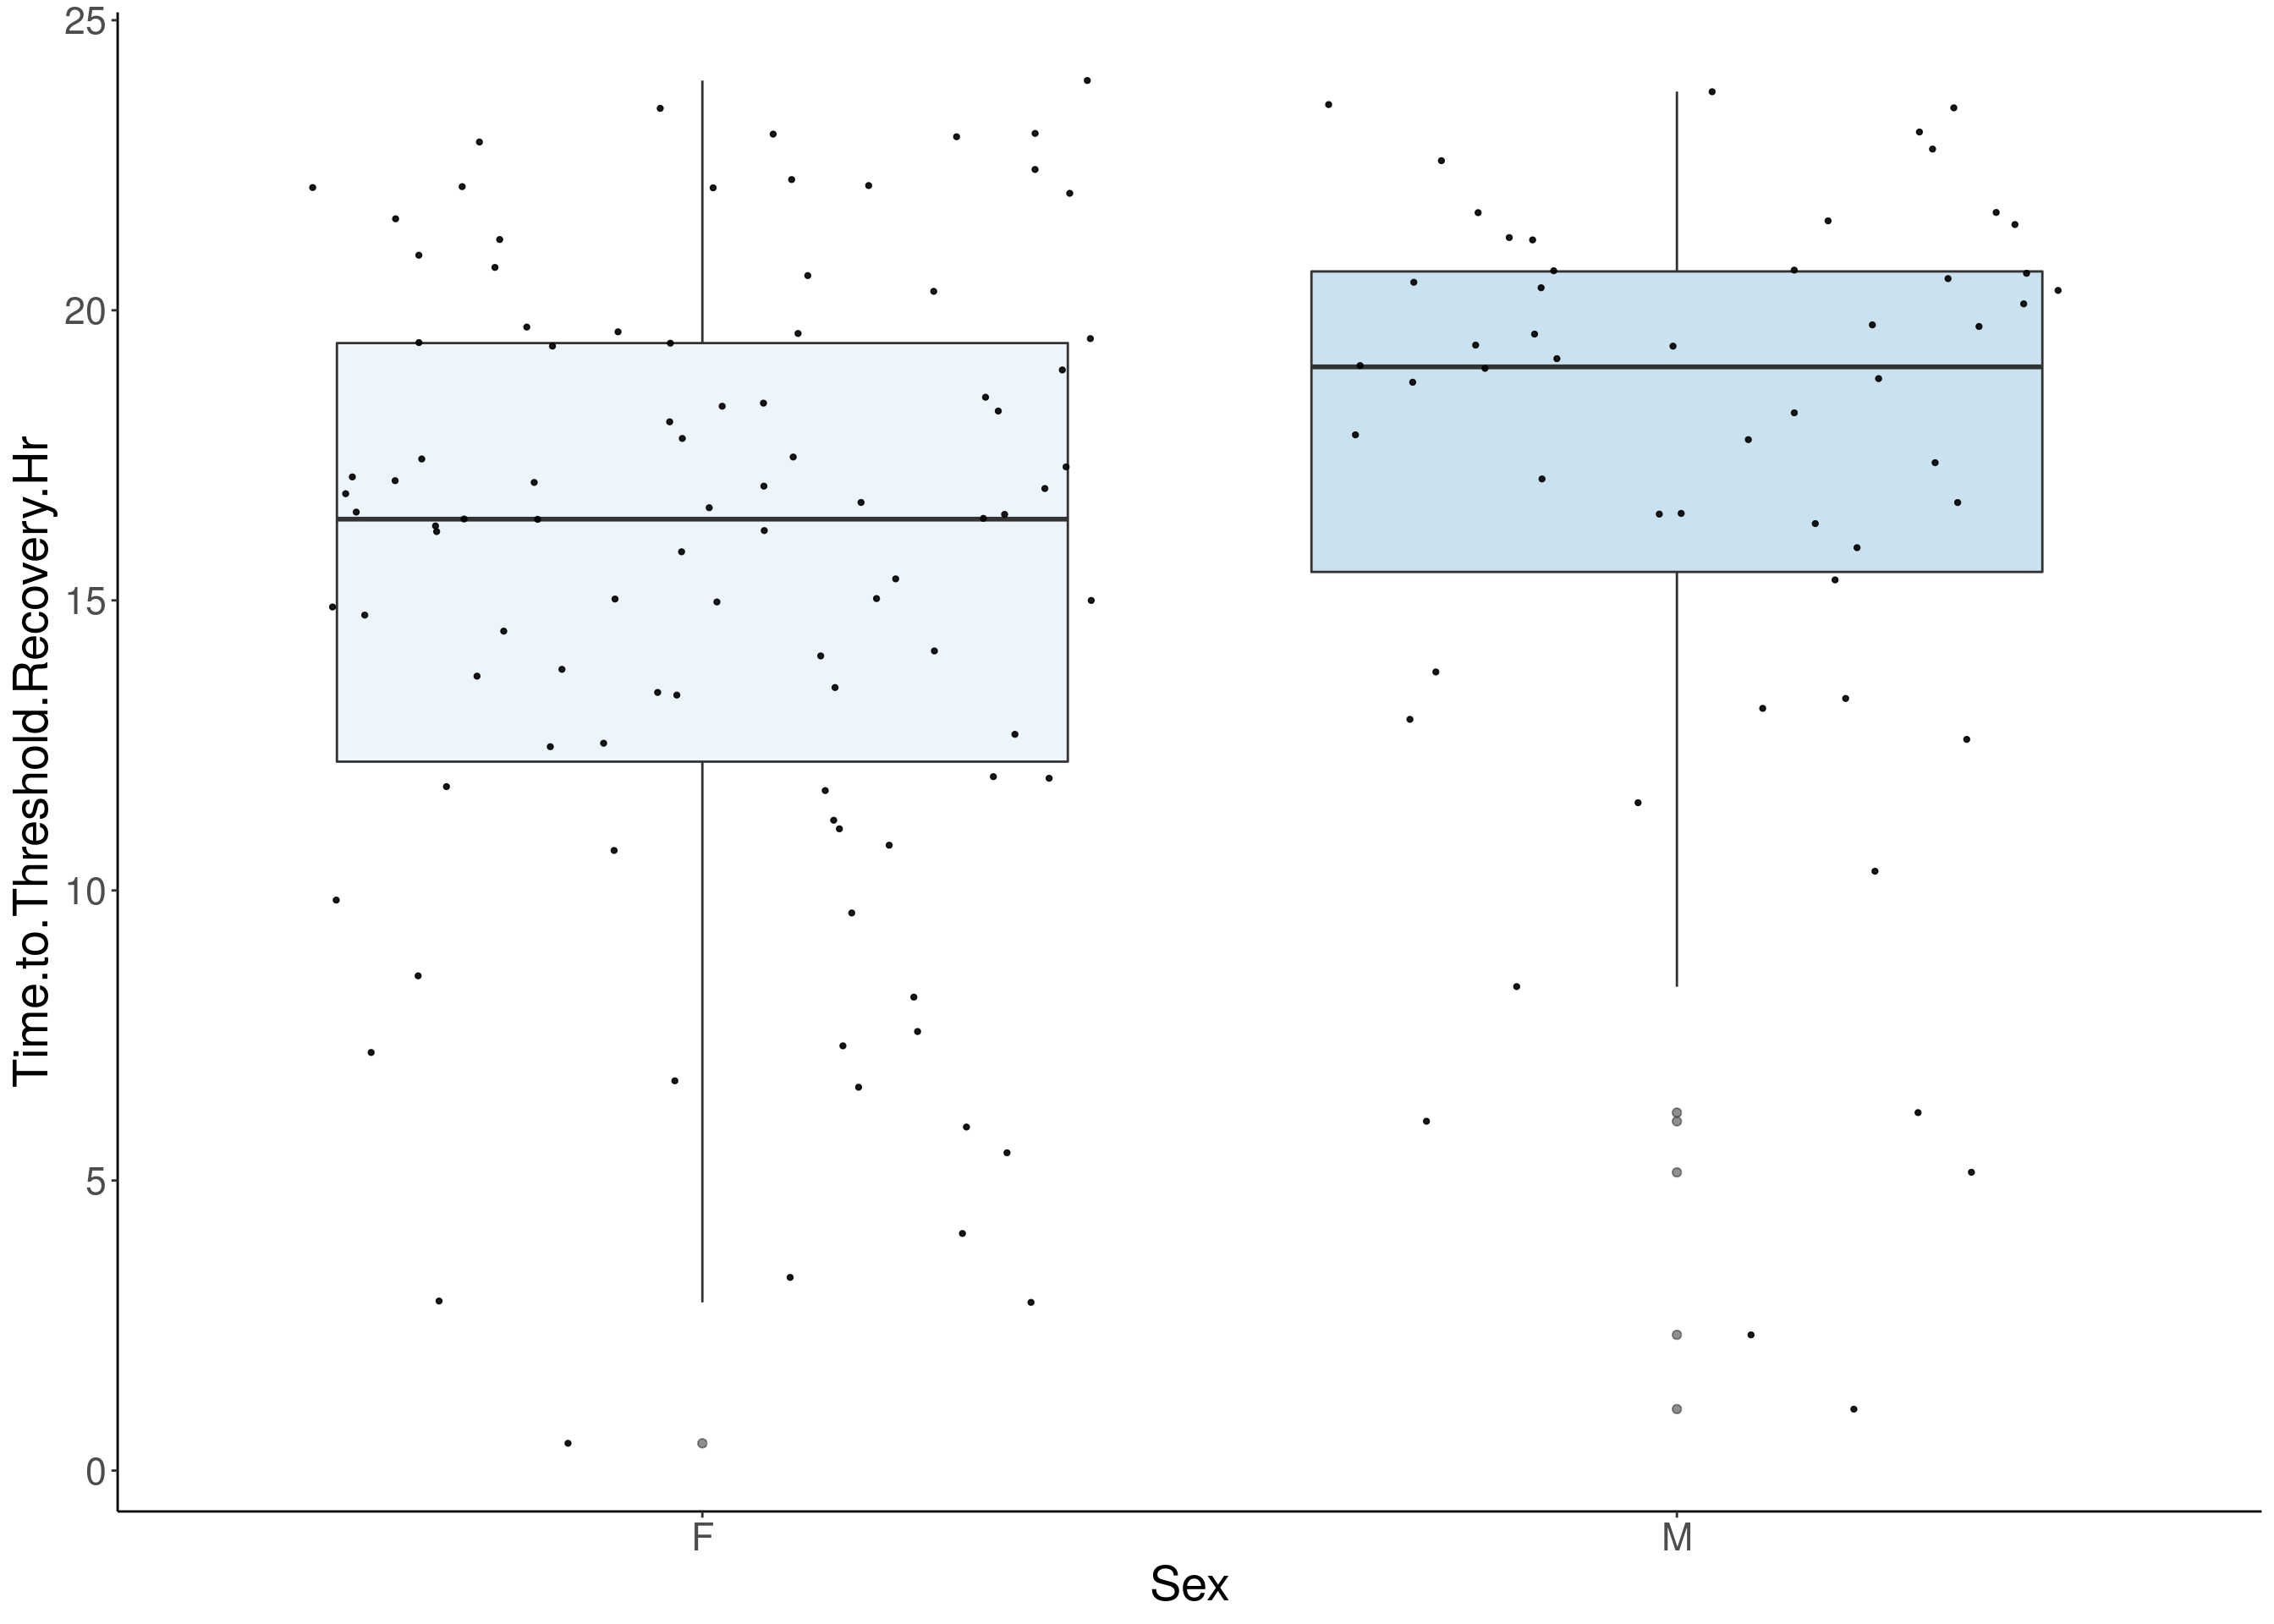
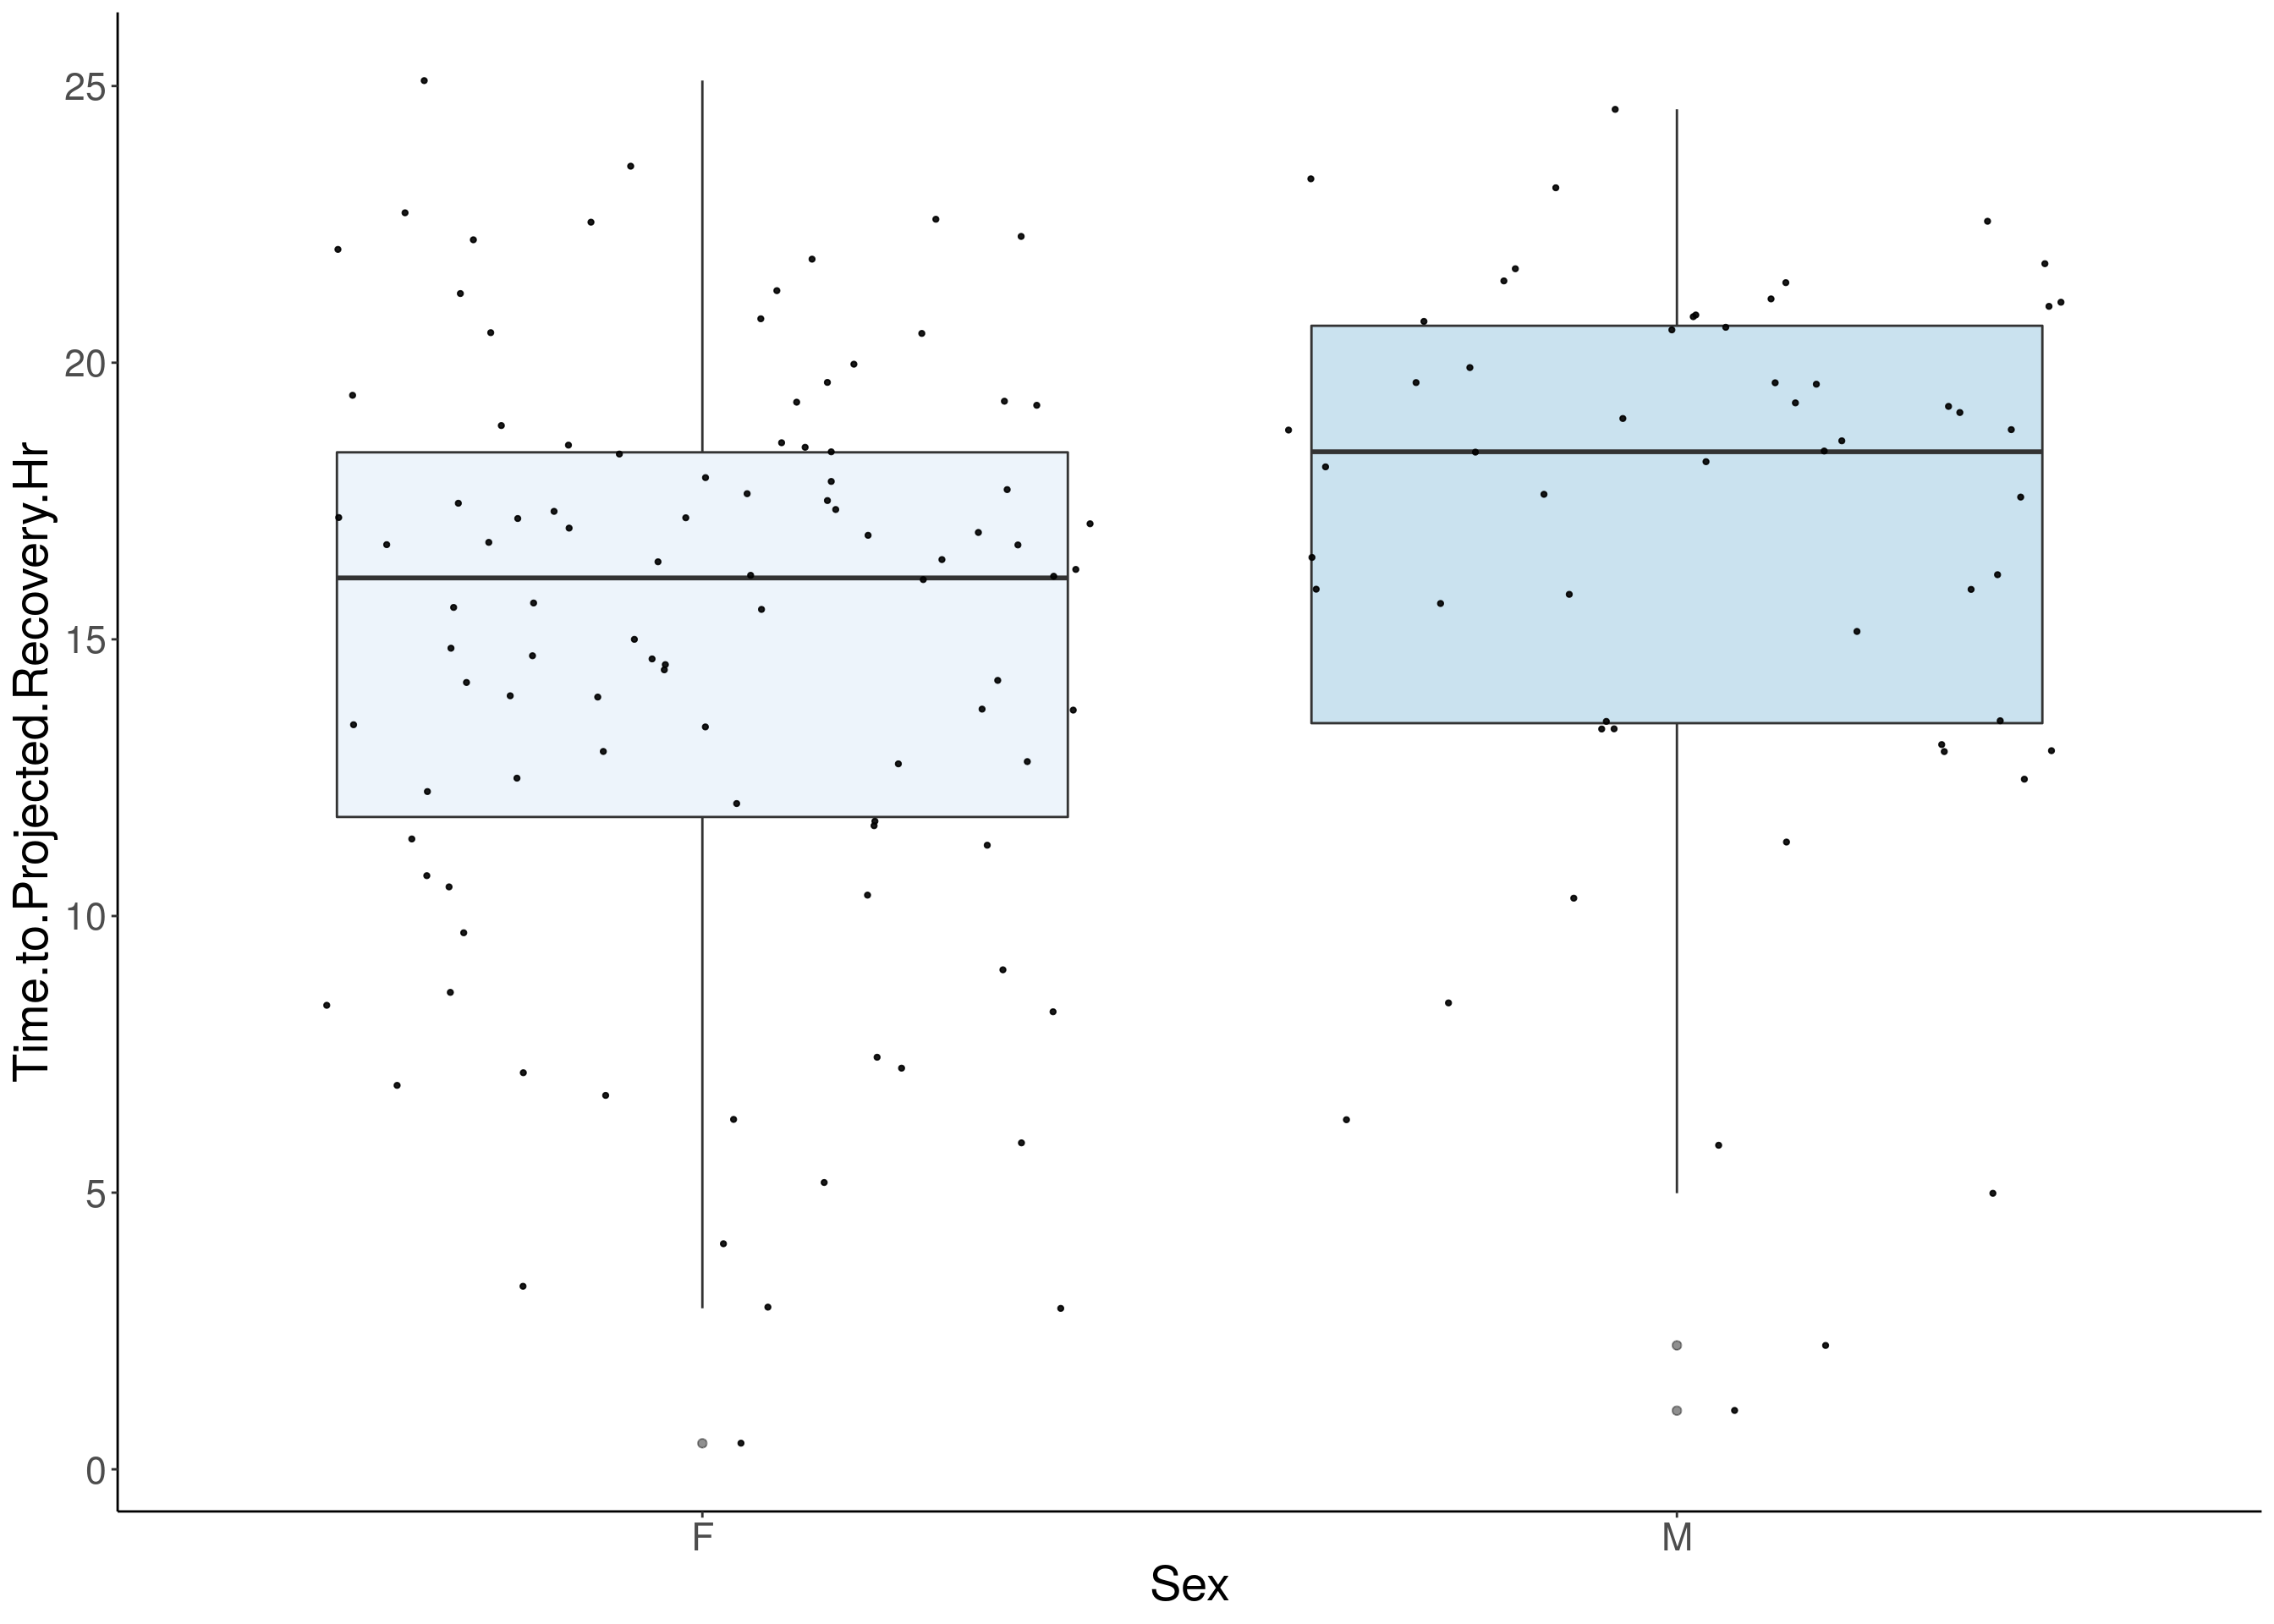
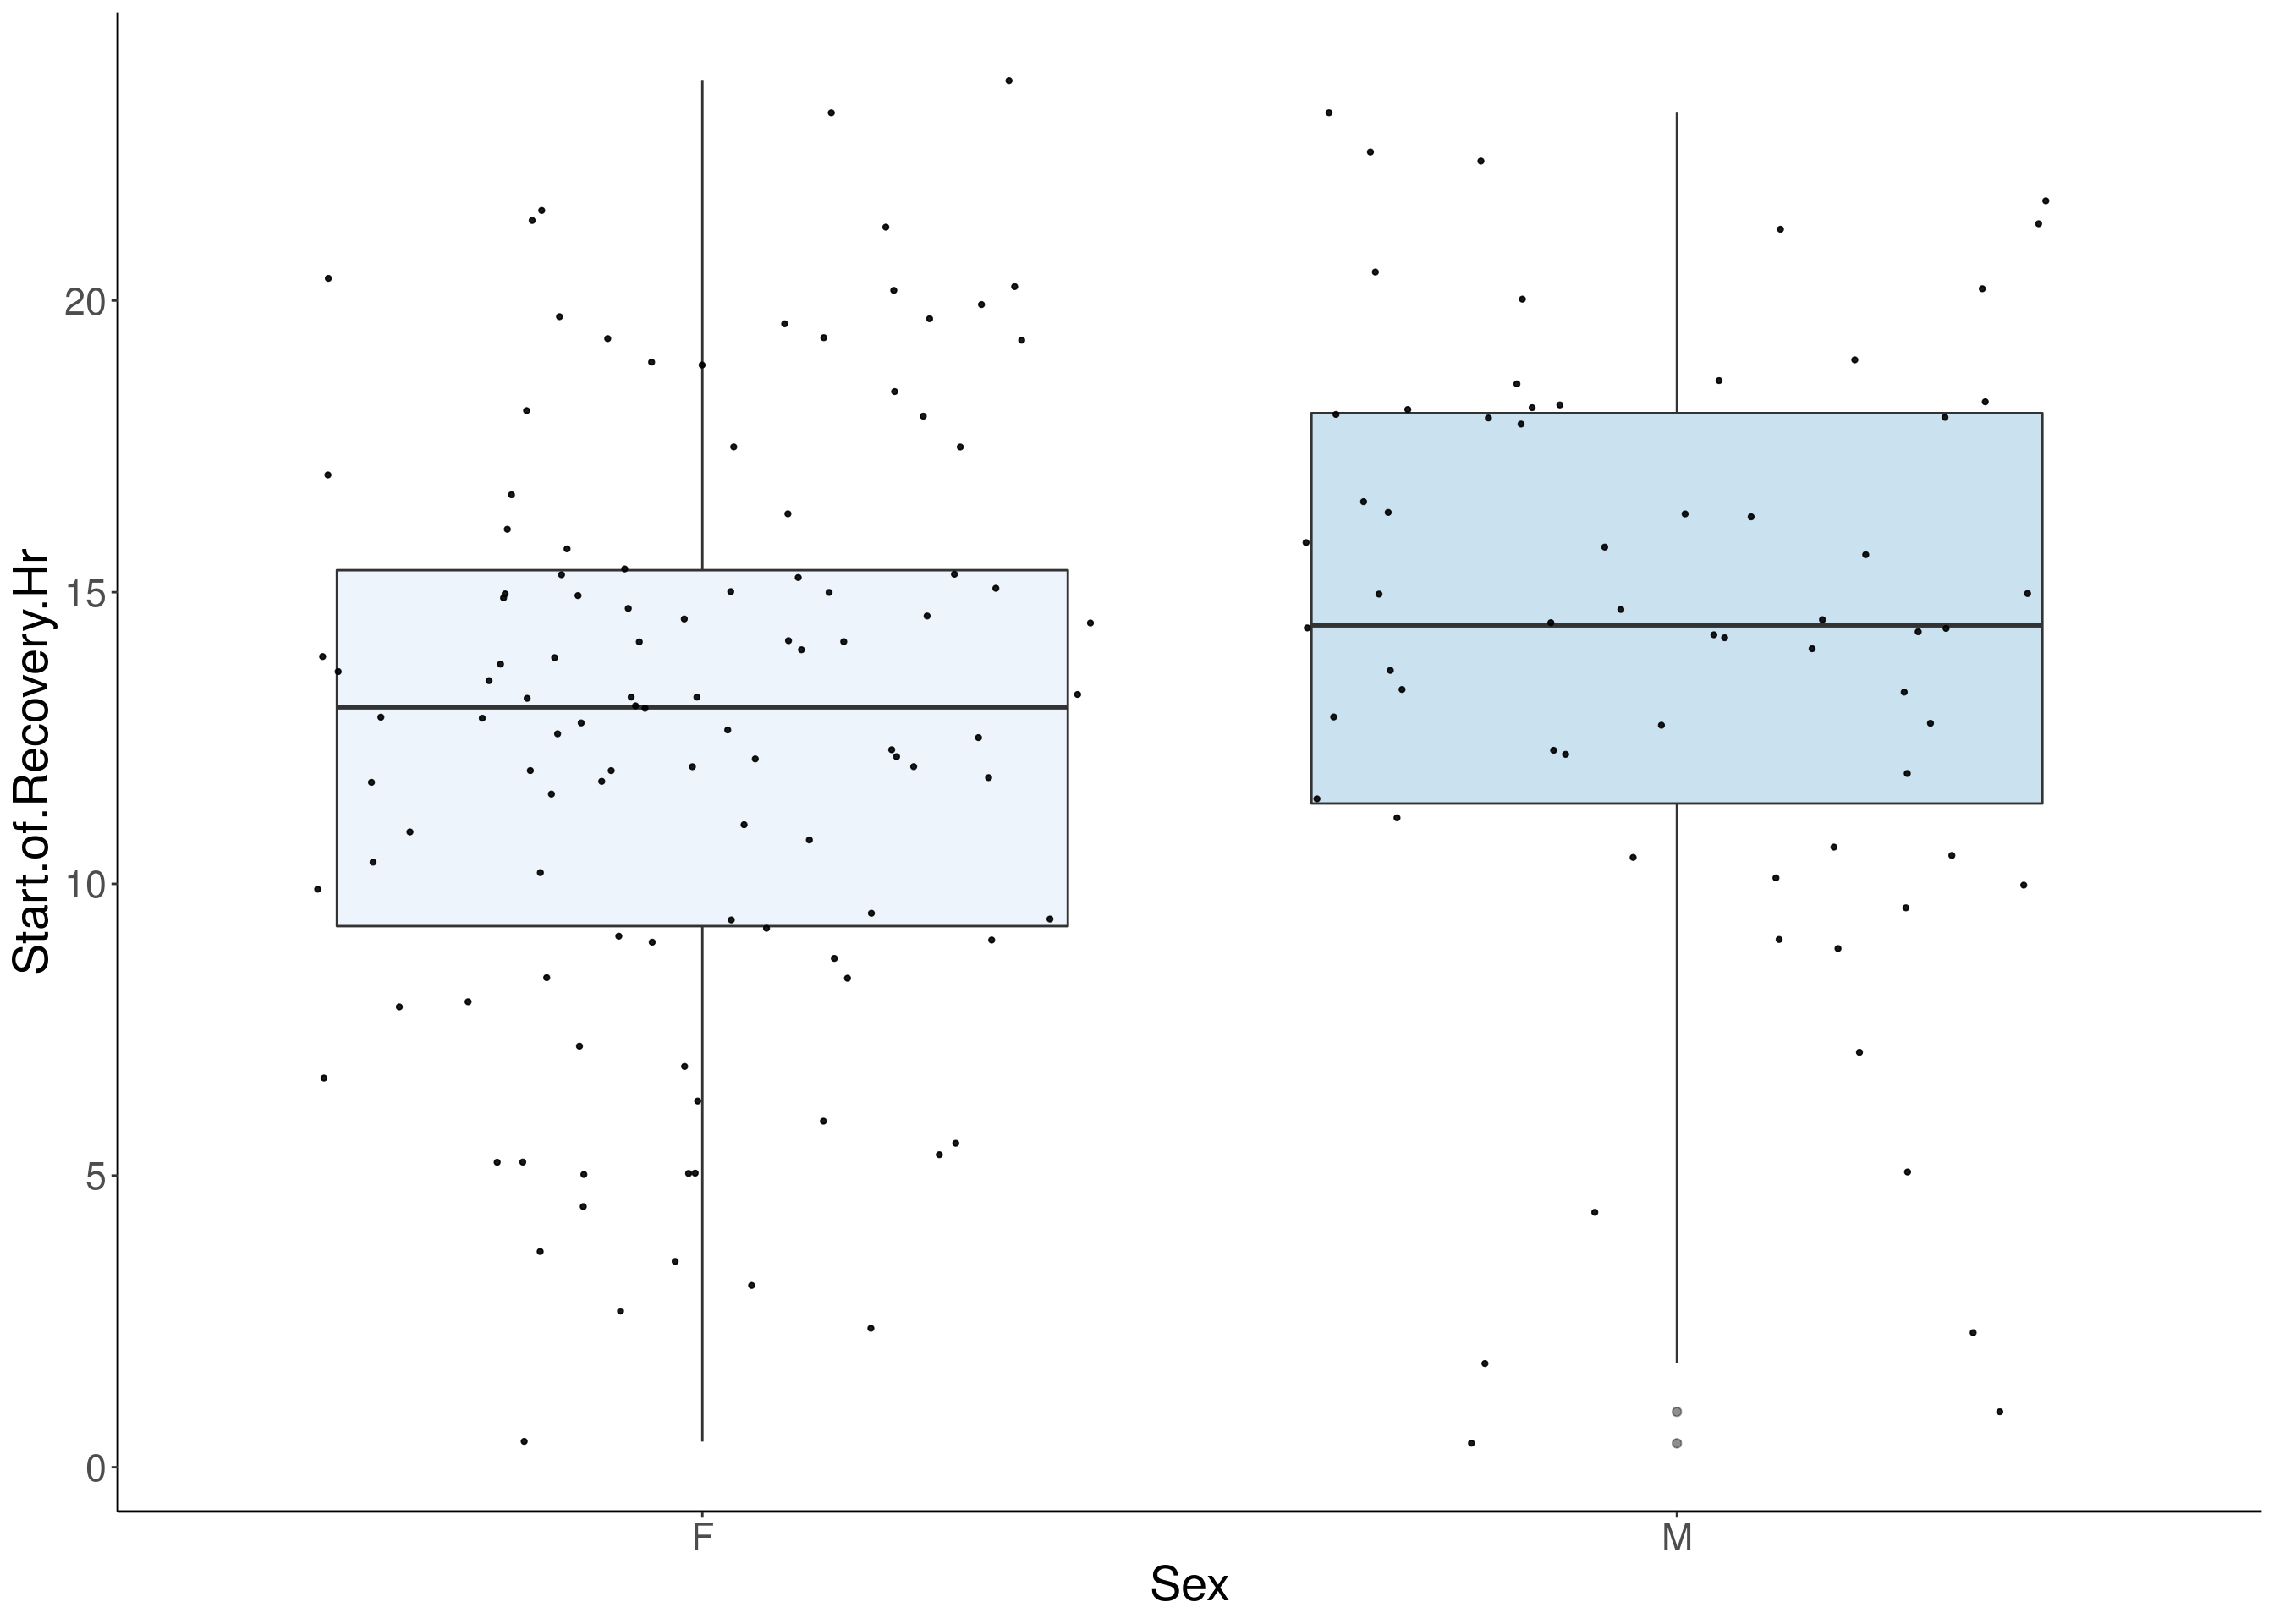
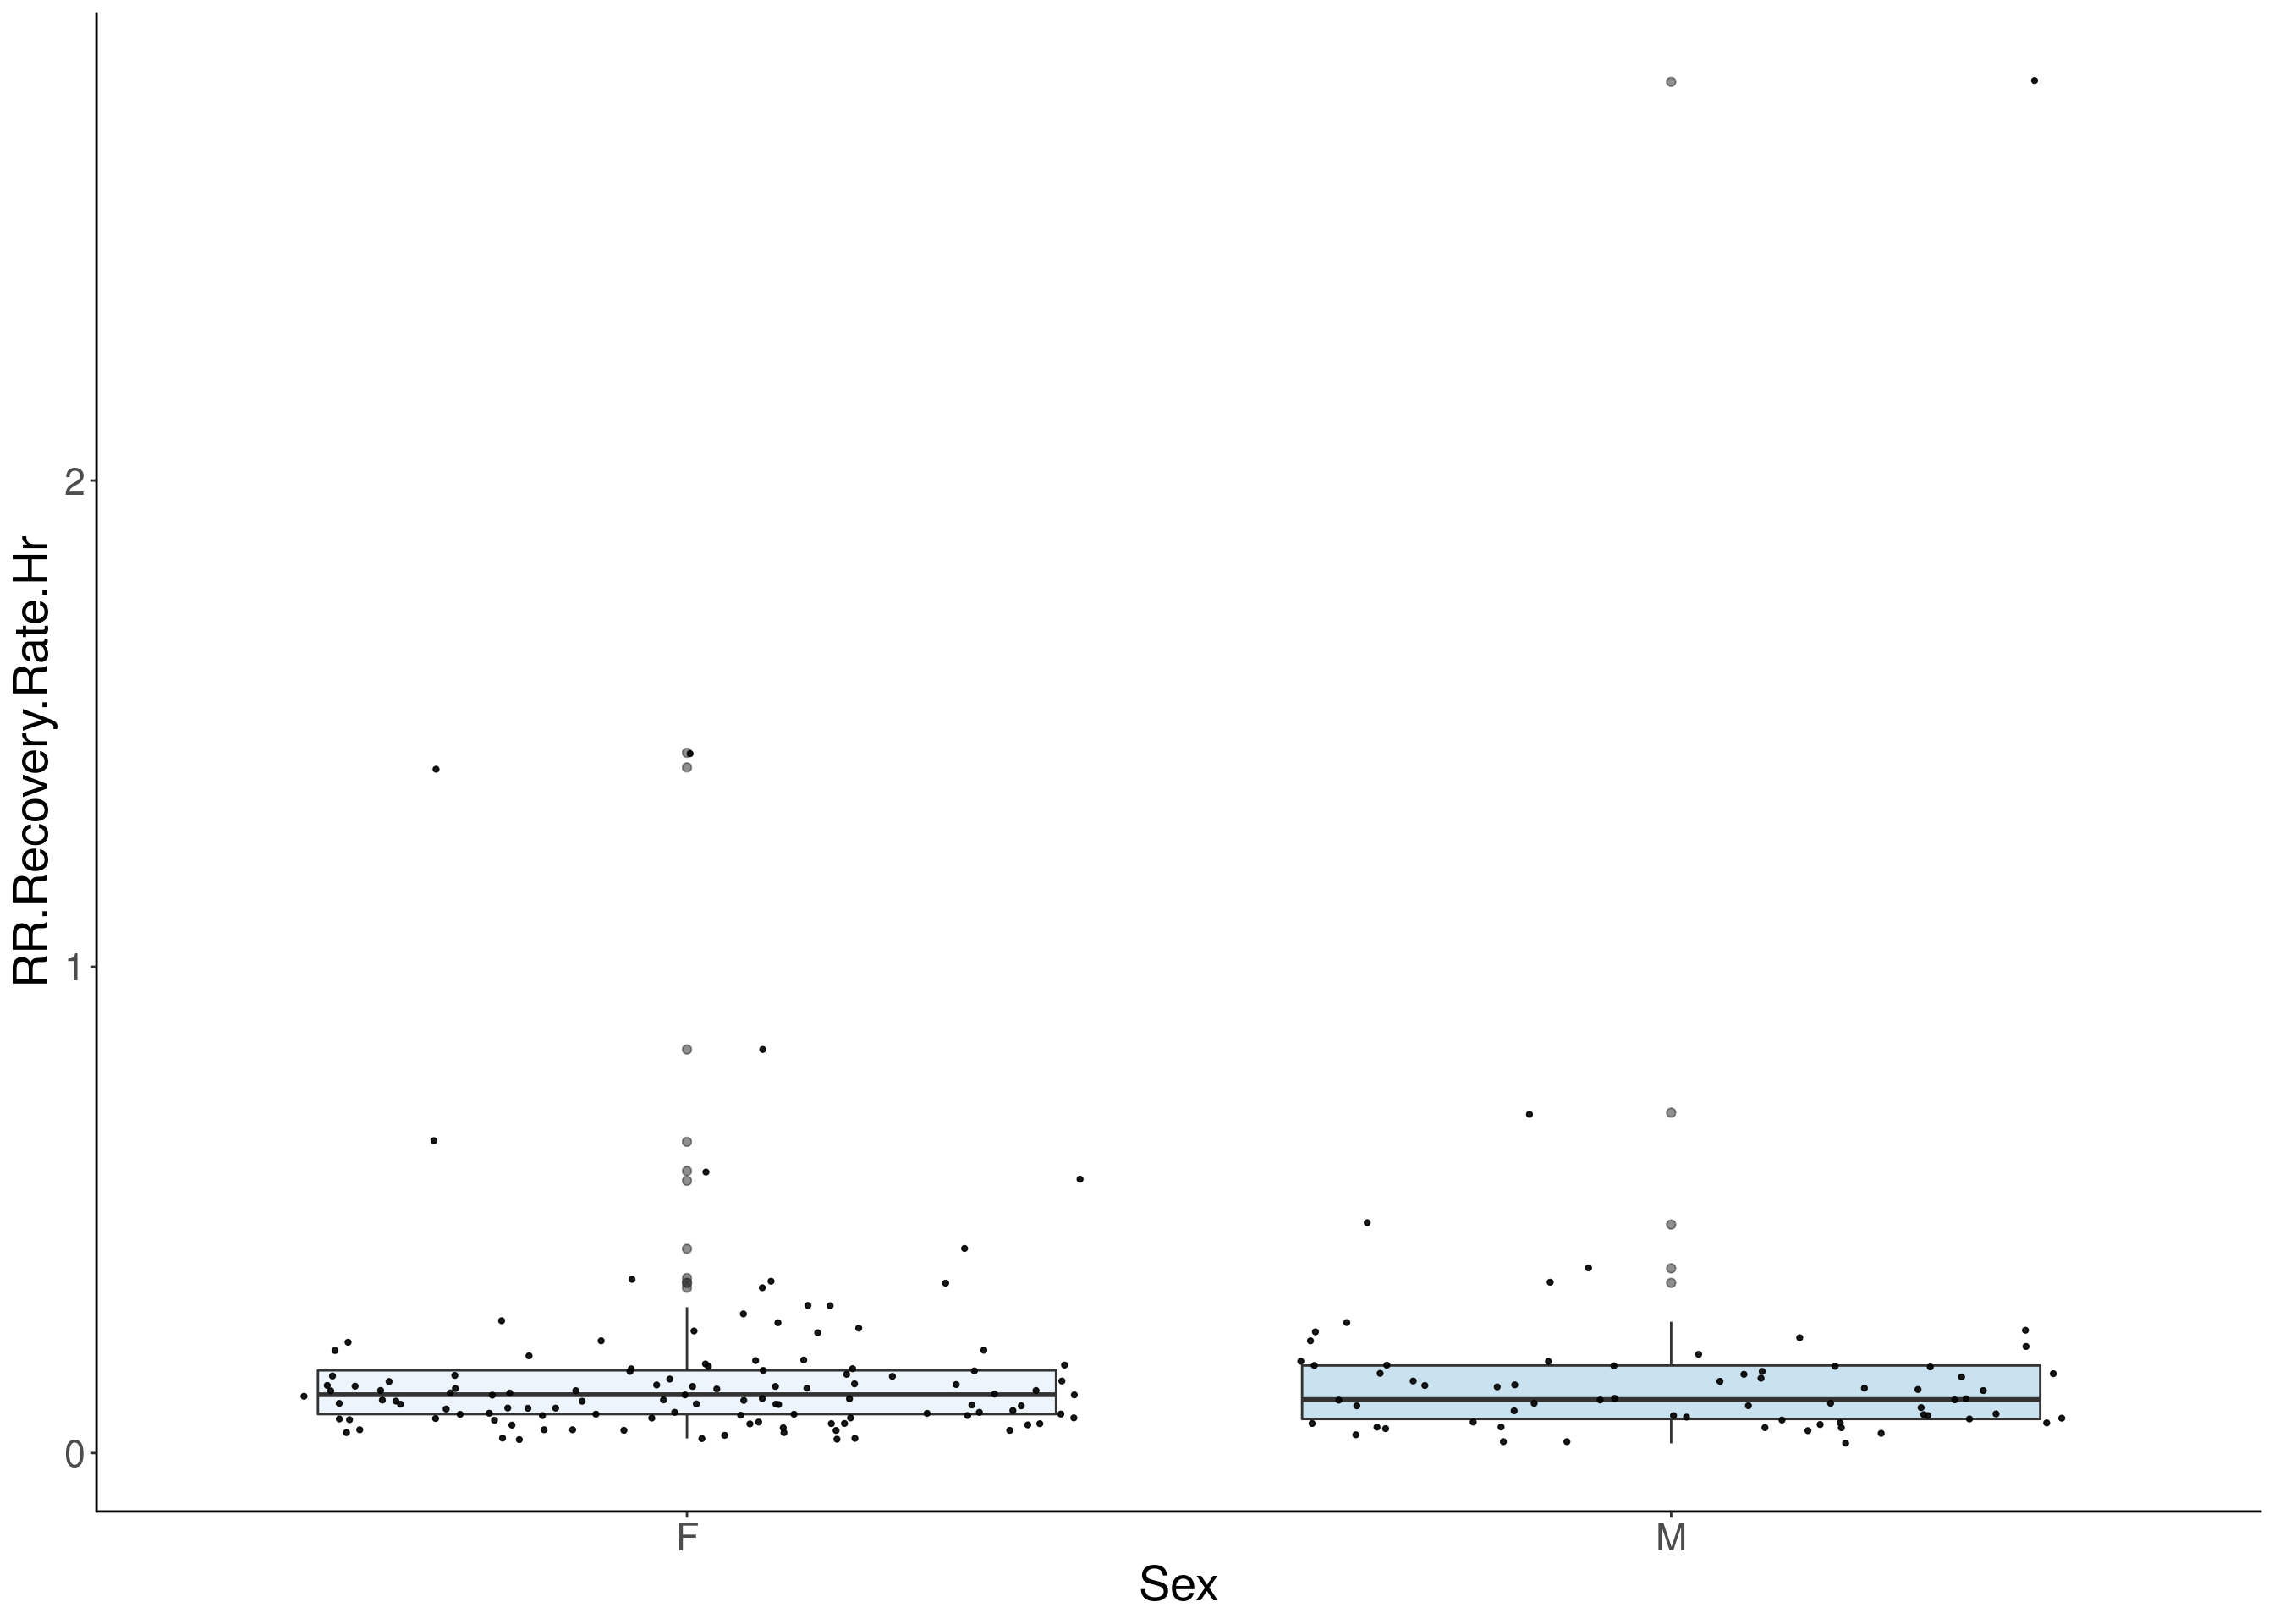
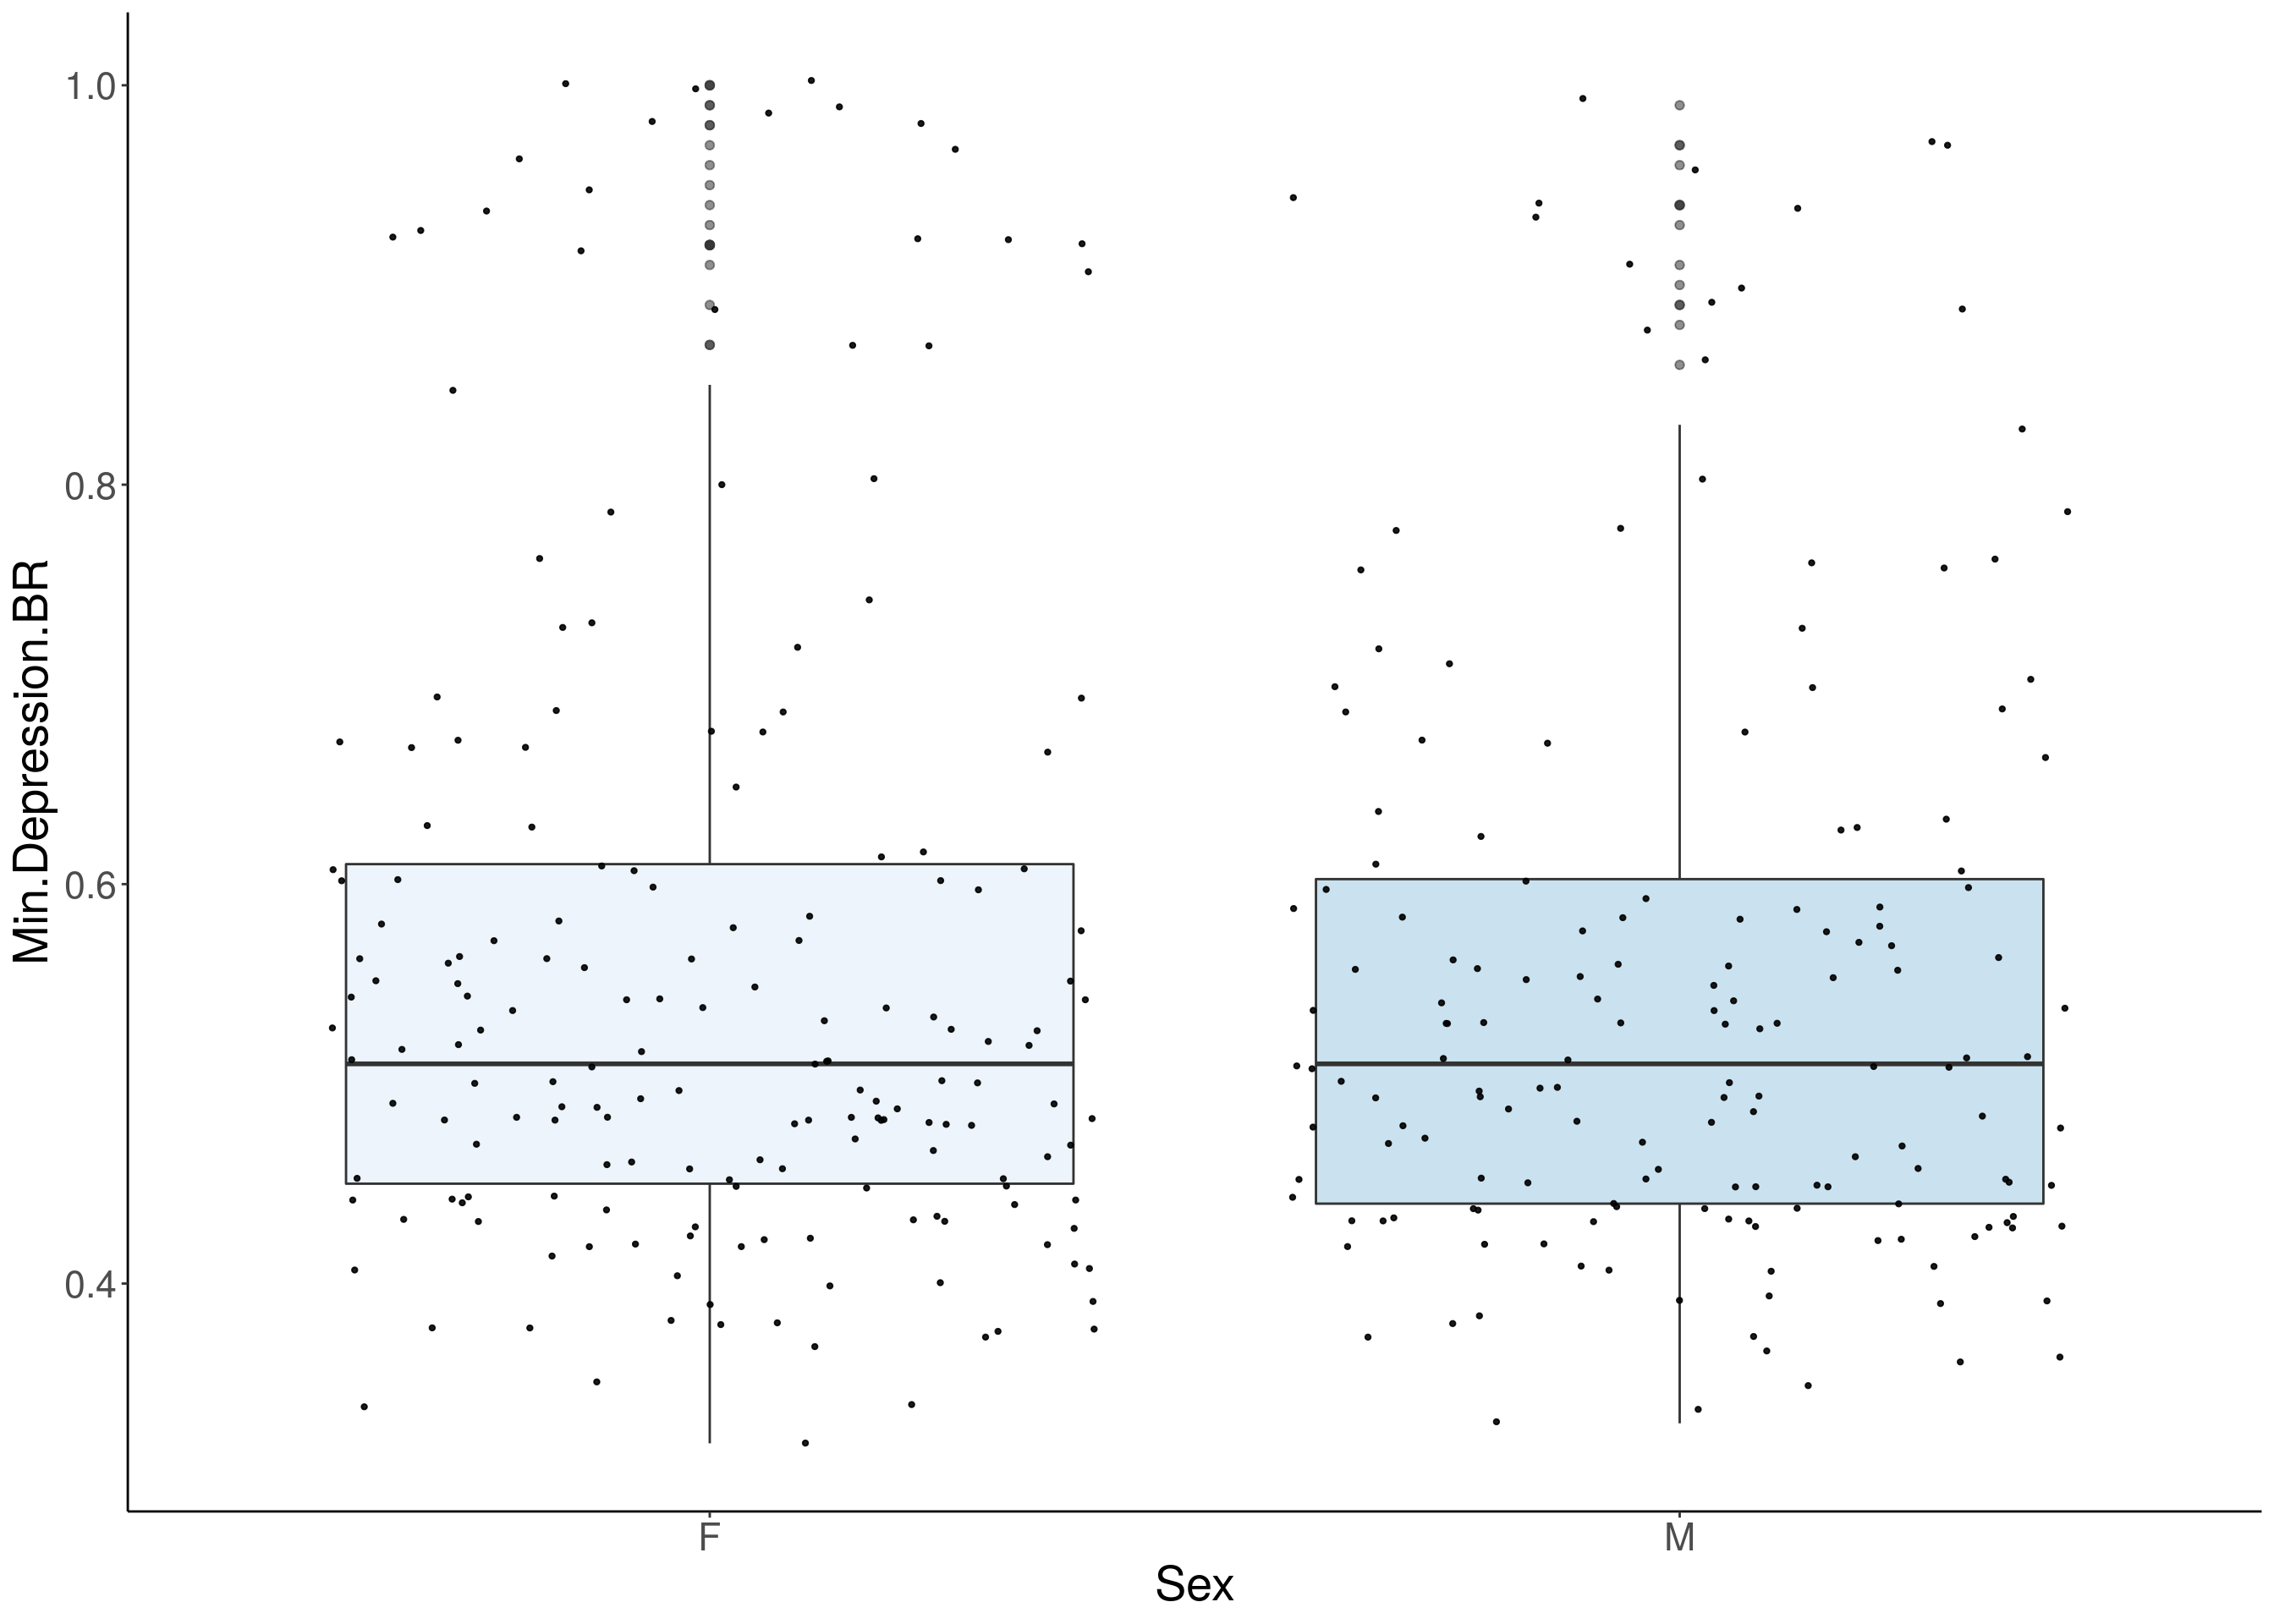
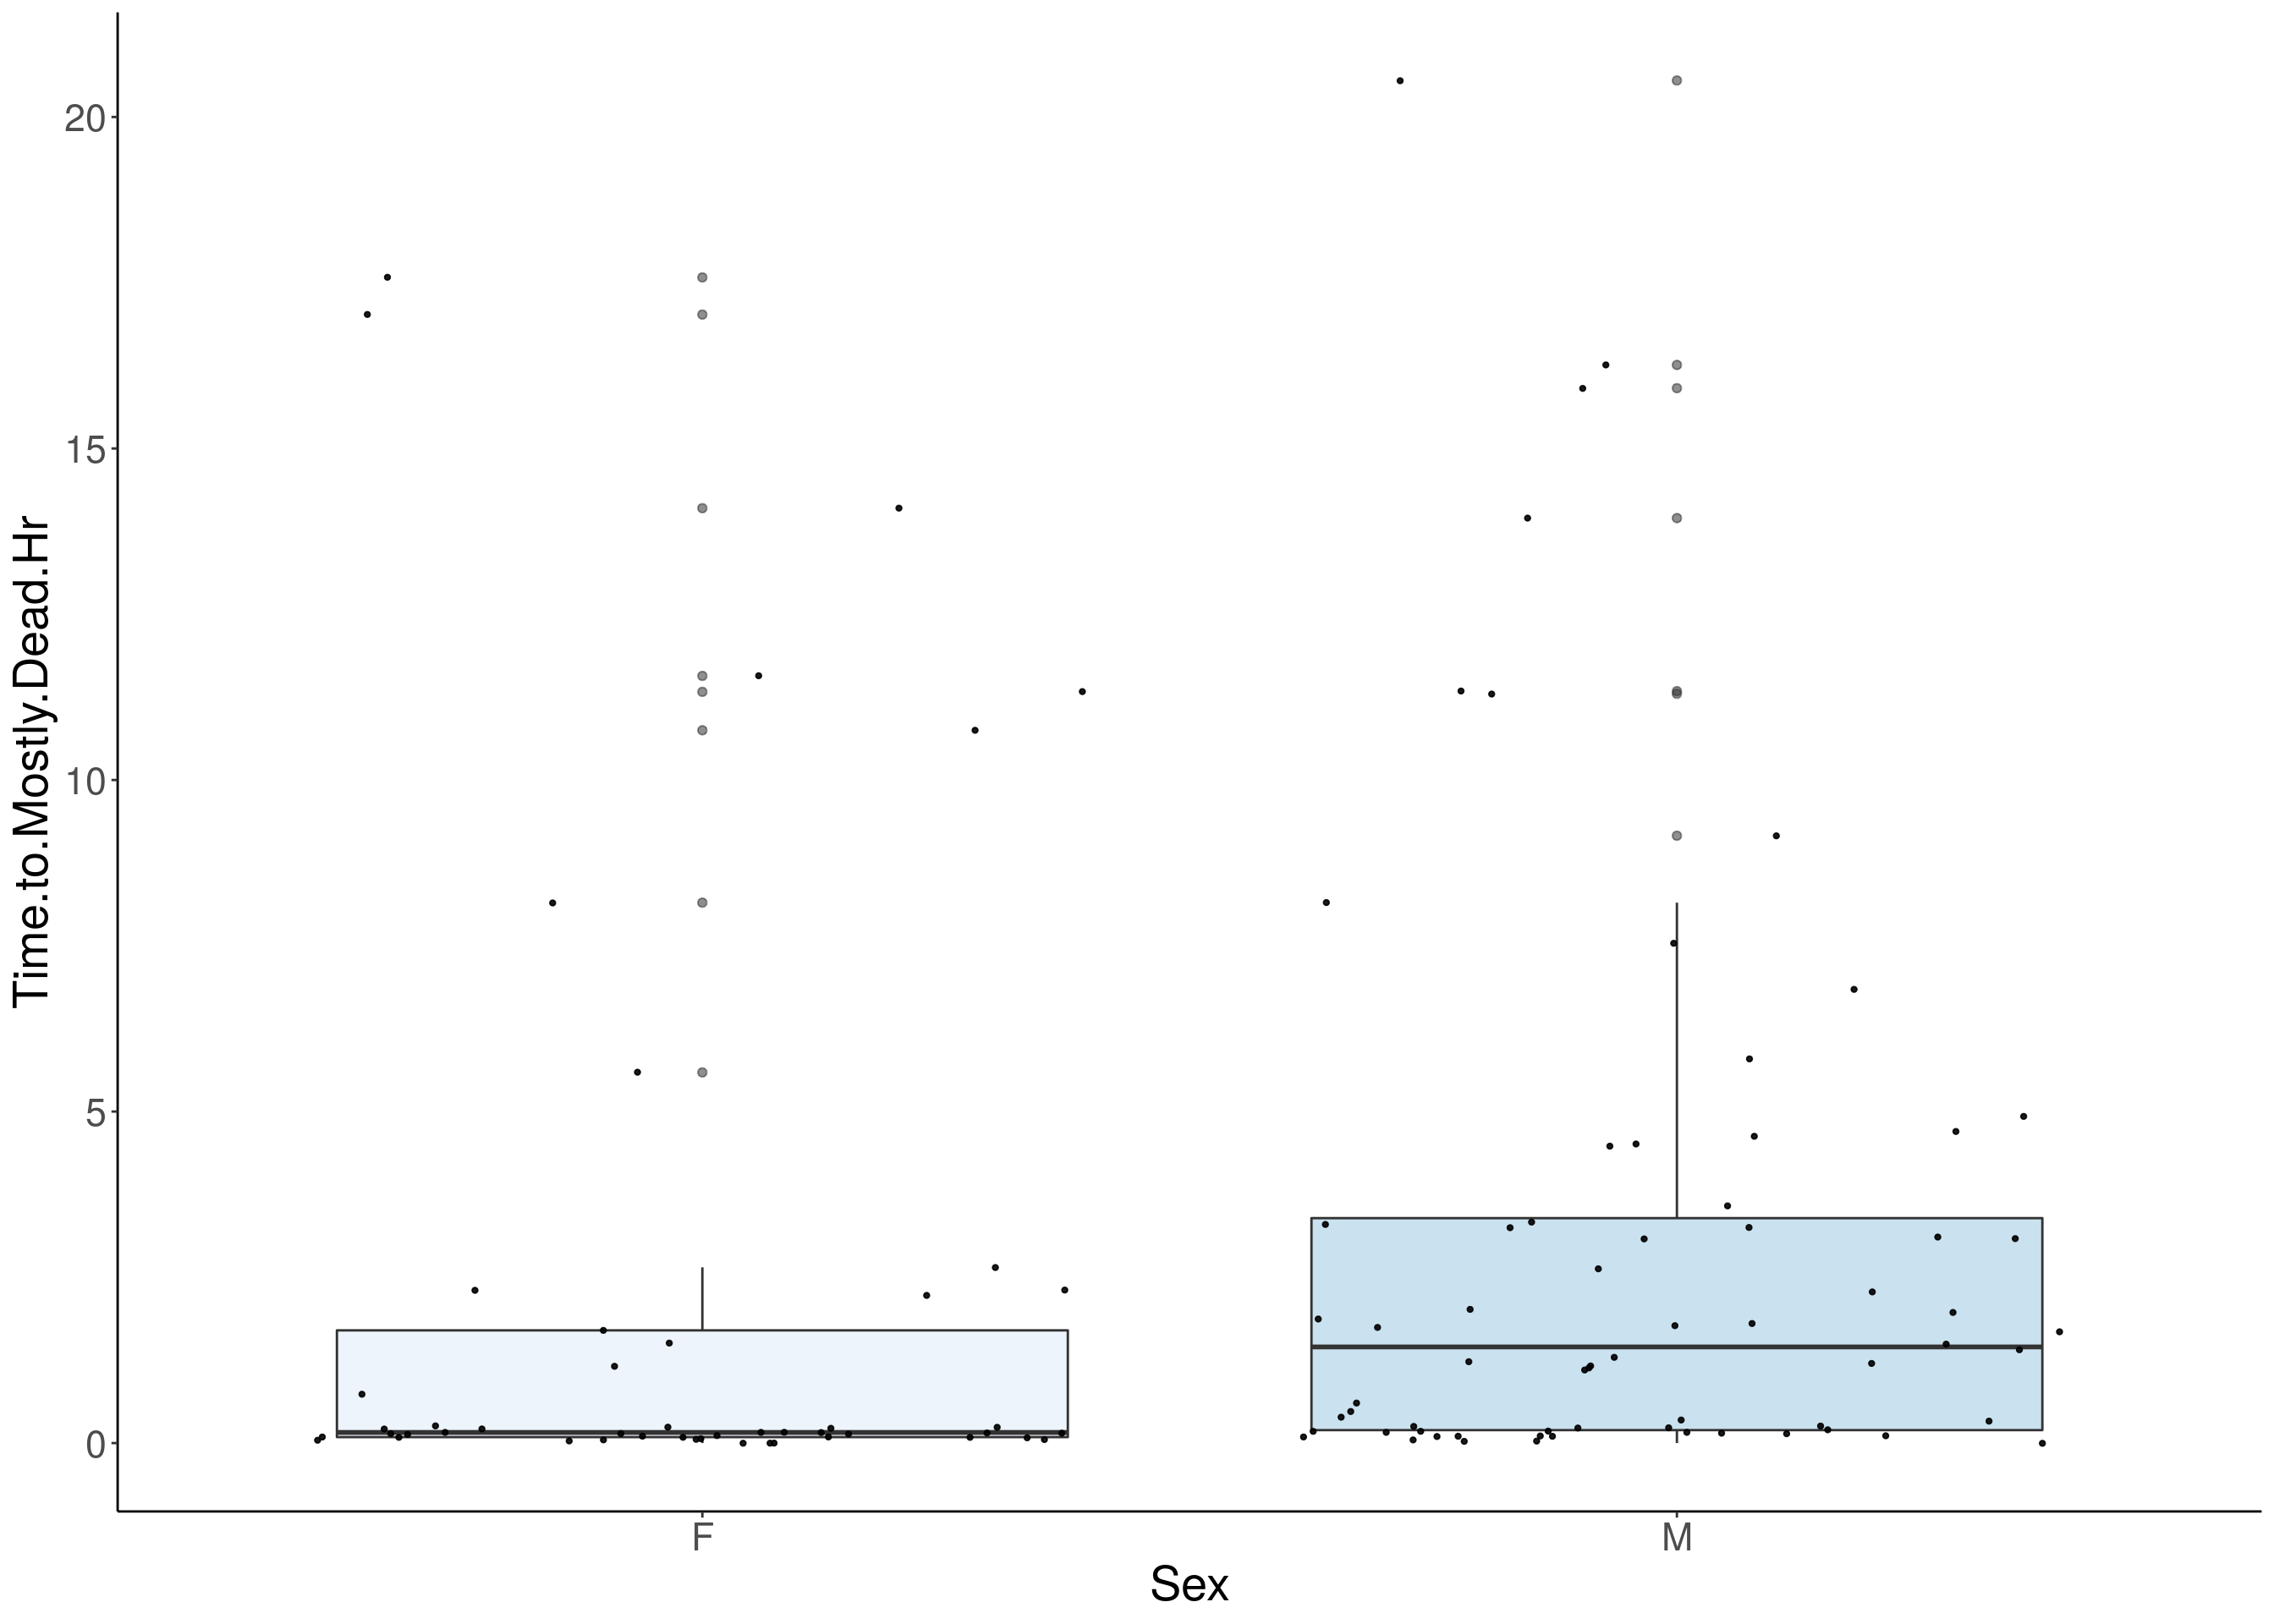
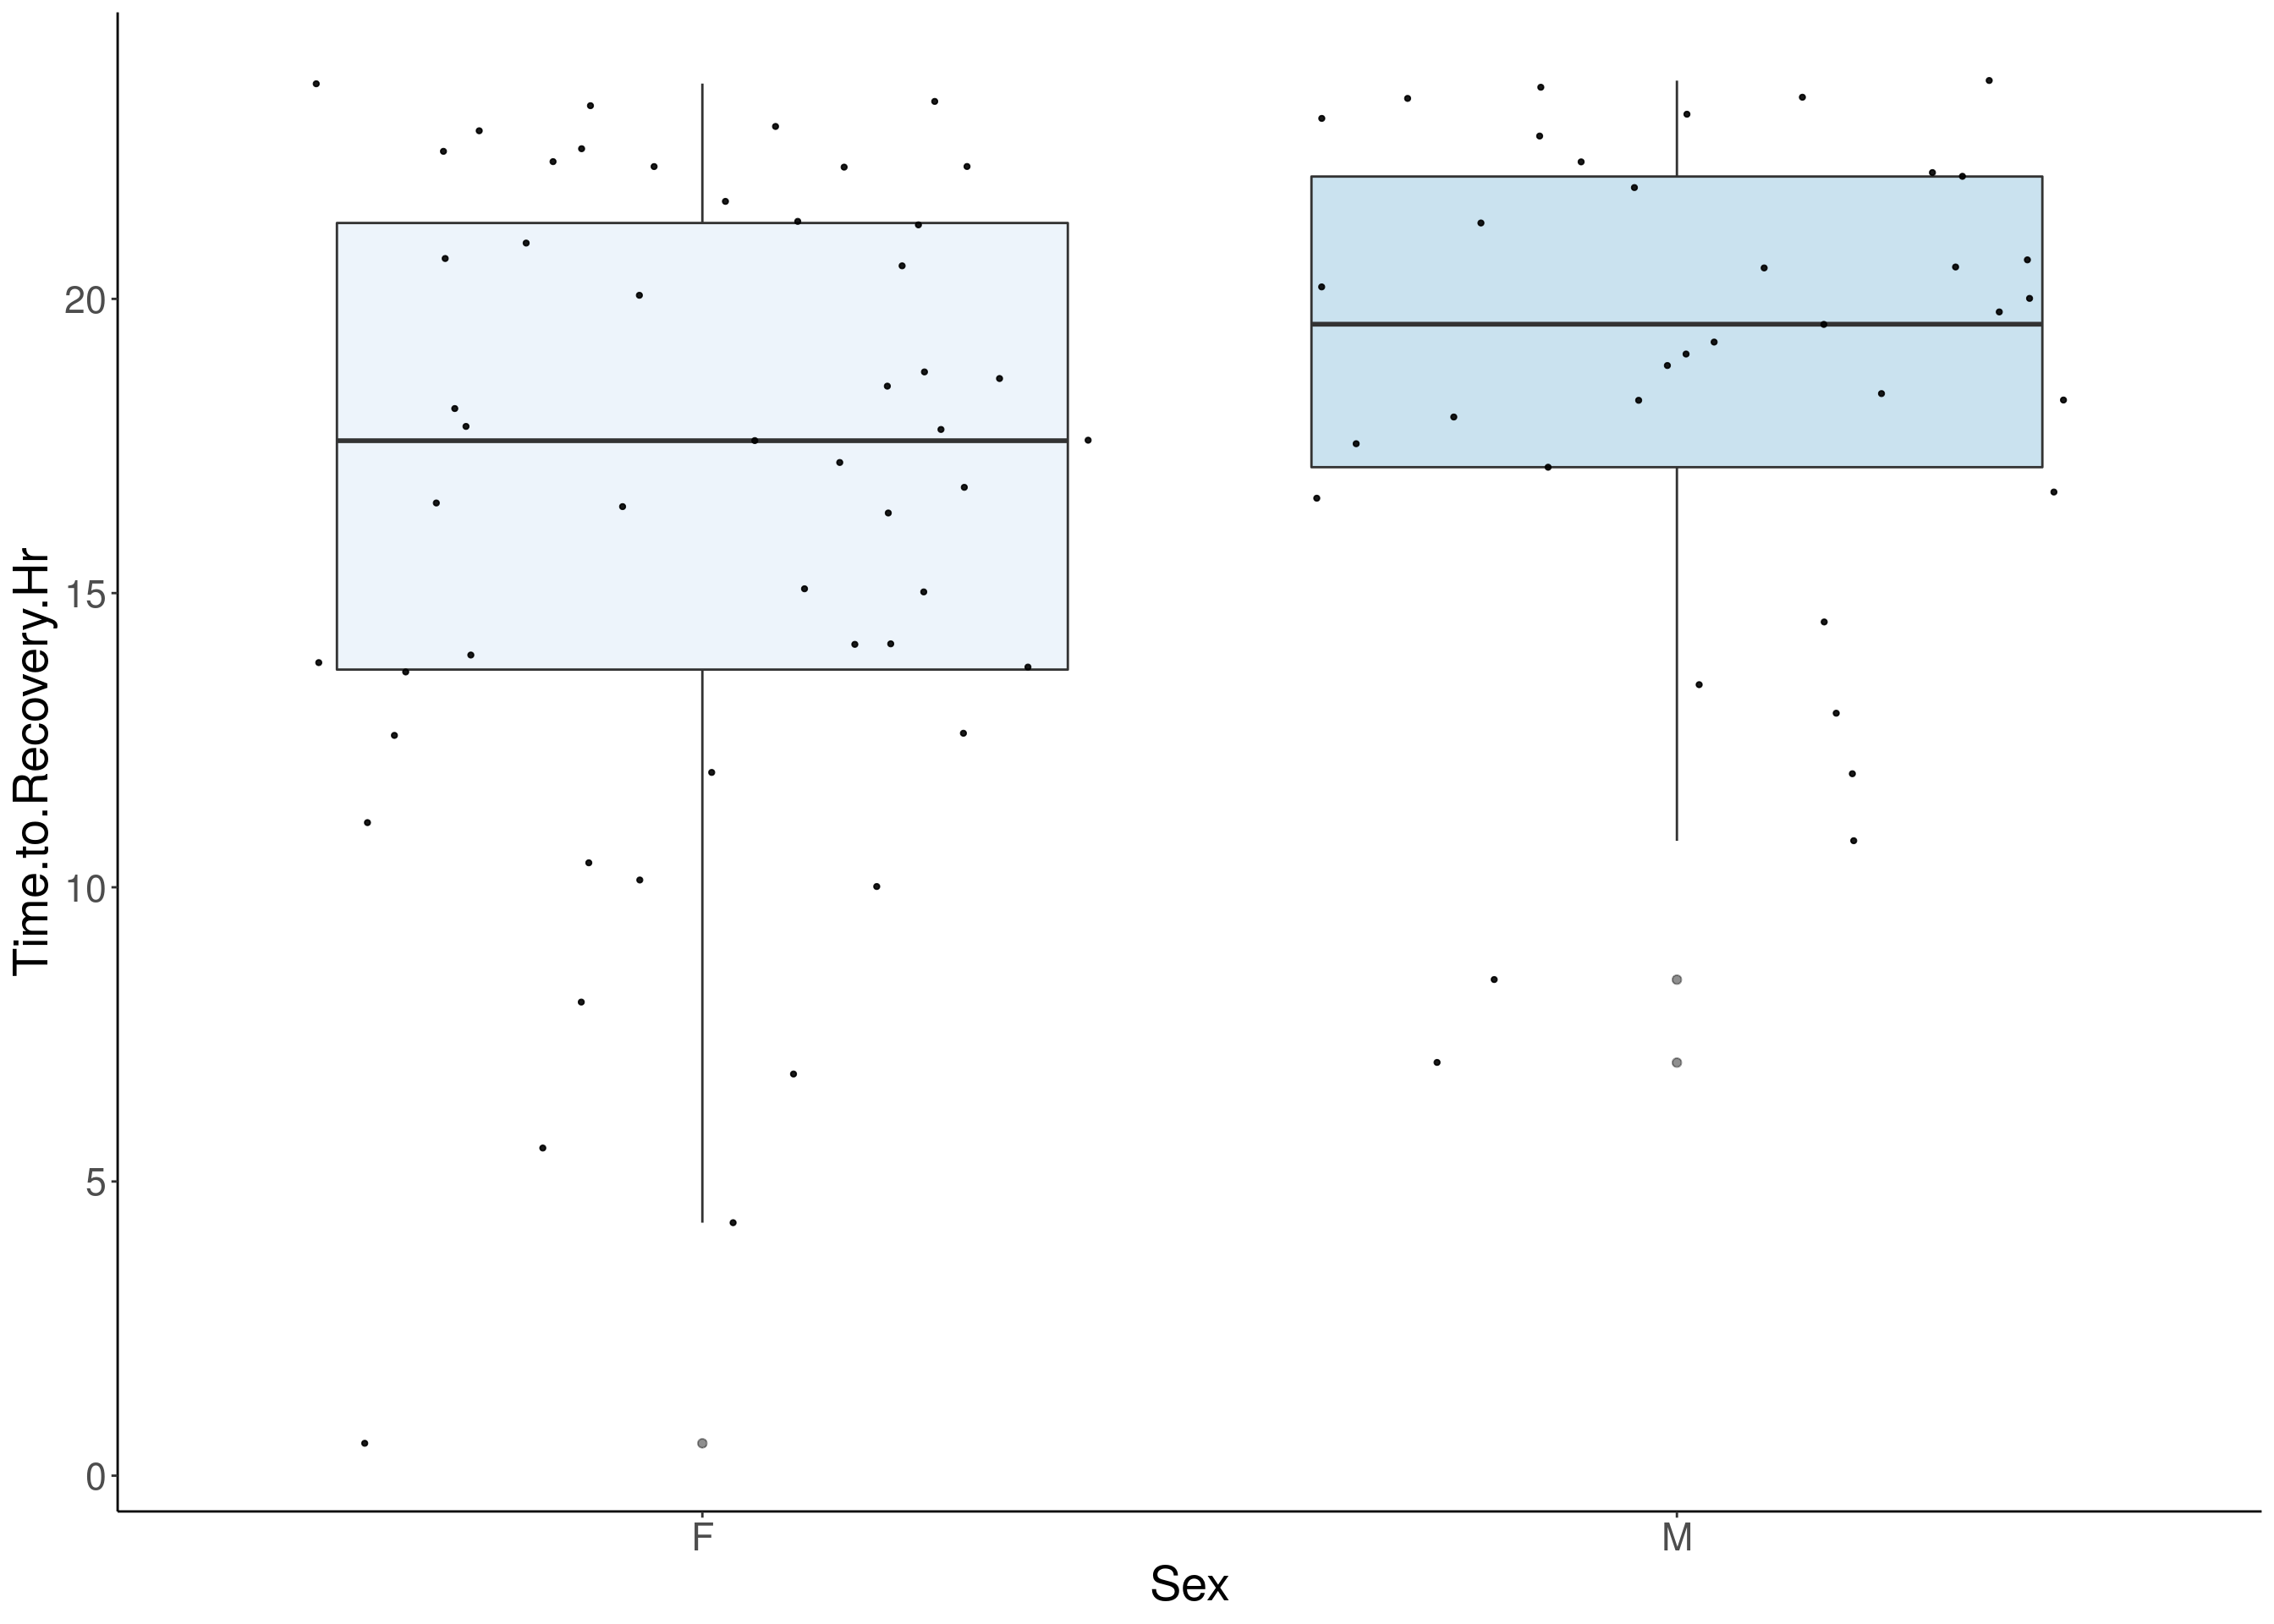
#boxplot on the raw data------------
for(i in 5:17){
df <- do.pheno[,c(1,2,i)]
df <- df[complete.cases(df), ]
p <- ggplot(df, aes(x=Sex, y=df[,3], group = Sex, fill = Sex, alpha = 0.9)) +
geom_boxplot(show.legend = F , outlier.size = 1.5, notchwidth = 0.85) +
geom_jitter(color="black", size=0.8, alpha=0.9) +
scale_fill_brewer(palette="Blues") +
ylab(paste0(colnames(df)[3])) +
xlab("Sex") +
labs(fill = "") +
theme(legend.position = "none",
panel.grid.major = element_blank(),
panel.grid.minor = element_blank(),
panel.background = element_blank(),
axis.line = element_line(colour = "black"),
text = element_text(size=21),
axis.title=element_text(size=21)) +
guides(shape = guide_legend(override.aes = list(size = 12)))
print(p)
}
#histogram
for(i in 5:17){
  df <- do.pheno[,c(1,2,i)]
  p <- ggplot(data=df, aes(x=df[,3])) +
    geom_histogram() +
    ylab("Number of DO mice") +
    xlab(paste0(colnames(df)[3])) +
    theme(panel.grid.major = element_blank(), panel.grid.minor = element_blank(),
          panel.background = element_blank(), axis.line = element_line(colour = "black"),
          text = element_text(size=21))
  print(p)
}
# Warning: Removed 337 rows containing non-finite values (stat_bin).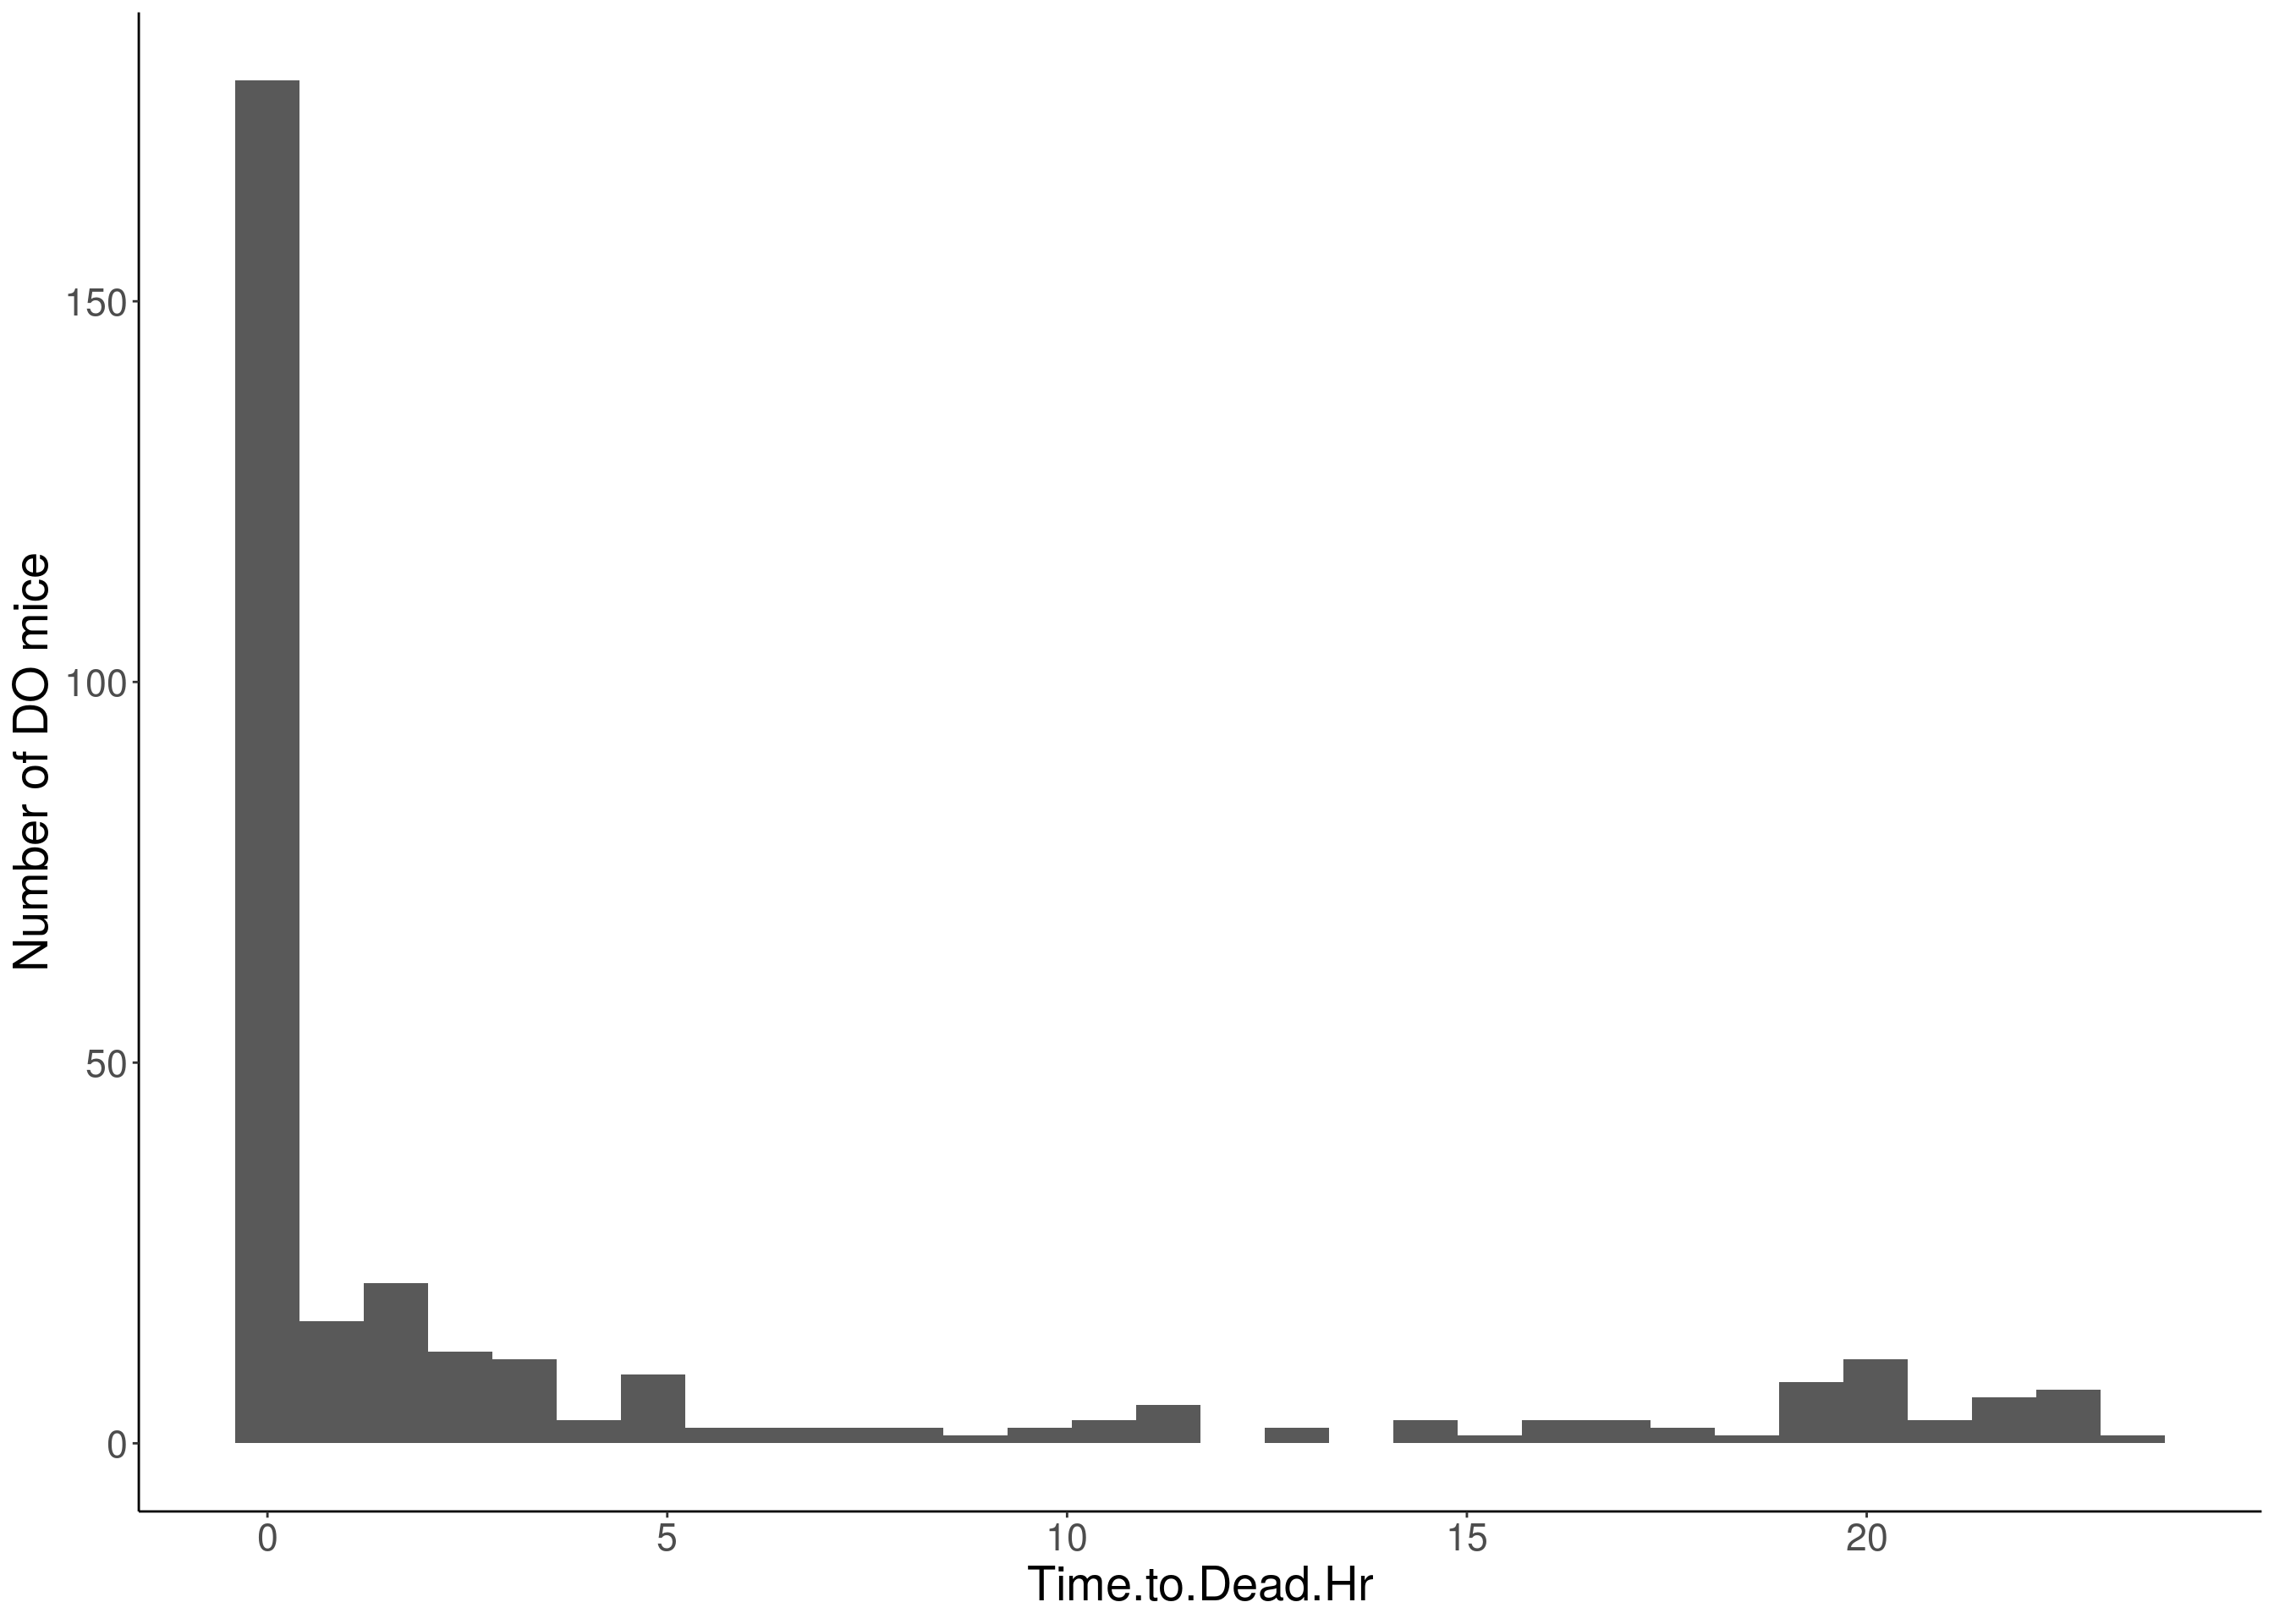
# Warning: Removed 85 rows containing non-finite values (stat_bin).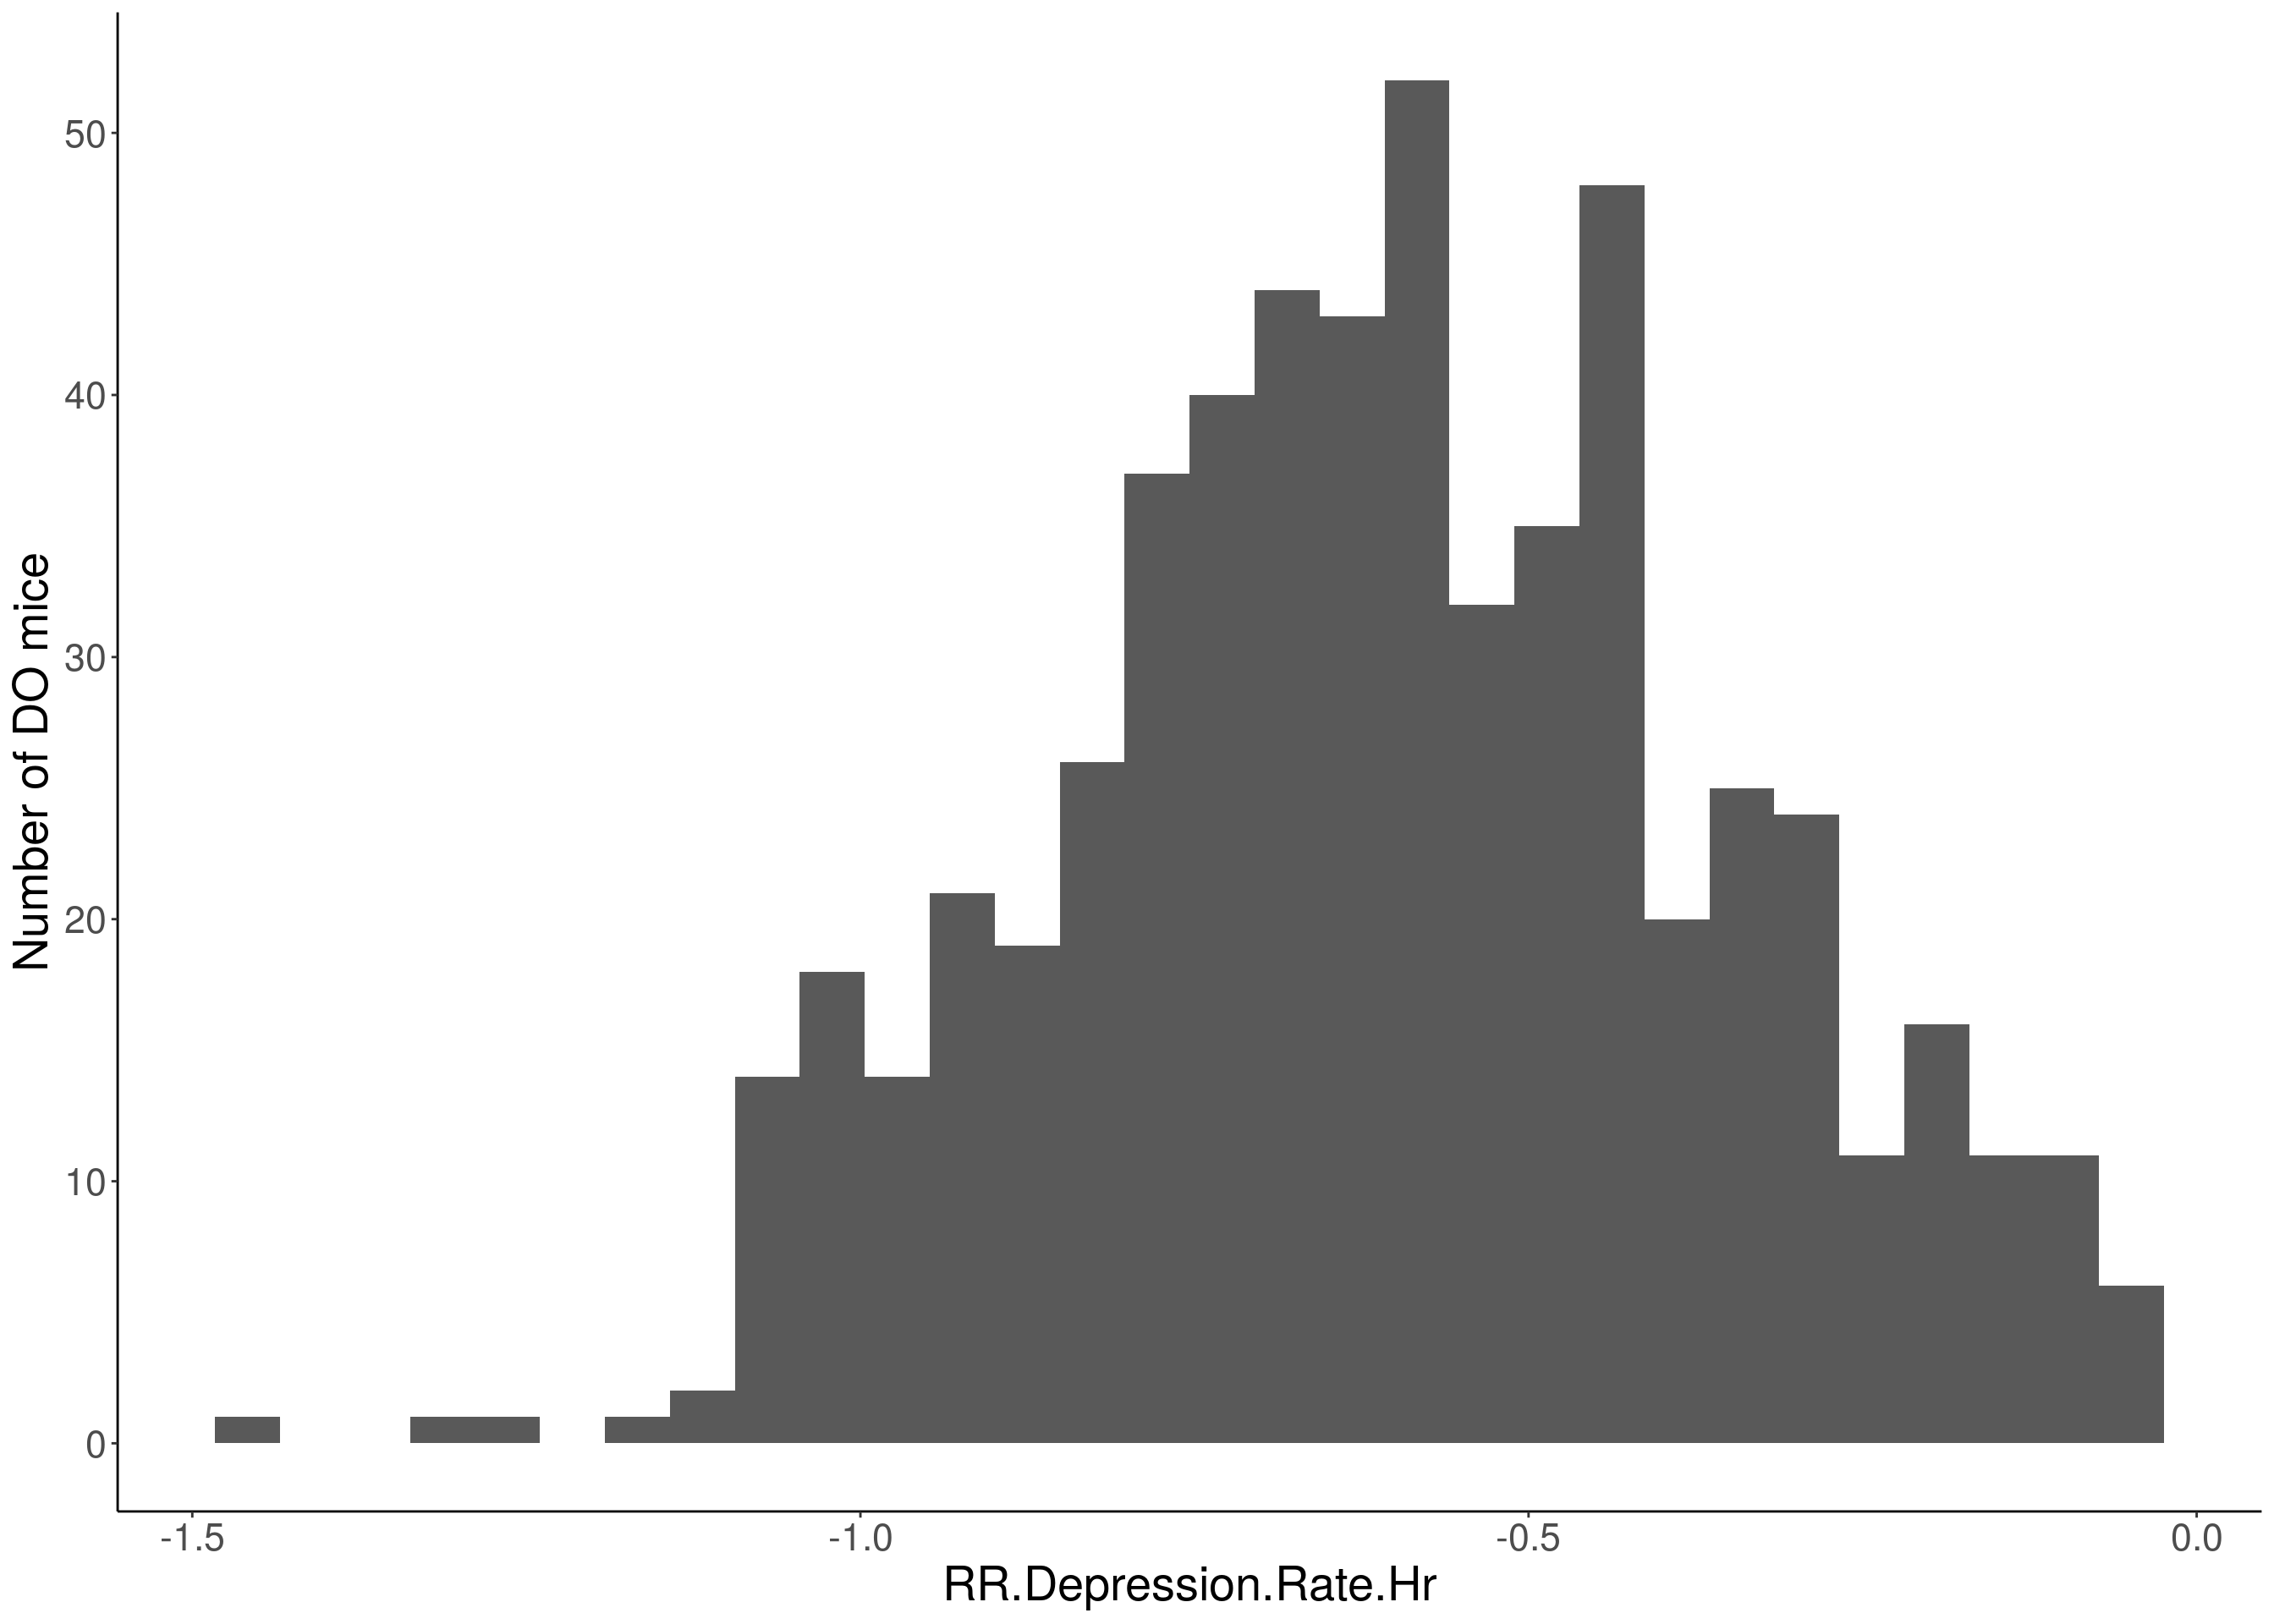
# Warning: Removed 85 rows containing non-finite values (stat_bin).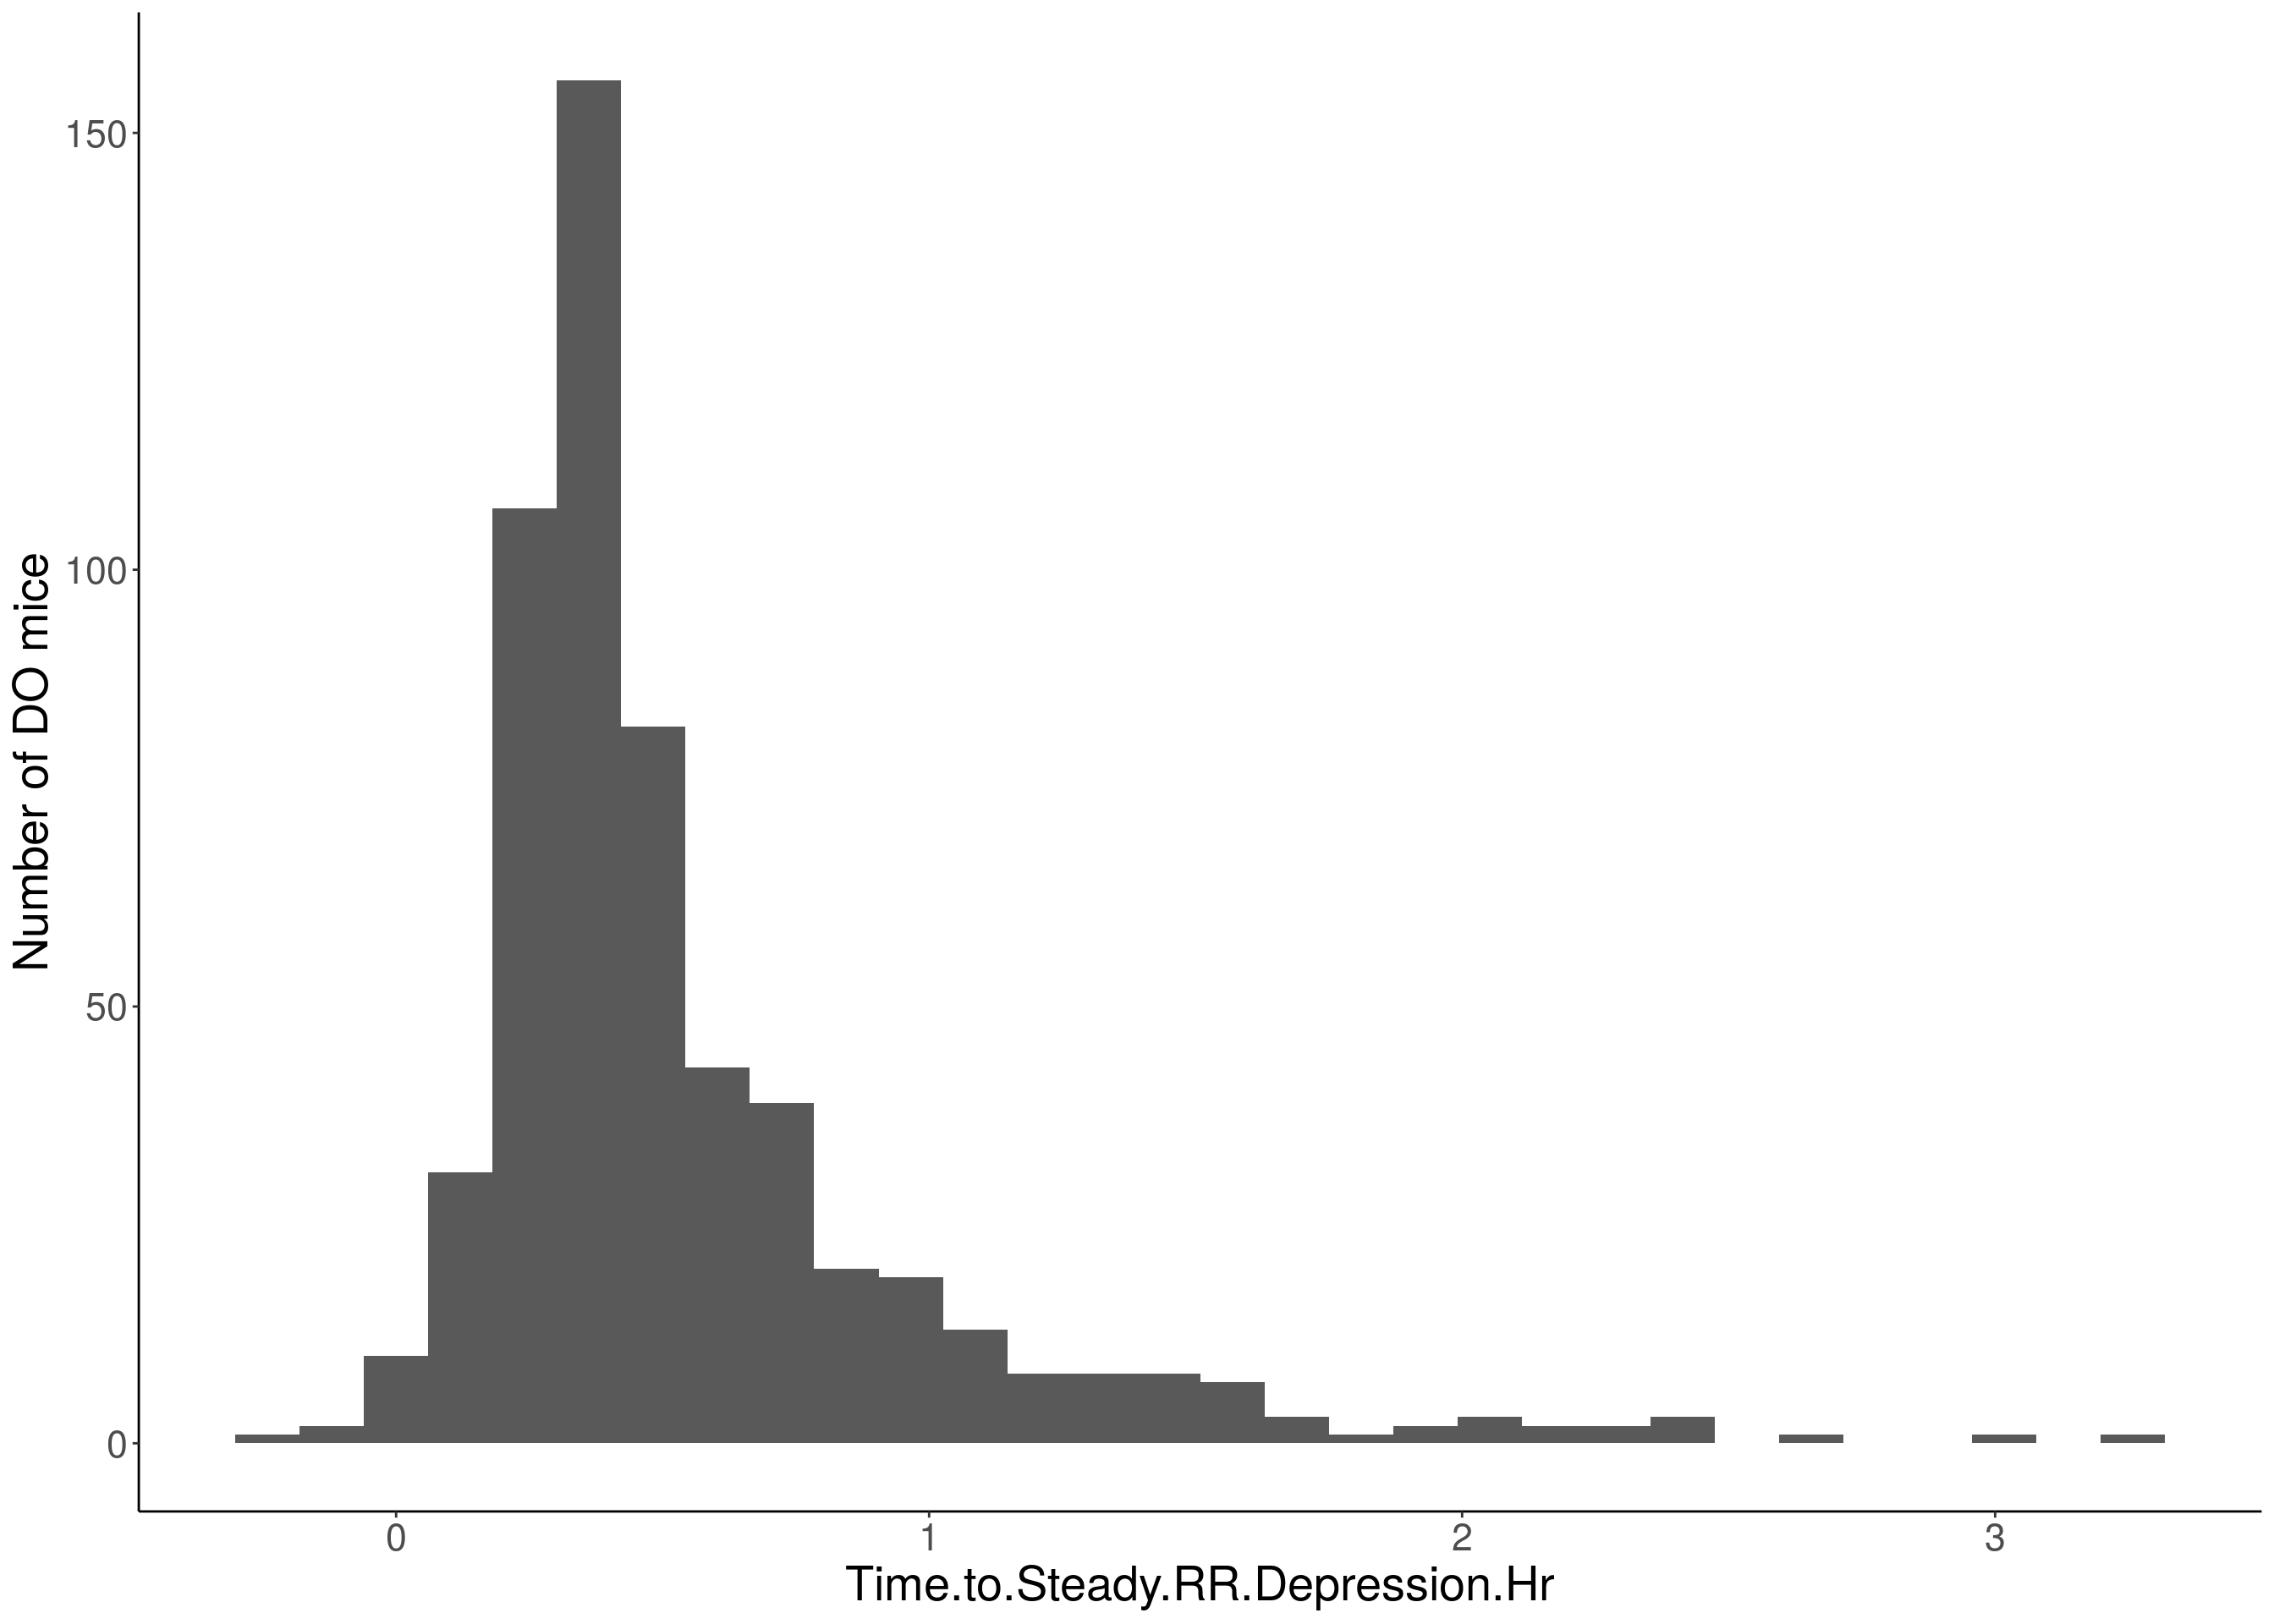
# Warning: Removed 85 rows containing non-finite values (stat_bin).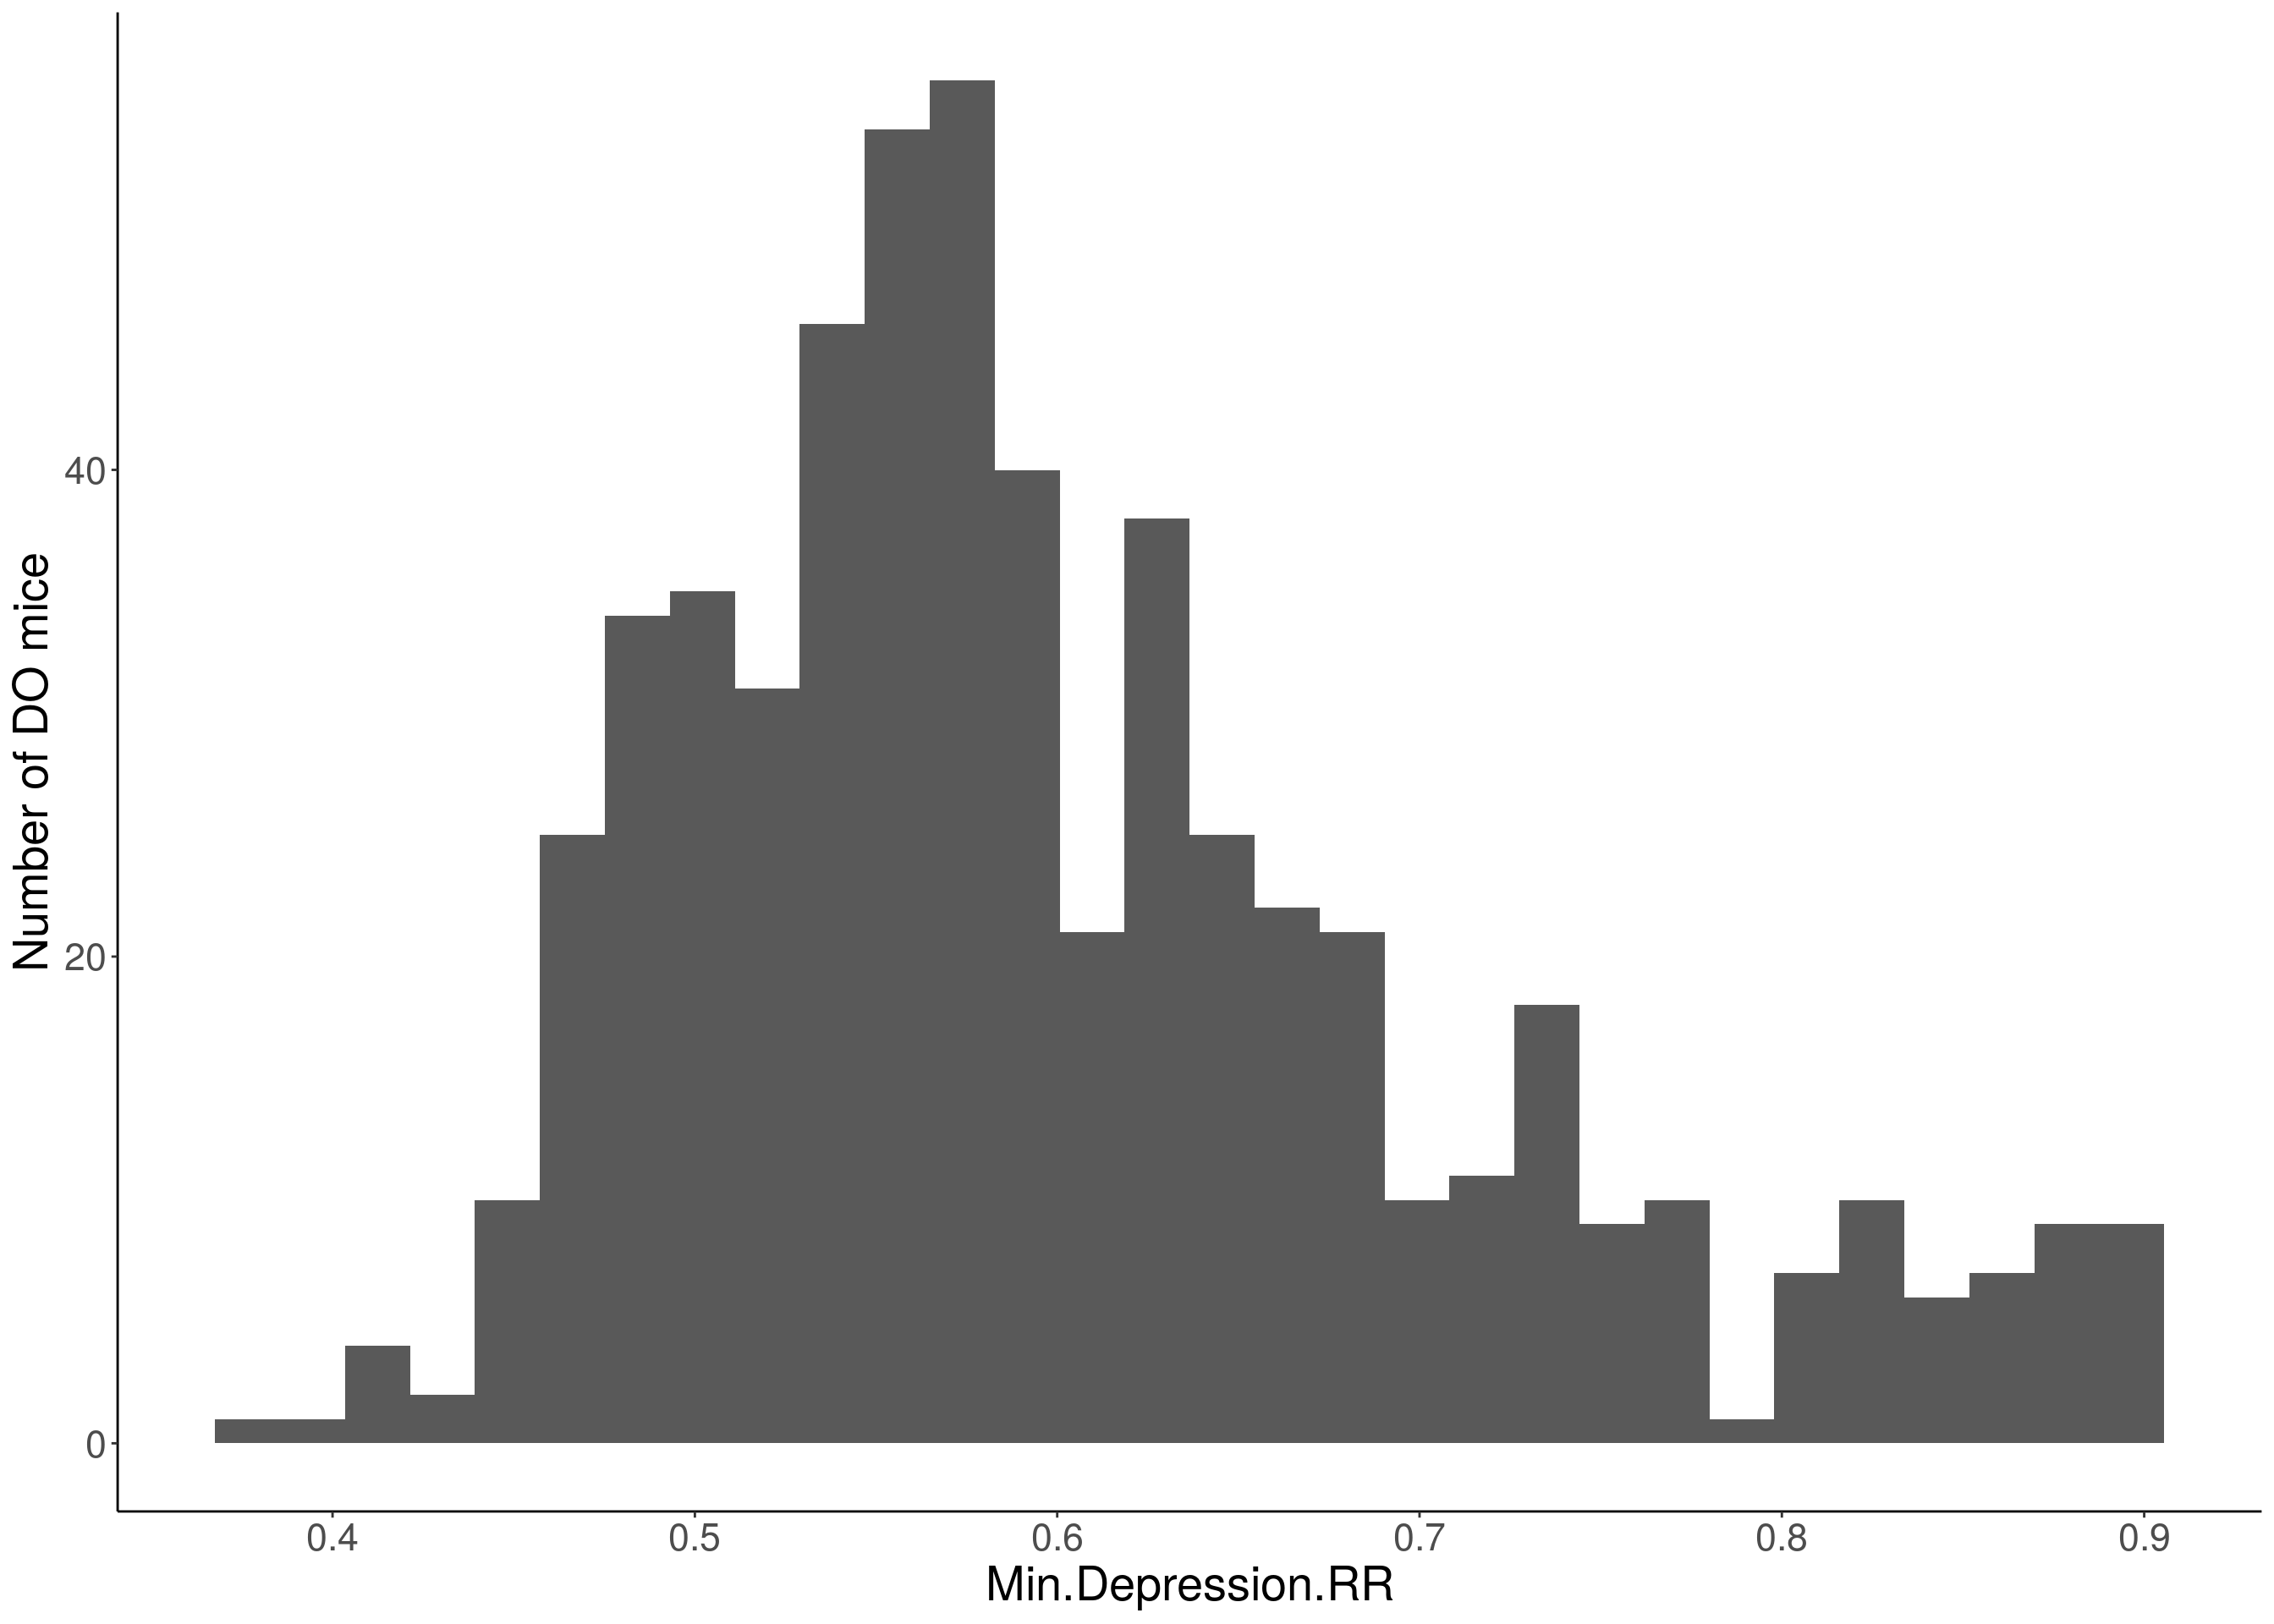
# Warning: Removed 355 rows containing non-finite values (stat_bin).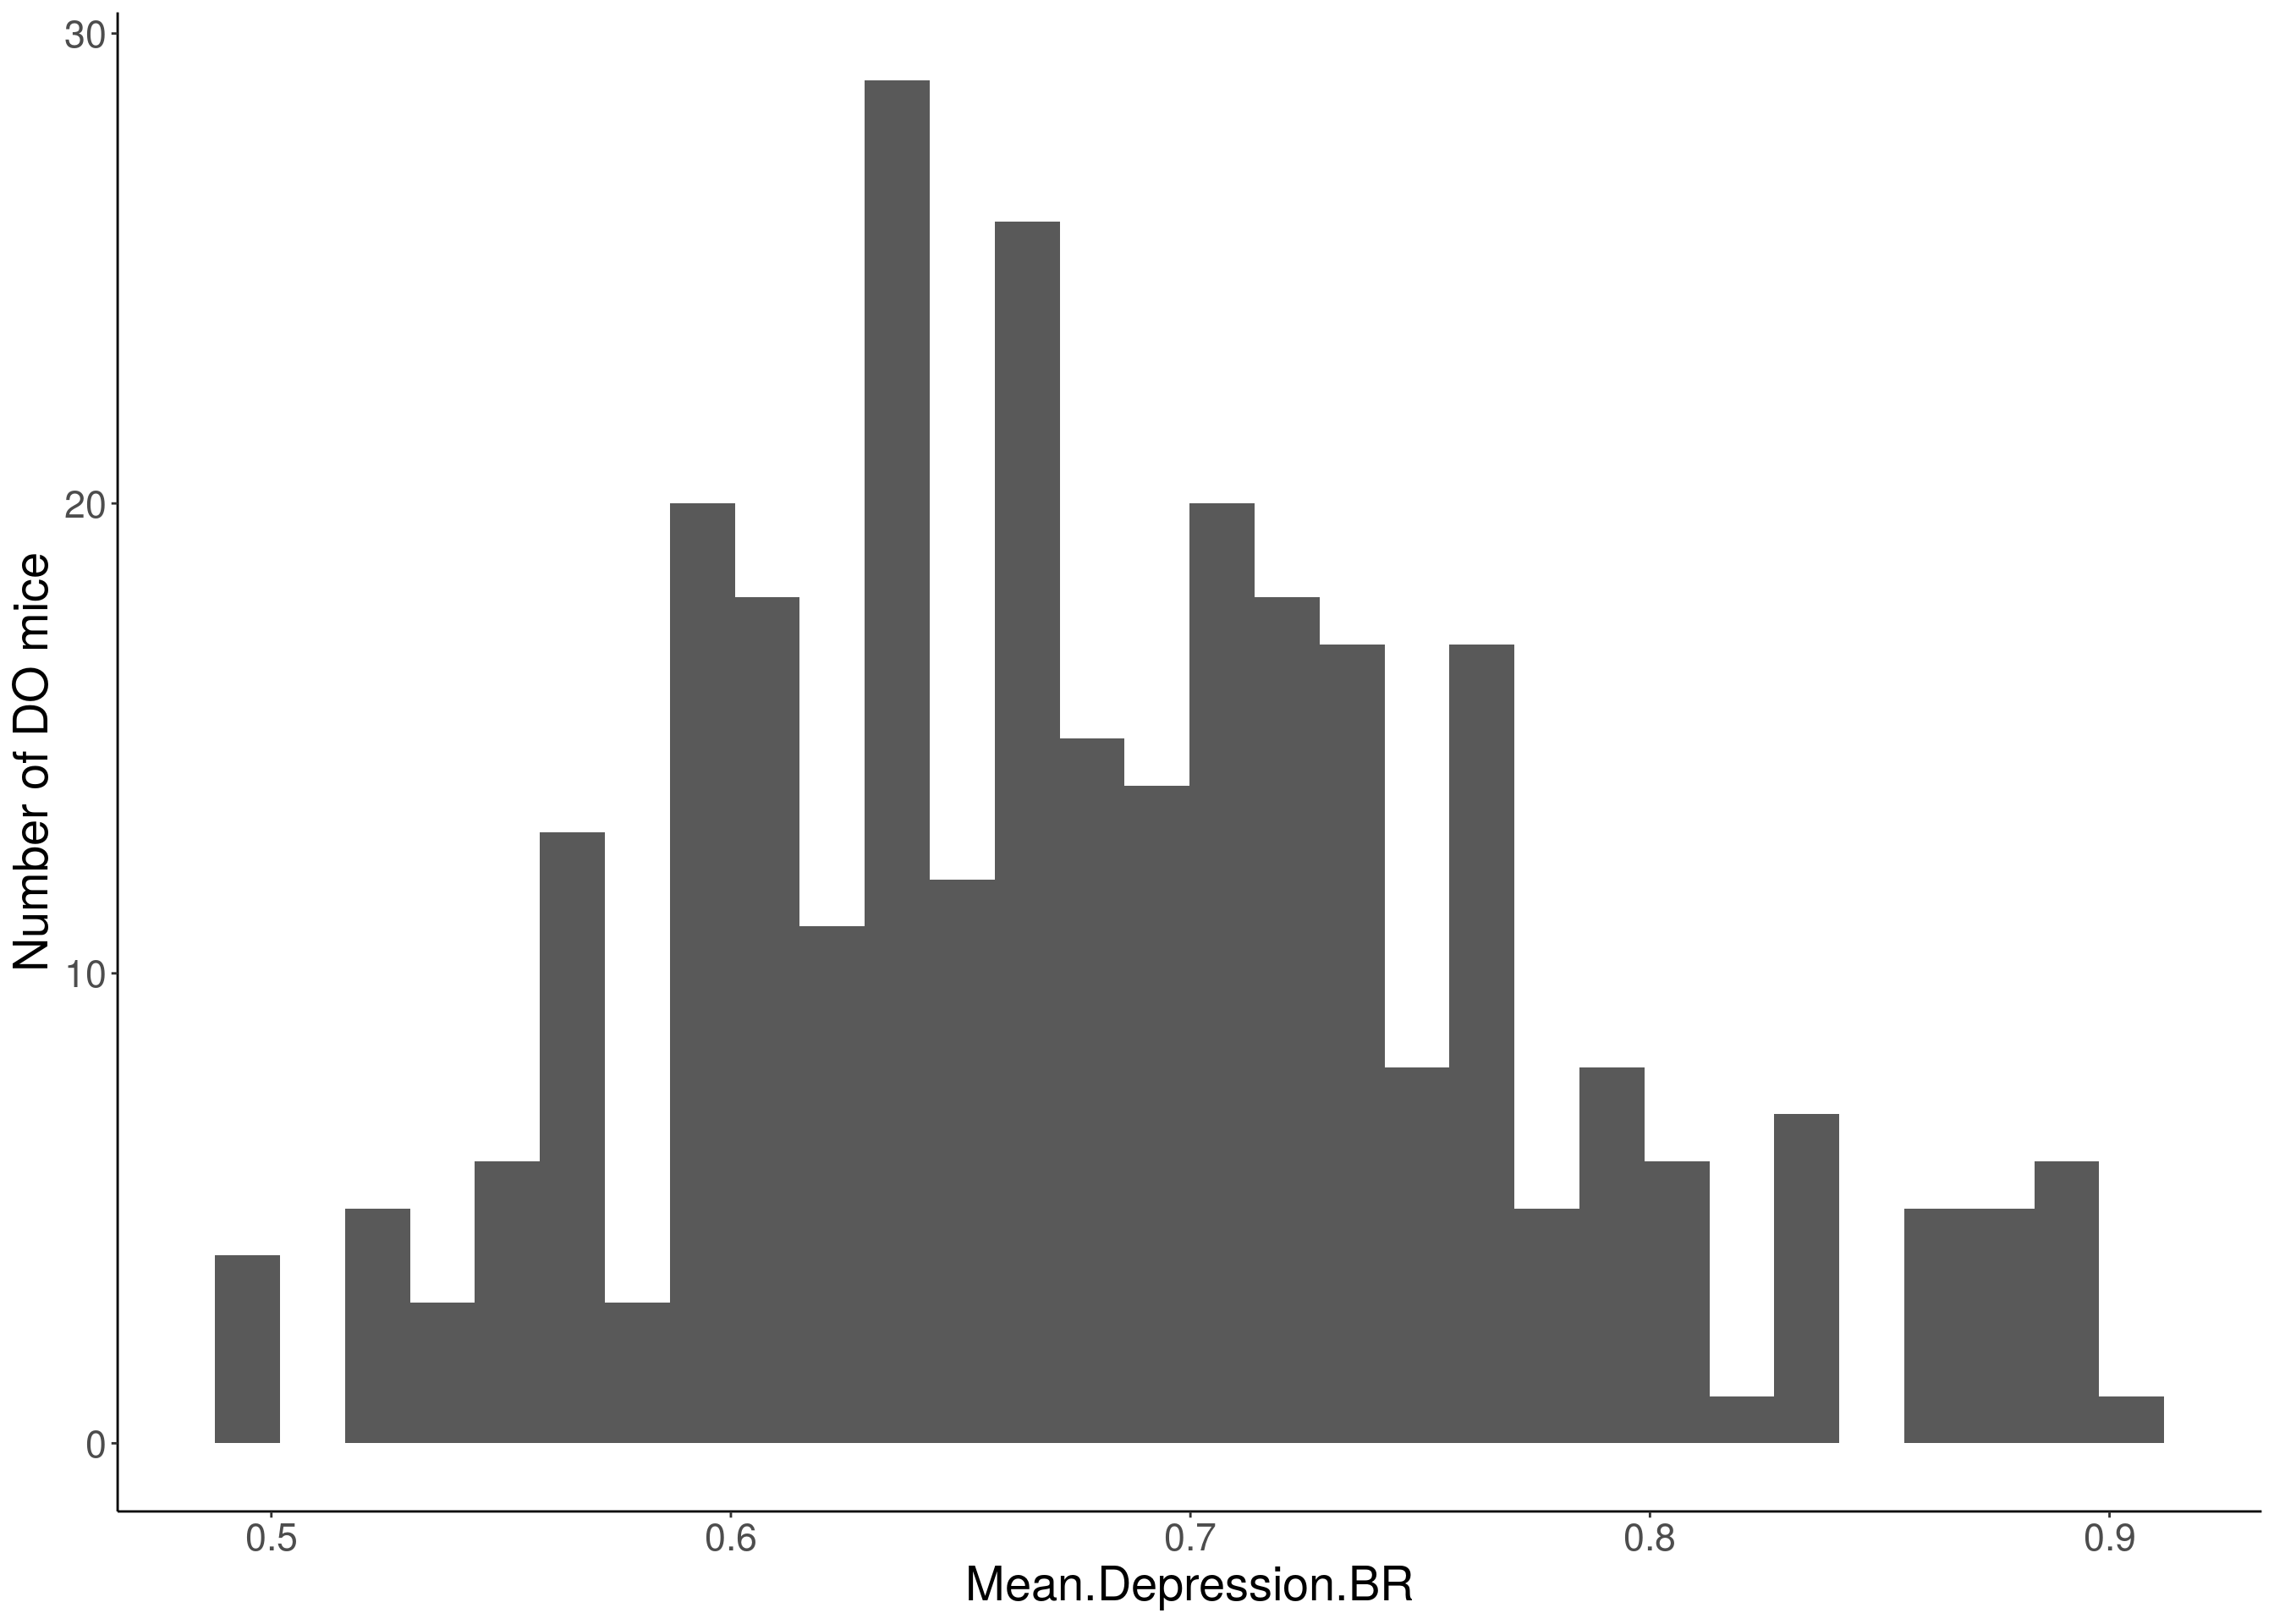
# Warning: Removed 484 rows containing non-finite values (stat_bin).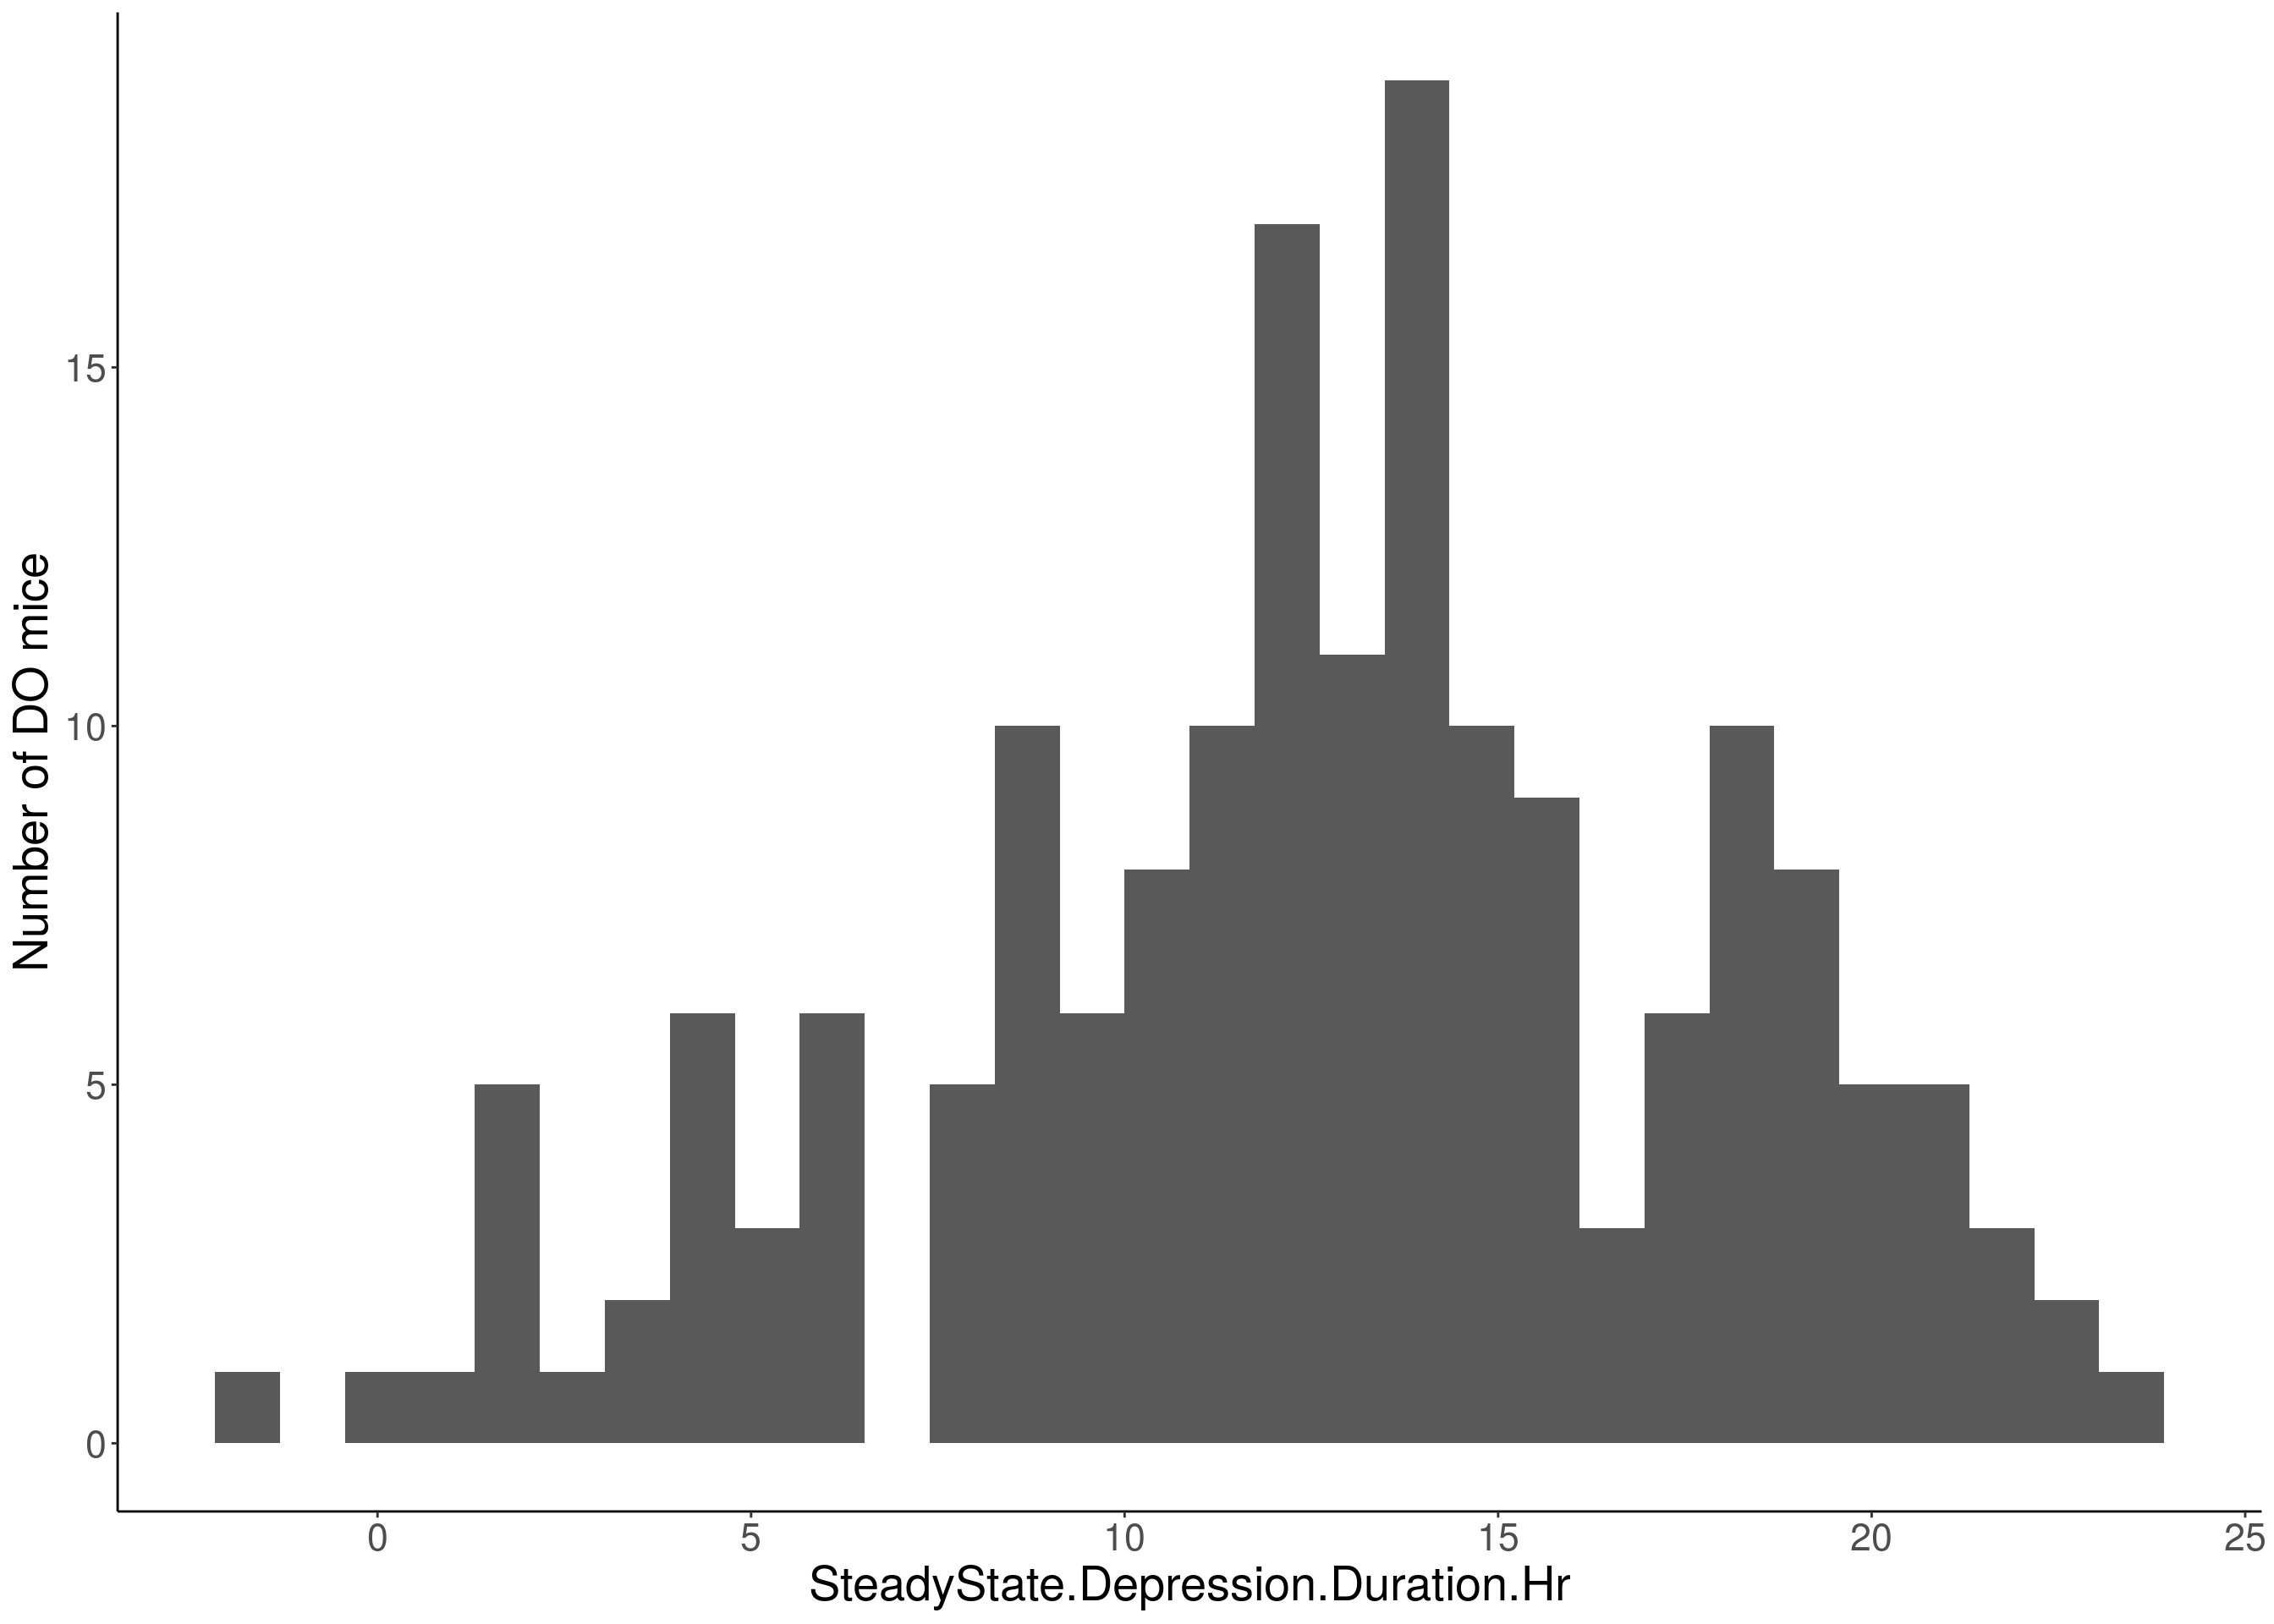
# Warning: Removed 509 rows containing non-finite values (stat_bin).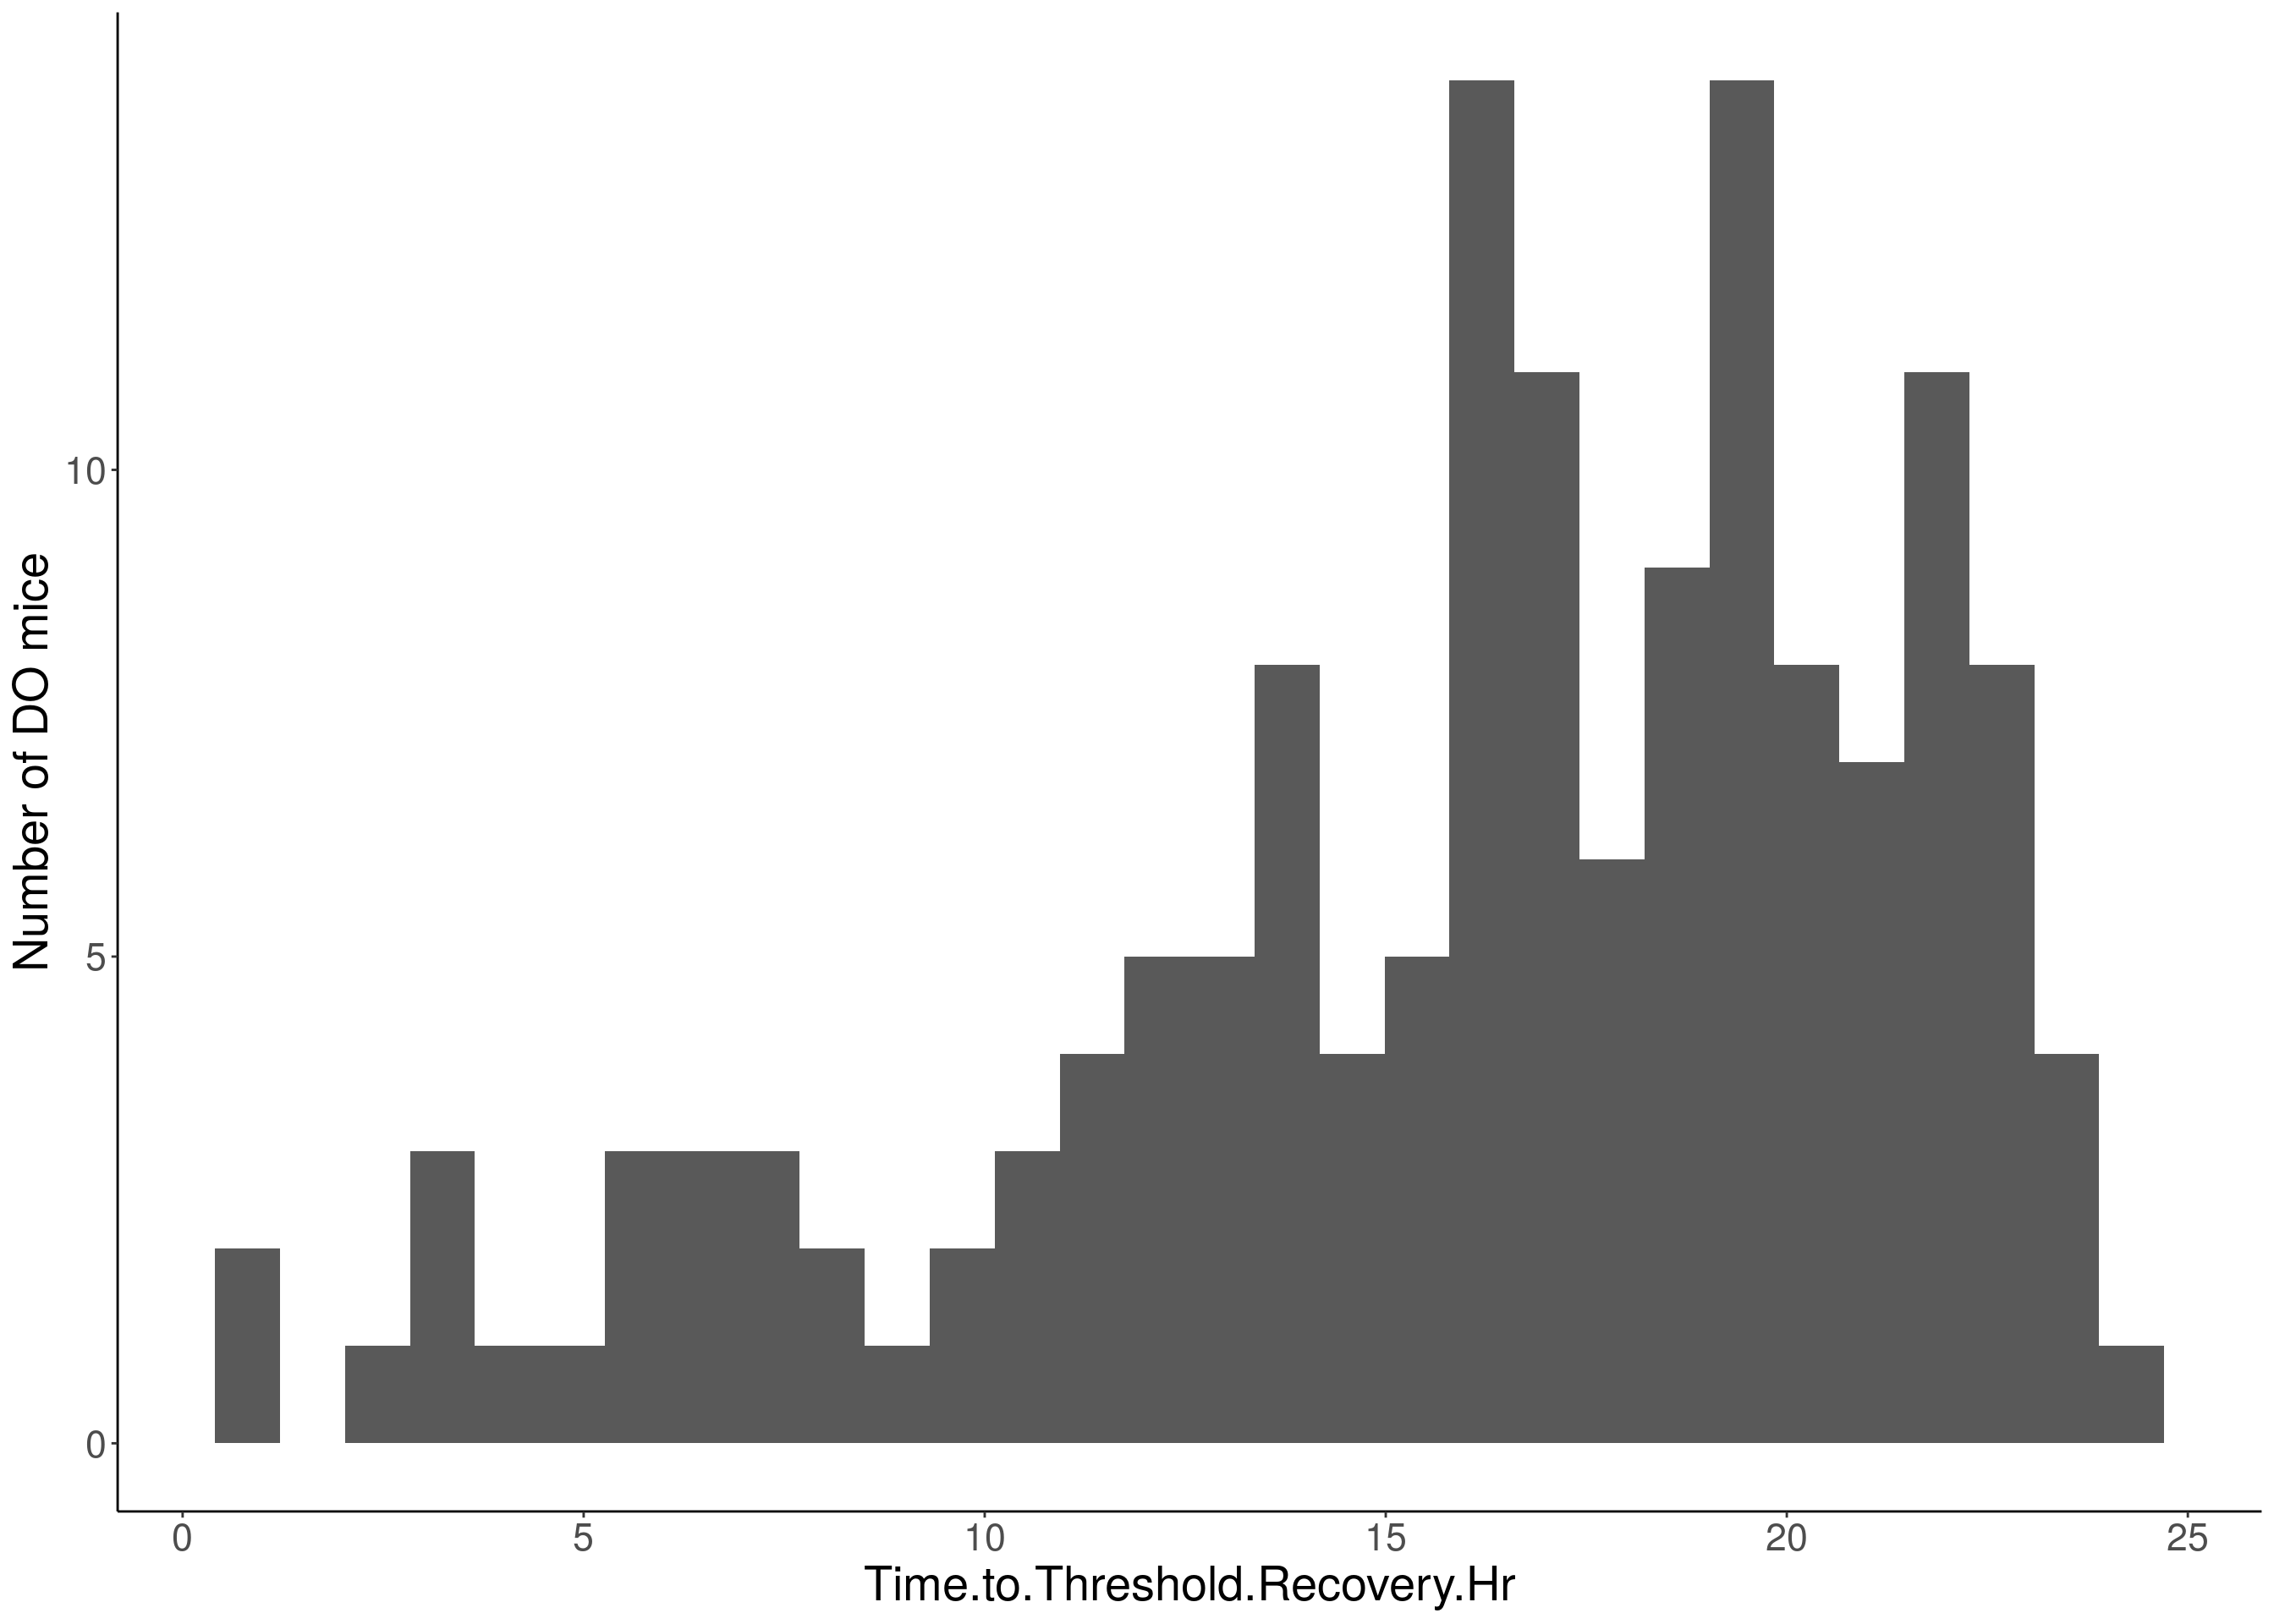
# Warning: Removed 504 rows containing non-finite values (stat_bin).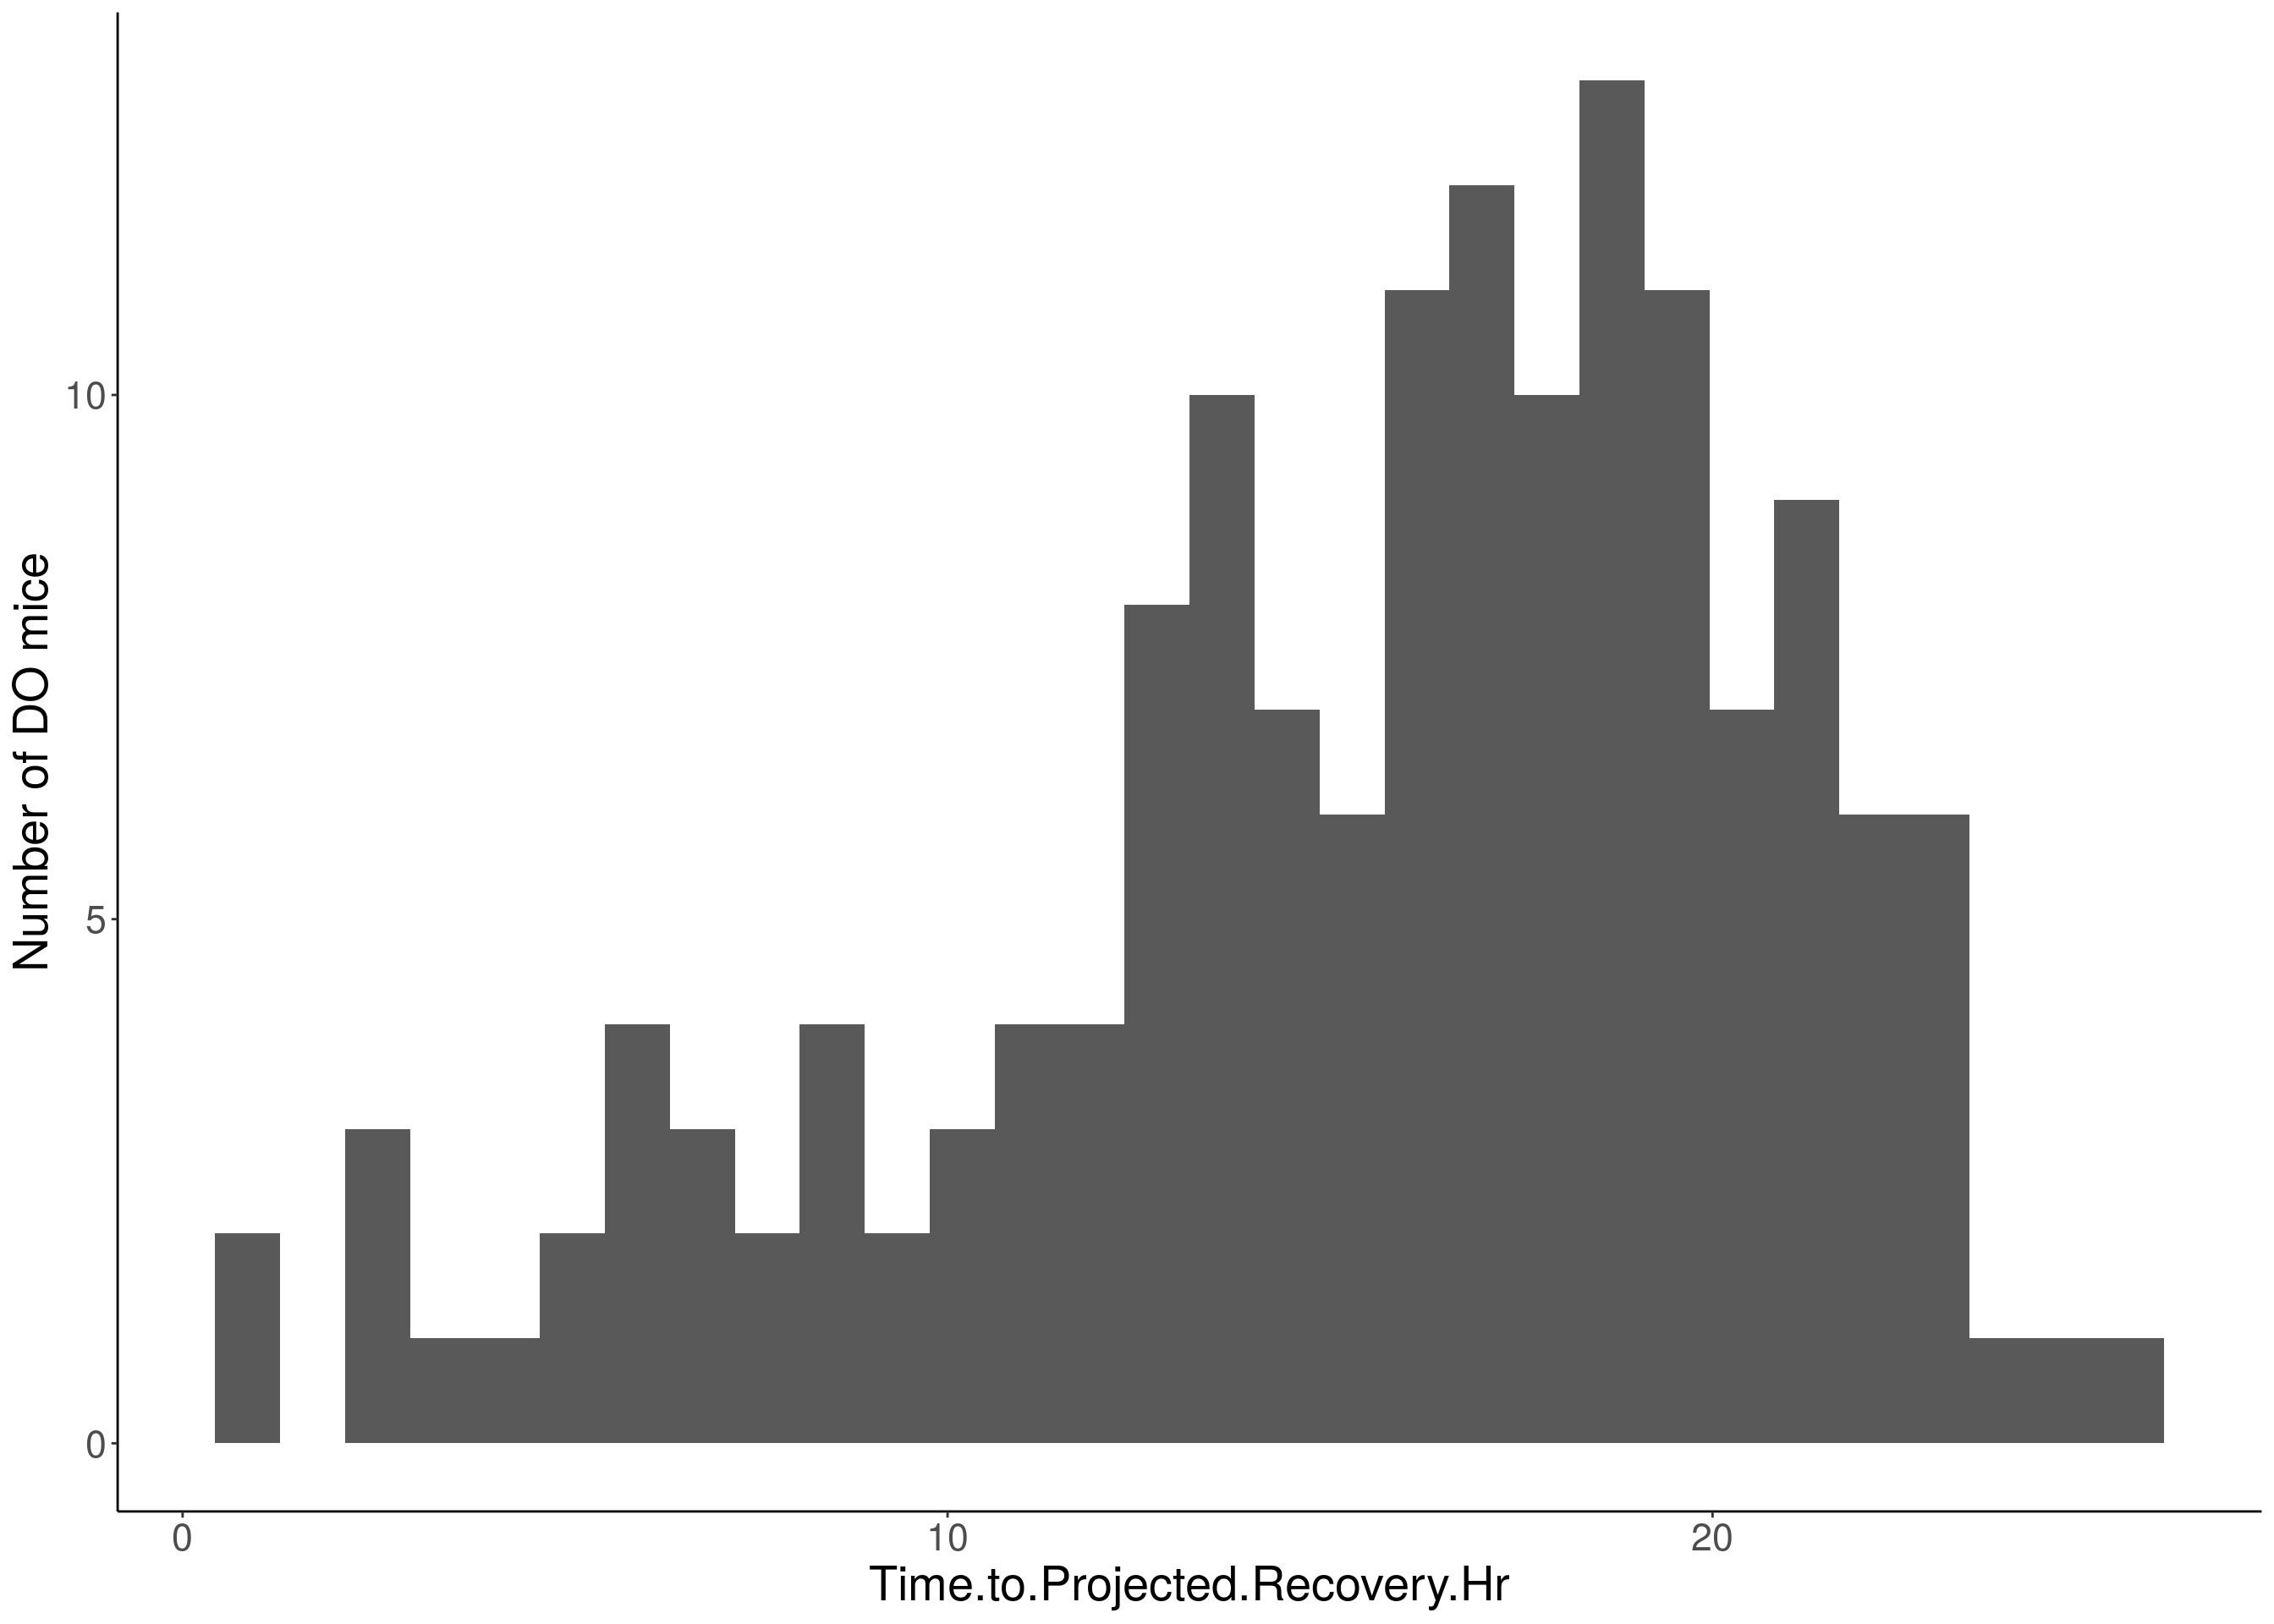
# Warning: Removed 484 rows containing non-finite values (stat_bin).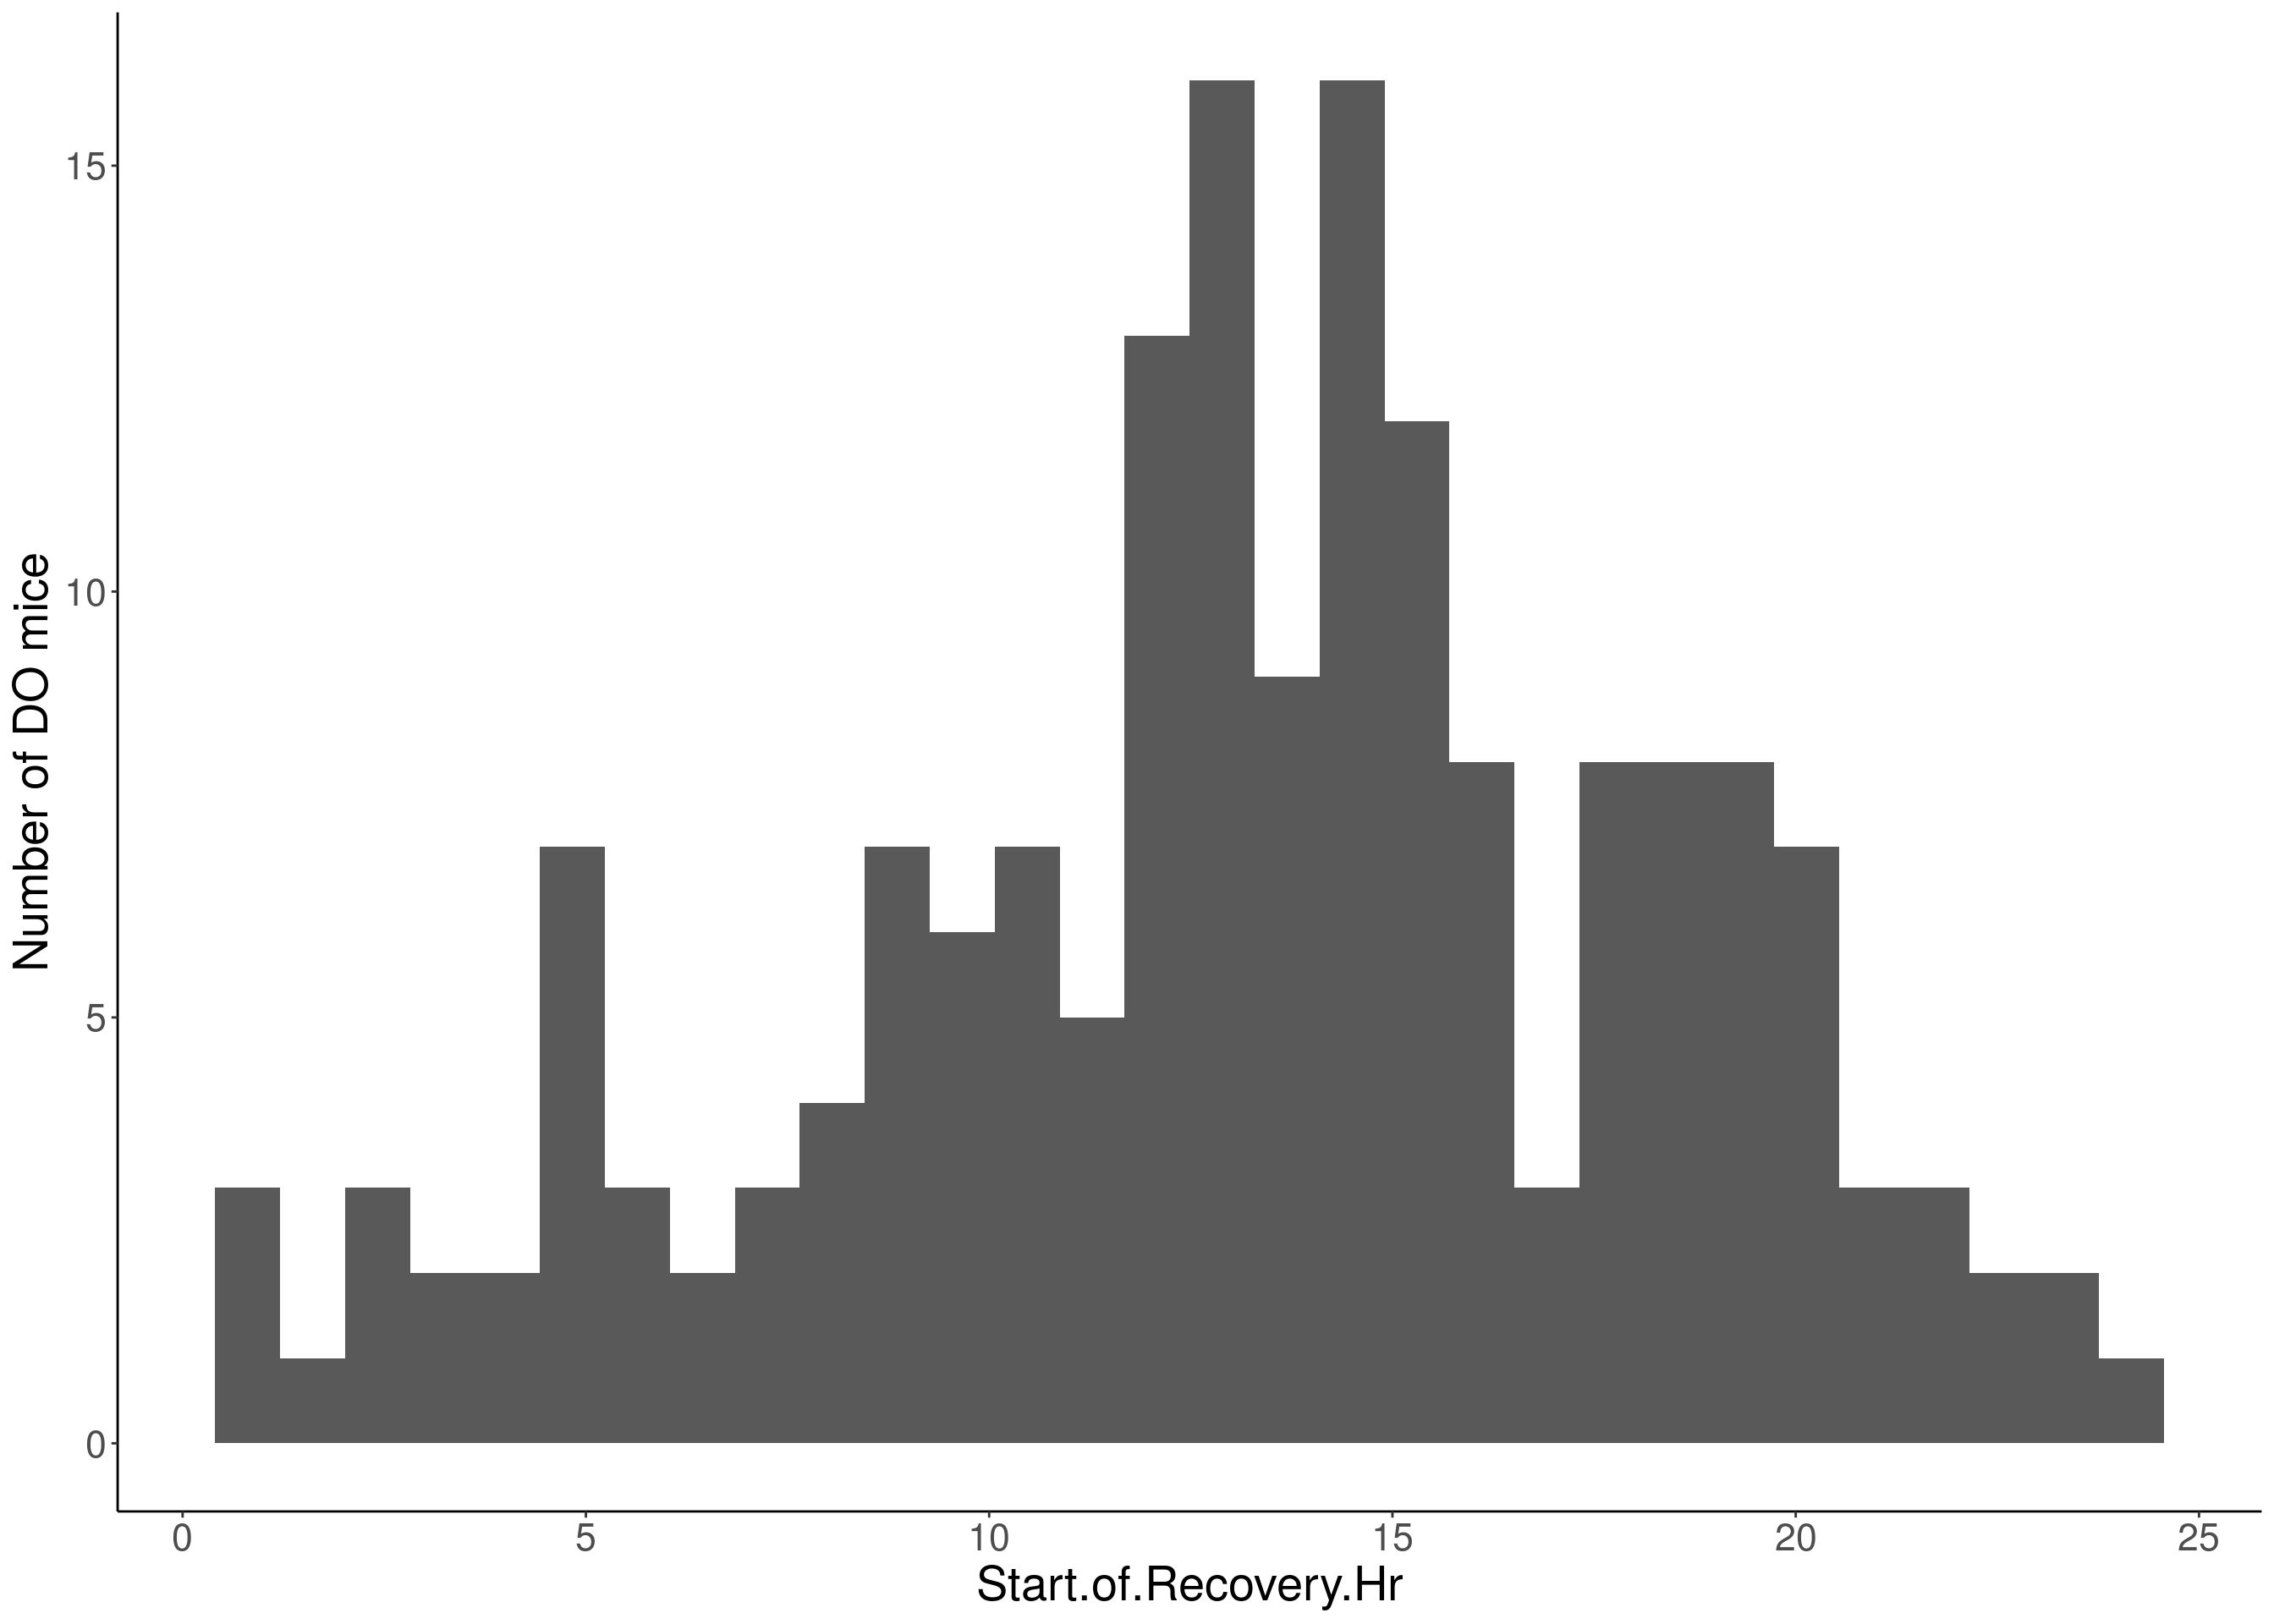
# Warning: Removed 469 rows containing non-finite values (stat_bin).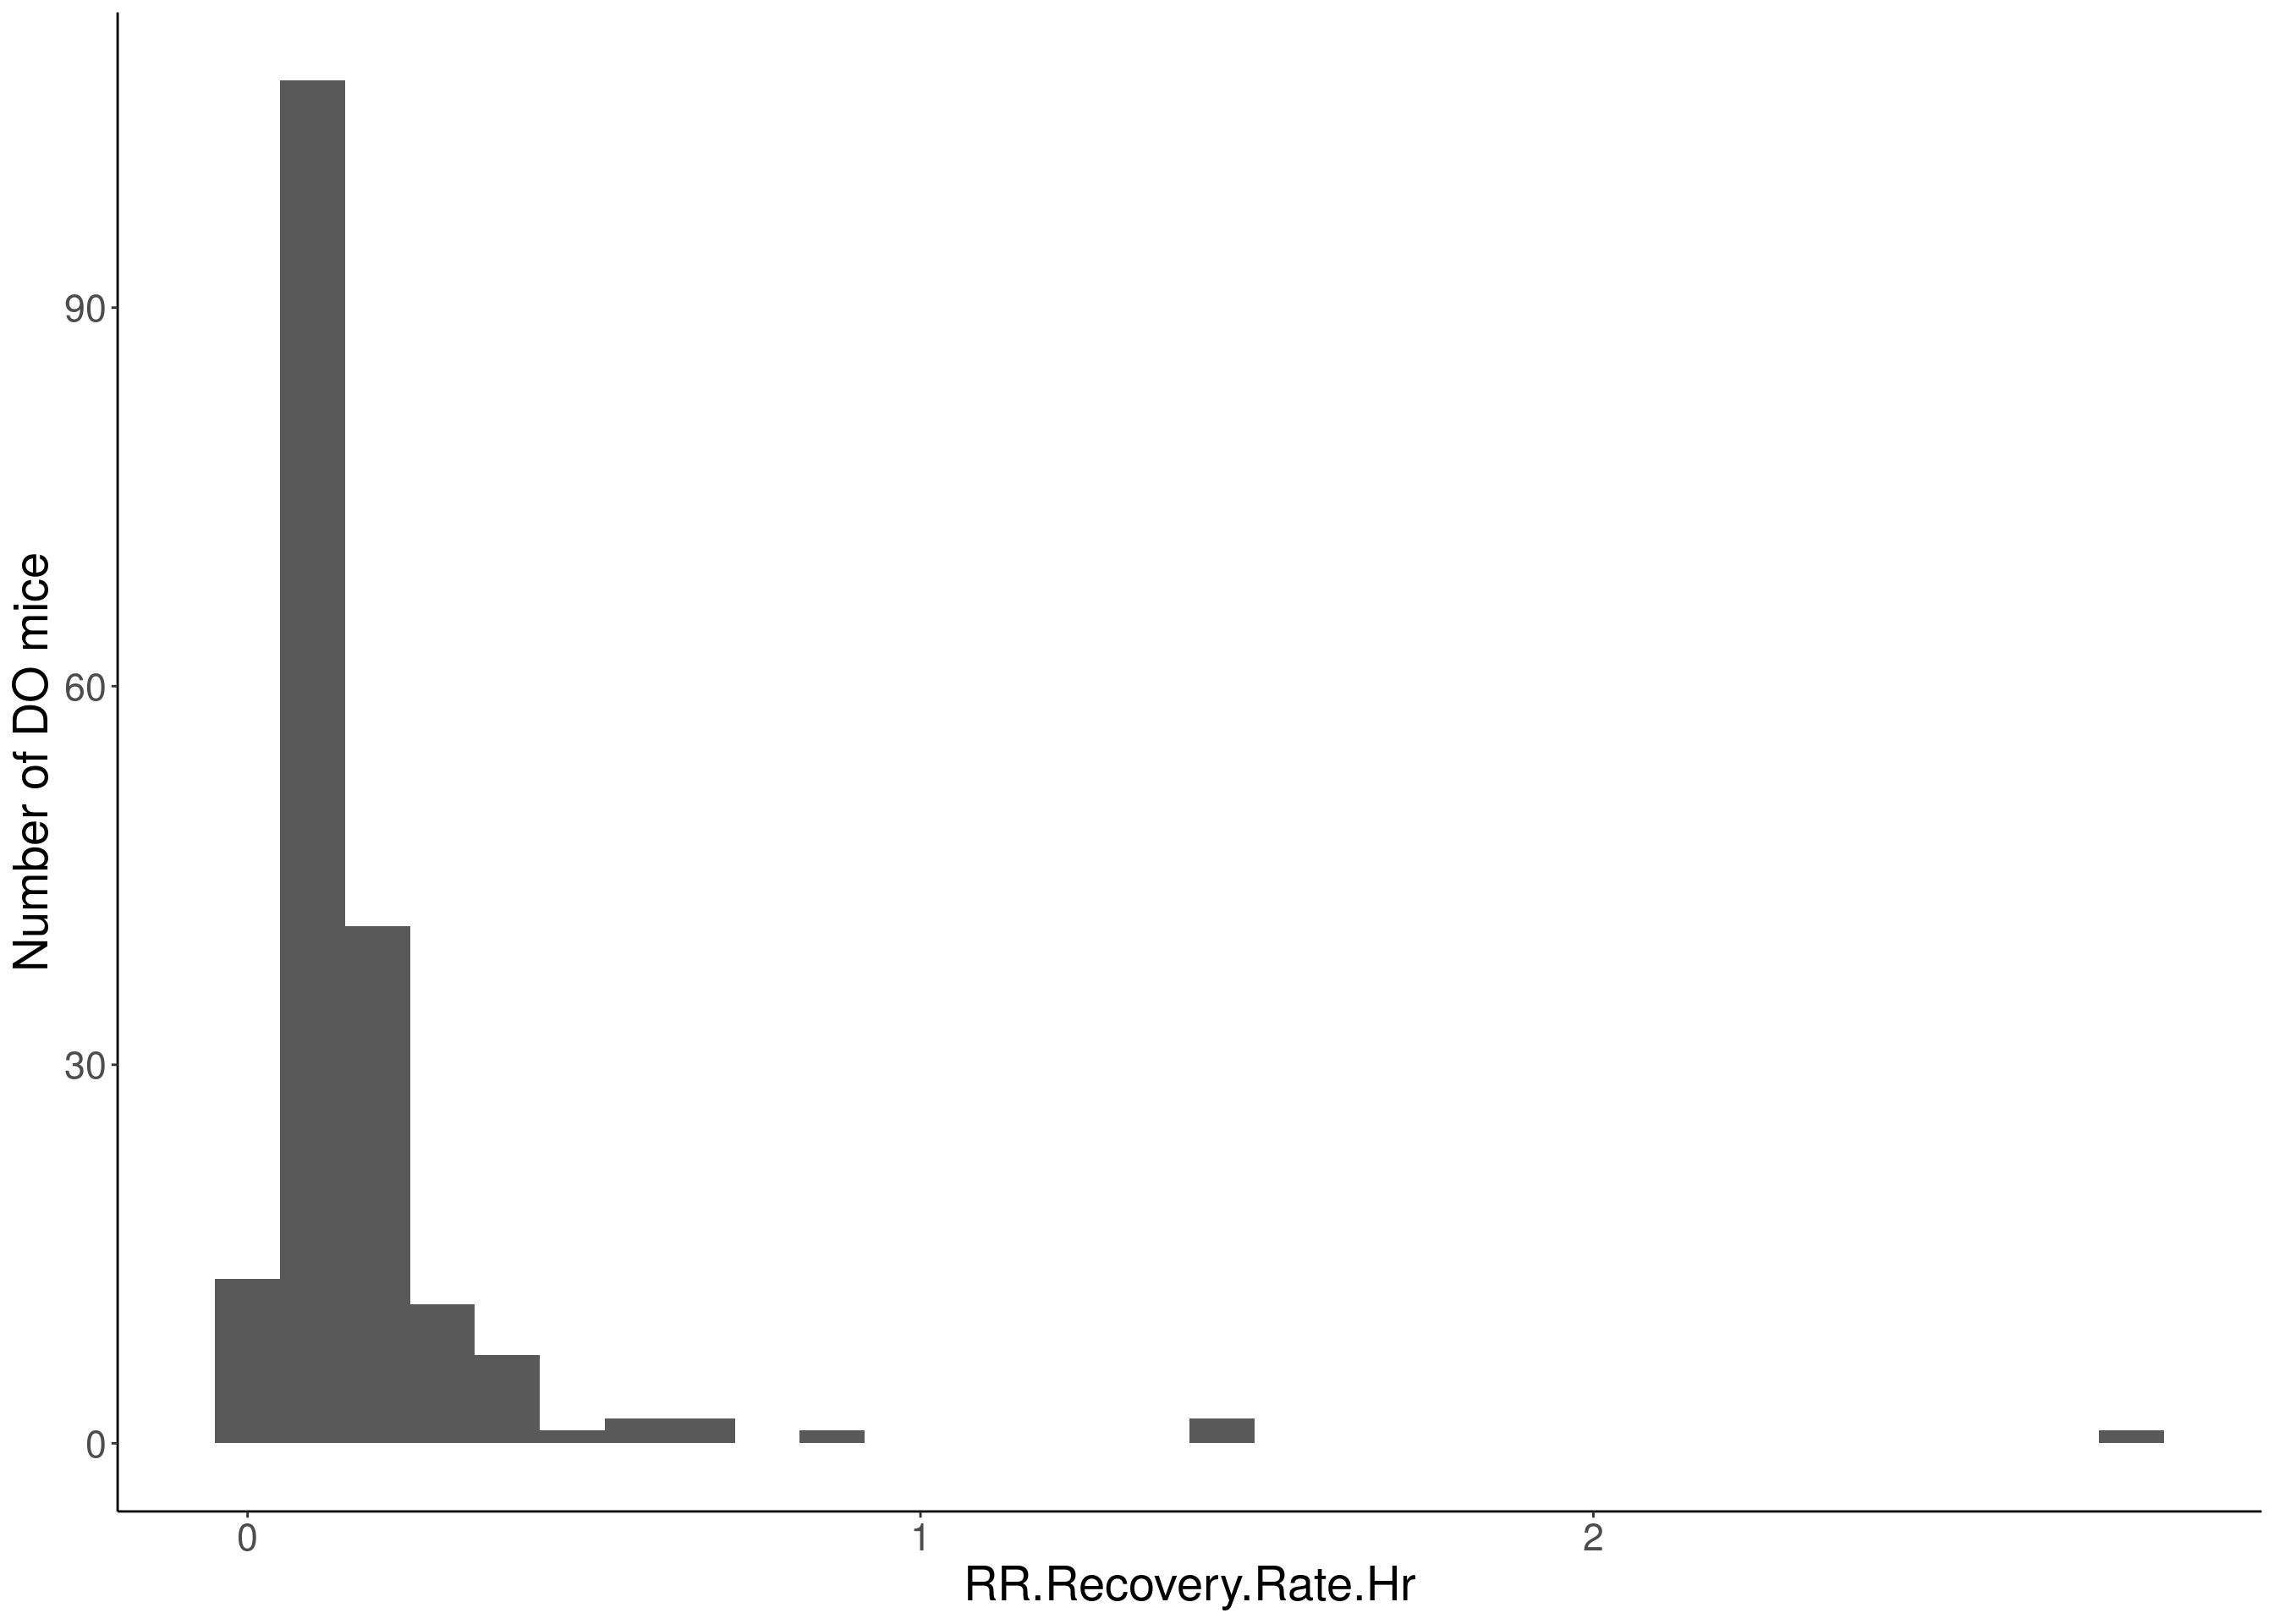
# Warning: Removed 307 rows containing non-finite values (stat_bin).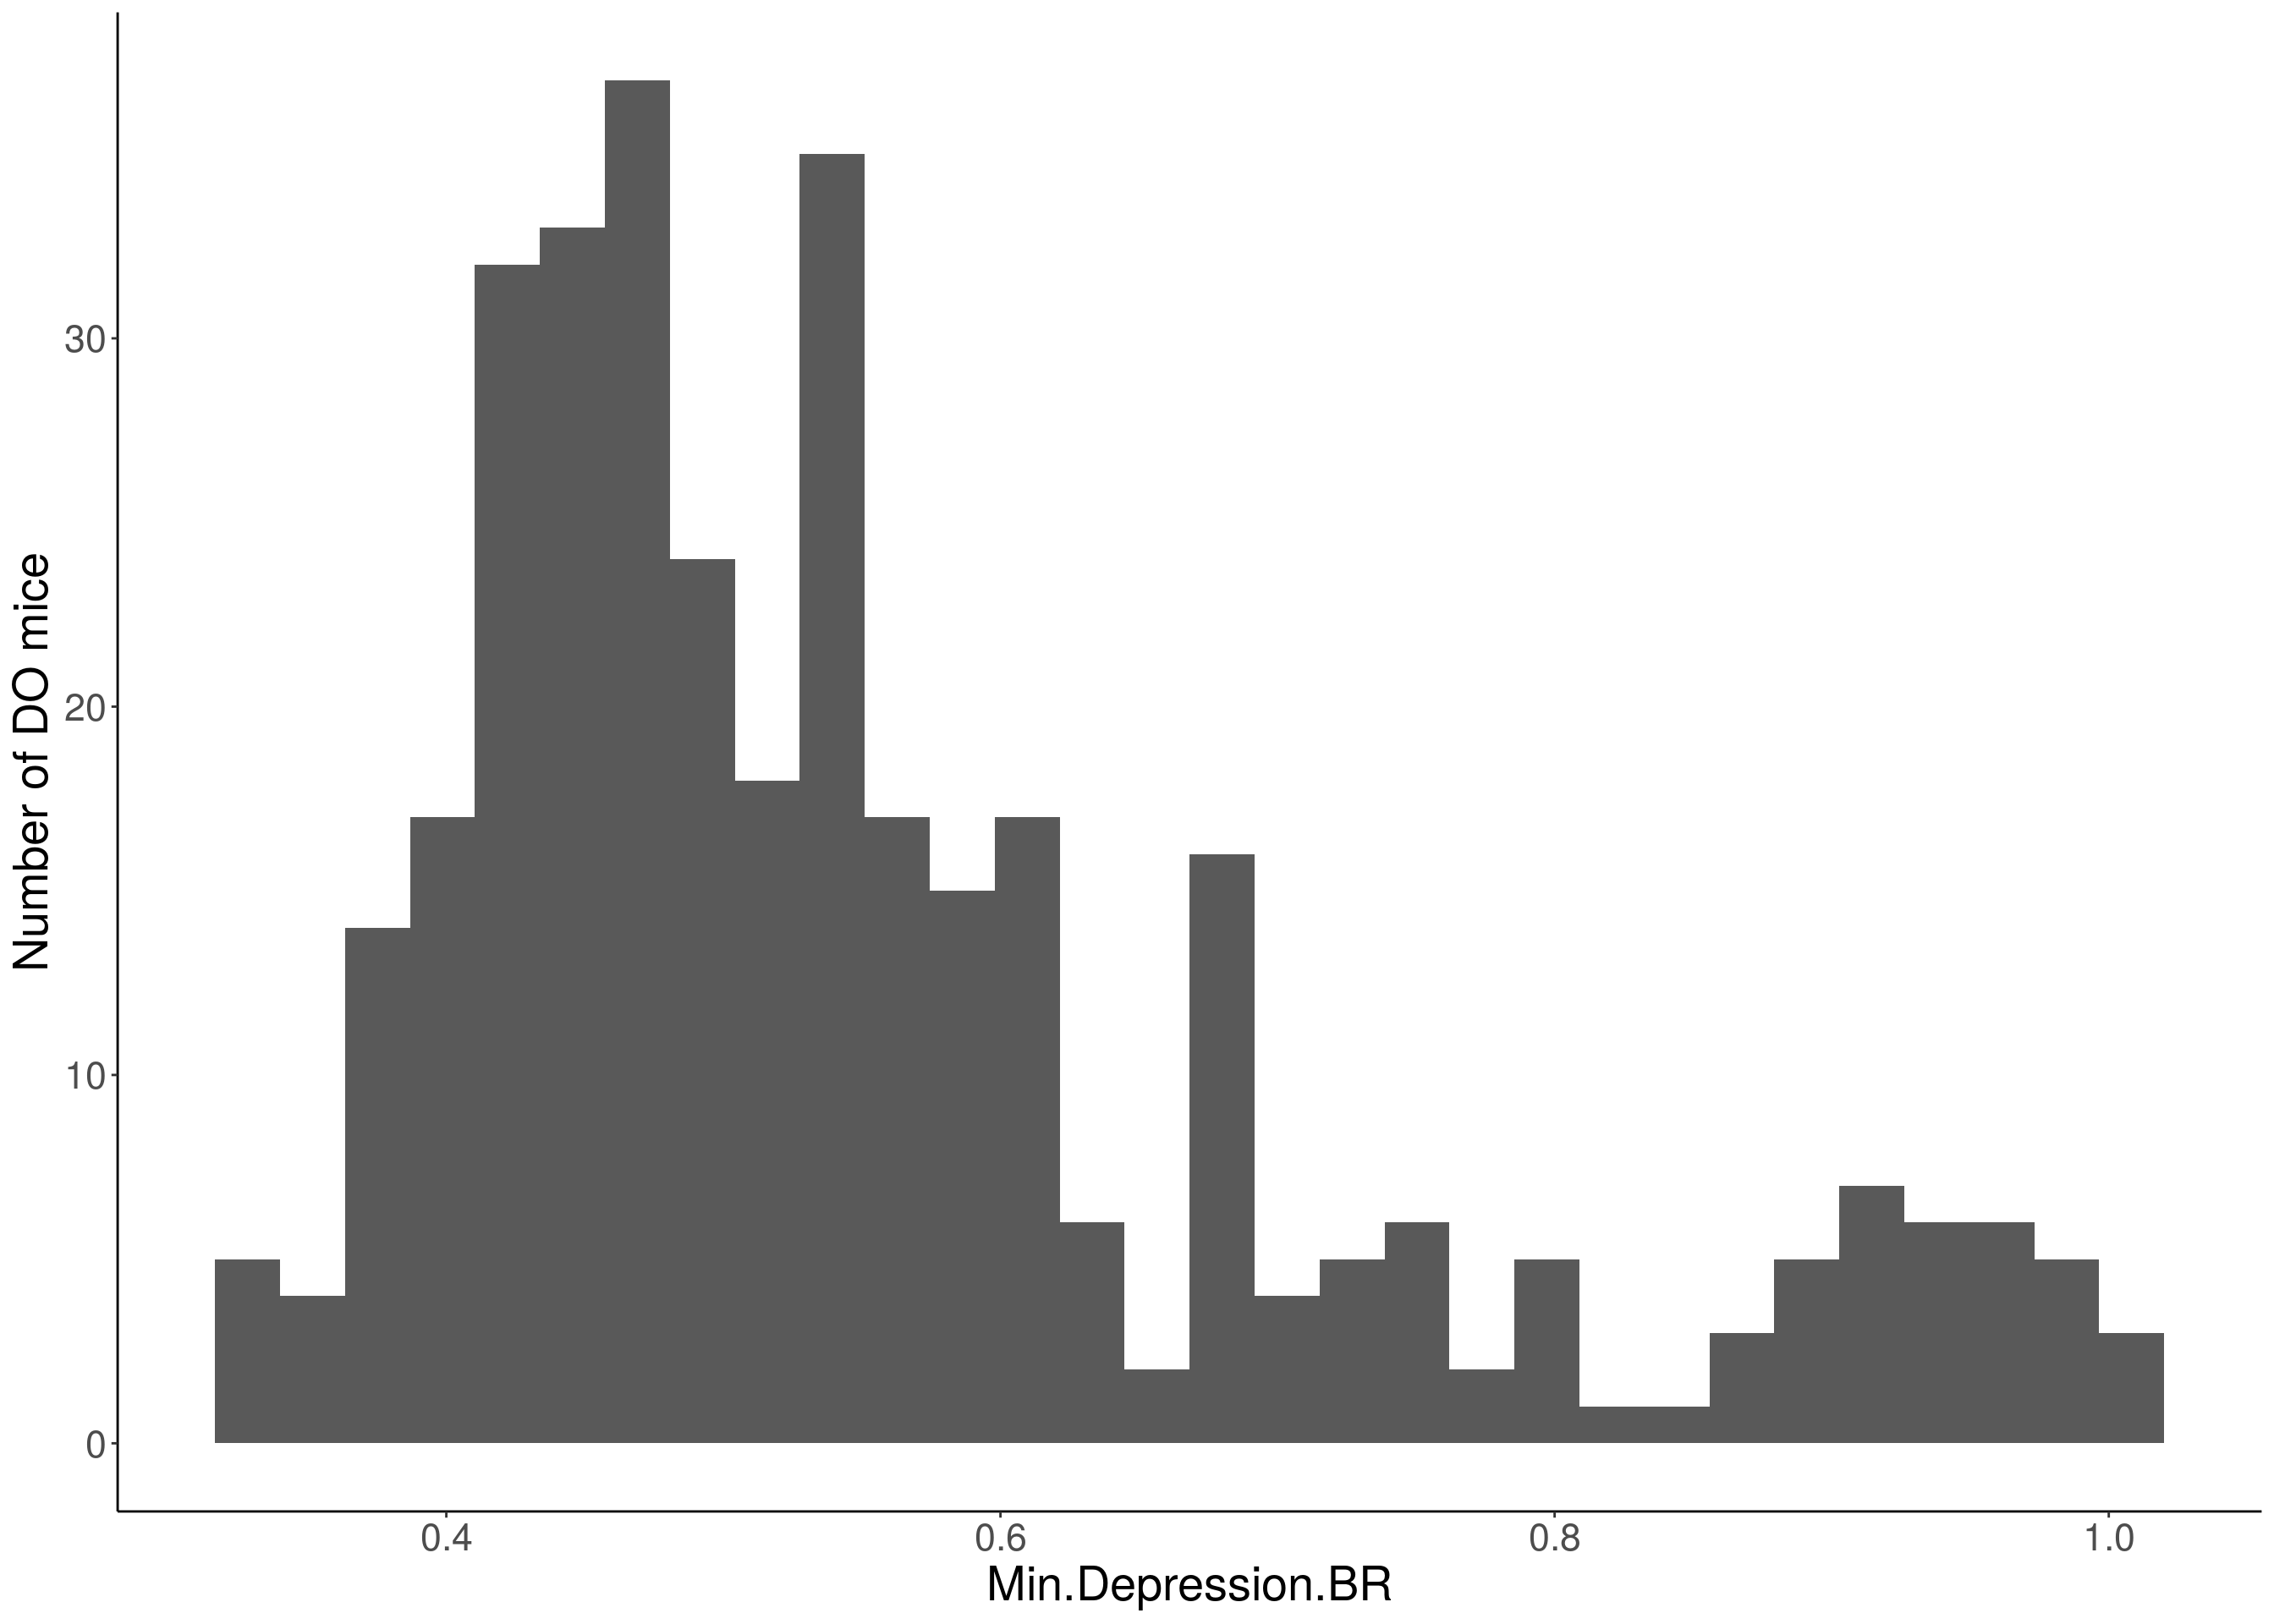
# Warning: Removed 541 rows containing non-finite values (stat_bin).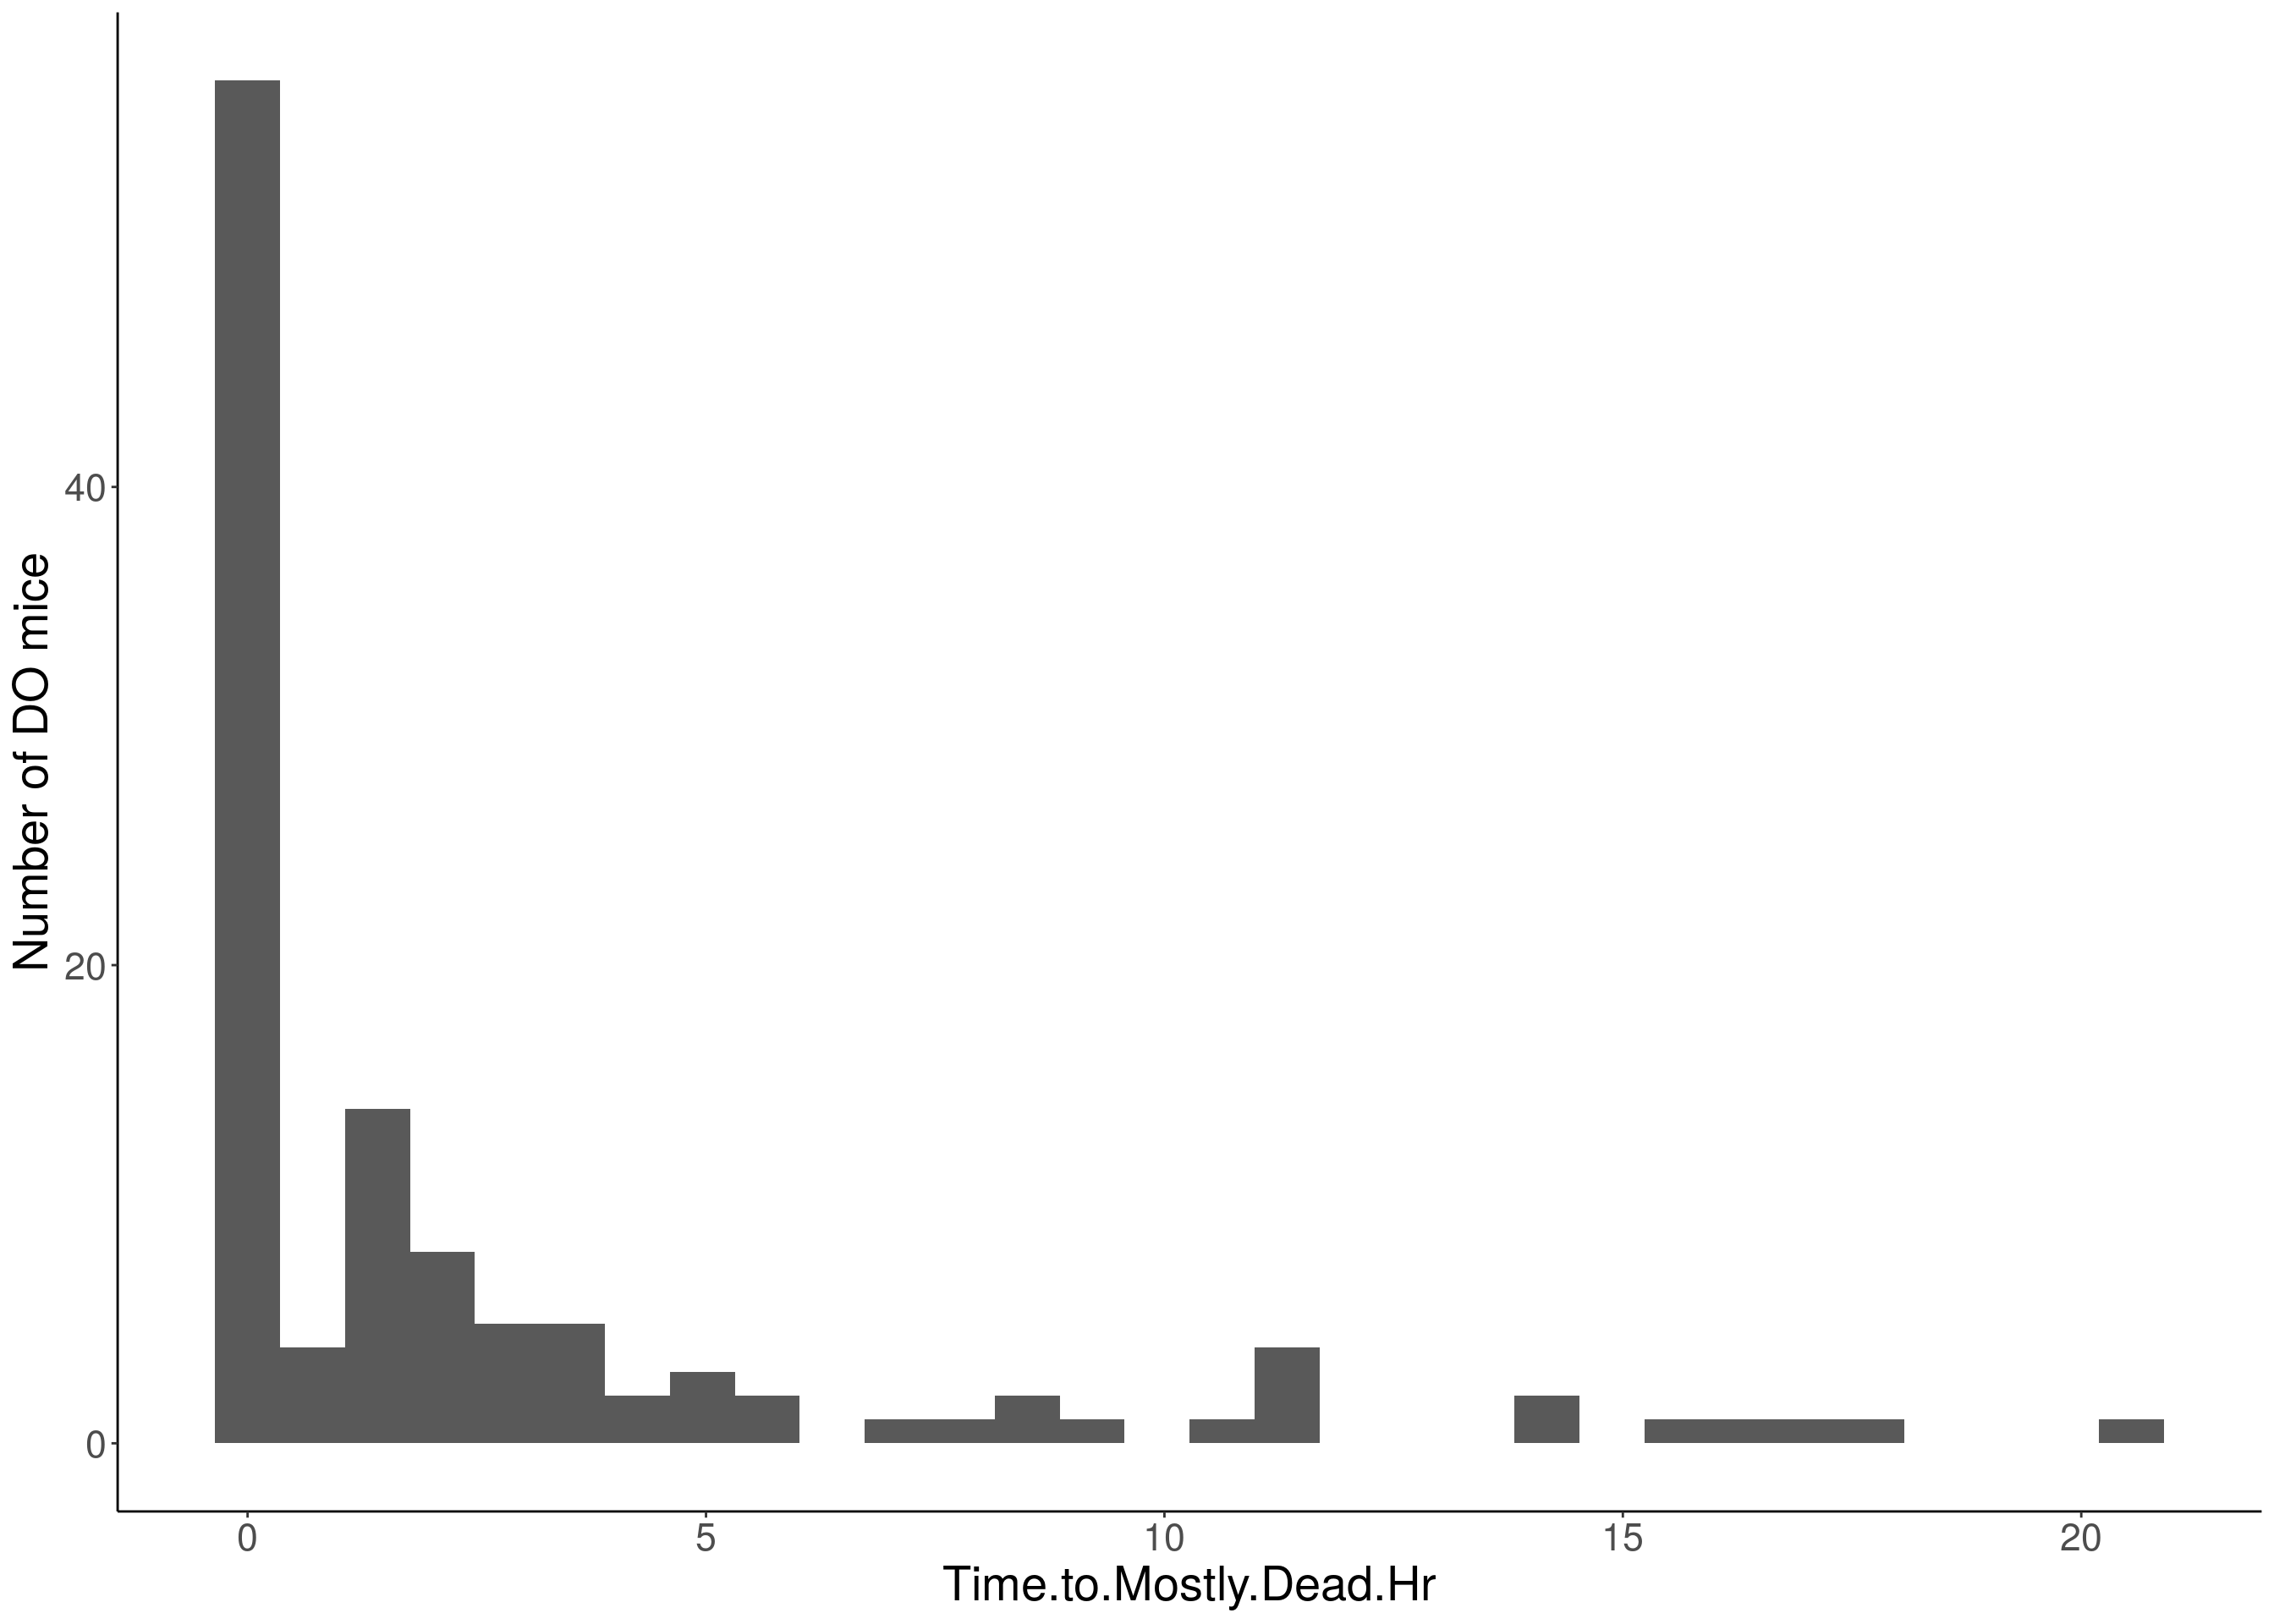
# Warning: Removed 570 rows containing non-finite values (stat_bin).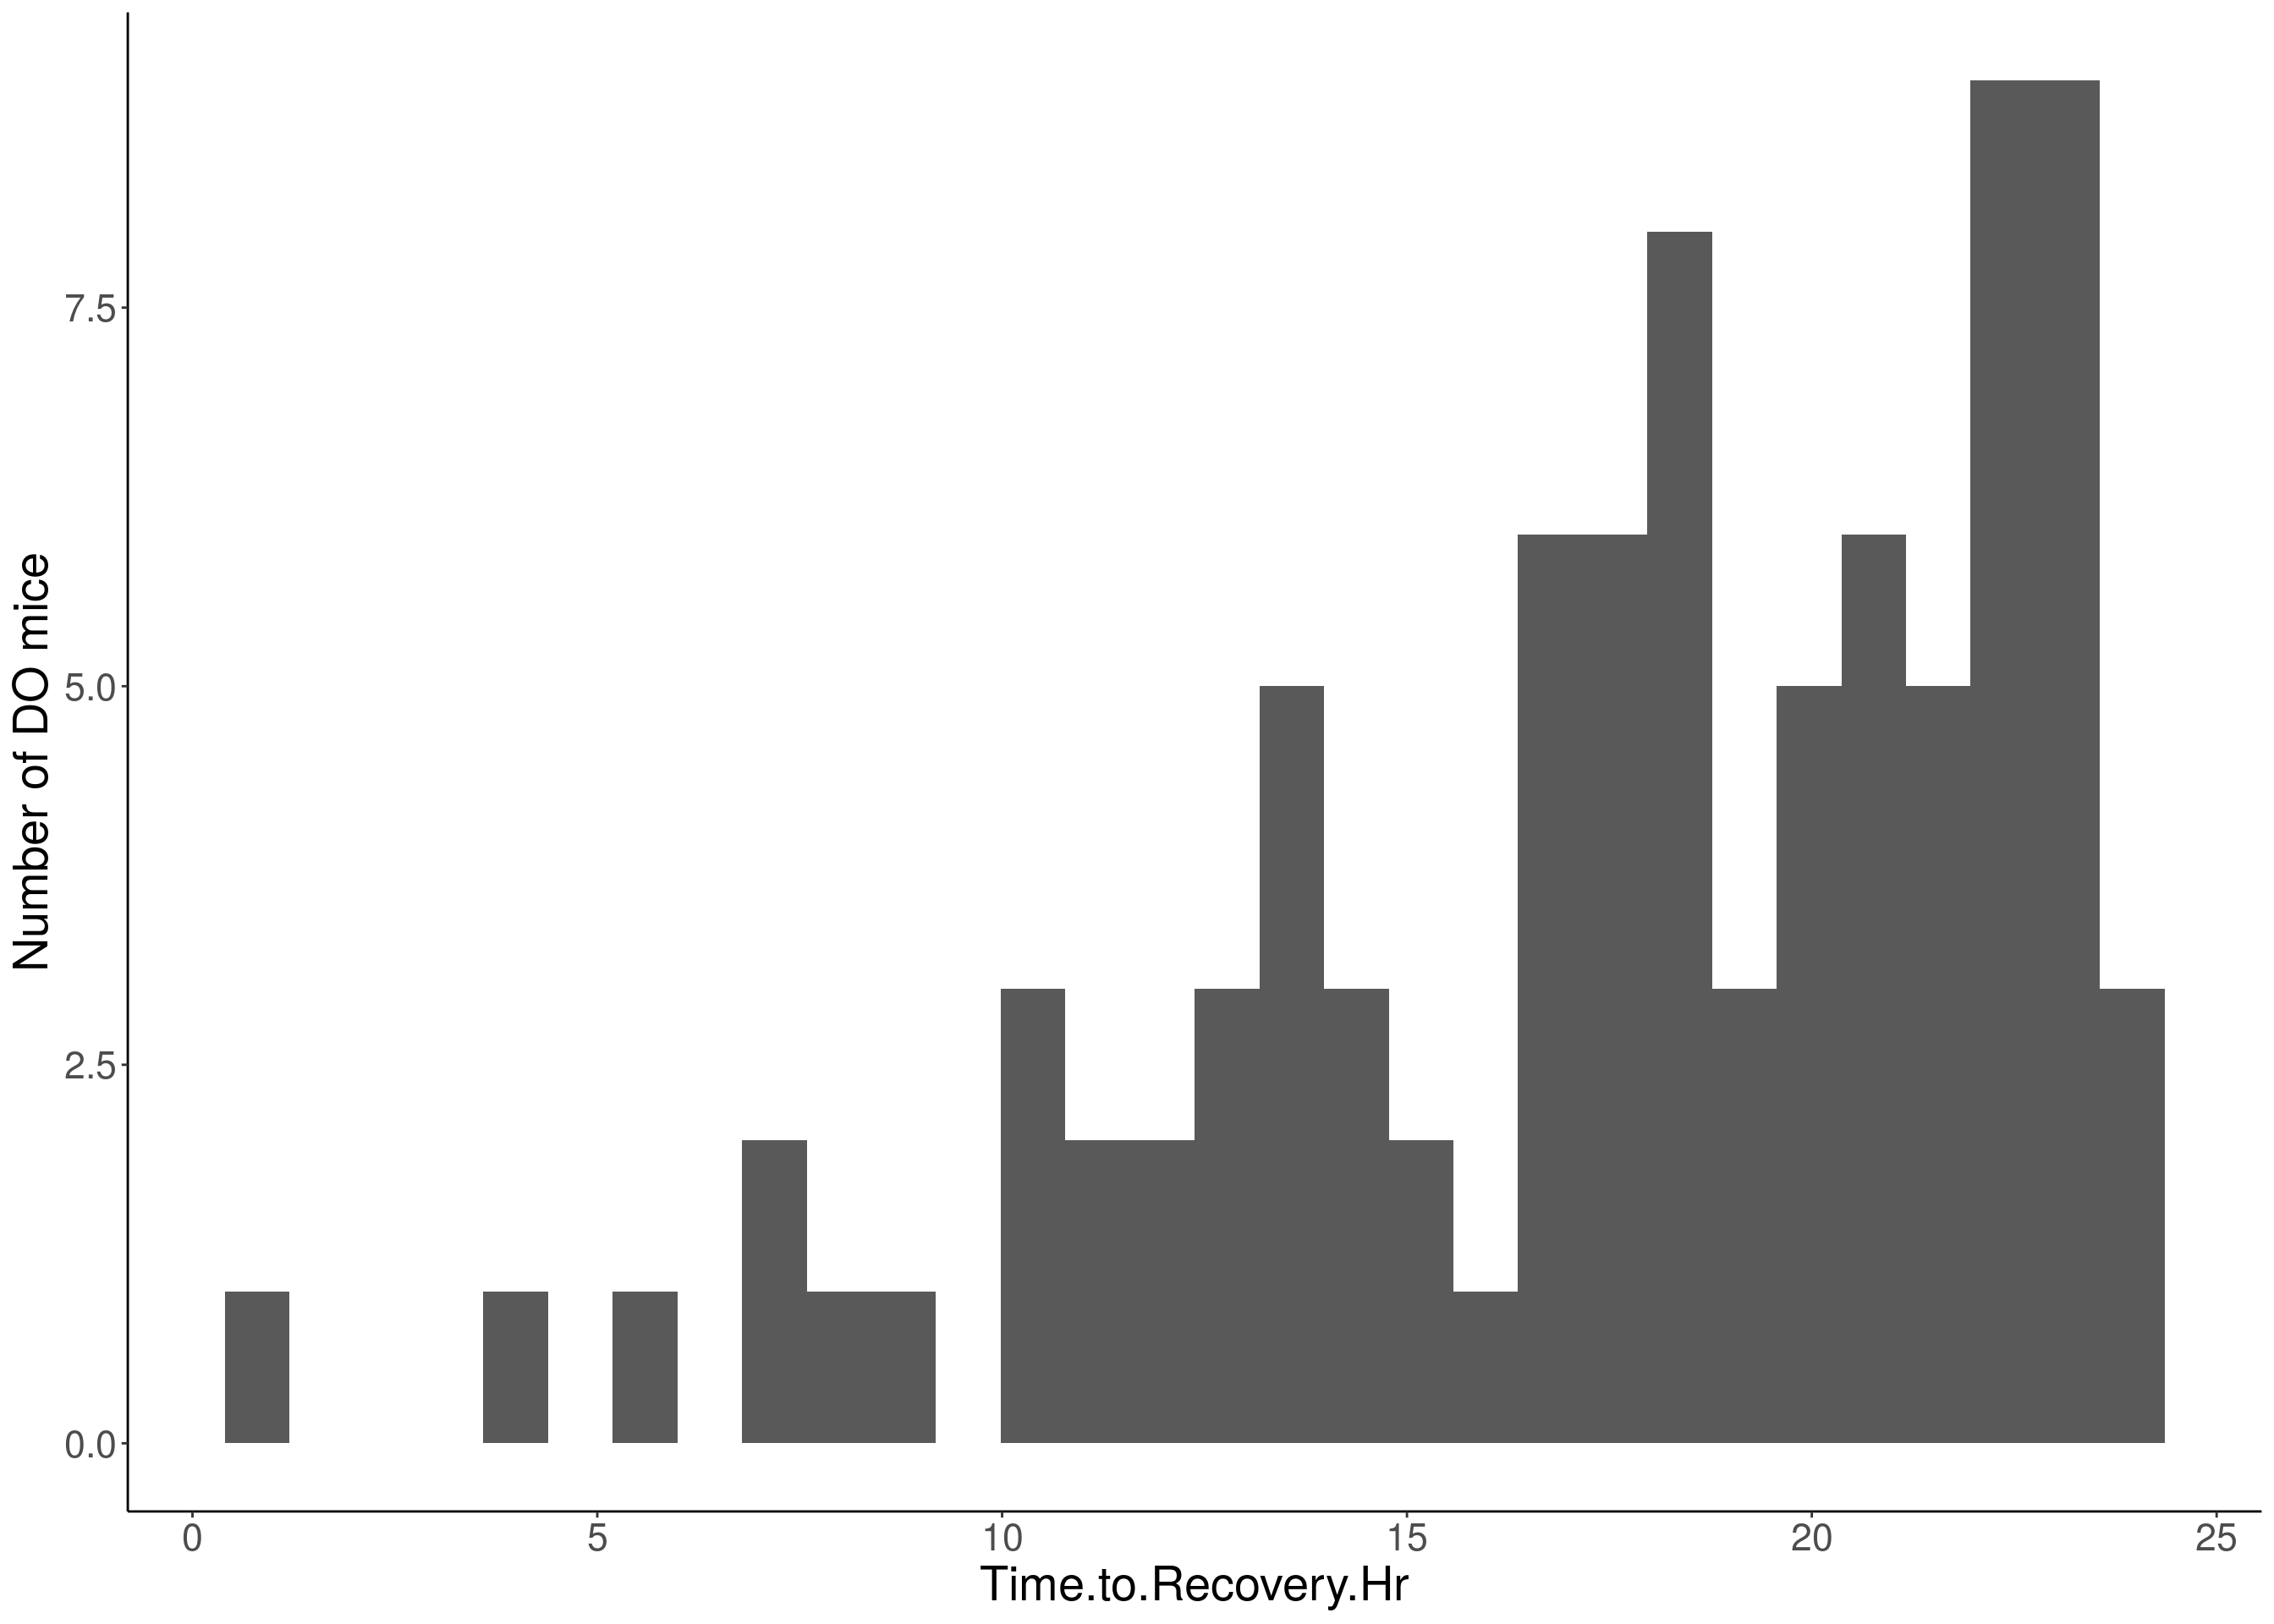
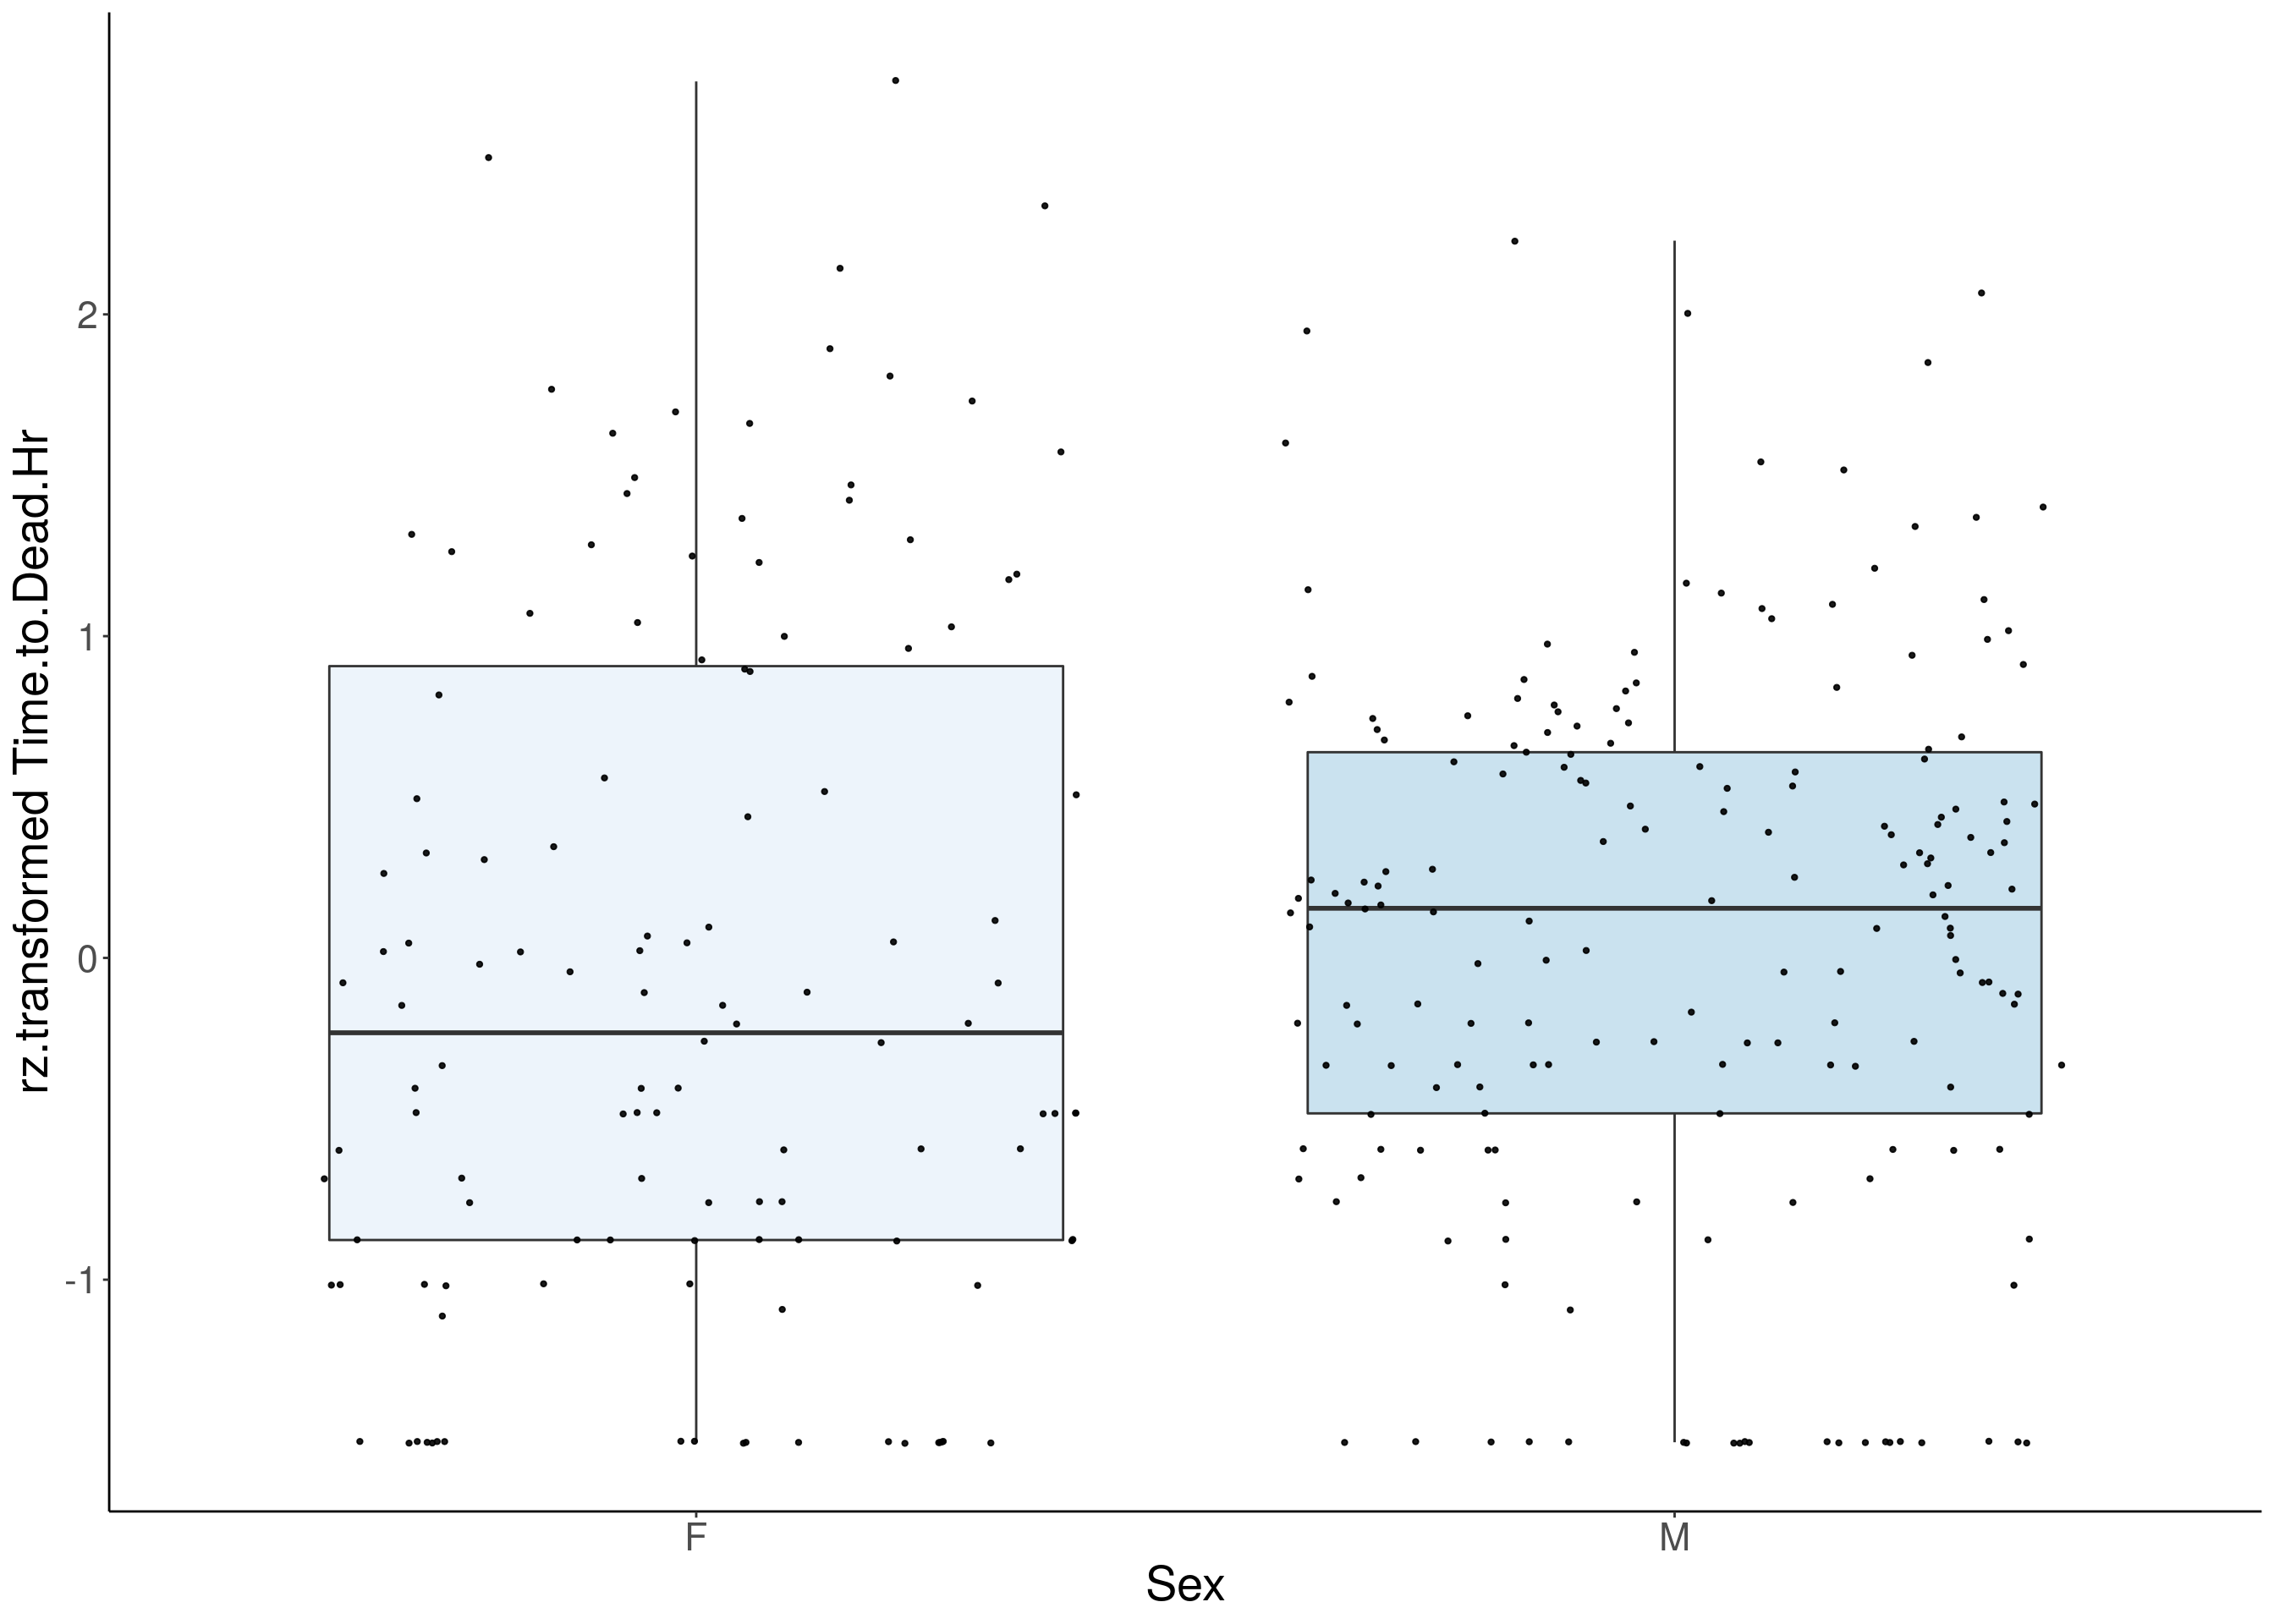
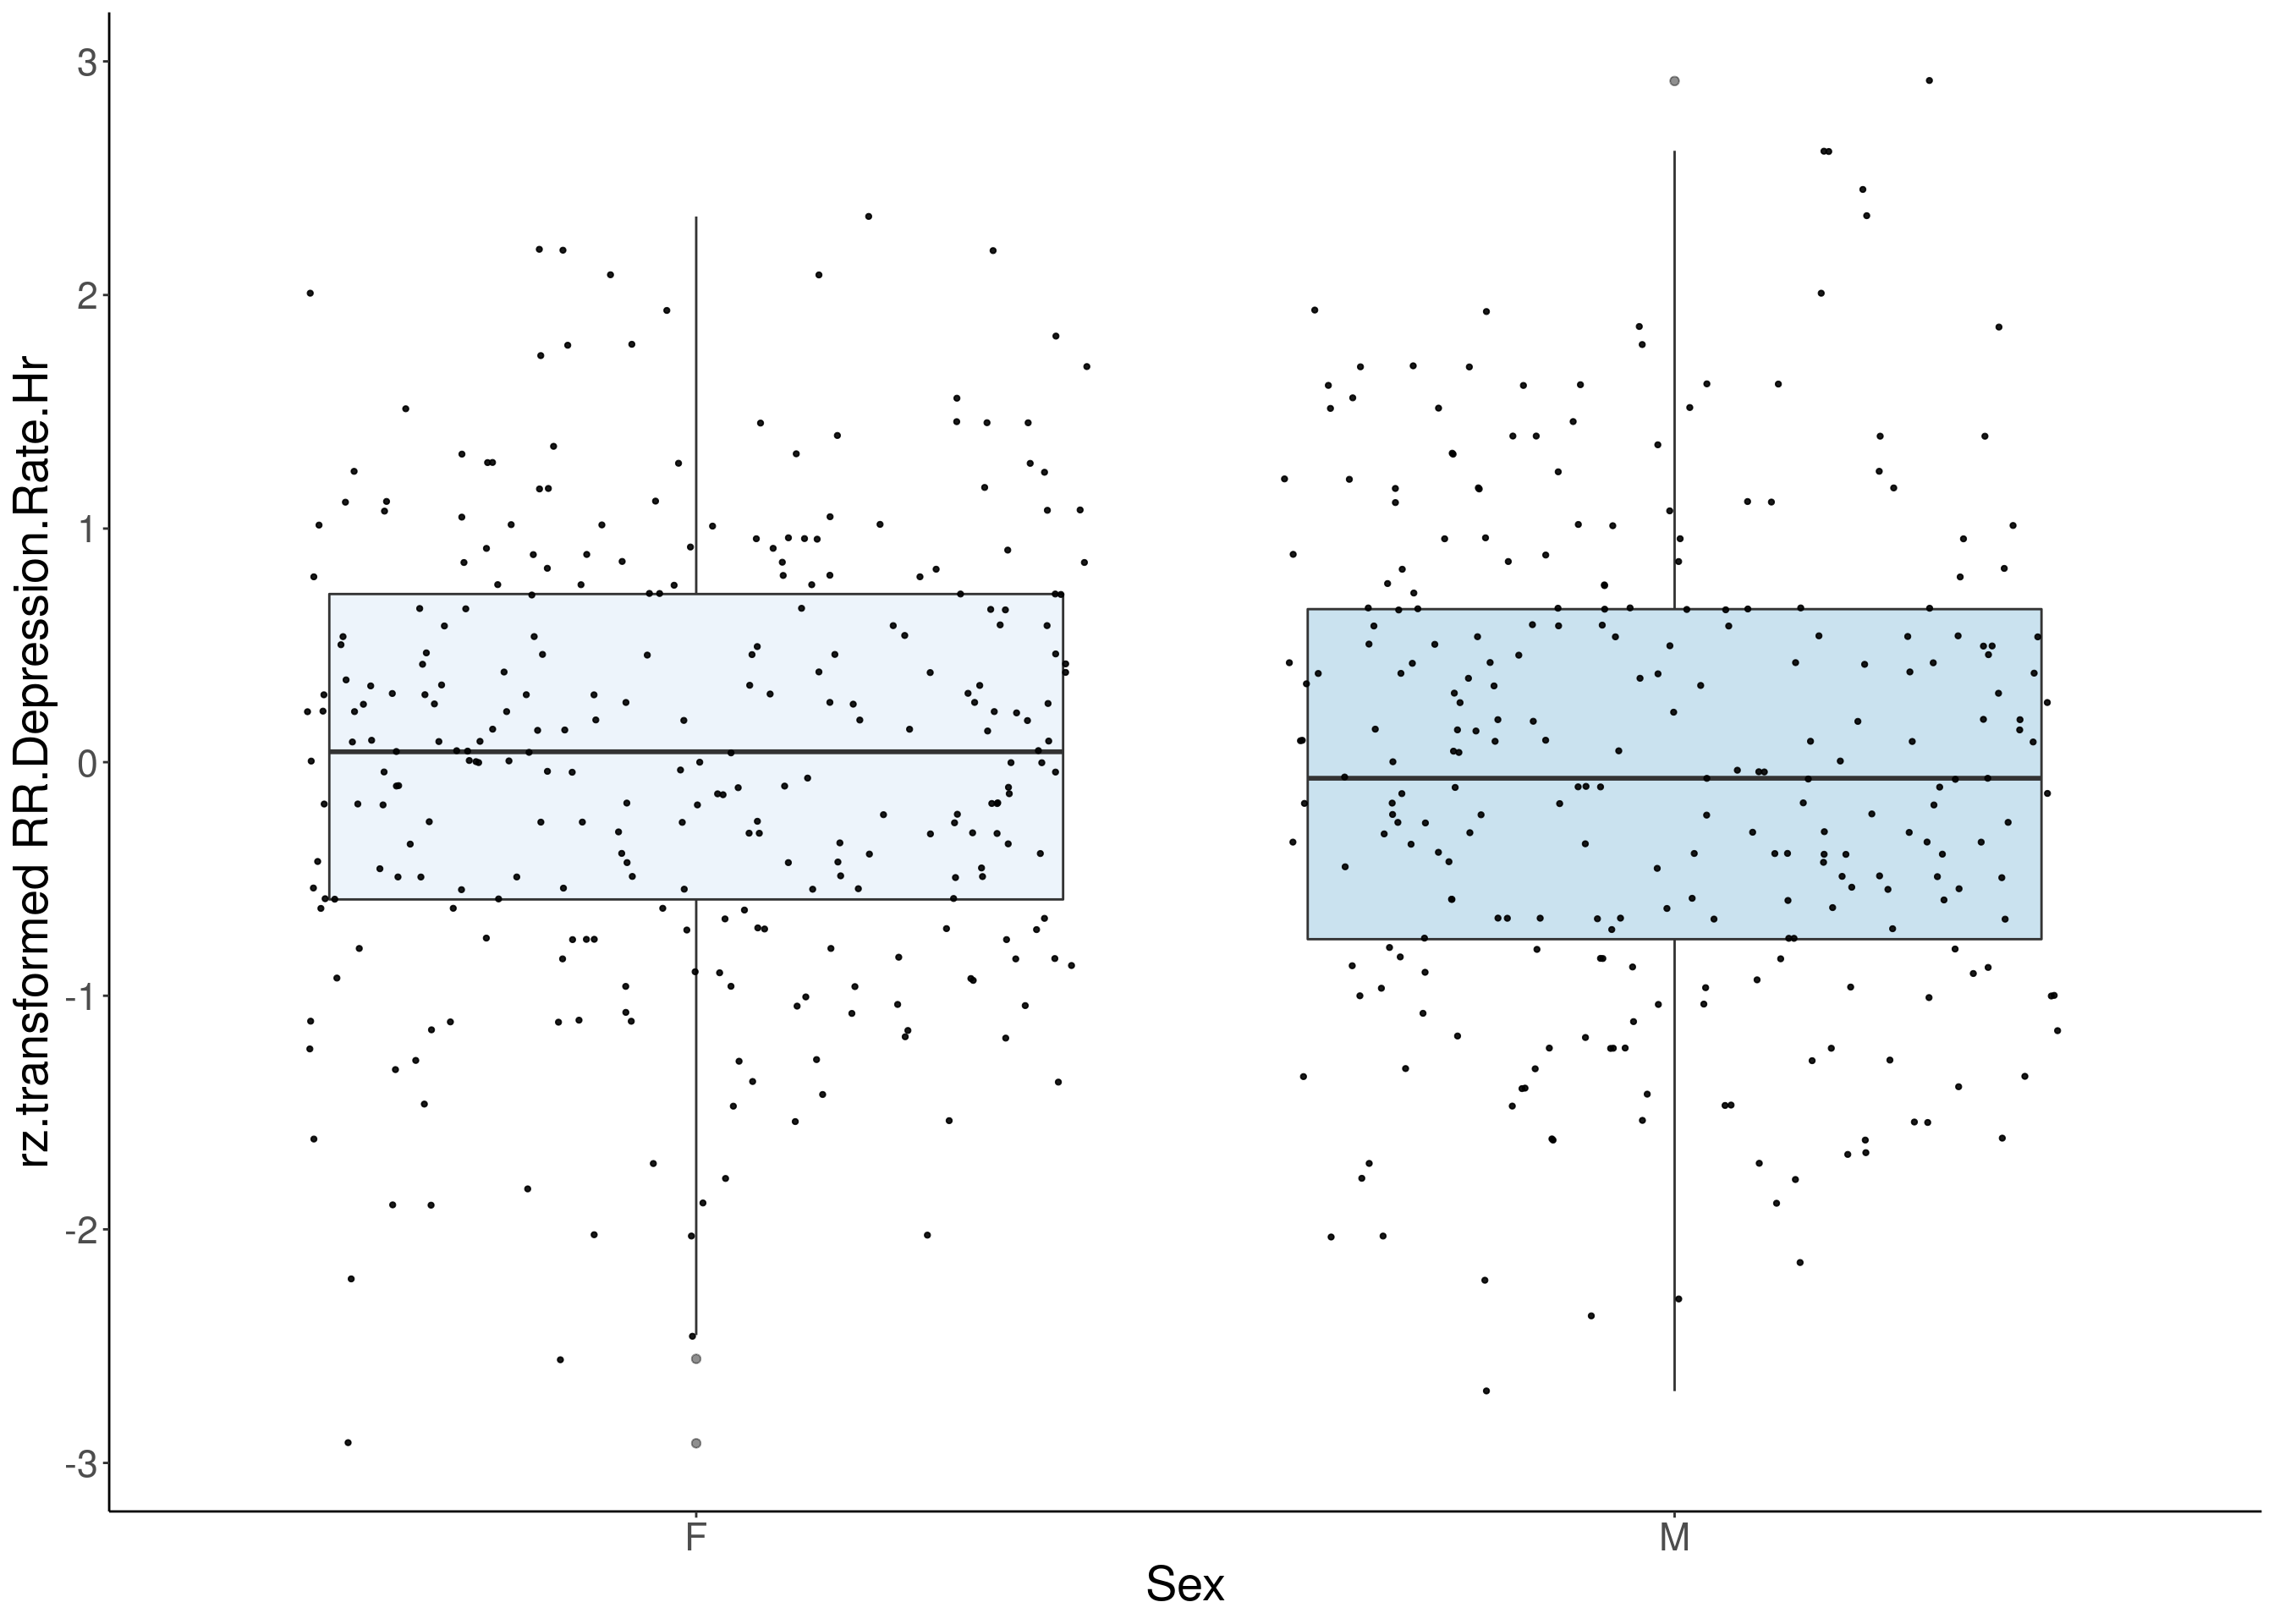
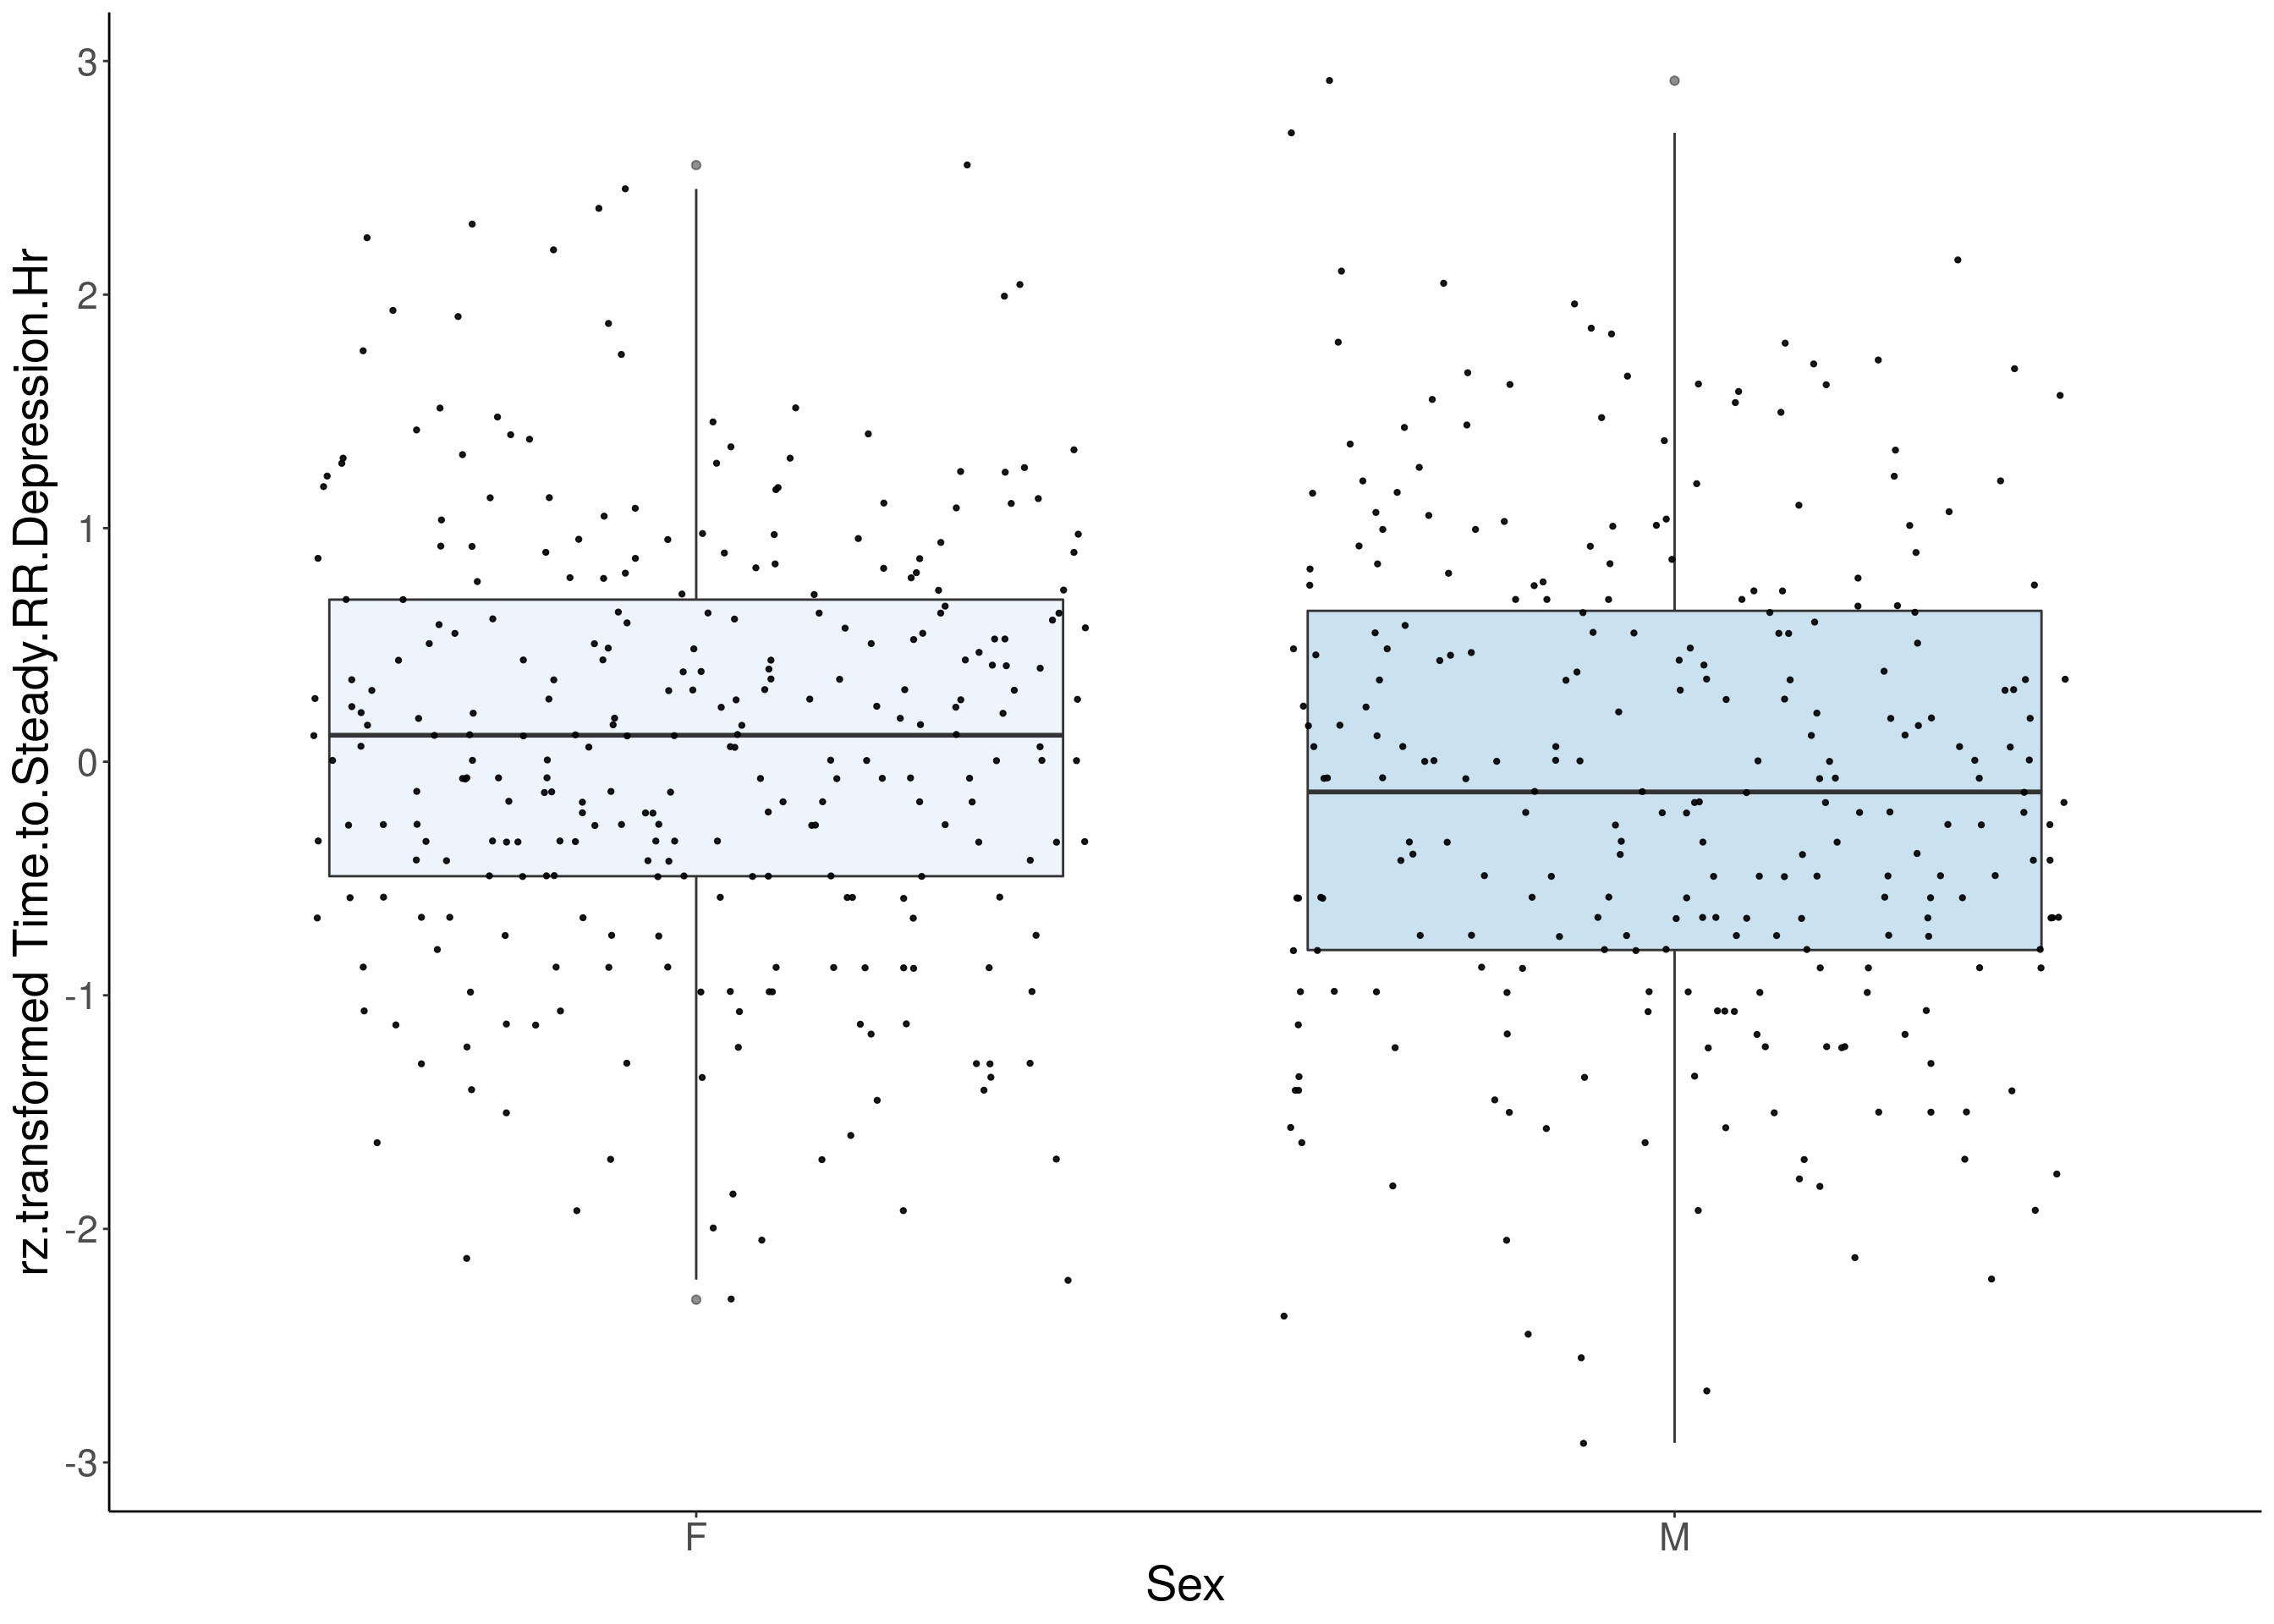
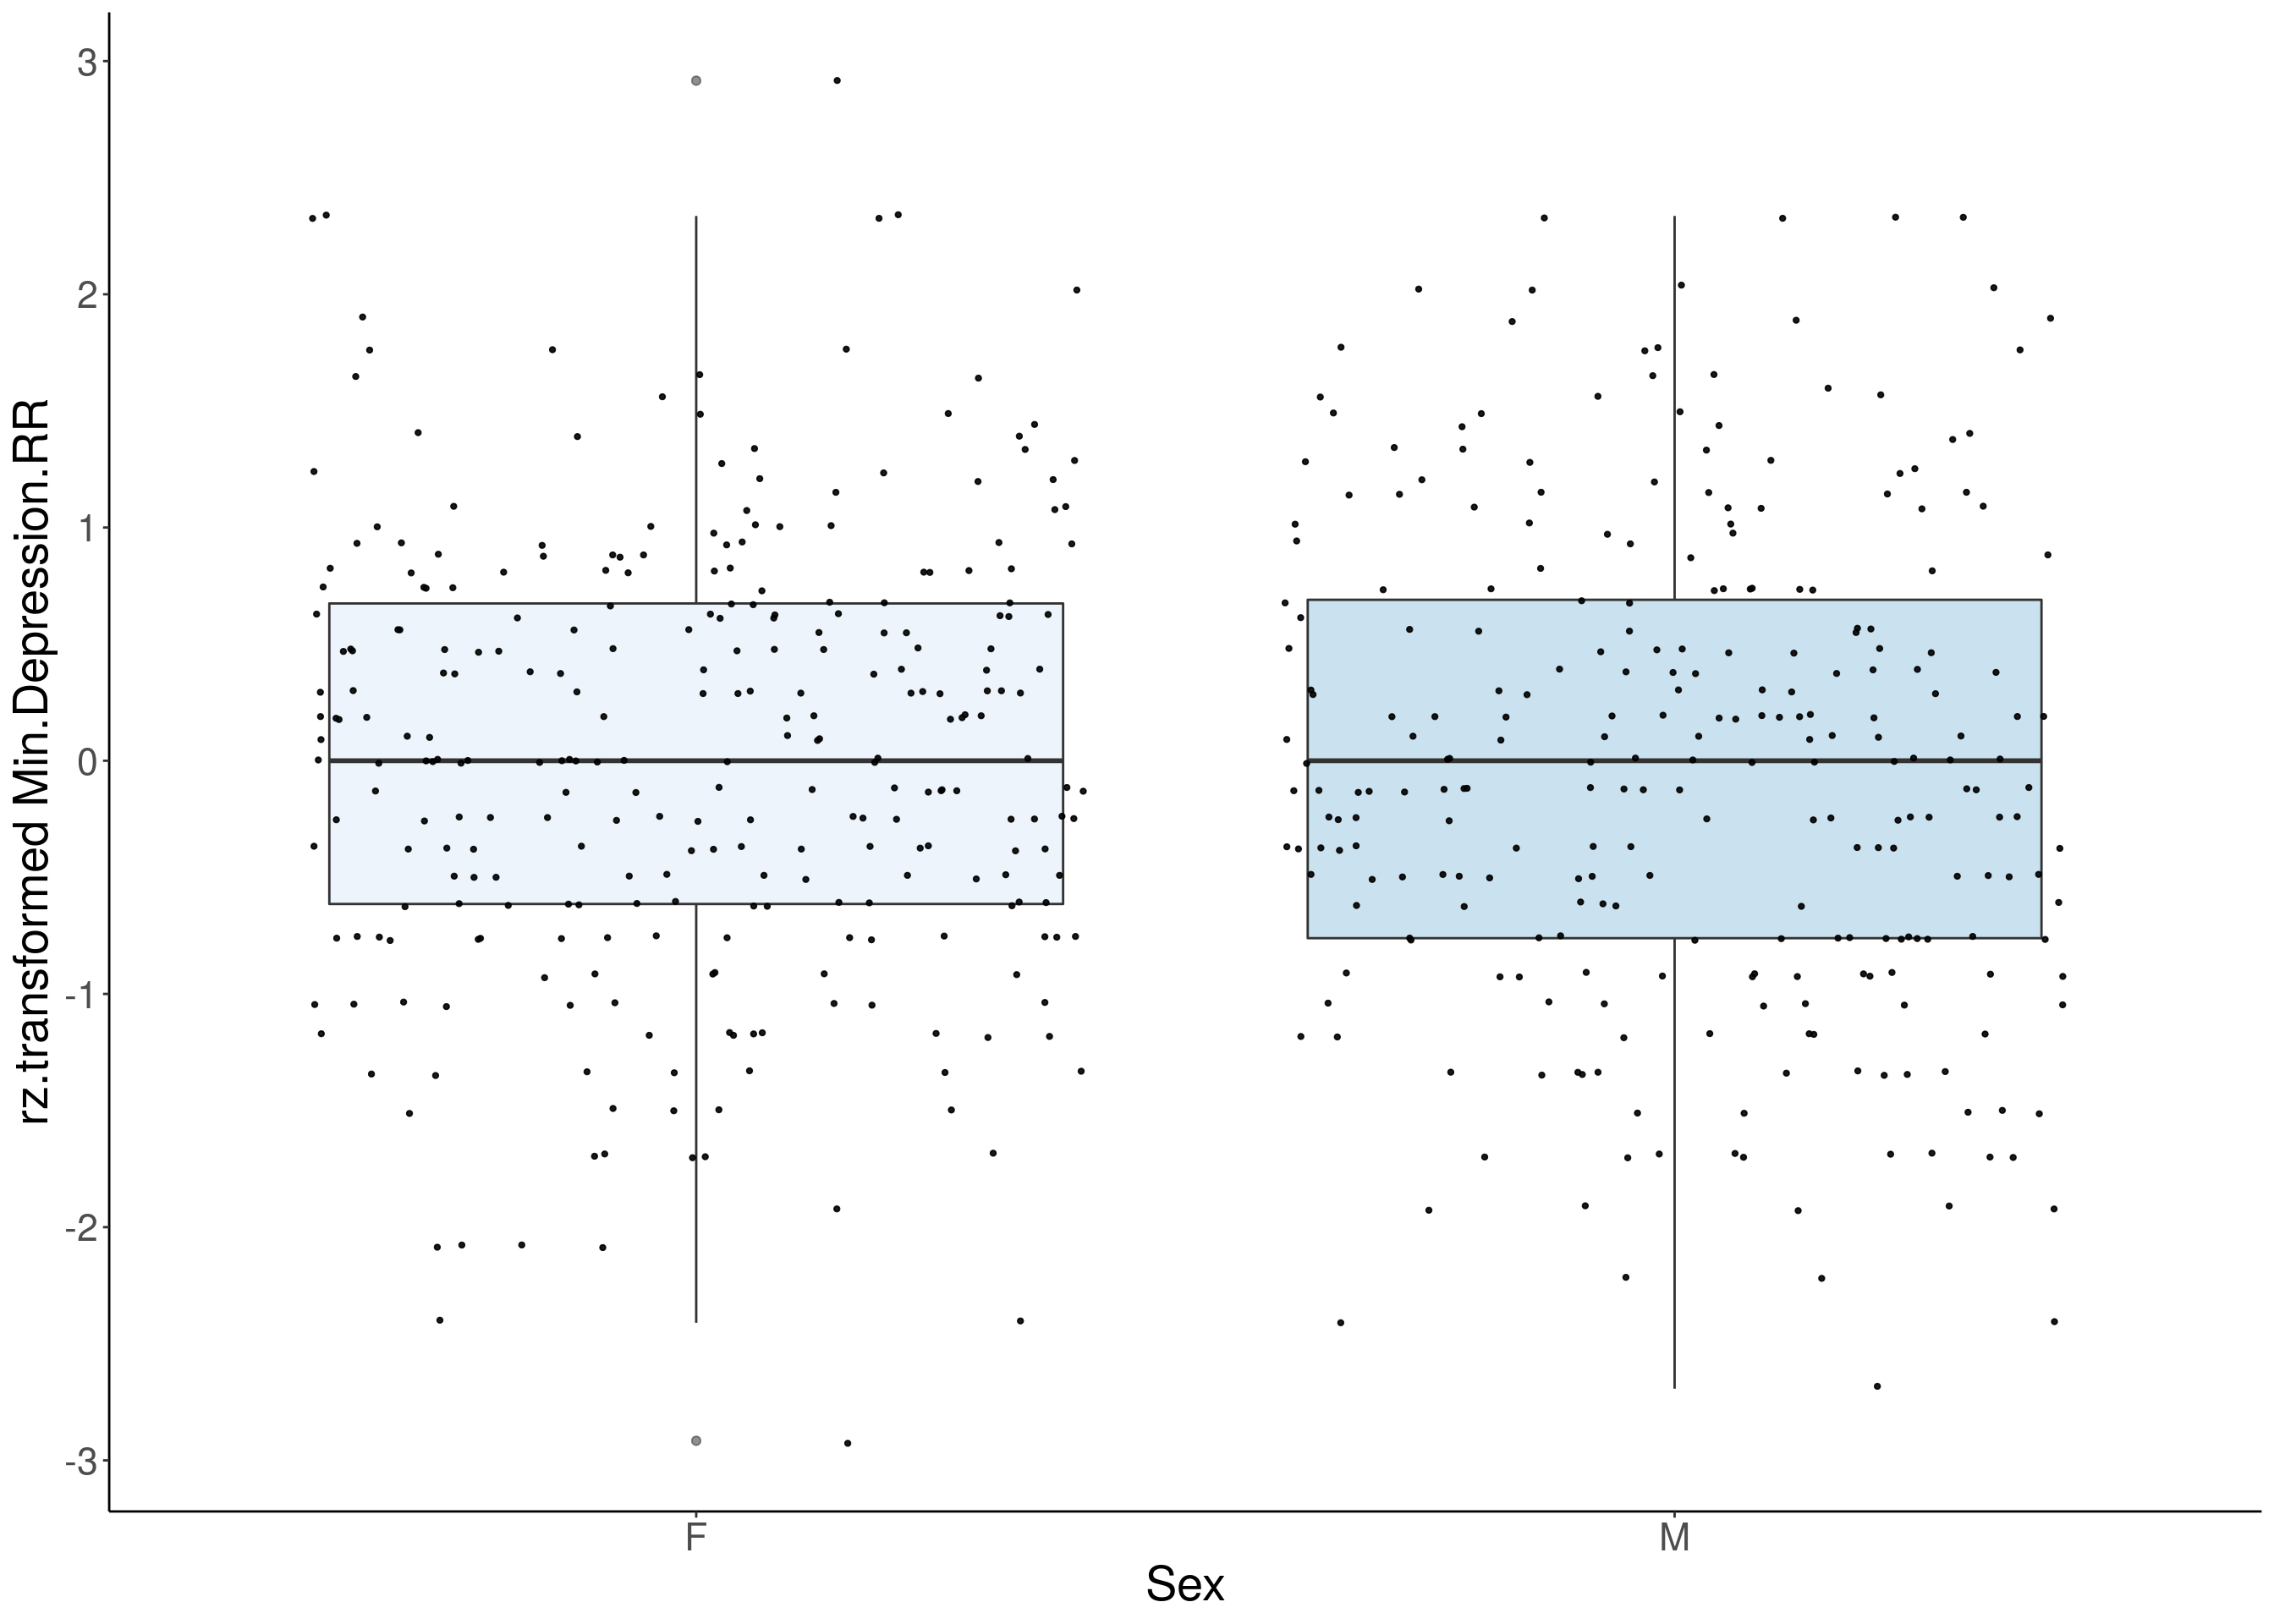
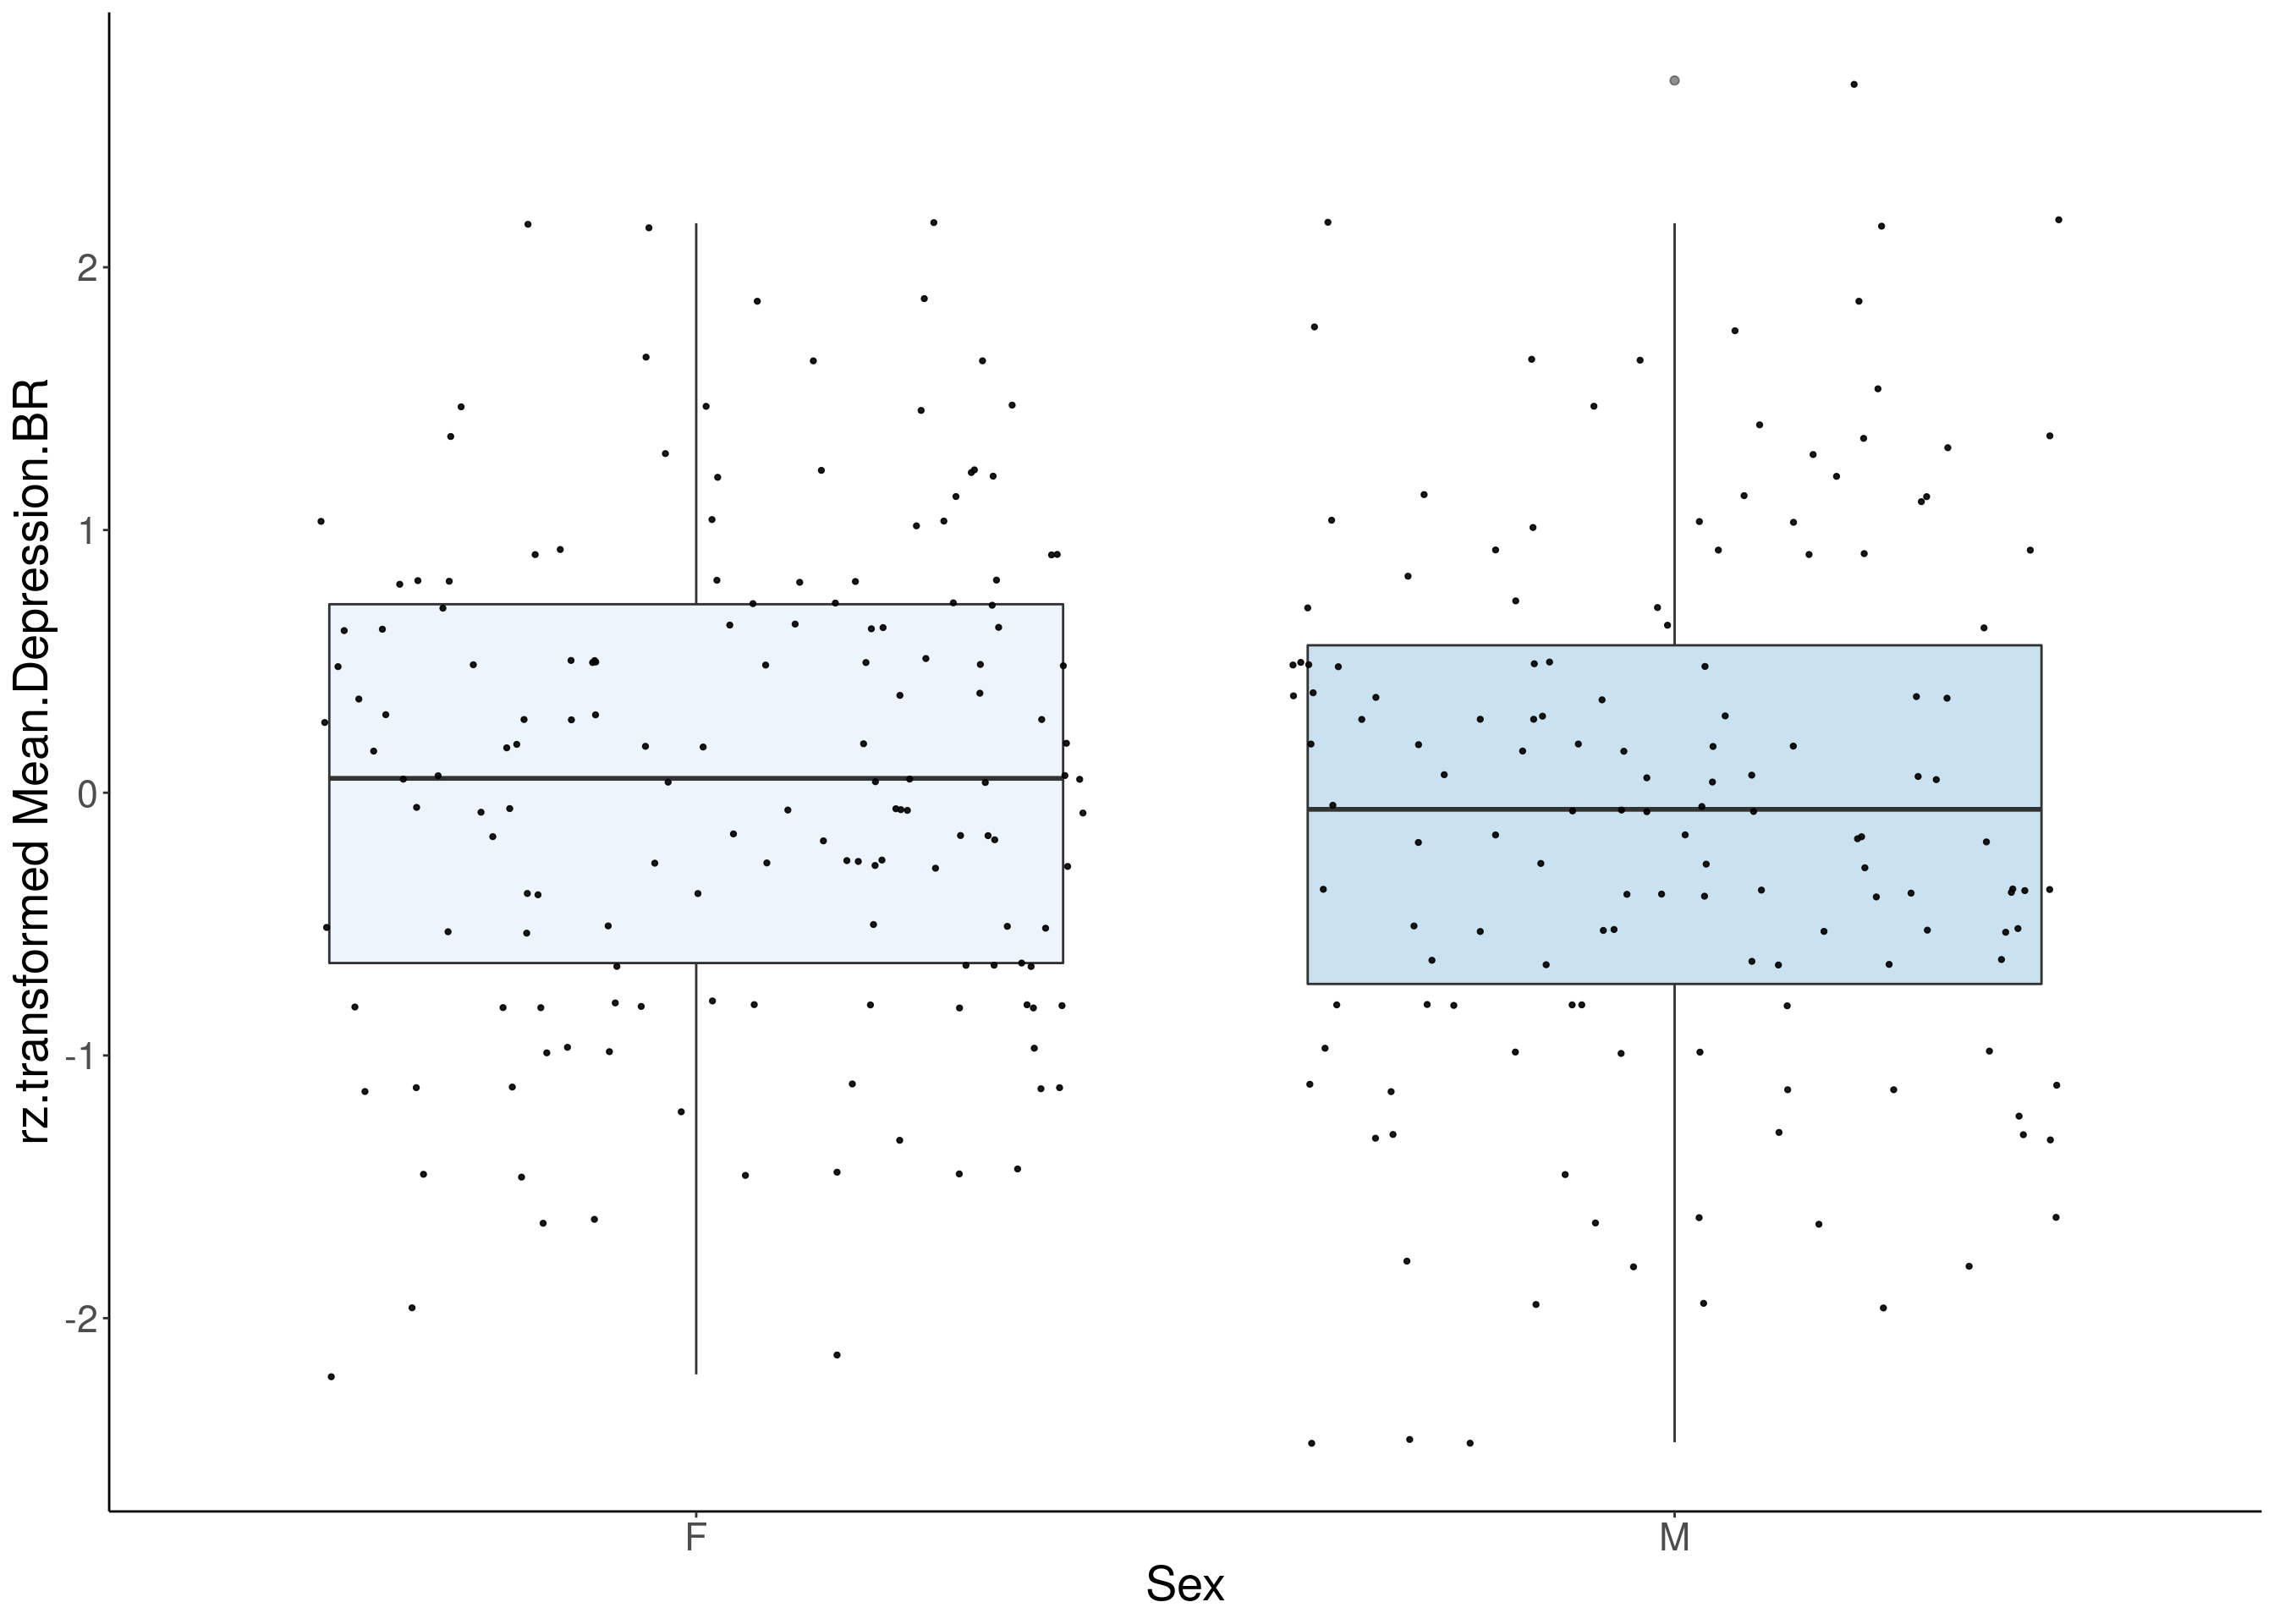
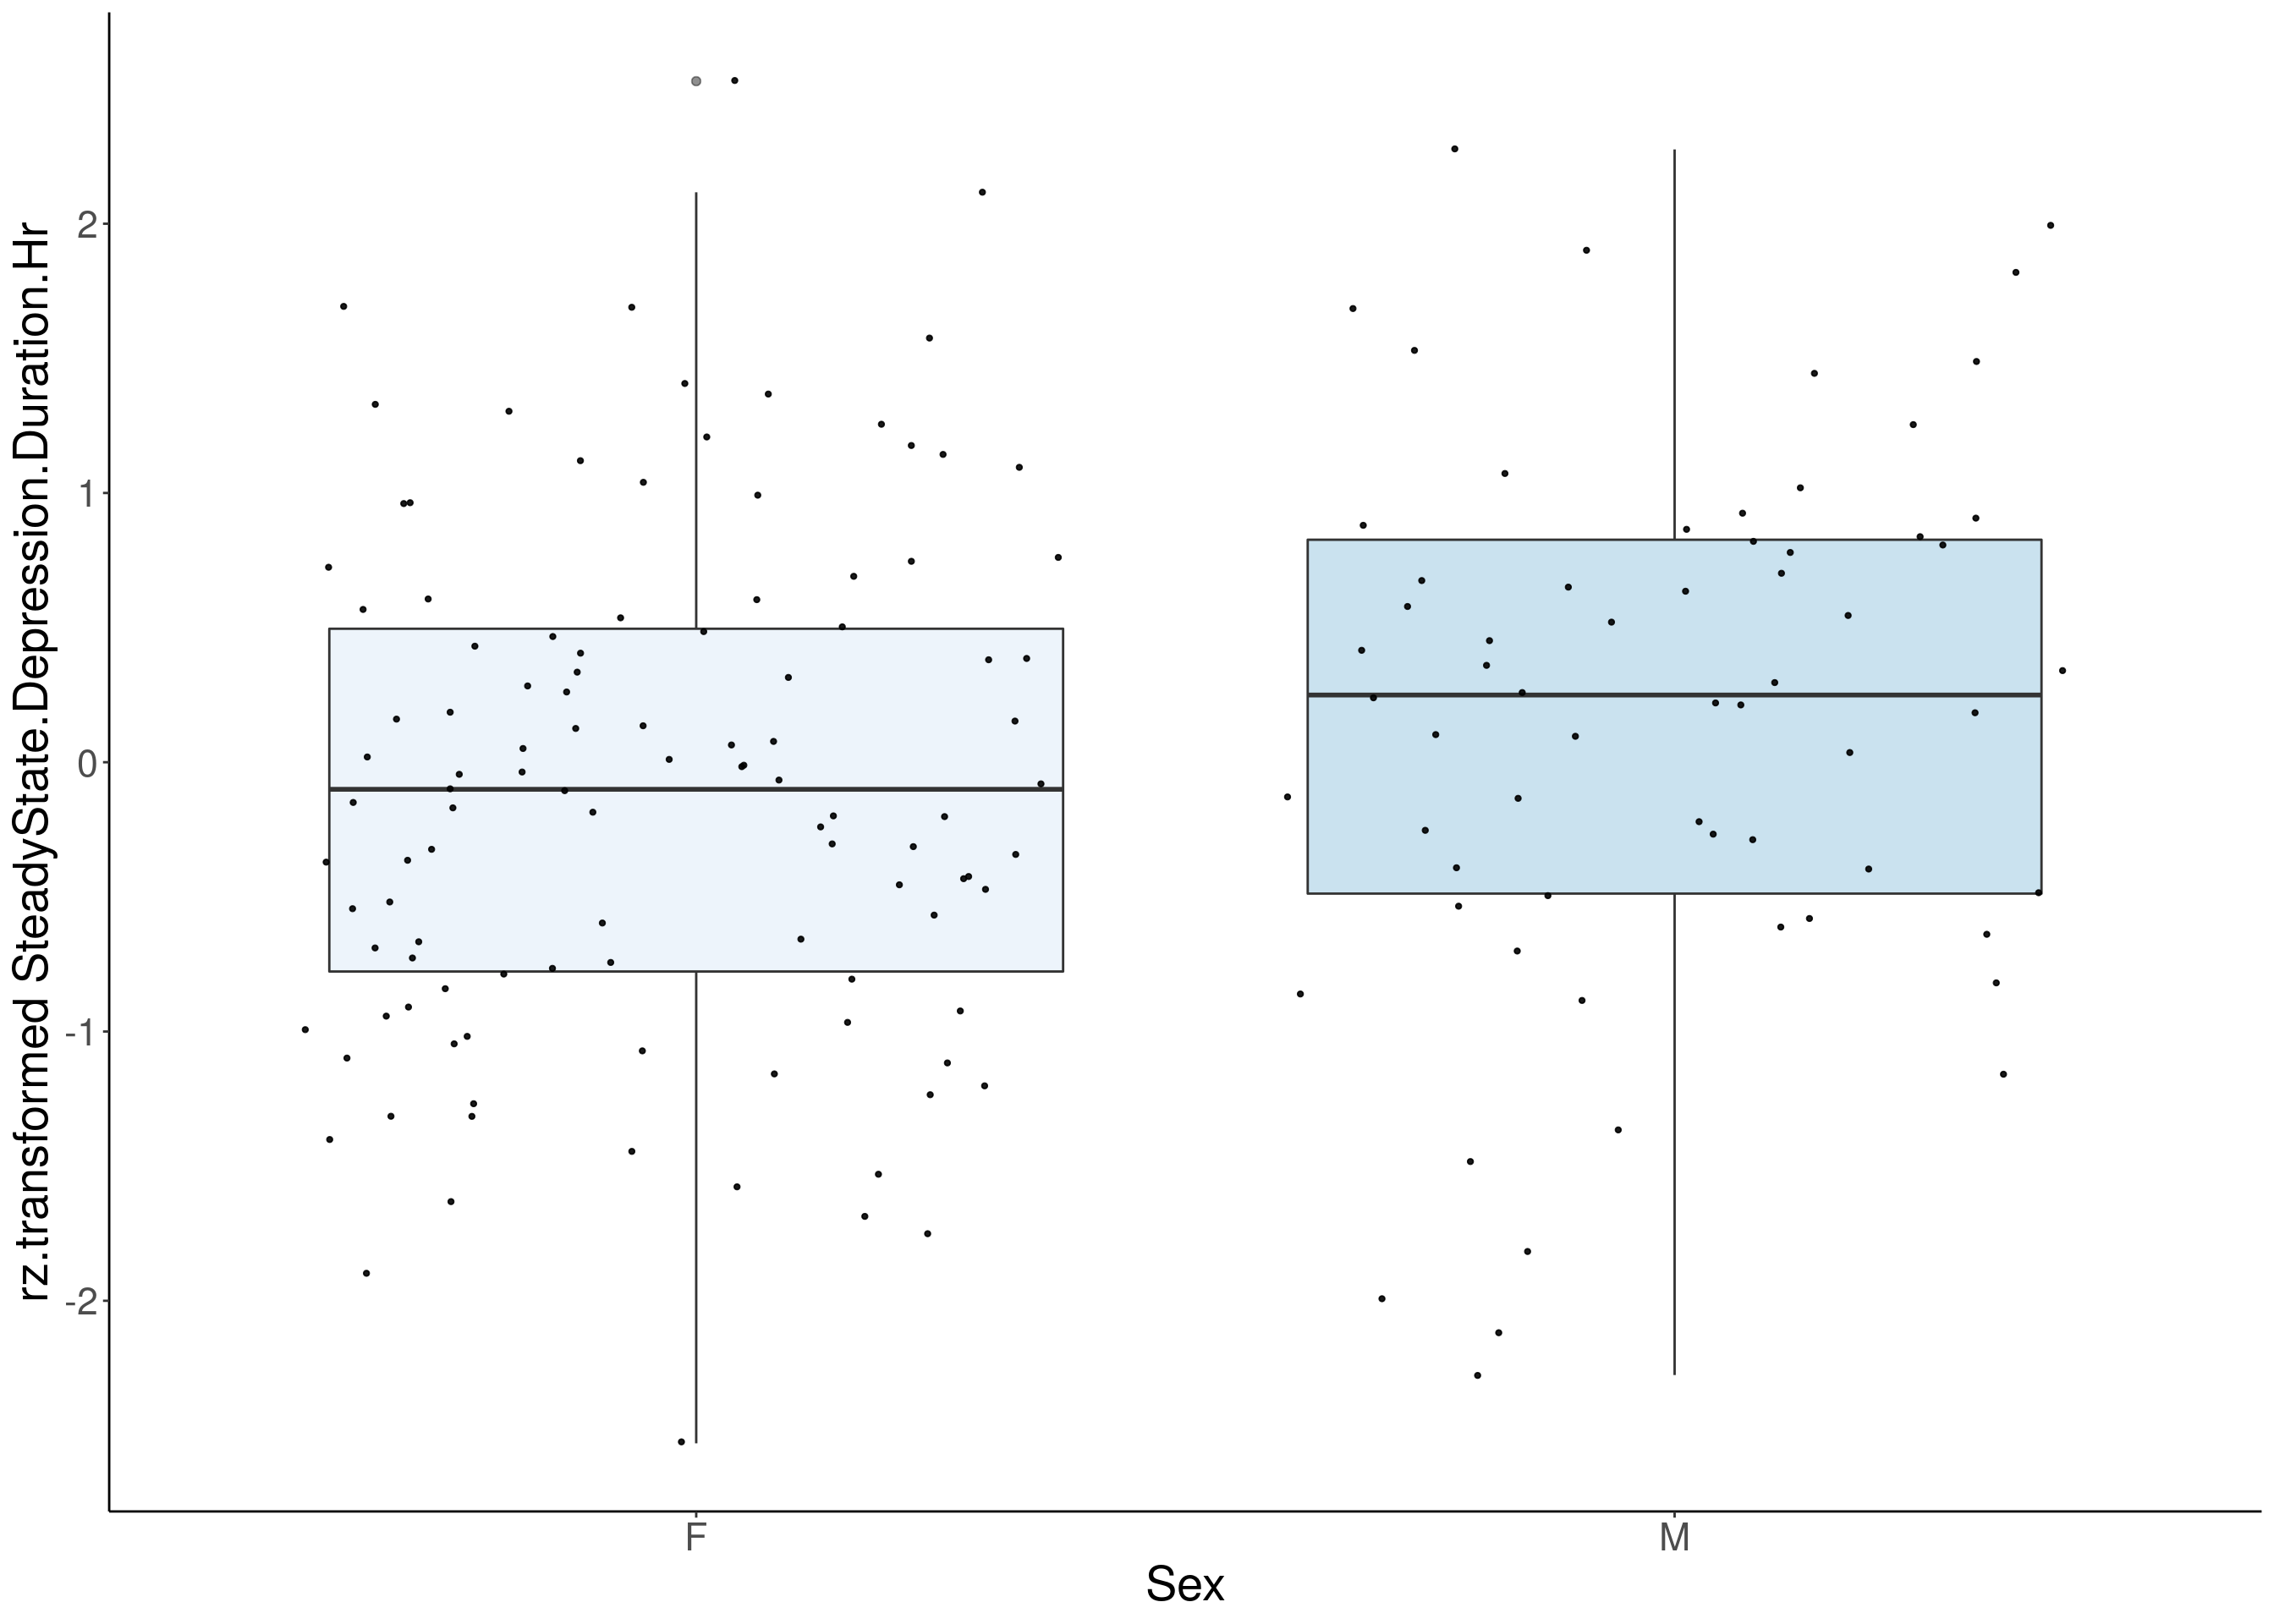
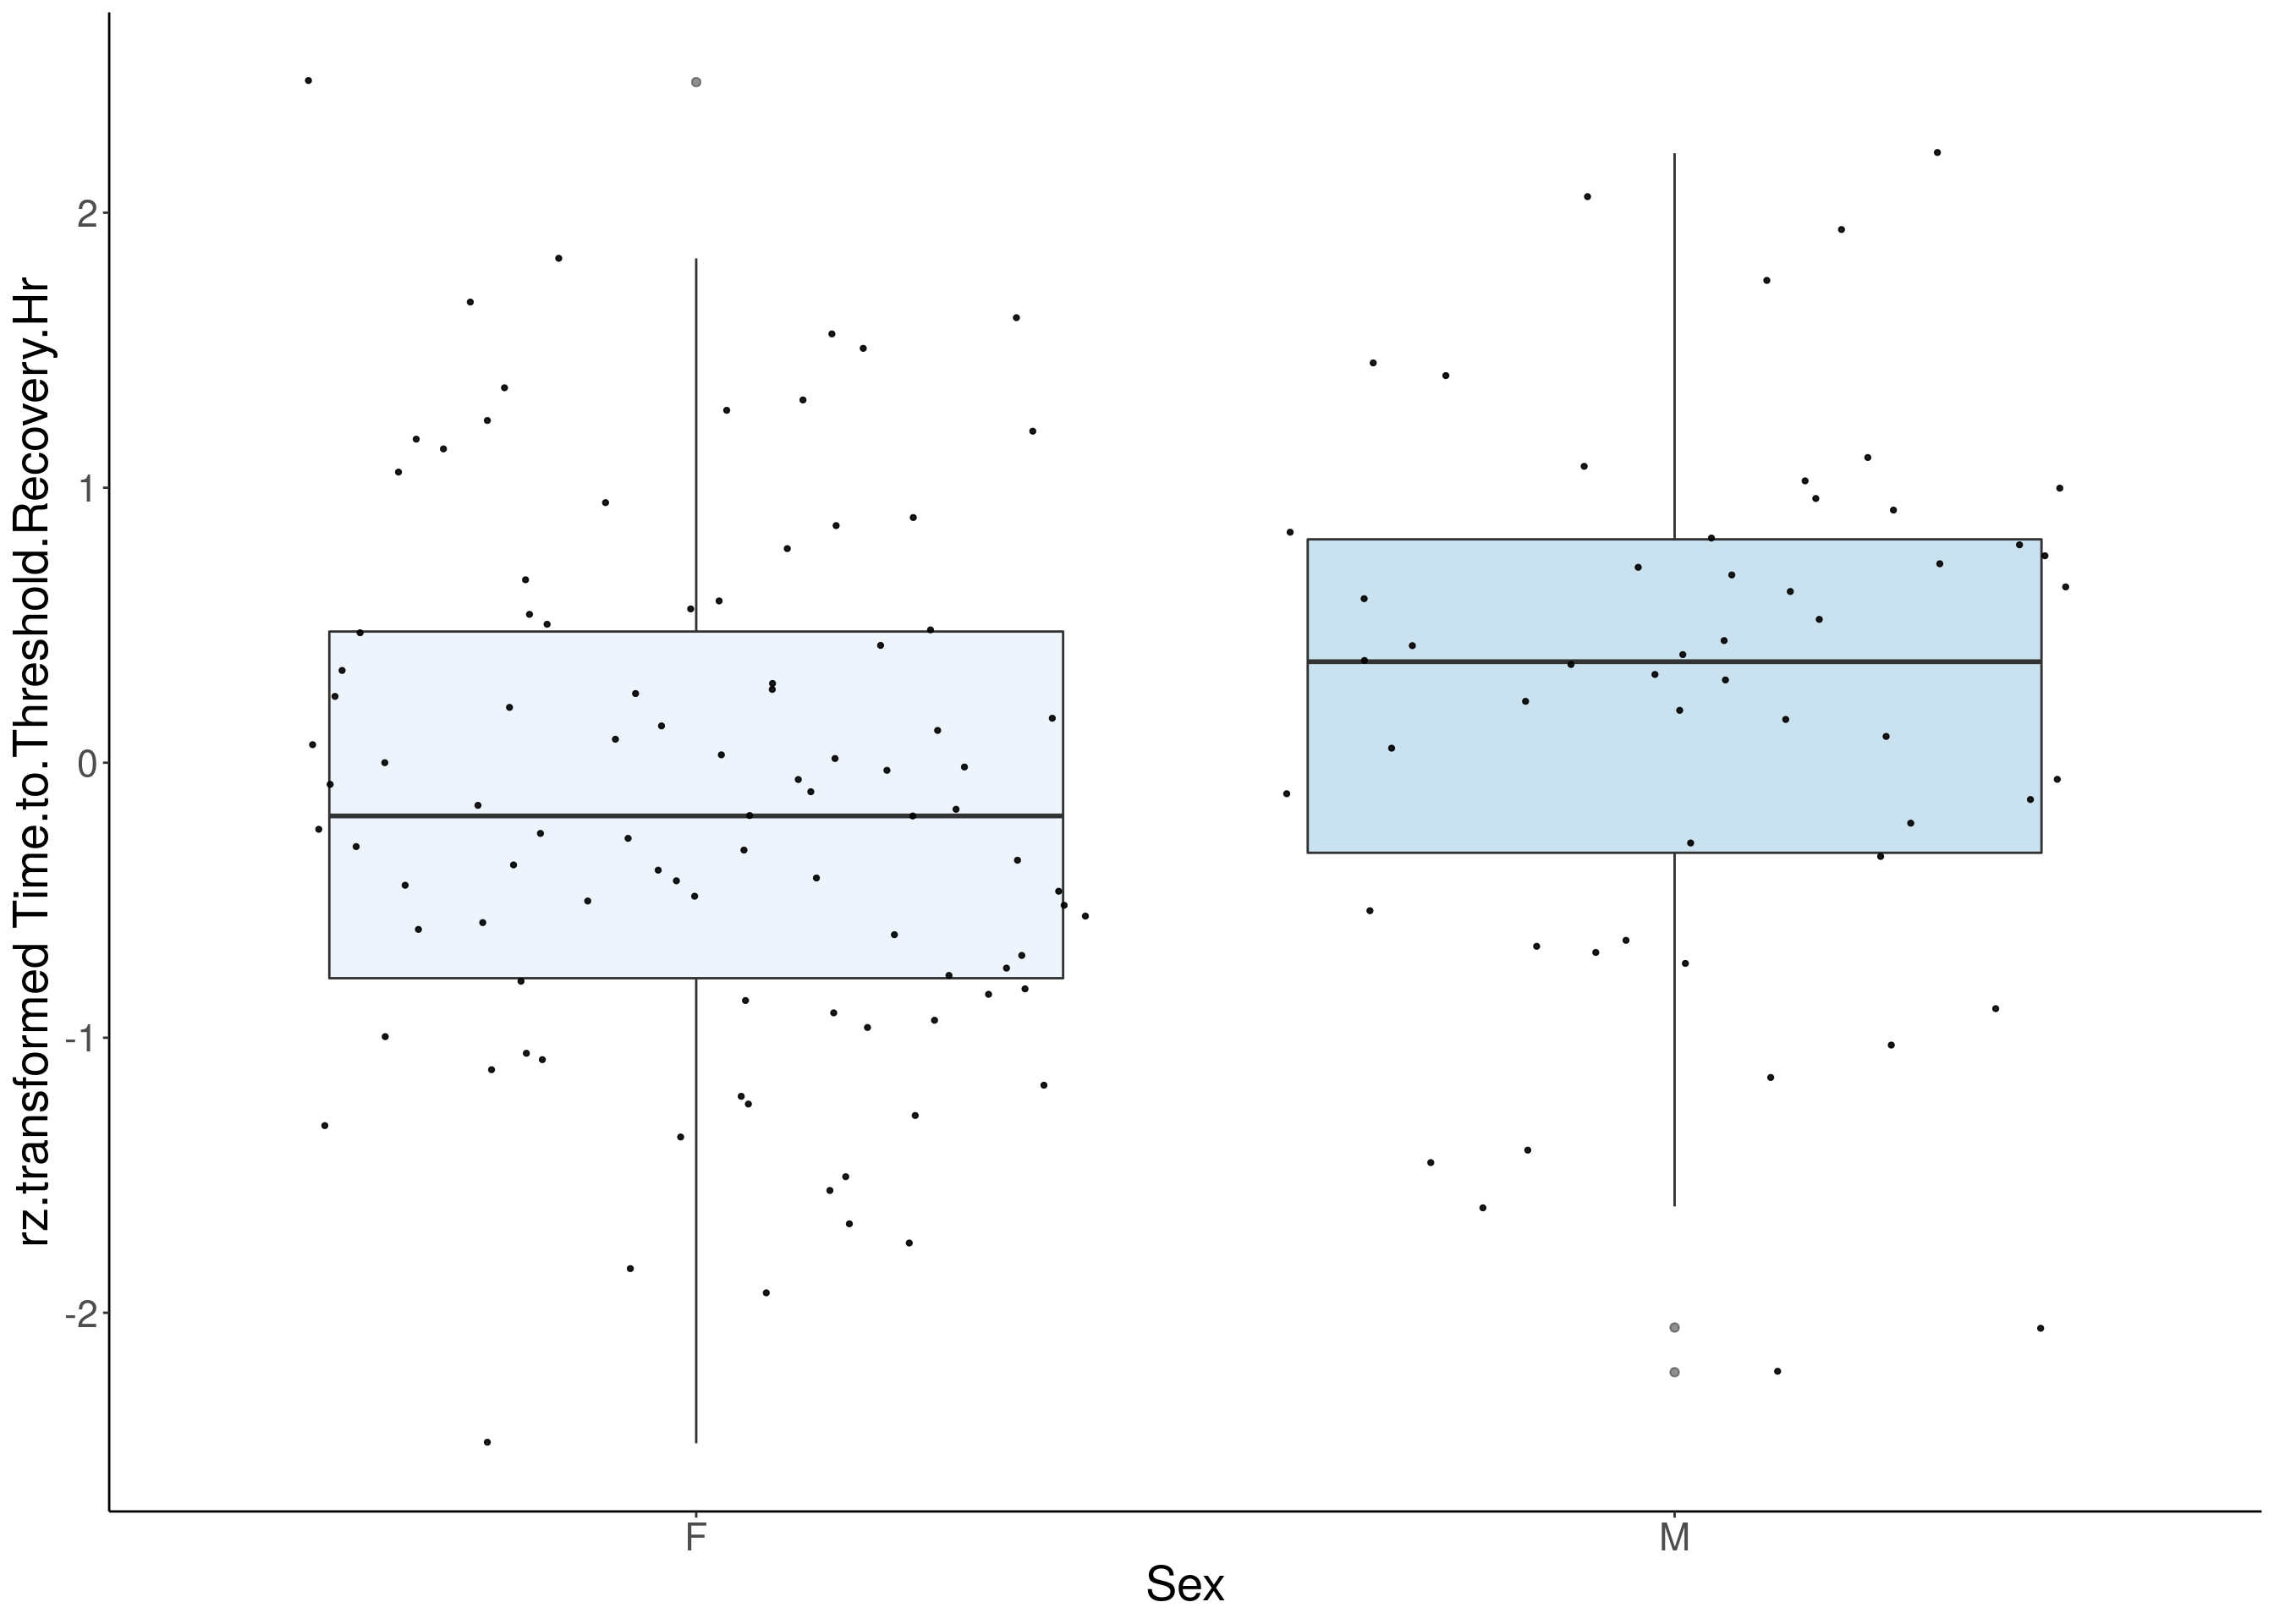
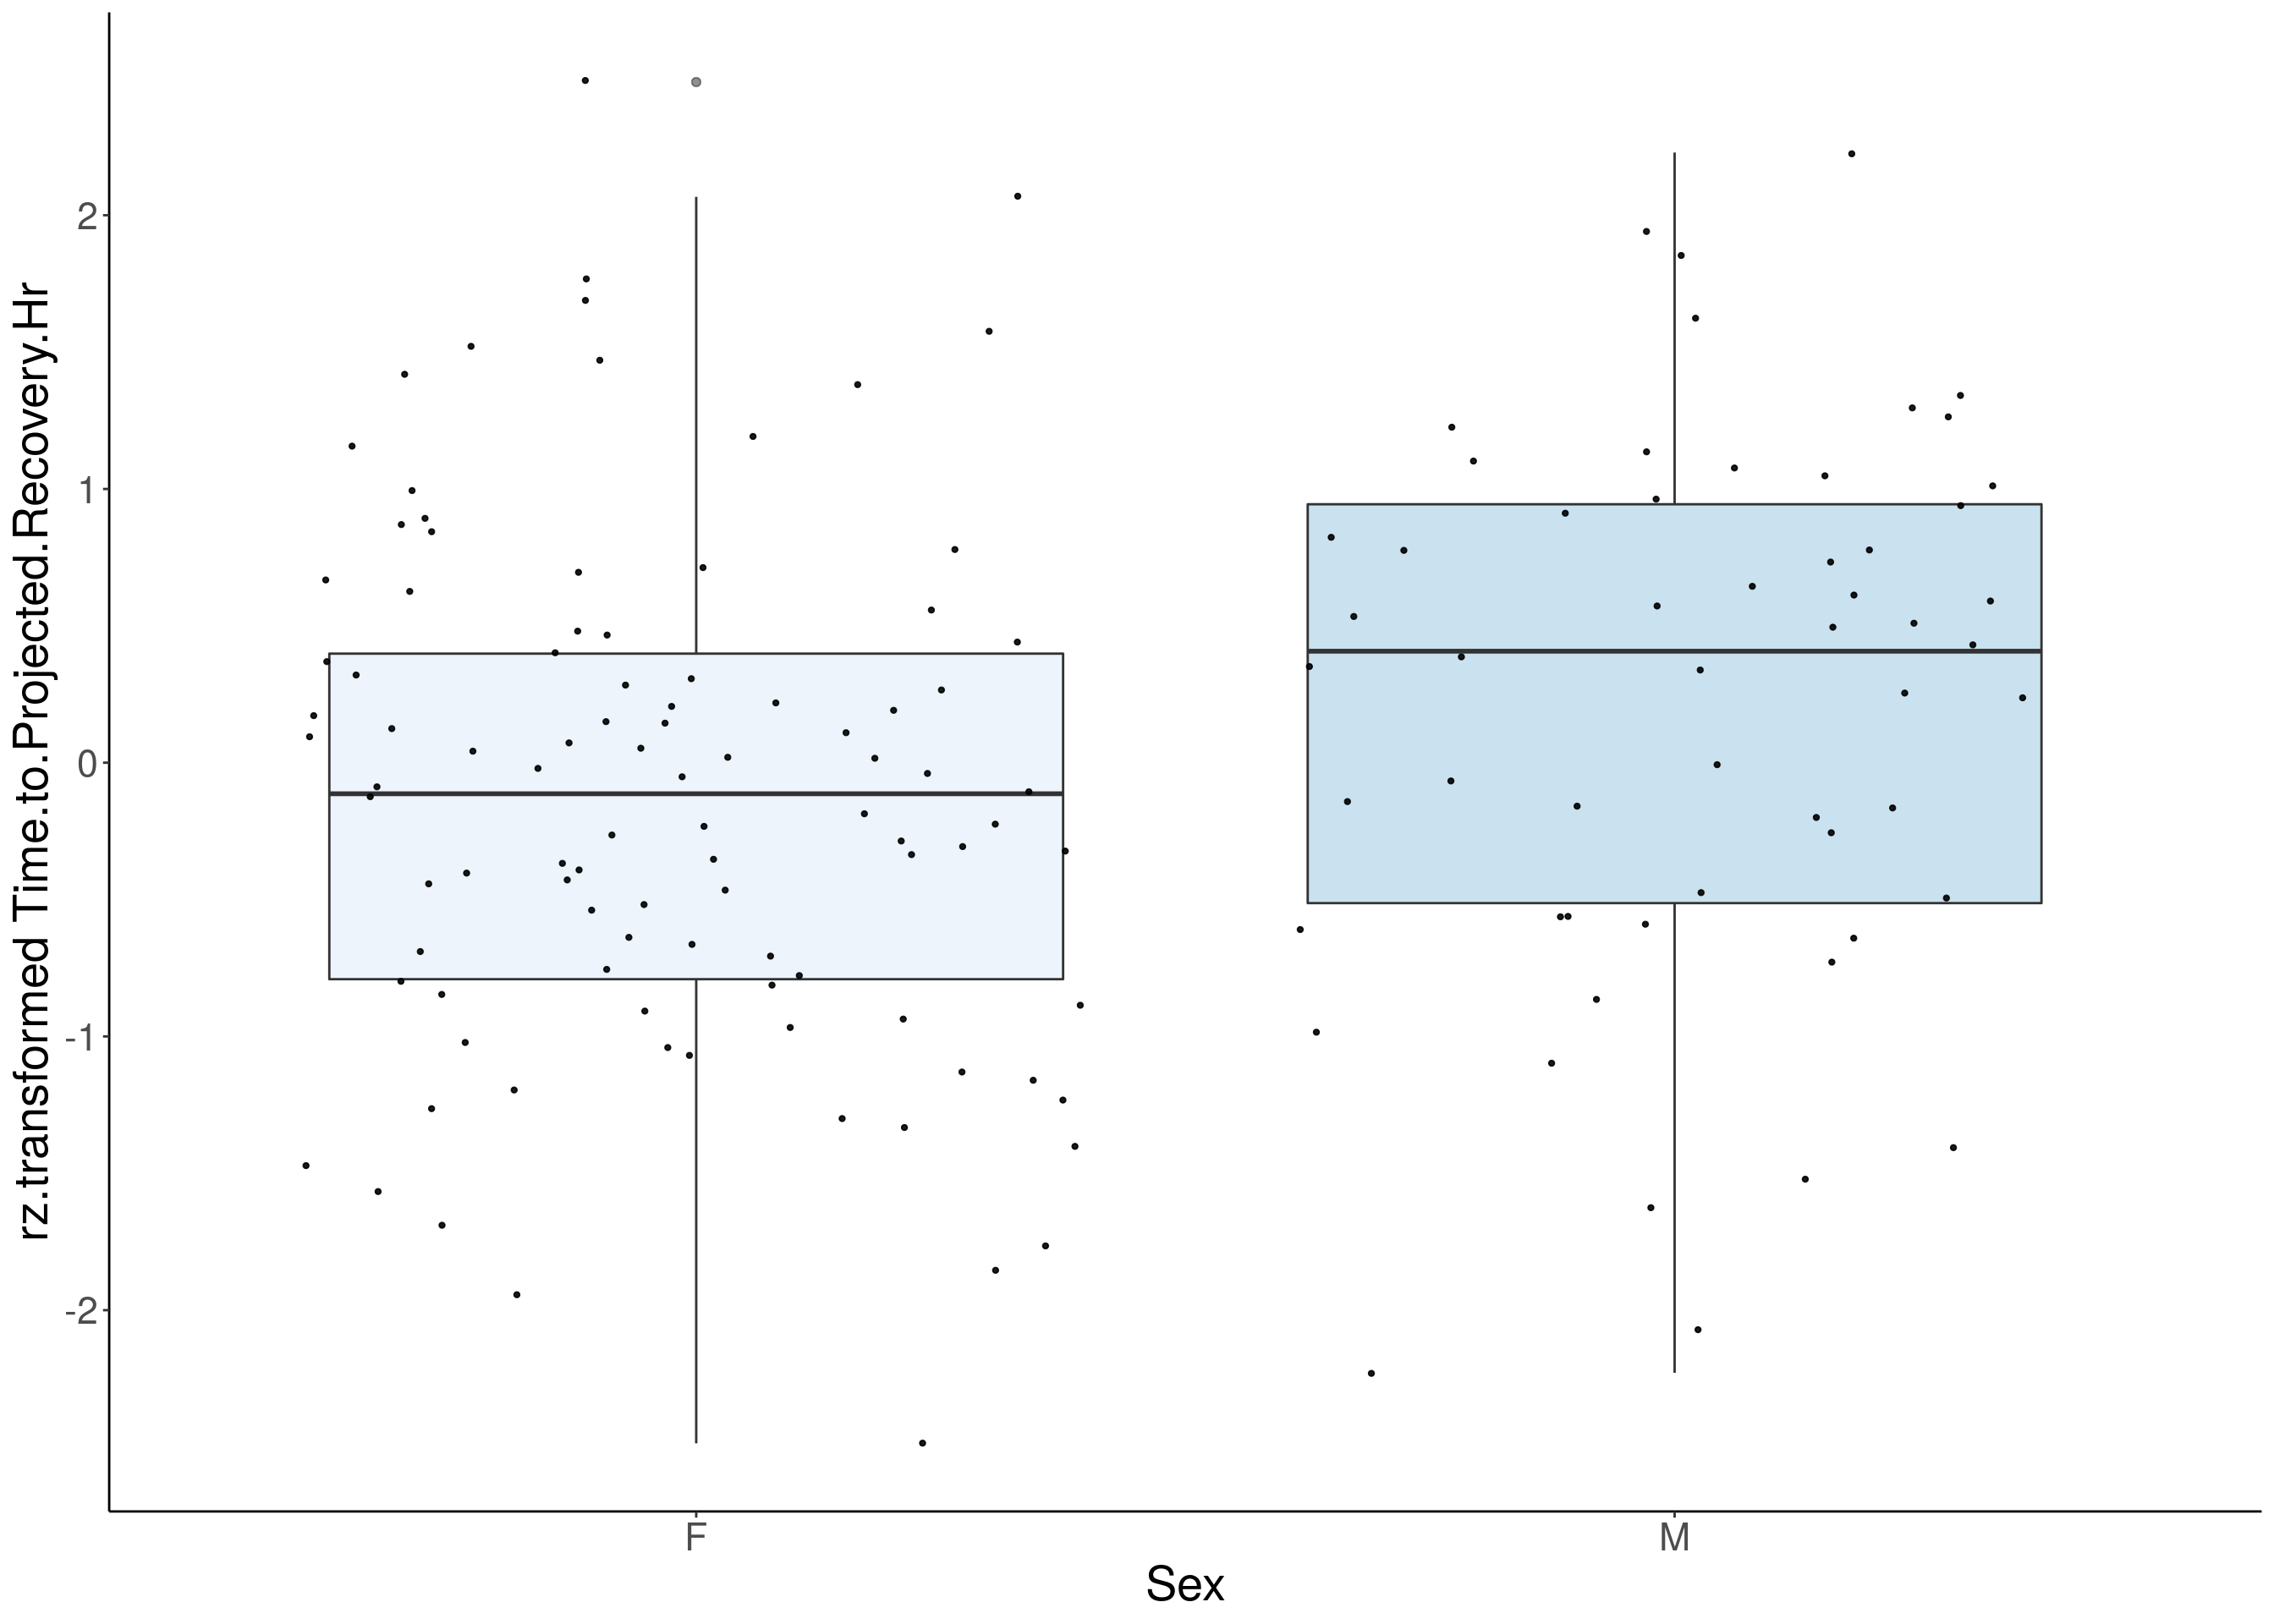
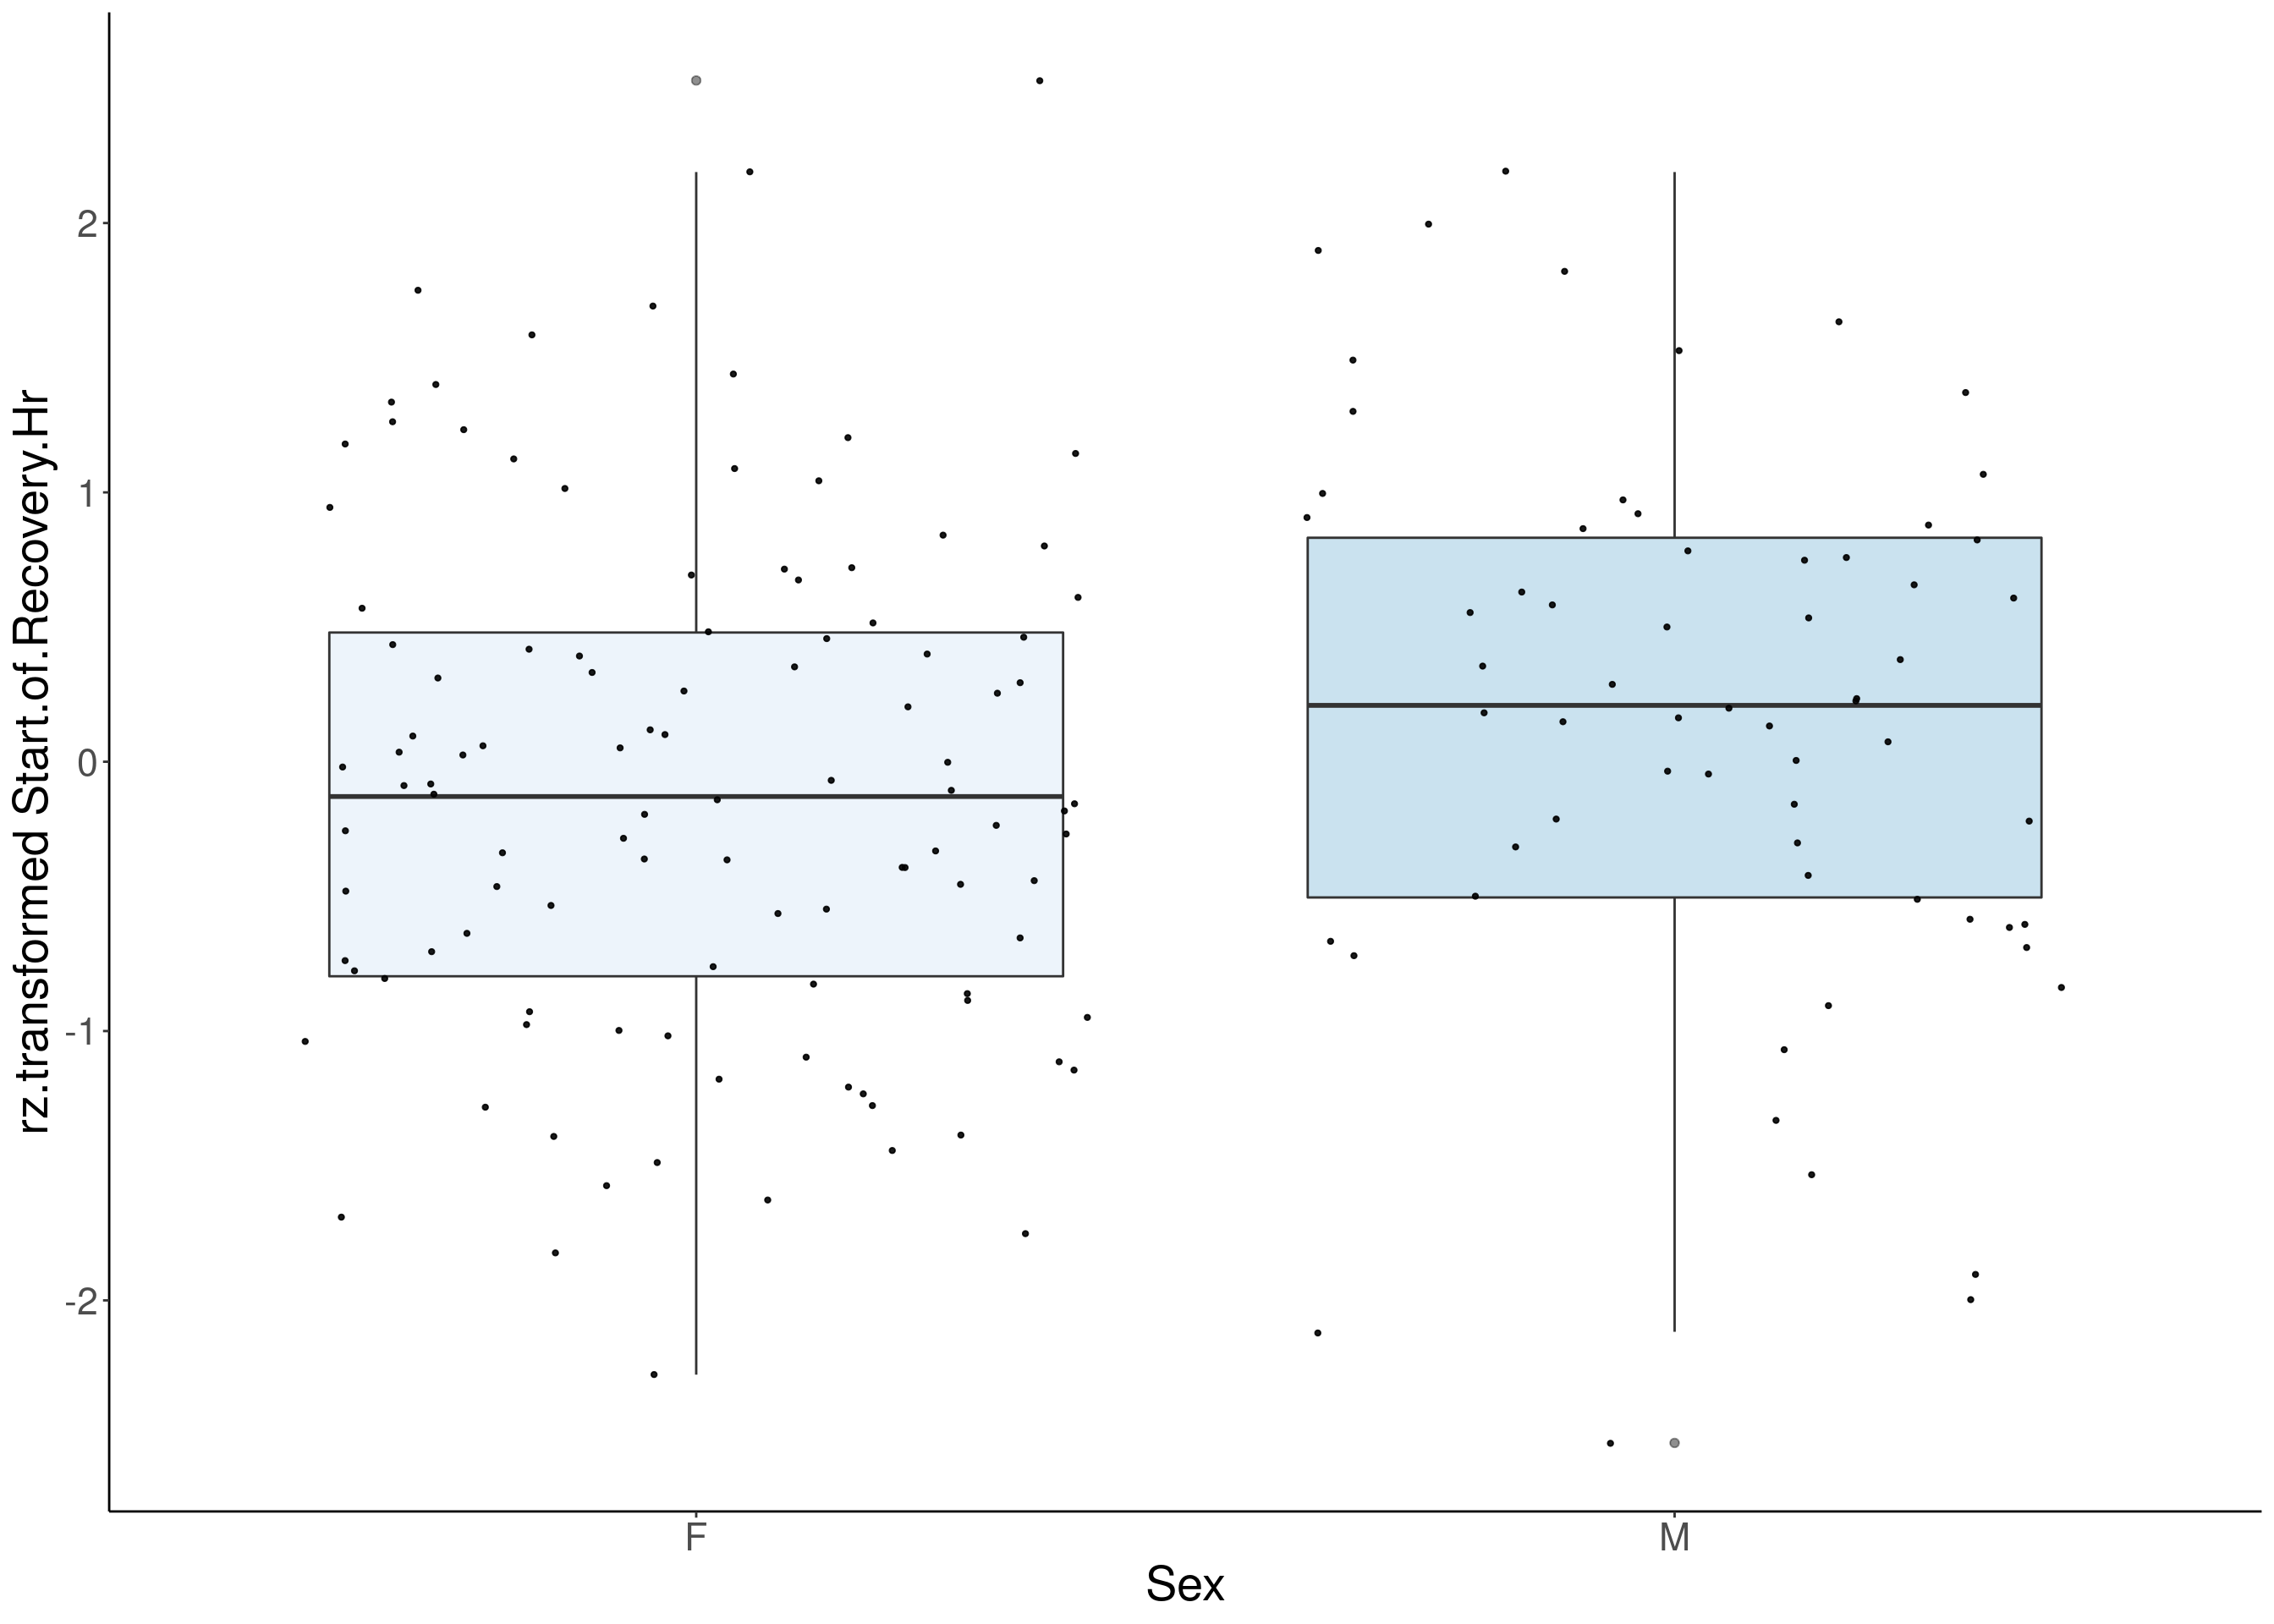
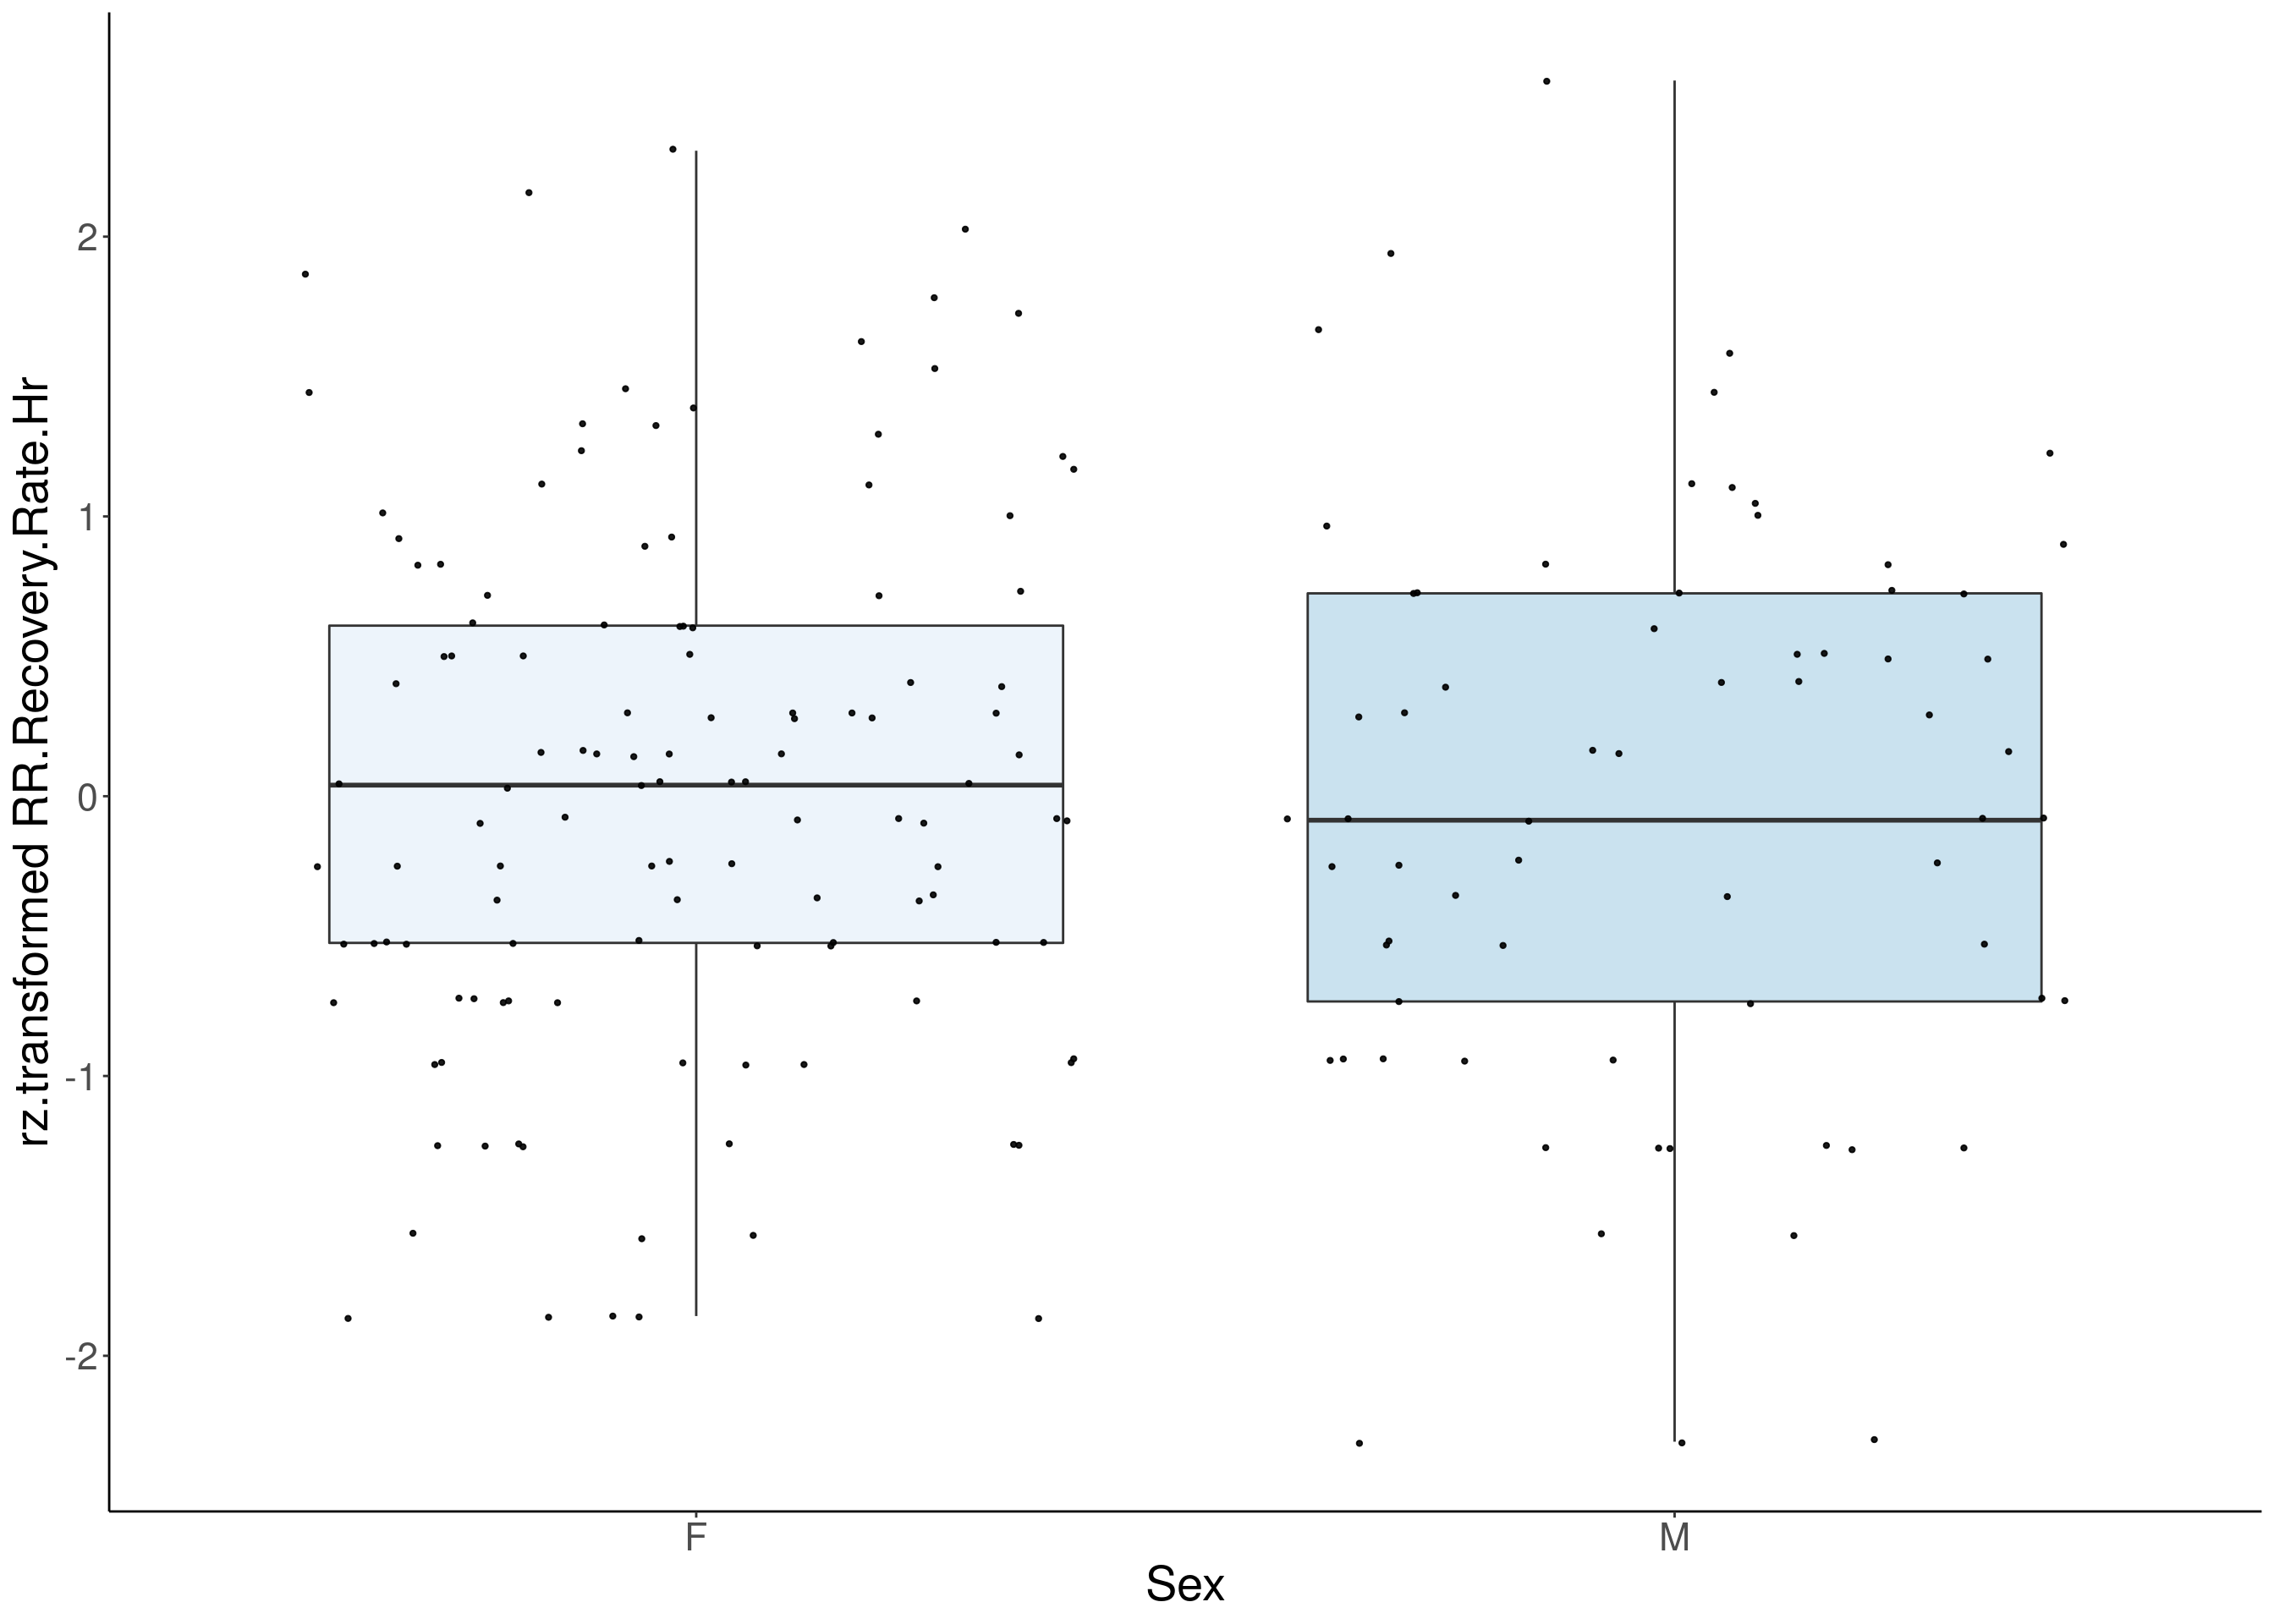
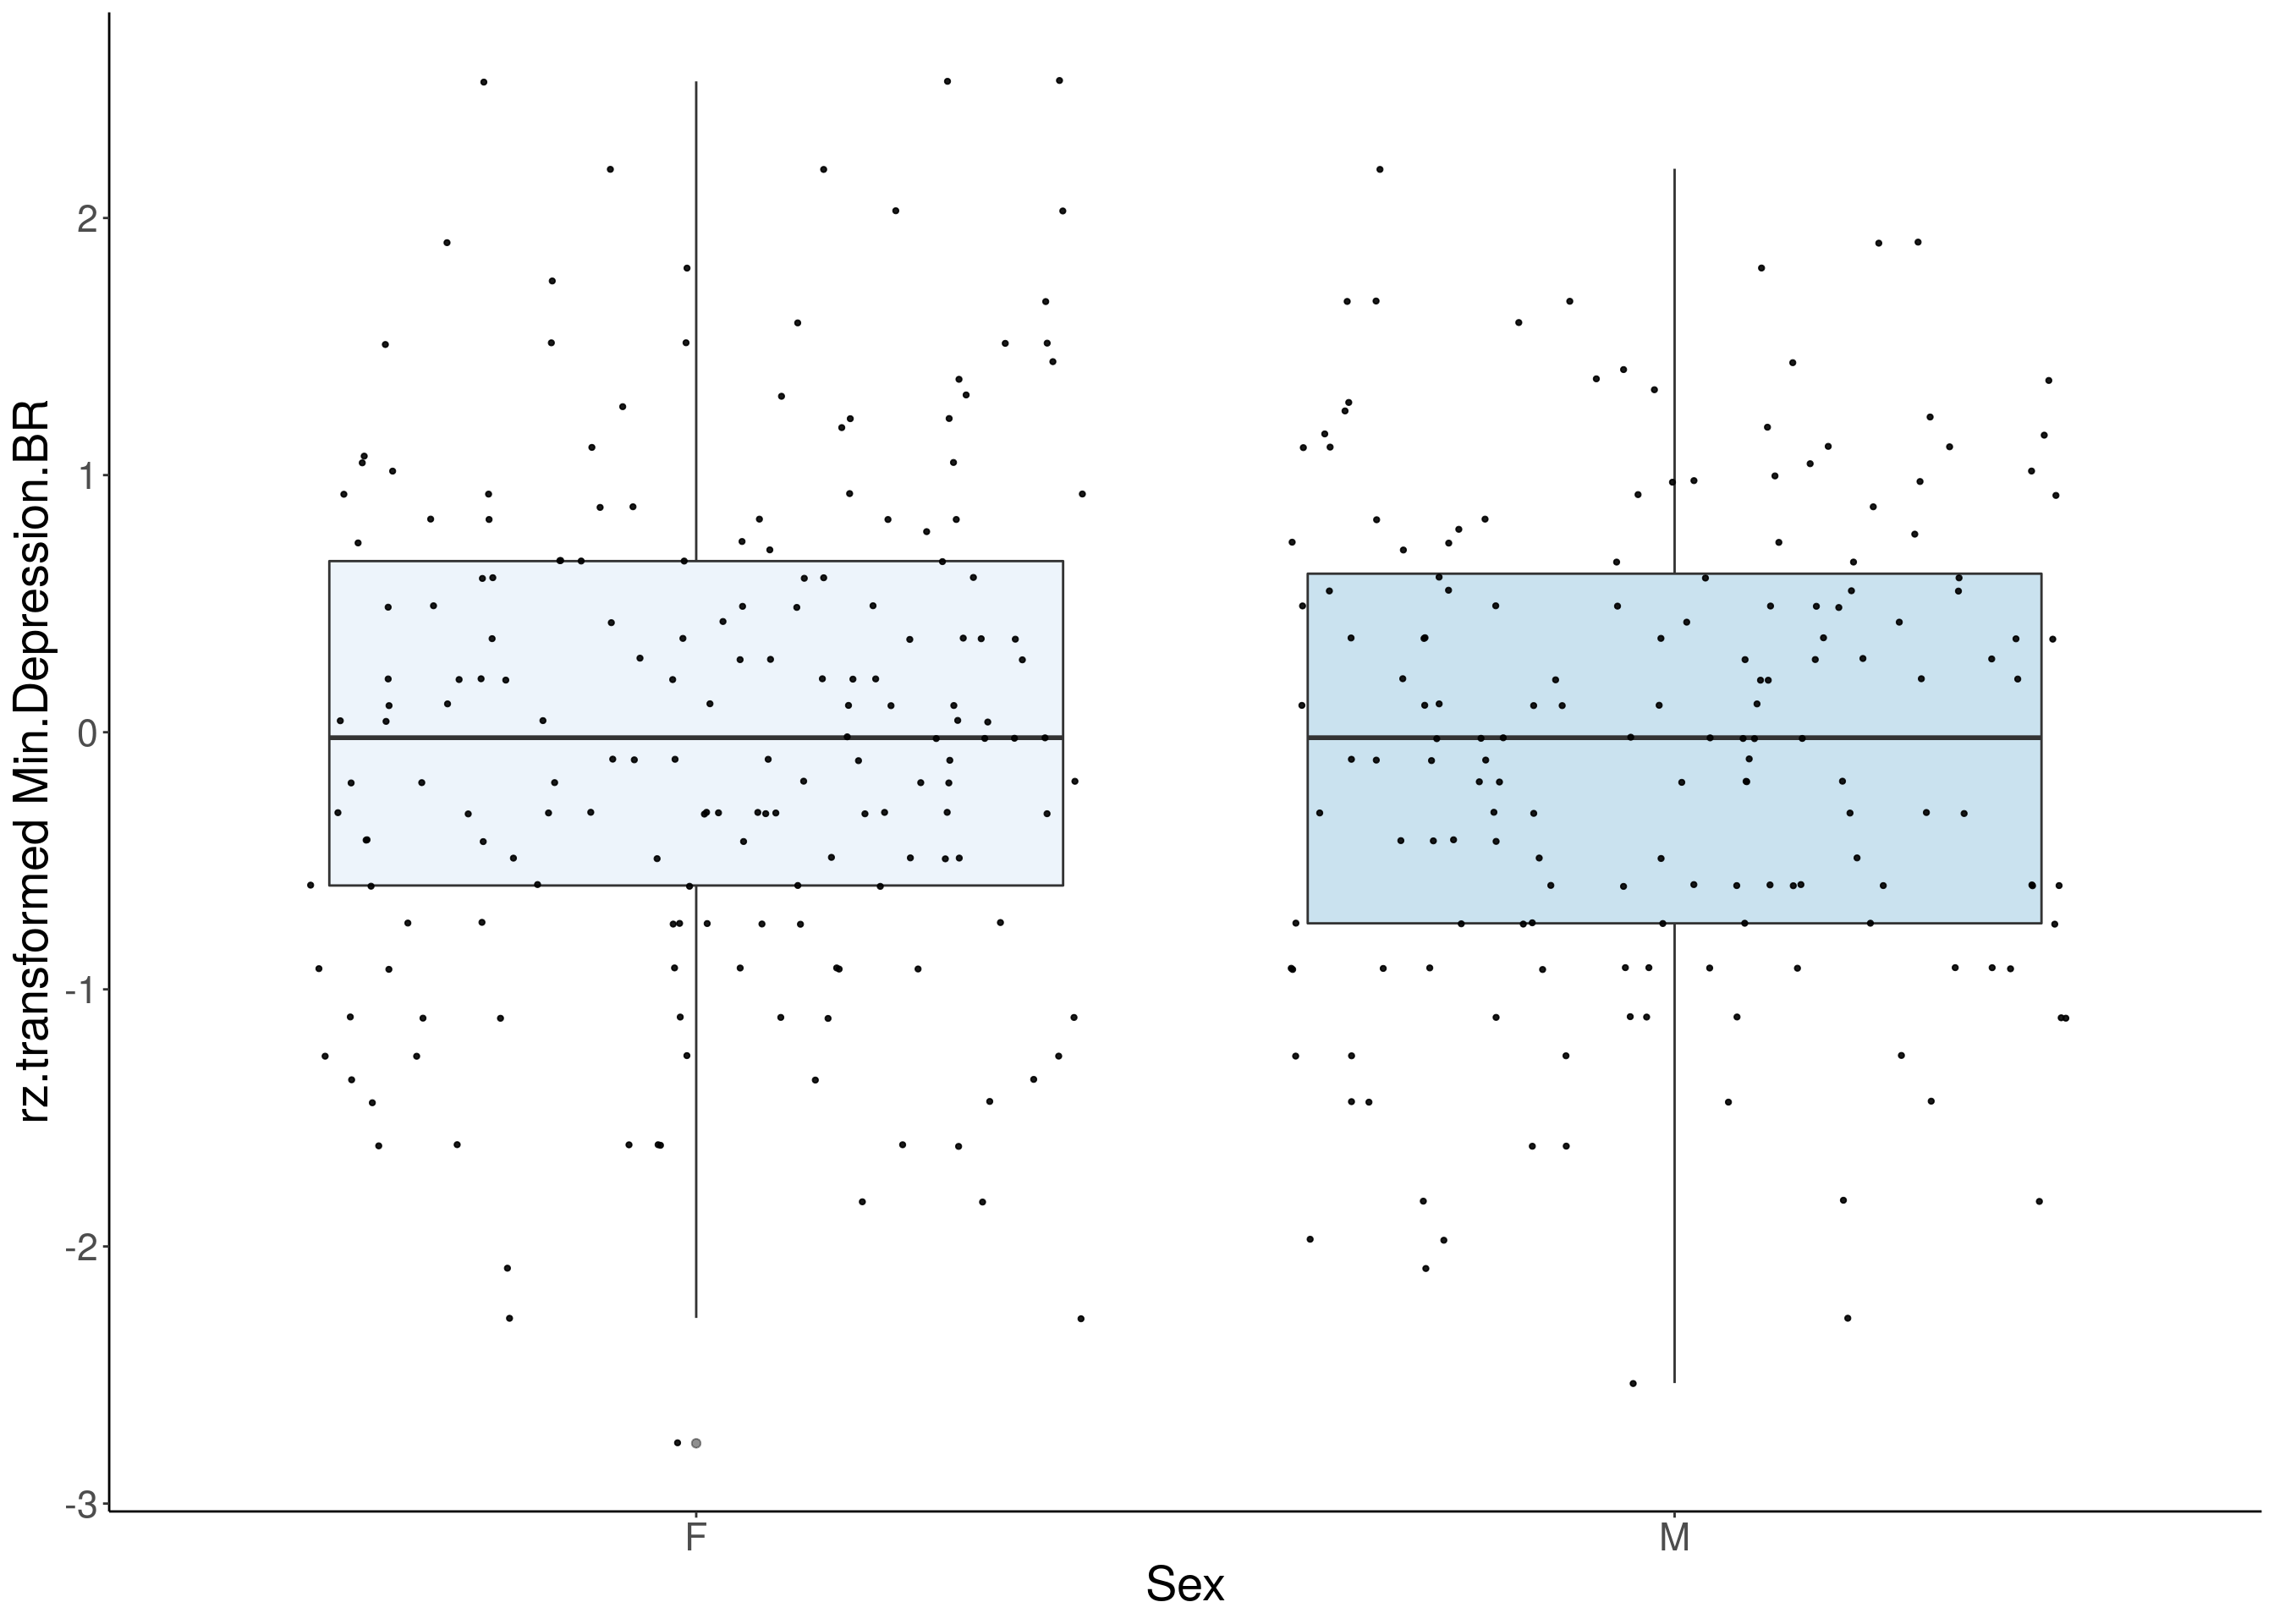
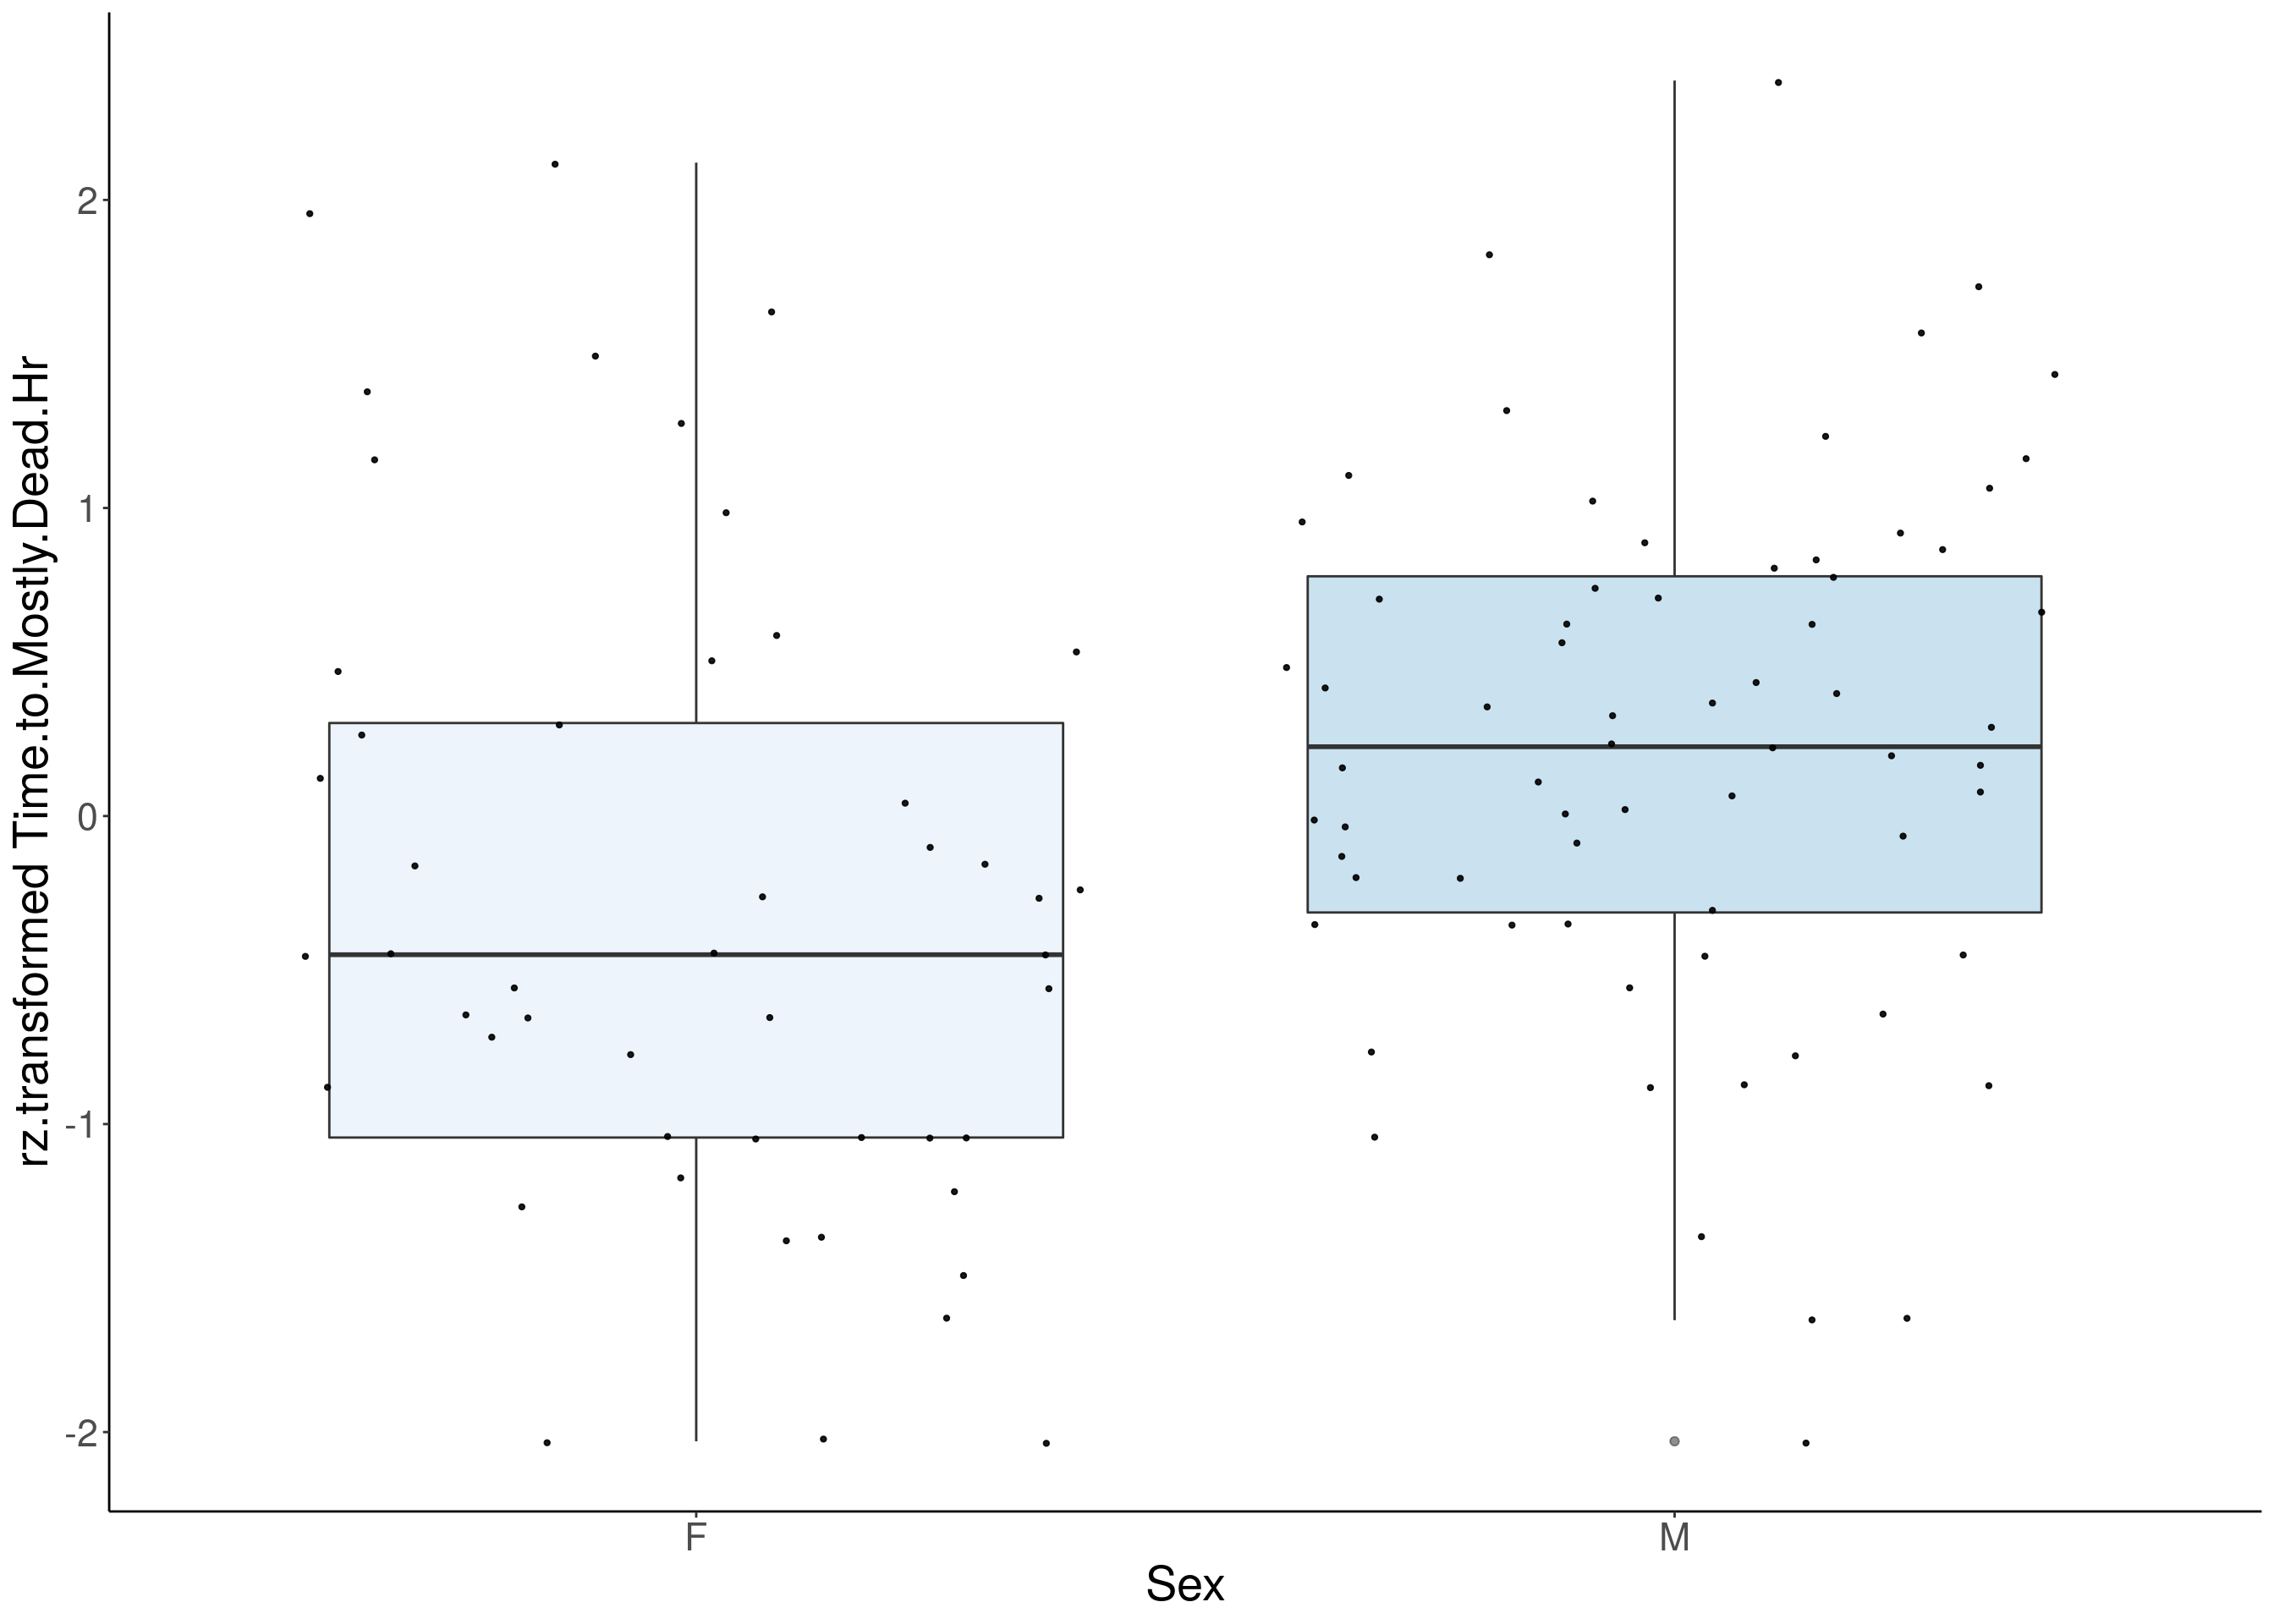
#boxplot on the rankz data------------
for(i in 5:17){
  df <- do.pheno[,c(1,2,i)]
  df <- df[complete.cases(df), ]
  p <- ggplot(df, aes(x=Sex, y= rz.transform(df[,3]), group = Sex, fill = Sex, alpha = 0.9)) +
    geom_boxplot(show.legend = F , outlier.size = 1.5, notchwidth = 0.85) +
    geom_jitter(color="black", size=0.8, alpha=0.9) +
    scale_fill_brewer(palette="Blues") +
    ylab(paste0("rz.transformed ", colnames(df)[3])) +
    xlab("Sex") +
    labs(fill = "") +
    theme(legend.position = "none",
          panel.grid.major = element_blank(),
          panel.grid.minor = element_blank(),
          panel.background = element_blank(),
          axis.line = element_line(colour = "black"),
          text = element_text(size=21),
          axis.title=element_text(size=21)) +
    guides(shape = guide_legend(override.aes = list(size = 12)))
  print(p)
}

#histogram
for(i in 5:17){
  df <- do.pheno[,c(1,2,i)]
  p <- ggplot(data=df, aes(x=rz.transform(df[,3]))) +
    geom_histogram() +
    ylab("Number of DO mice") +
    xlab(paste0("rz.transformed ", colnames(df)[3])) +
    theme(panel.grid.major = element_blank(), panel.grid.minor = element_blank(),
          panel.background = element_blank(), axis.line = element_line(colour = "black"),
          text = element_text(size=21))
  print(p)
}
# Warning: Removed 337 rows containing non-finite values (stat_bin).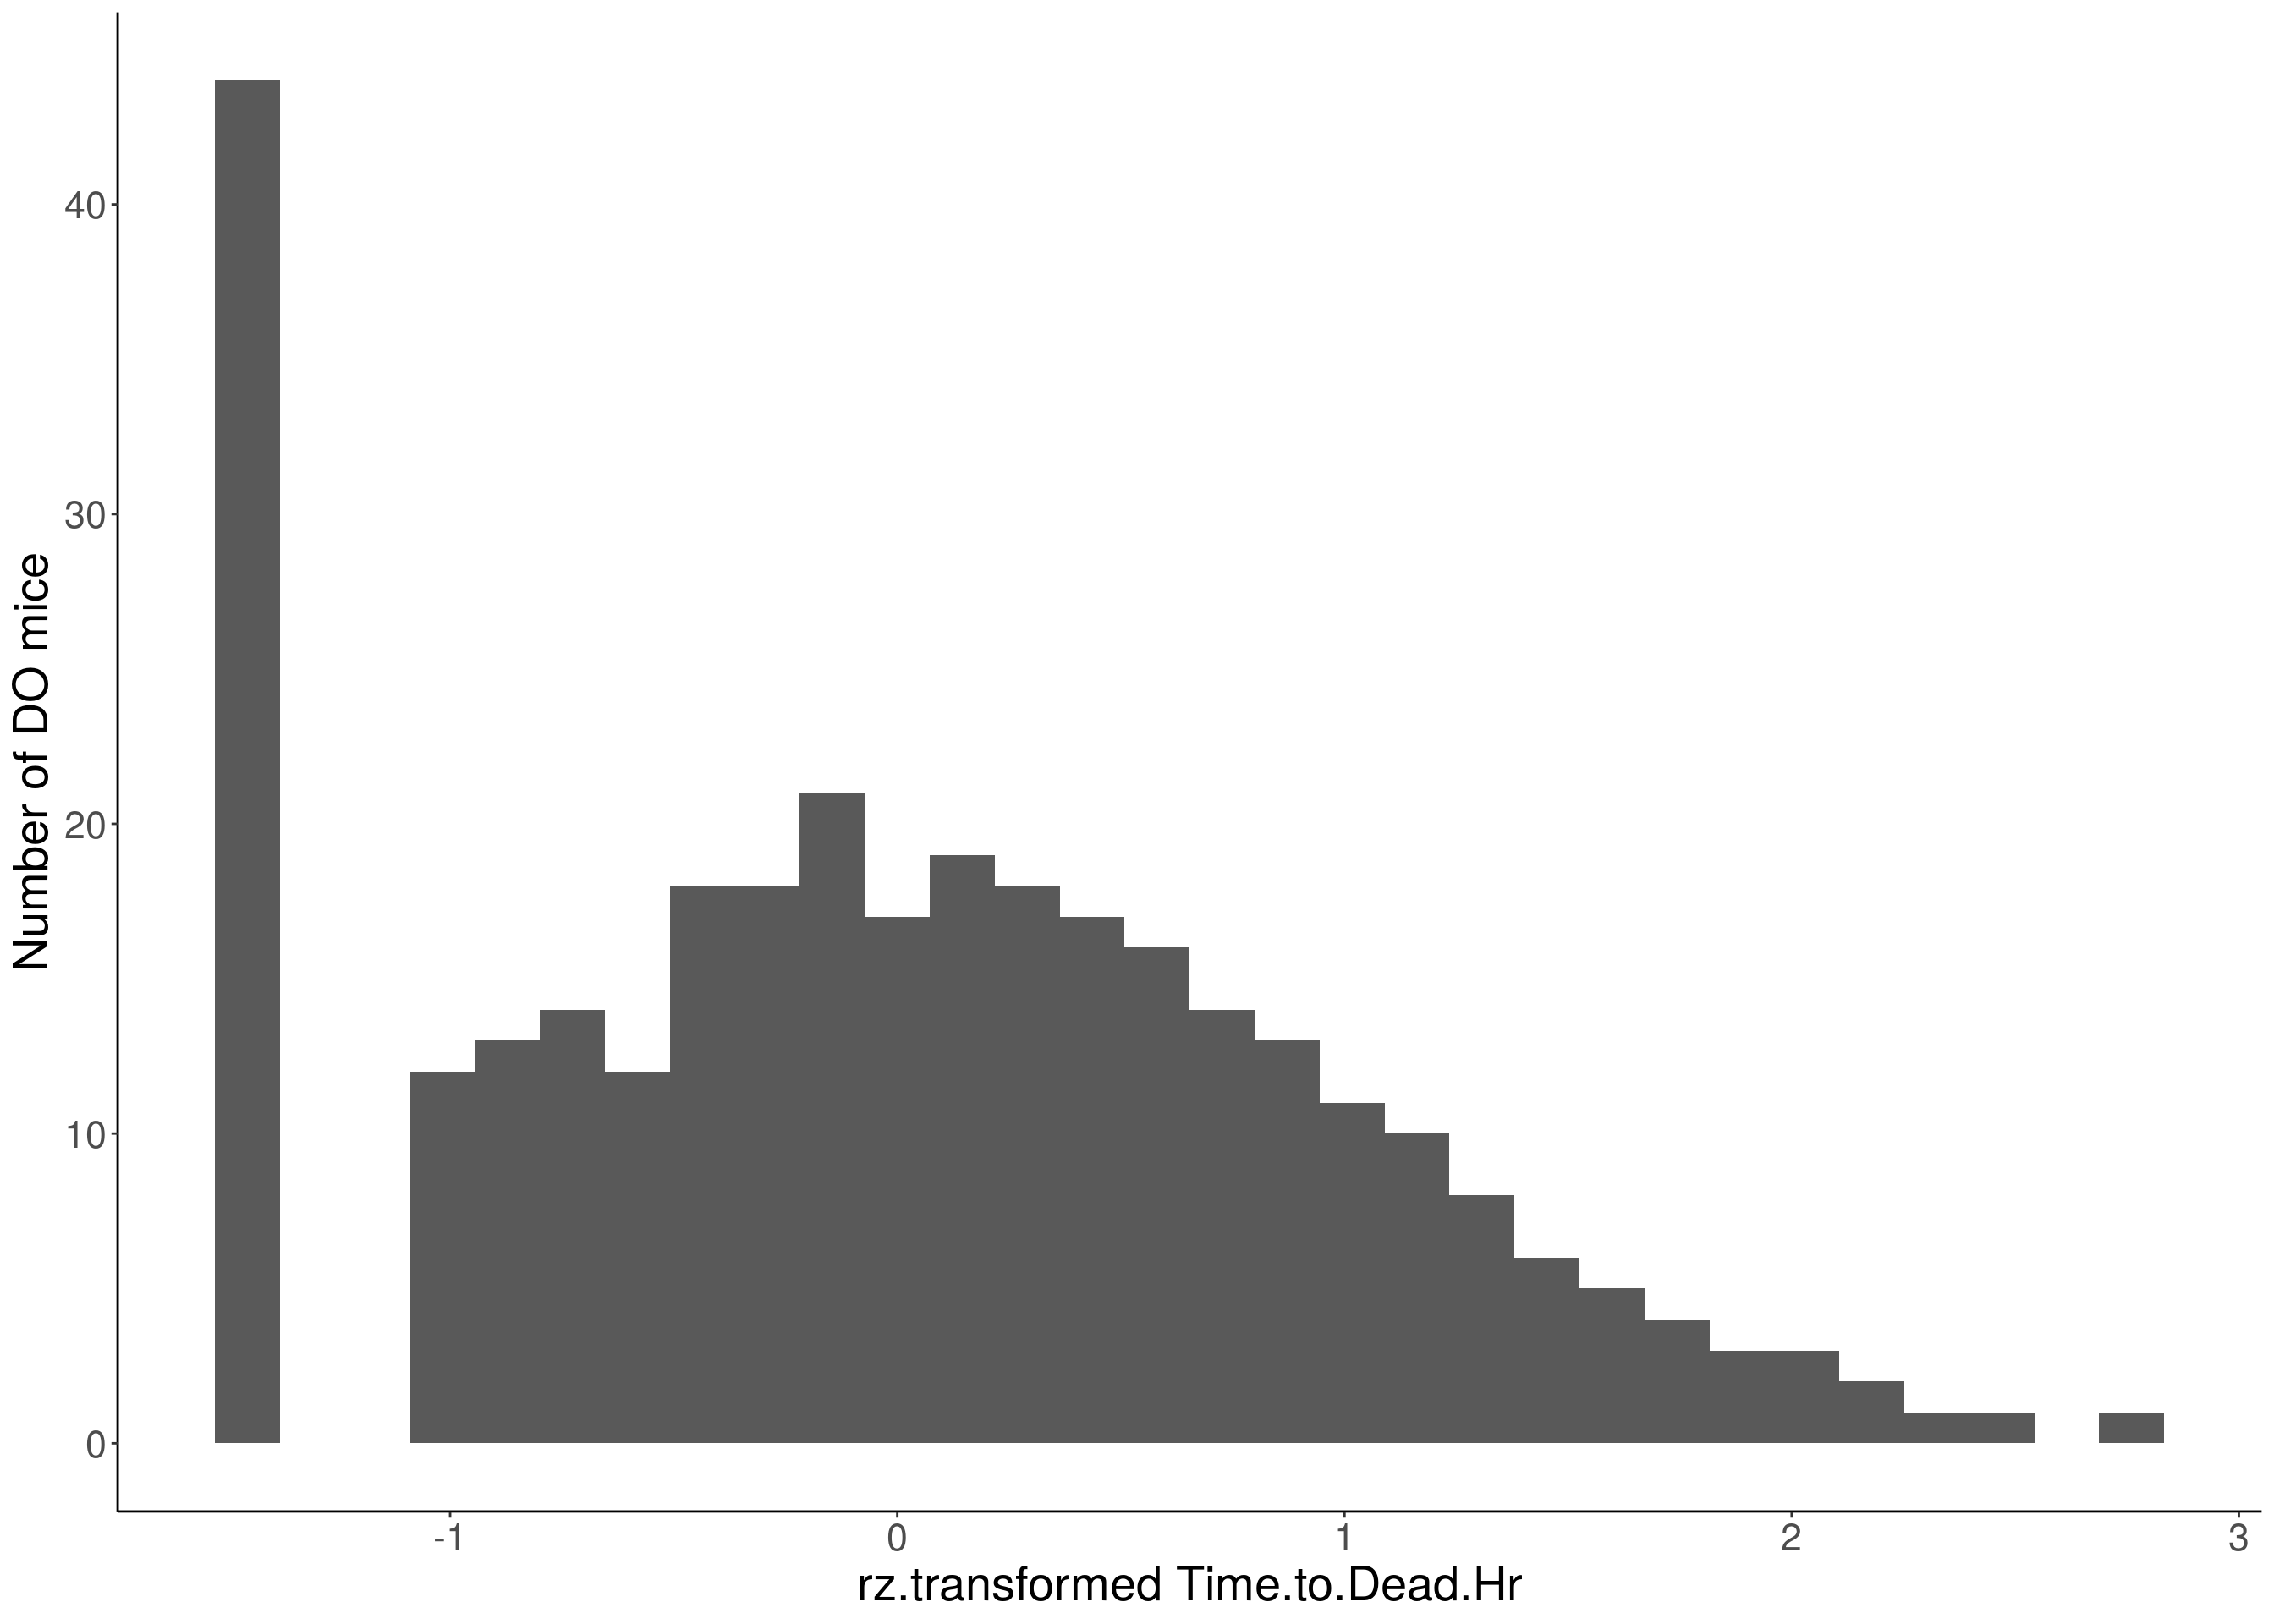
# Warning: Removed 85 rows containing non-finite values (stat_bin).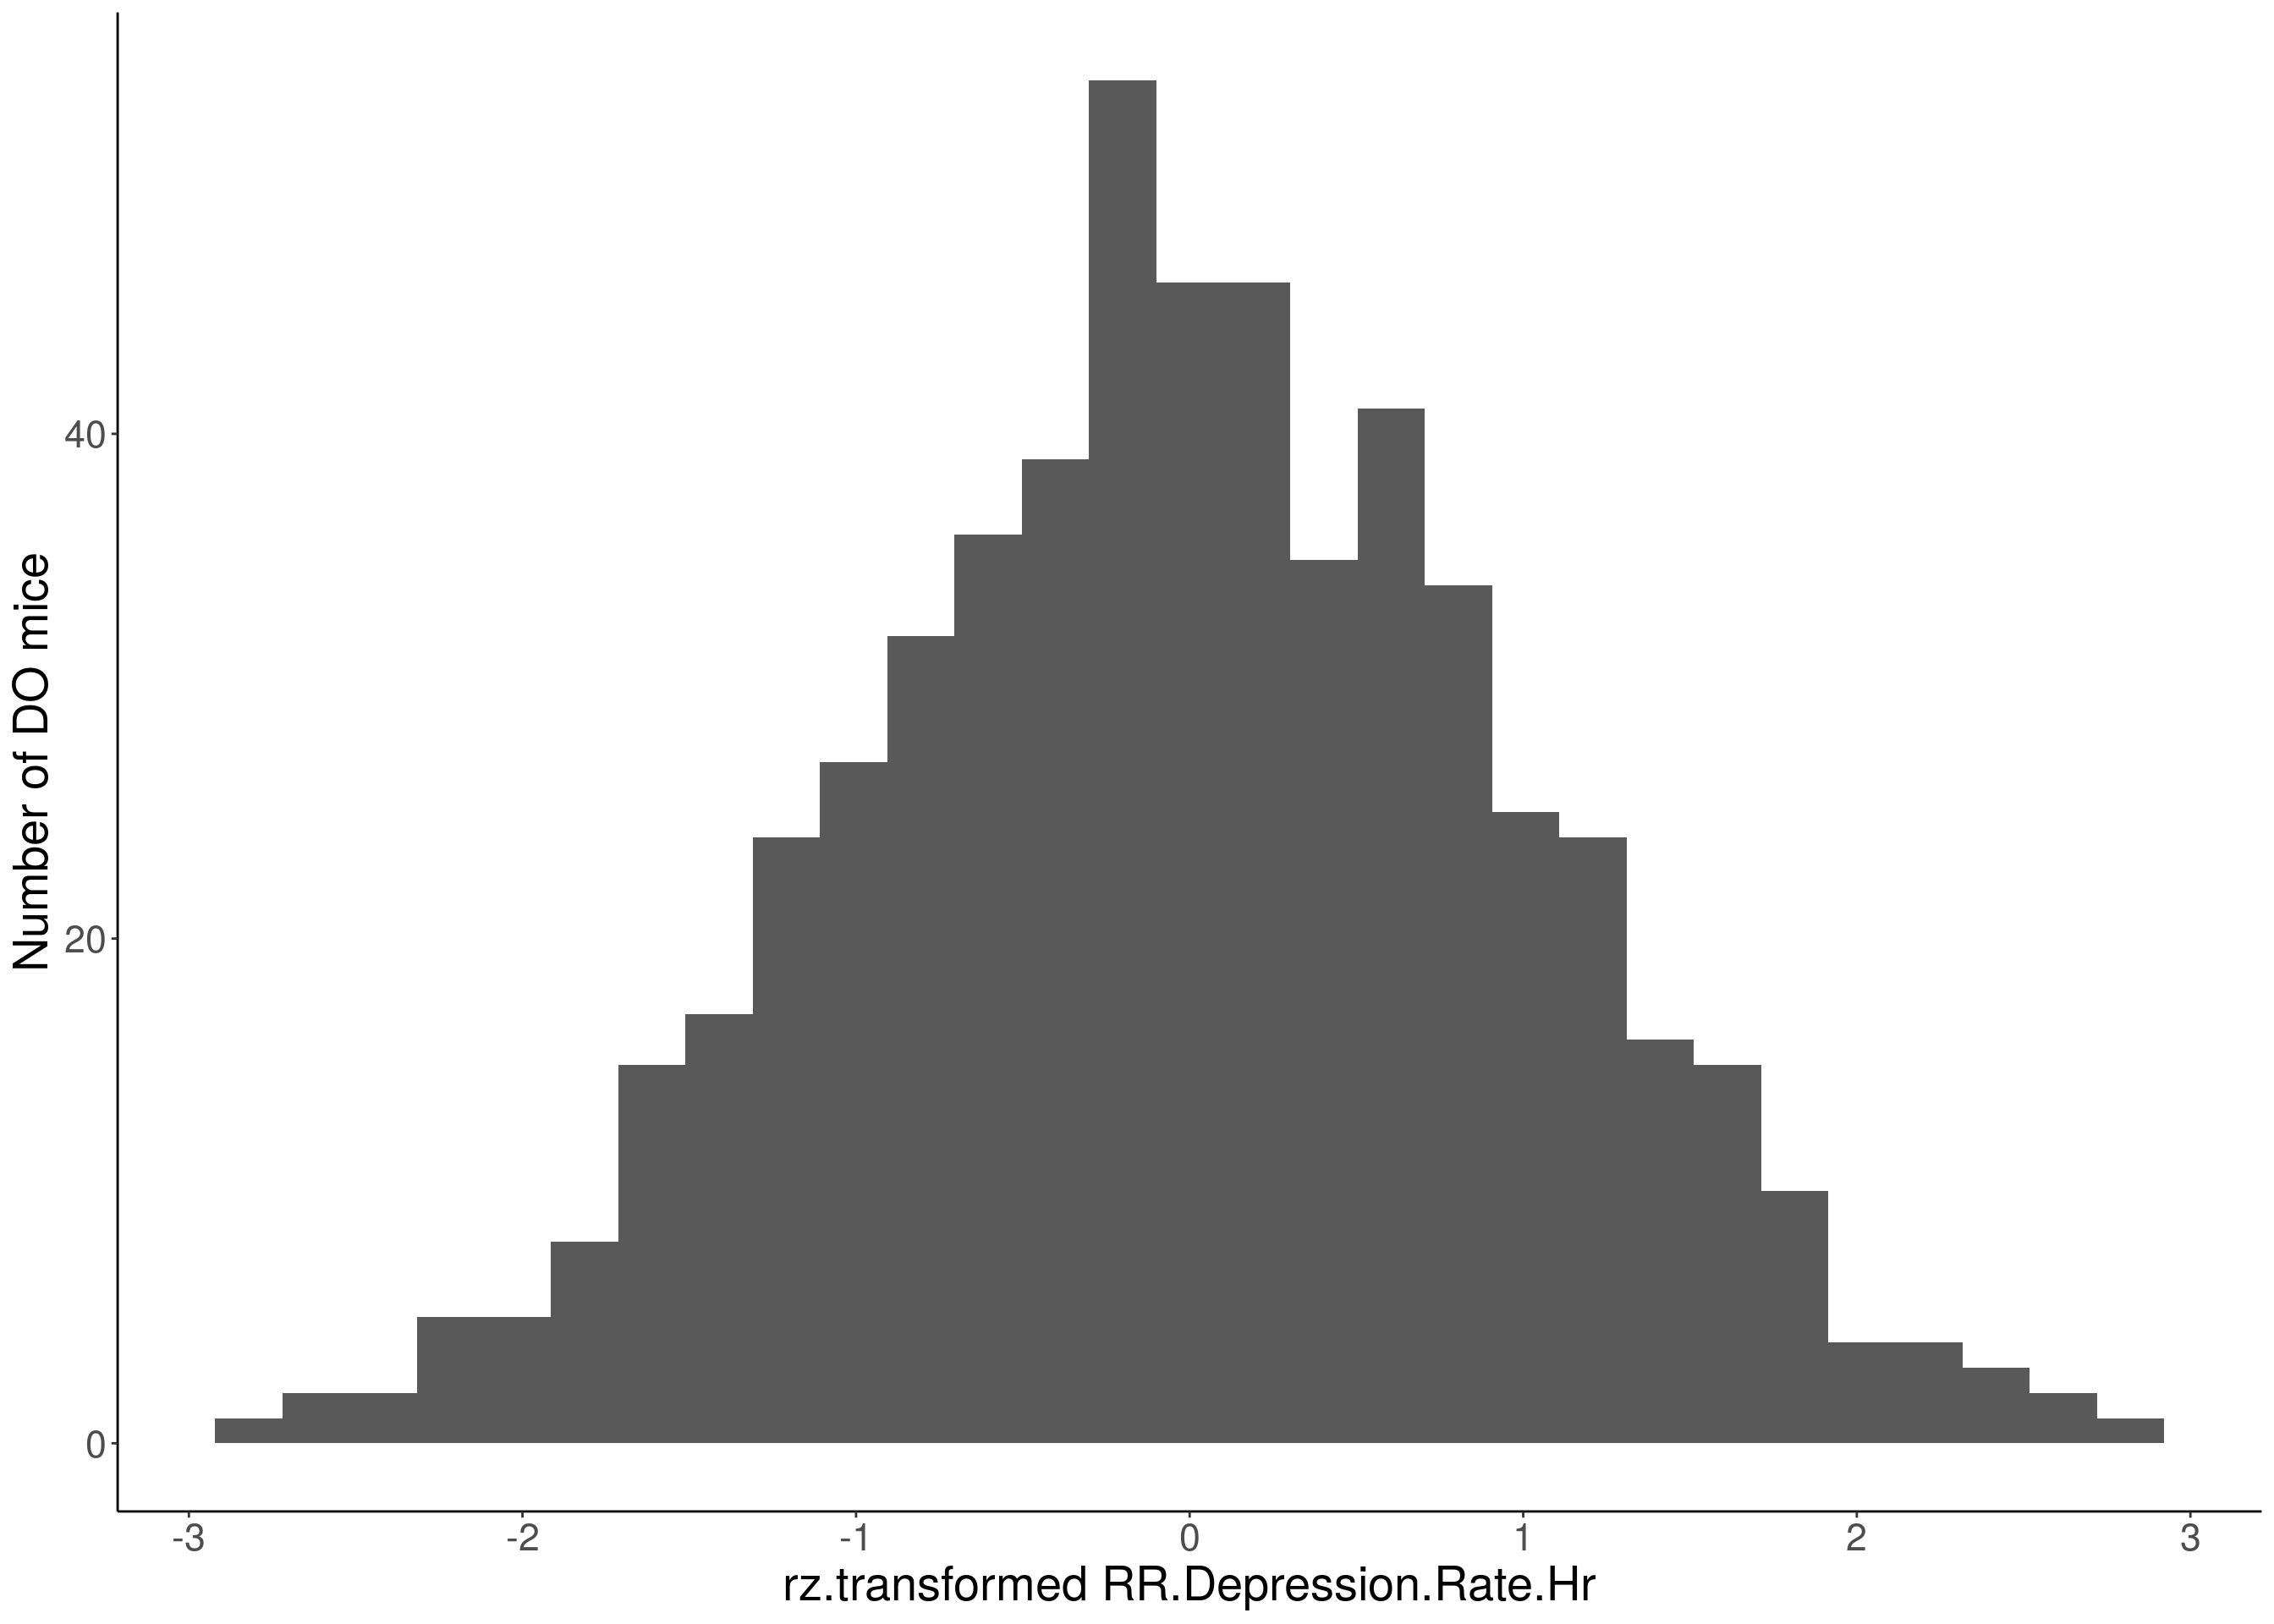
# Warning: Removed 85 rows containing non-finite values (stat_bin).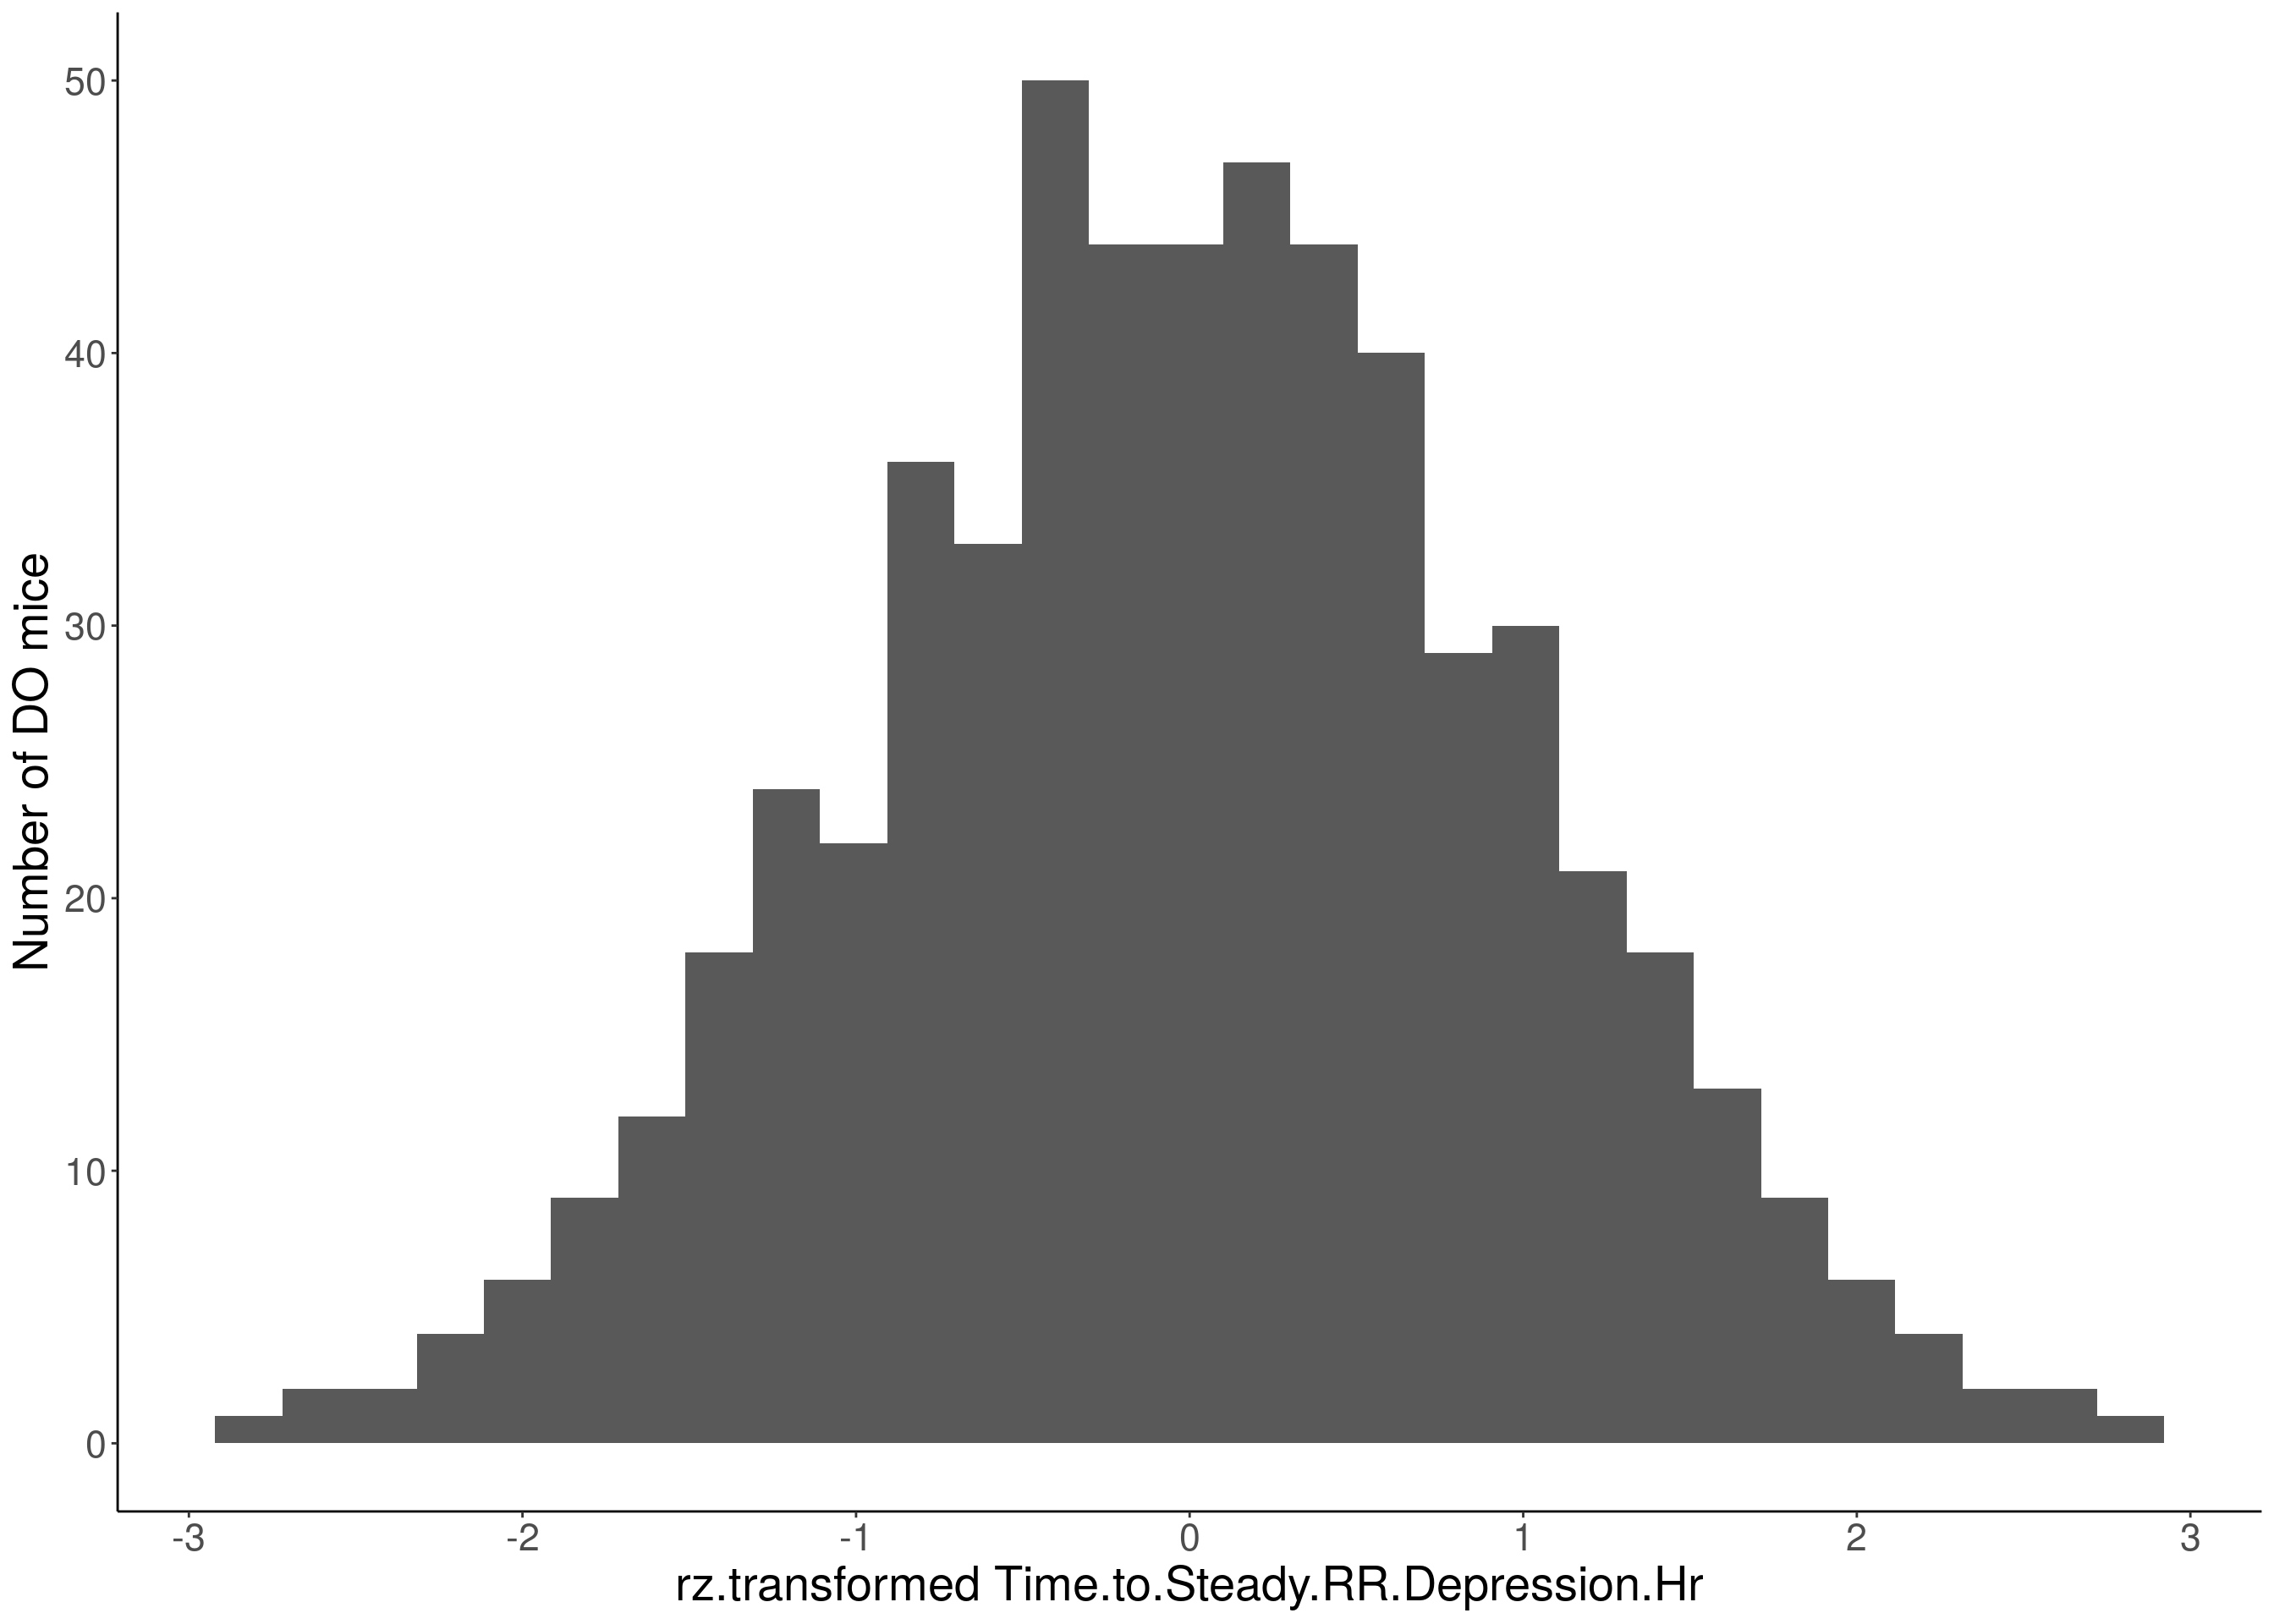
# Warning: Removed 85 rows containing non-finite values (stat_bin).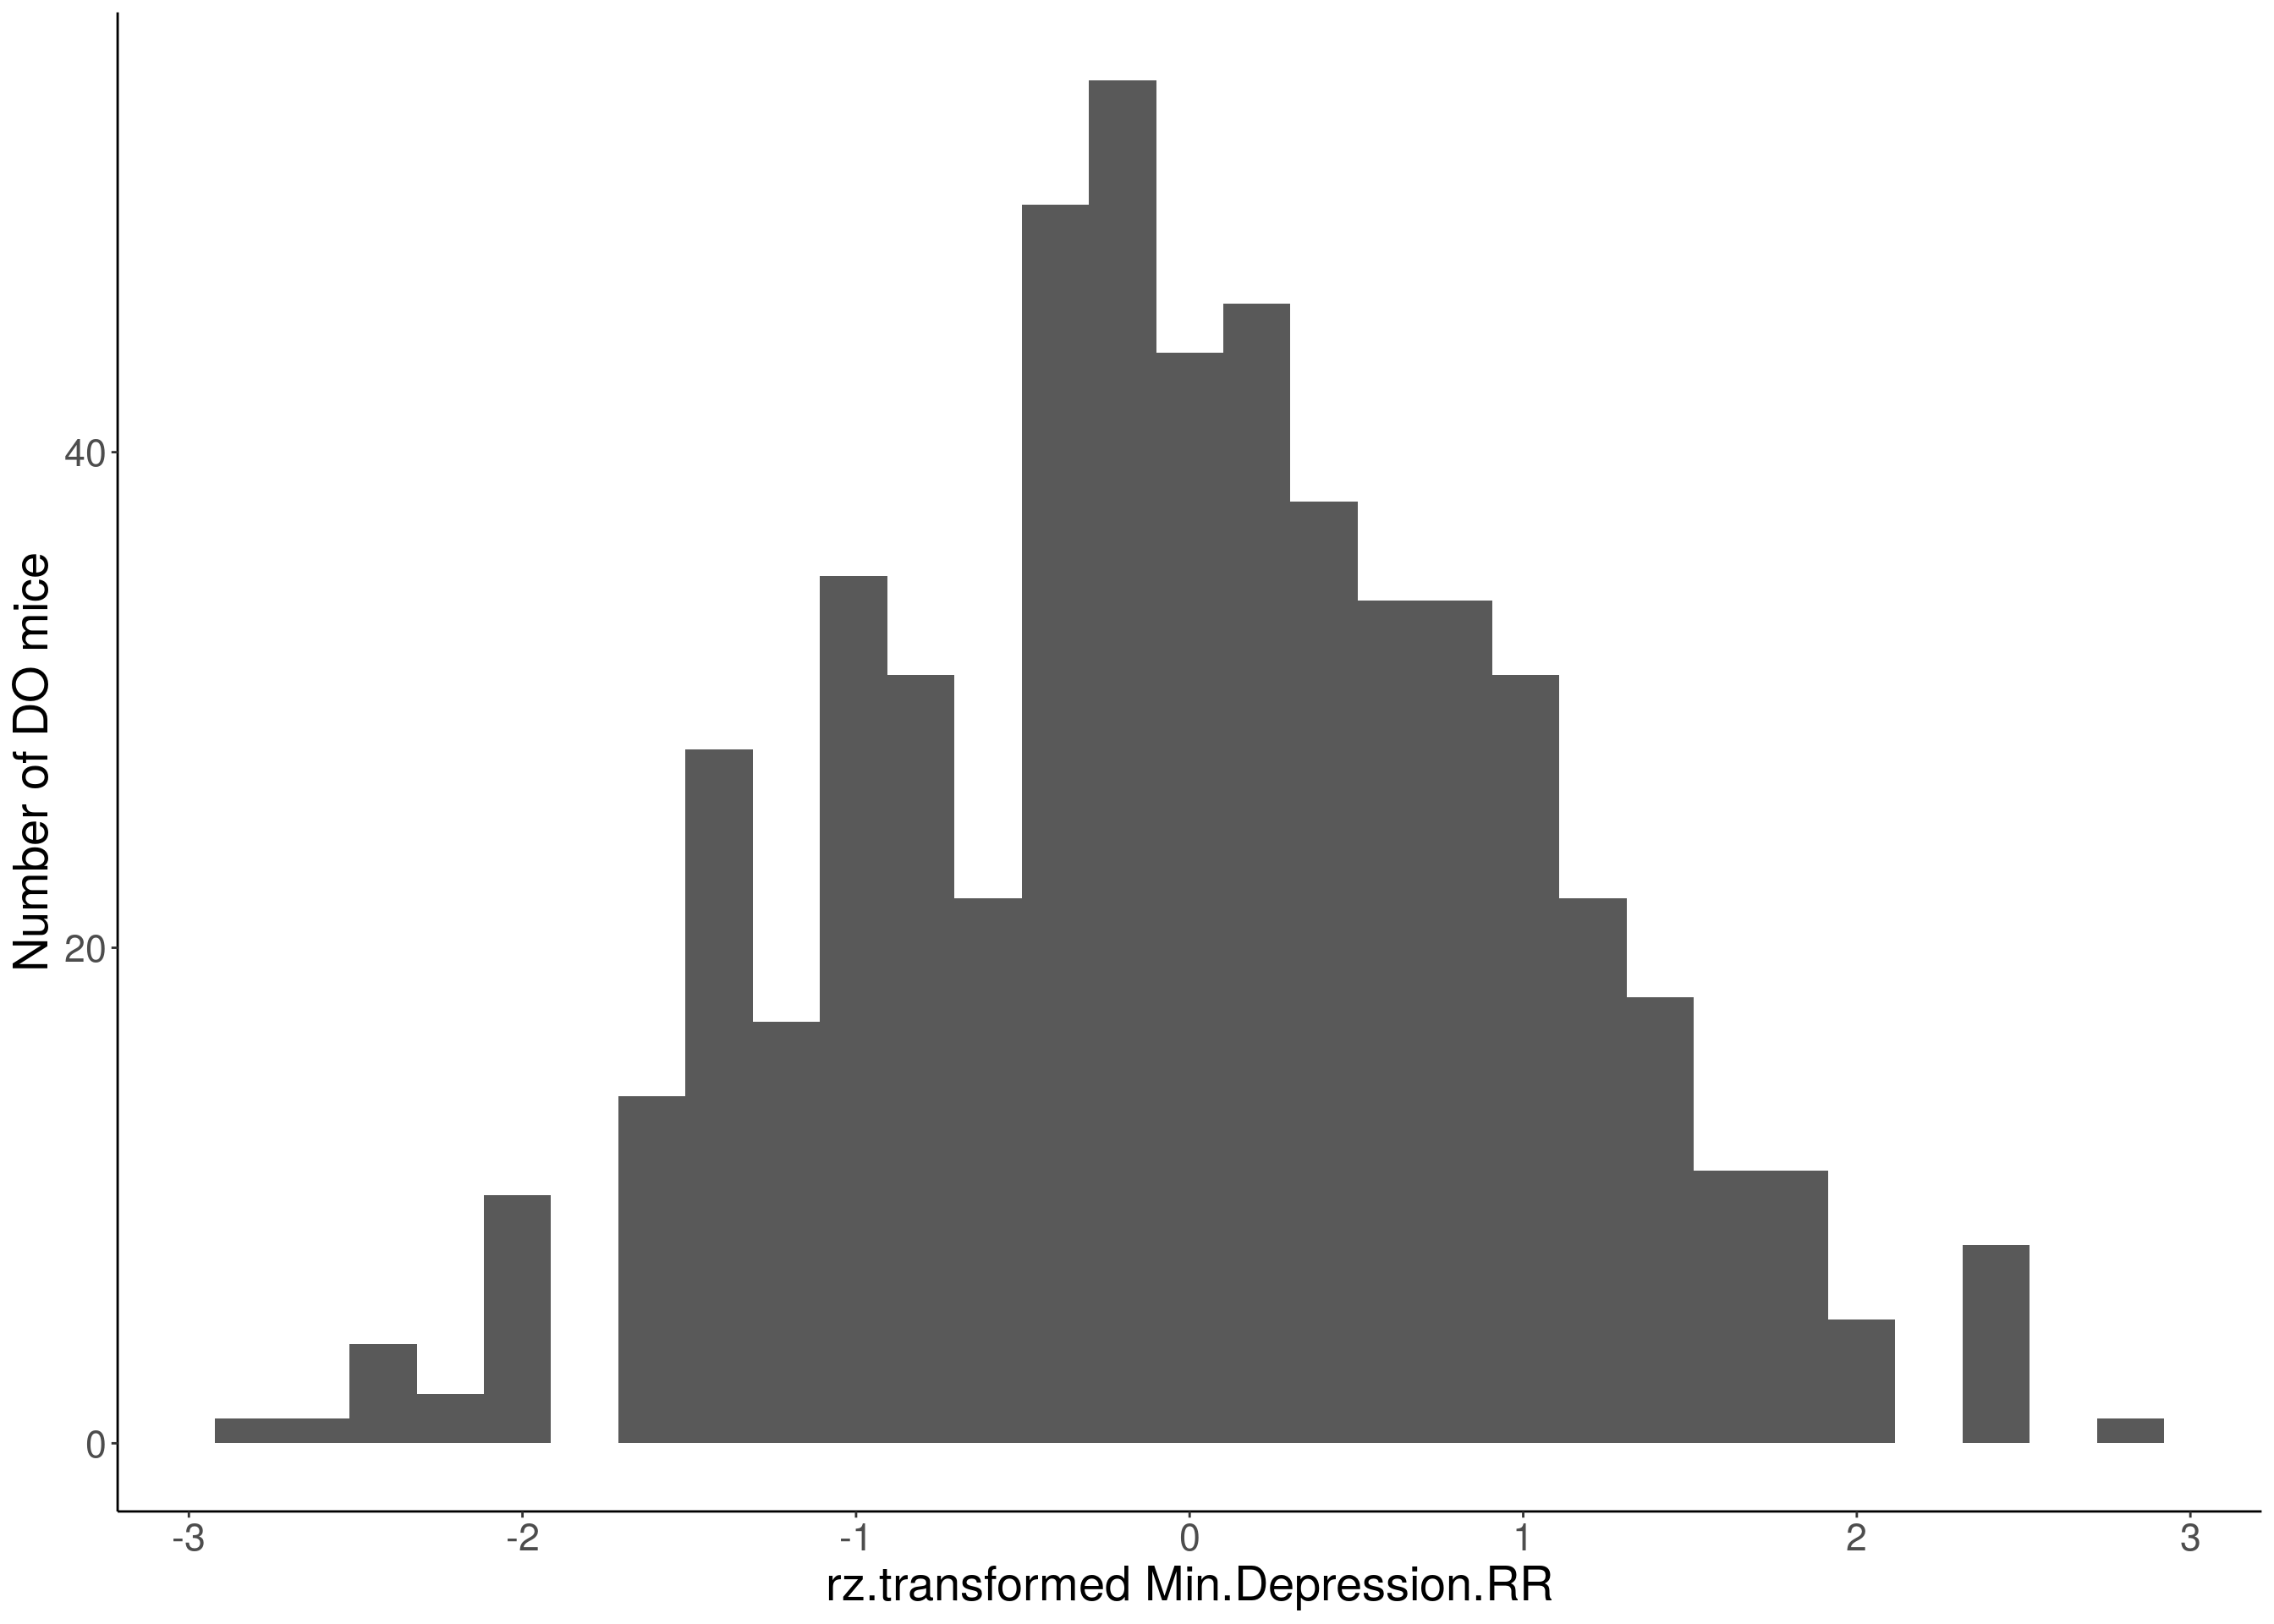
# Warning: Removed 355 rows containing non-finite values (stat_bin).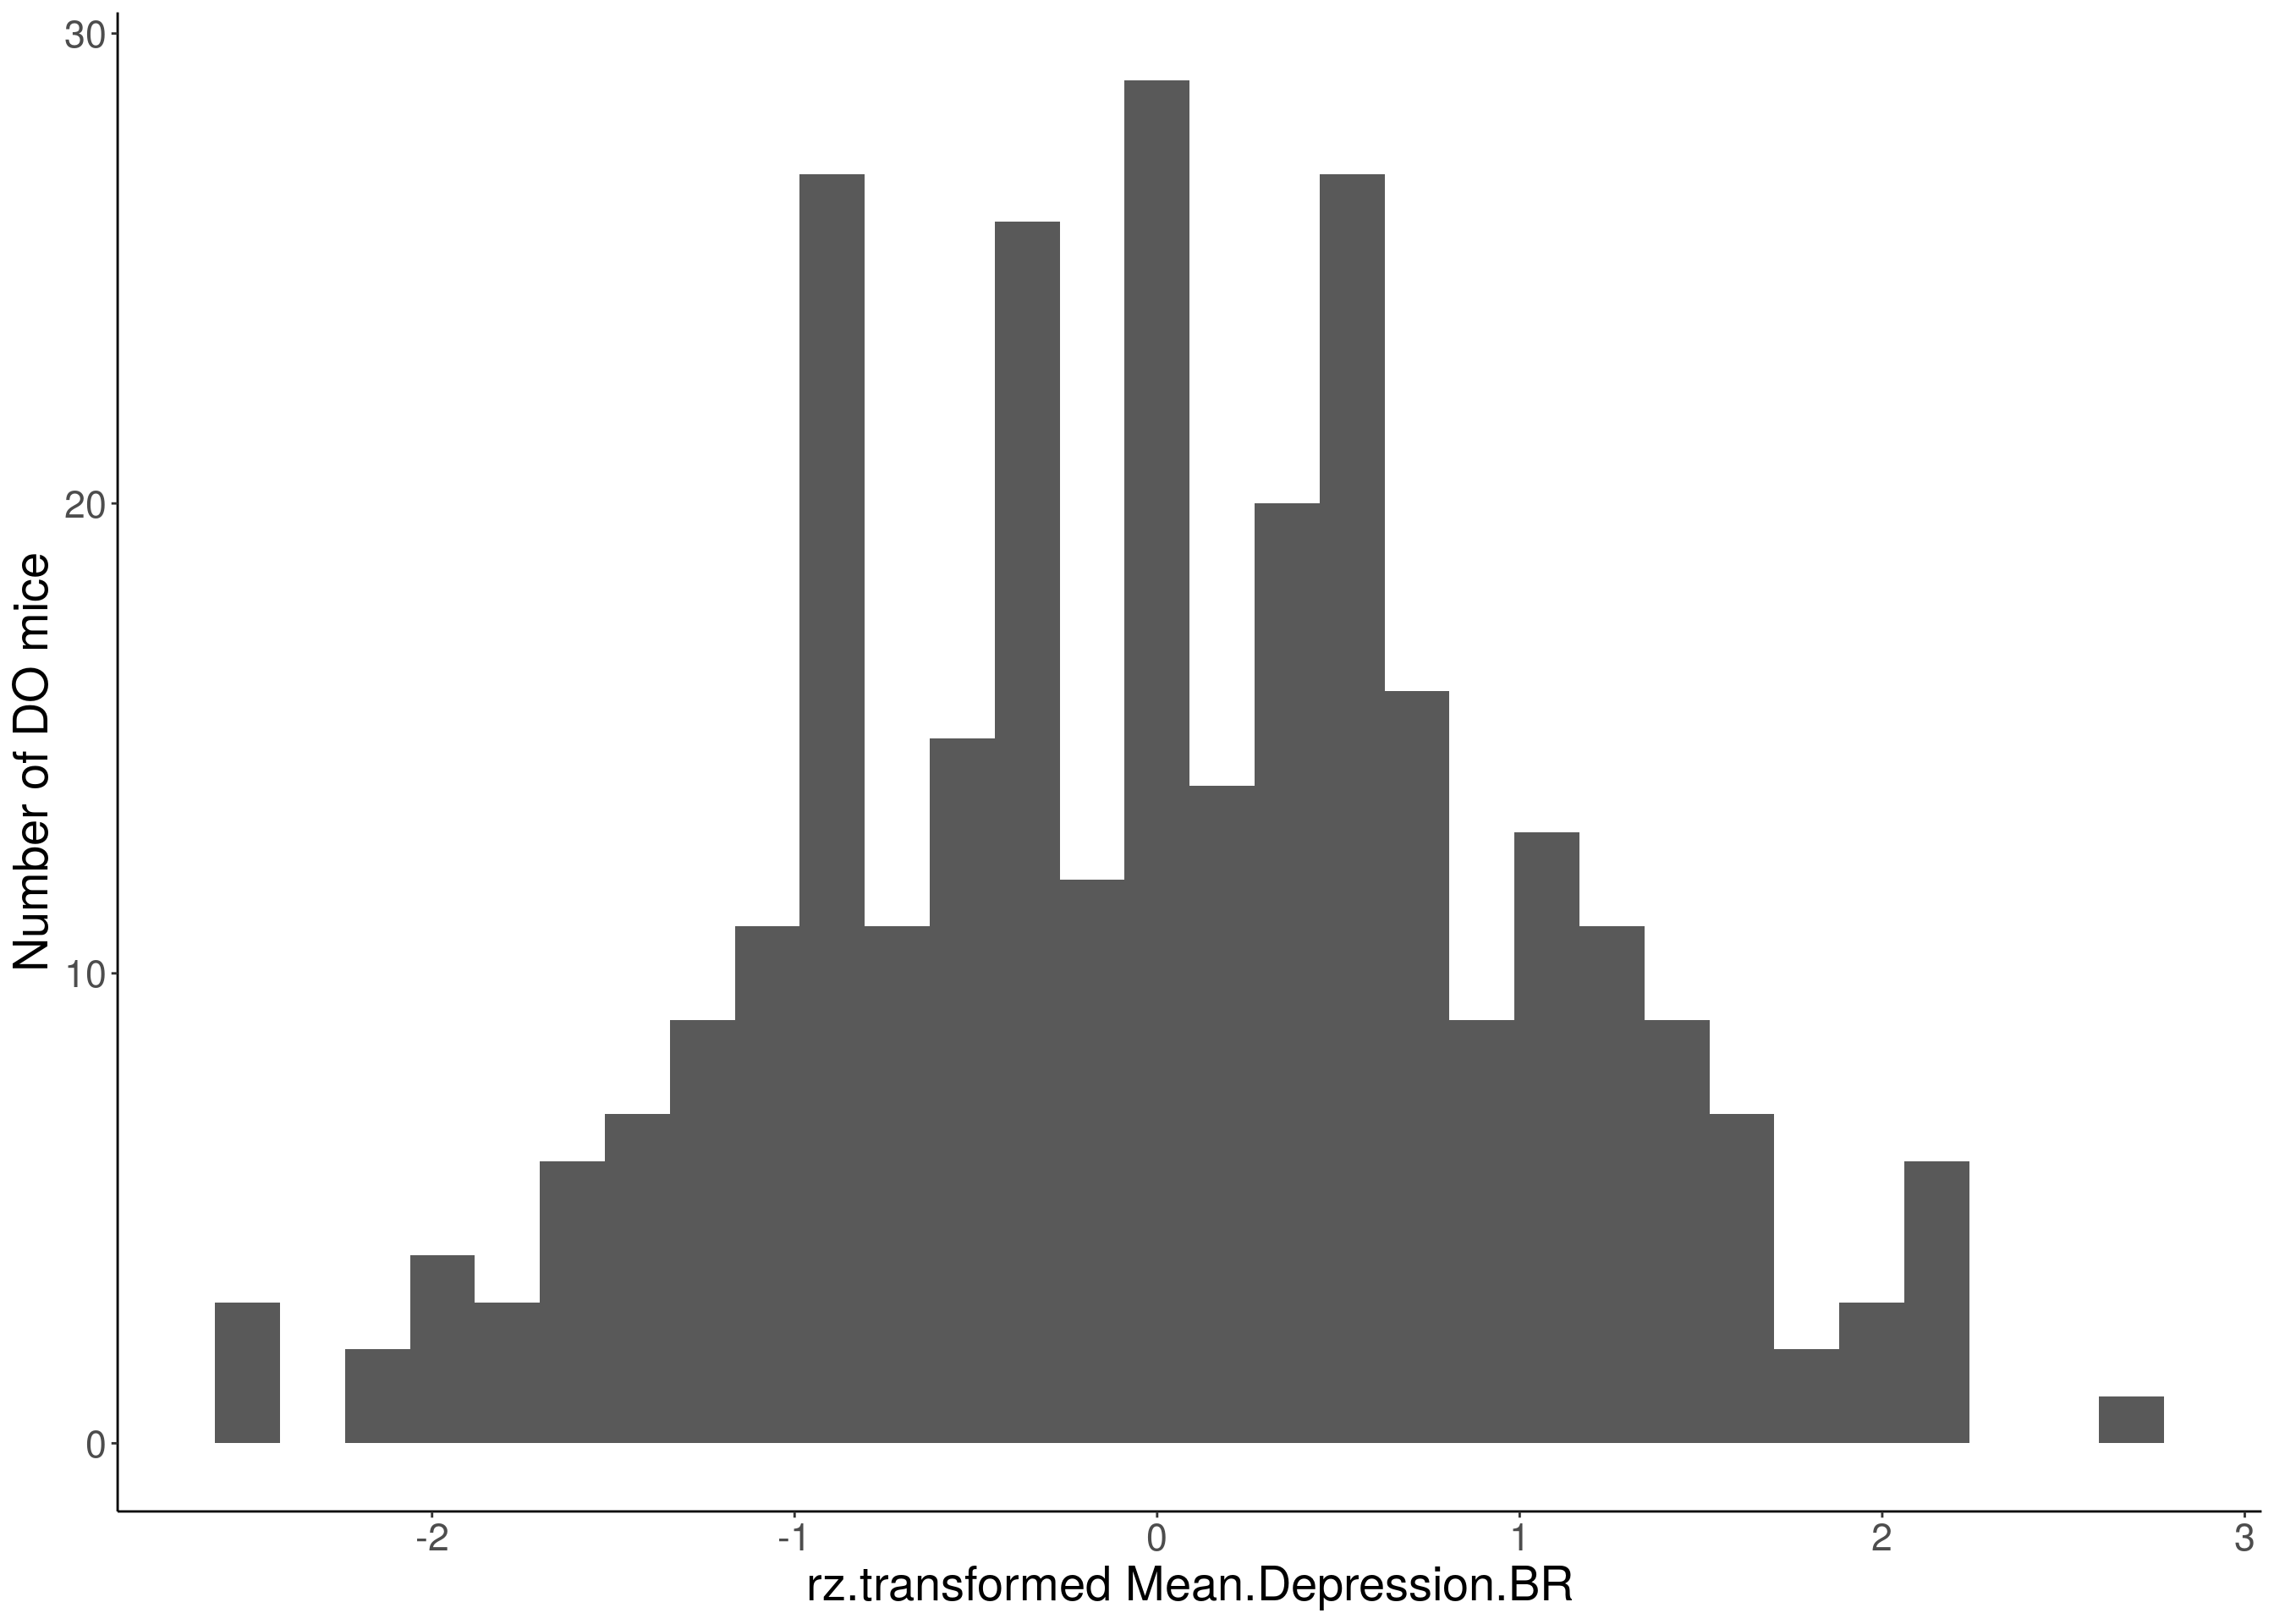
# Warning: Removed 484 rows containing non-finite values (stat_bin).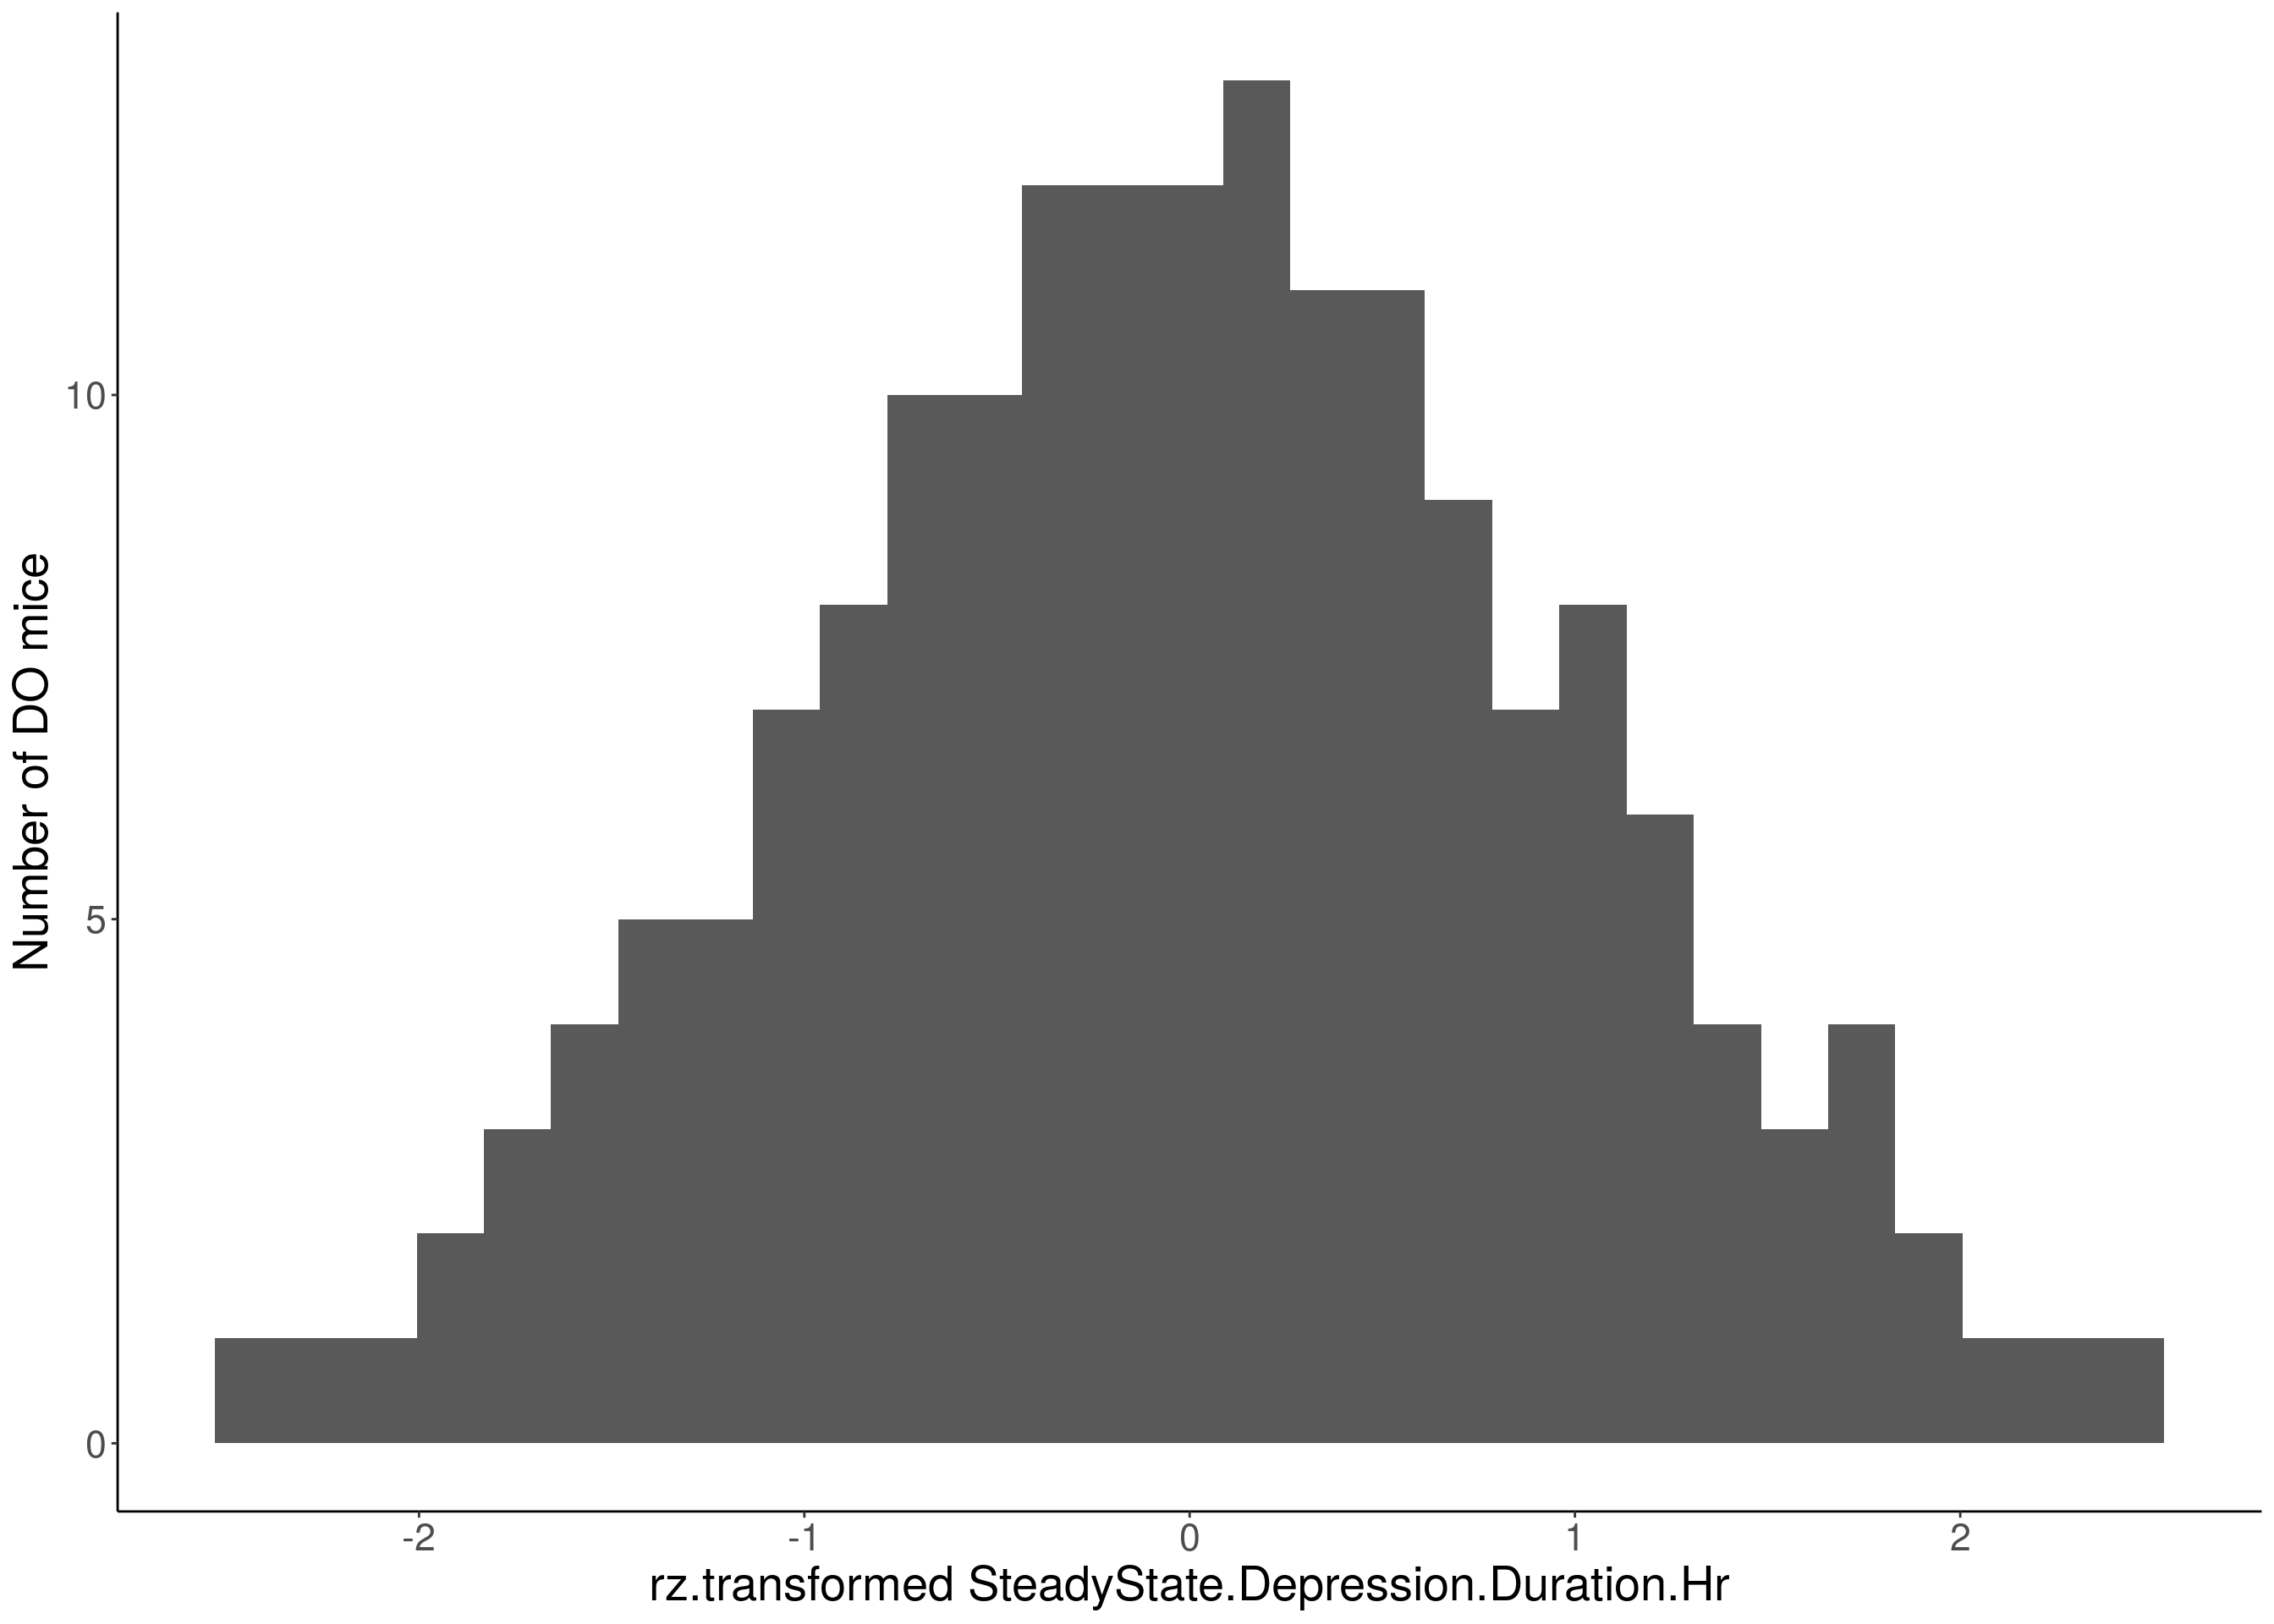
# Warning: Removed 509 rows containing non-finite values (stat_bin).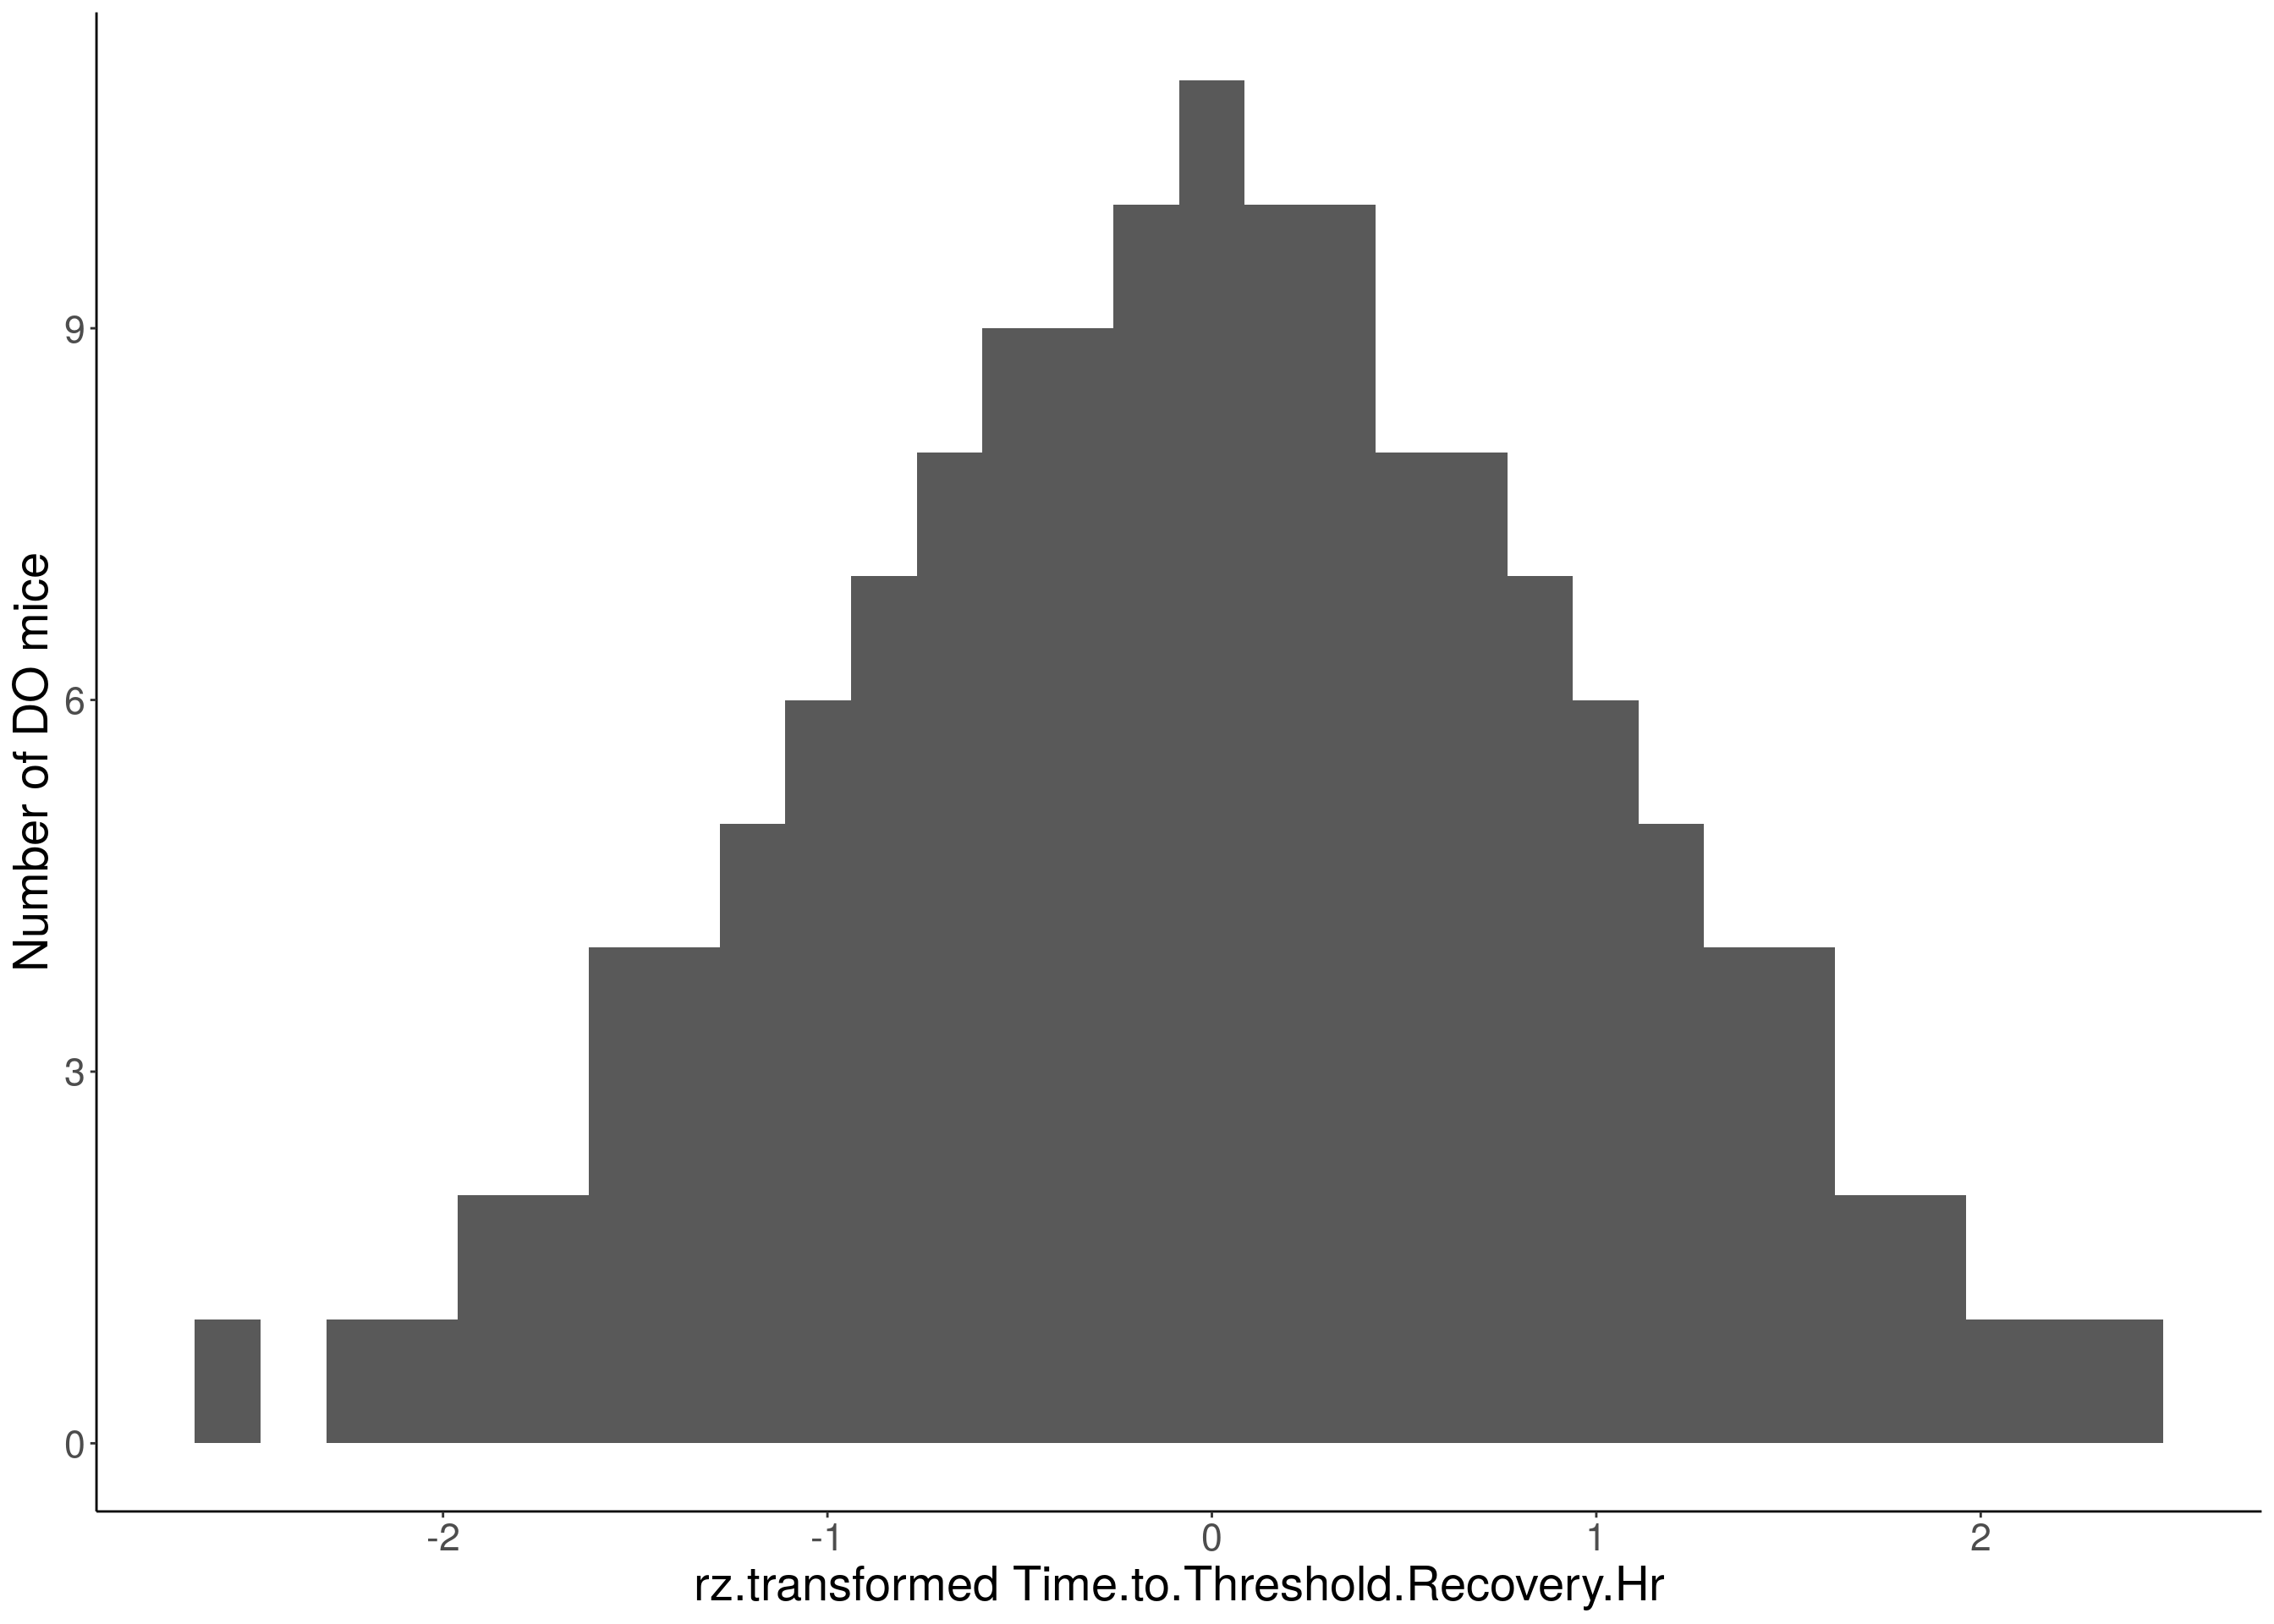
# Warning: Removed 504 rows containing non-finite values (stat_bin).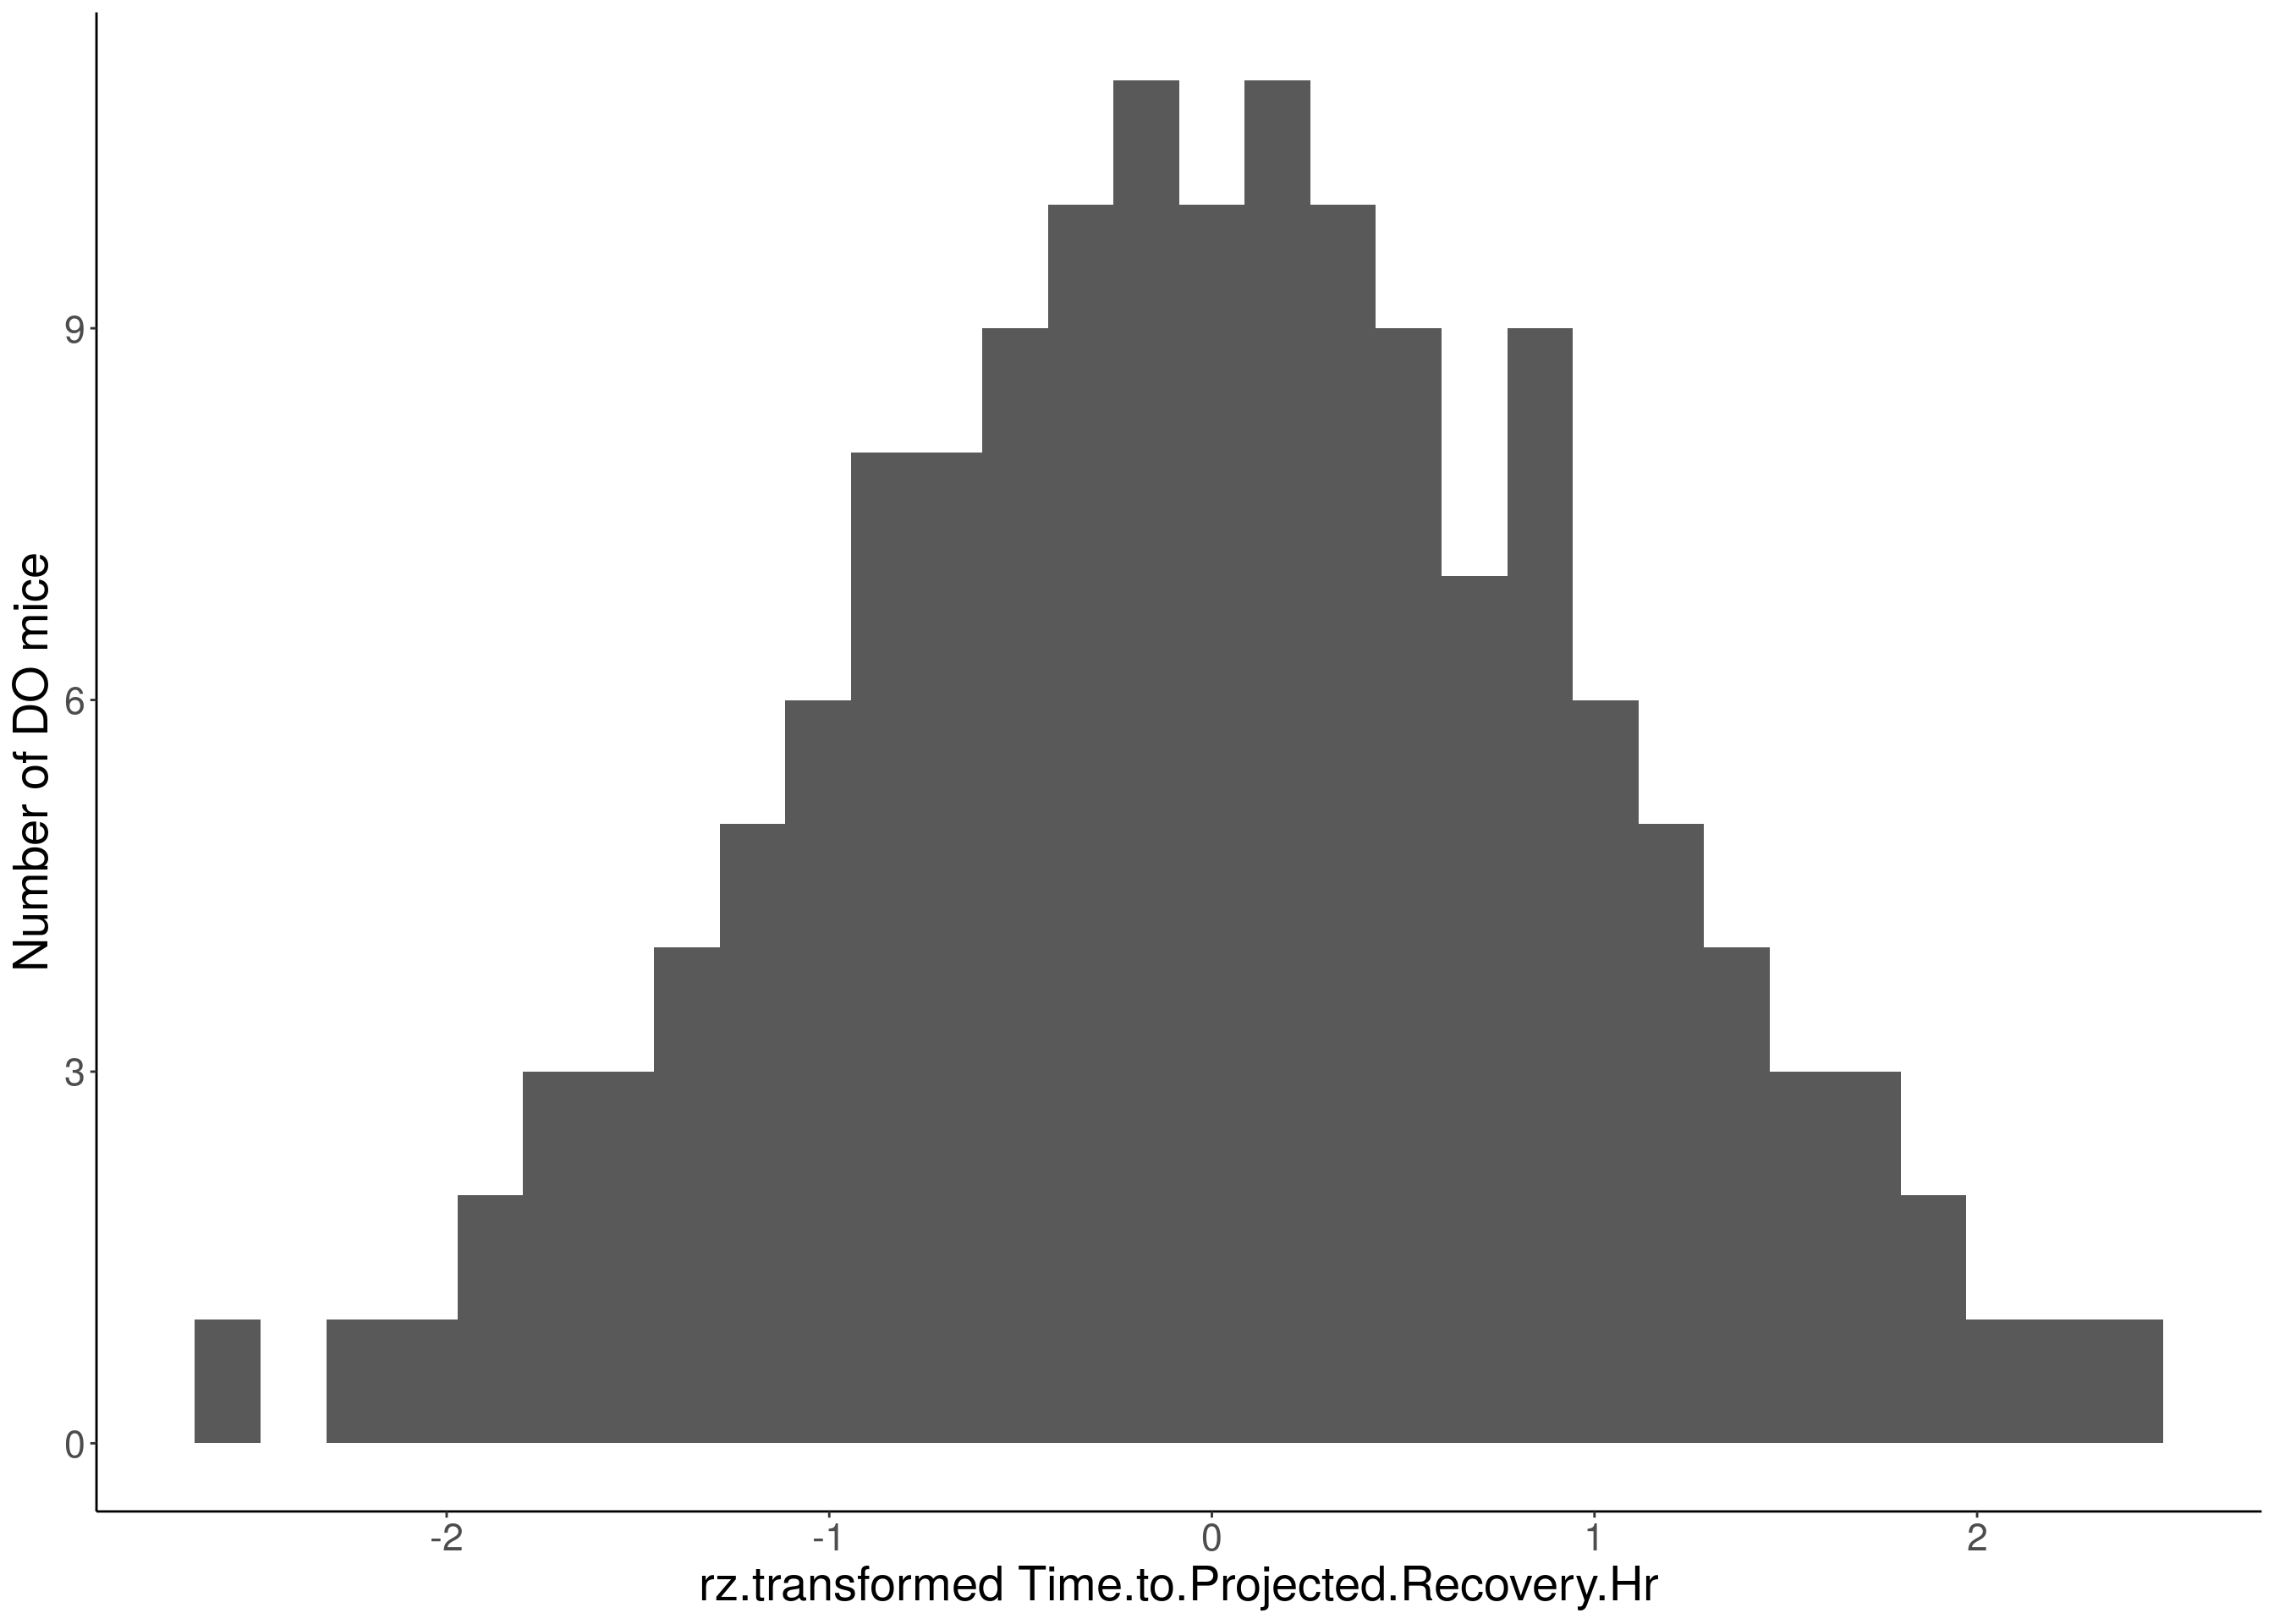
# Warning: Removed 484 rows containing non-finite values (stat_bin).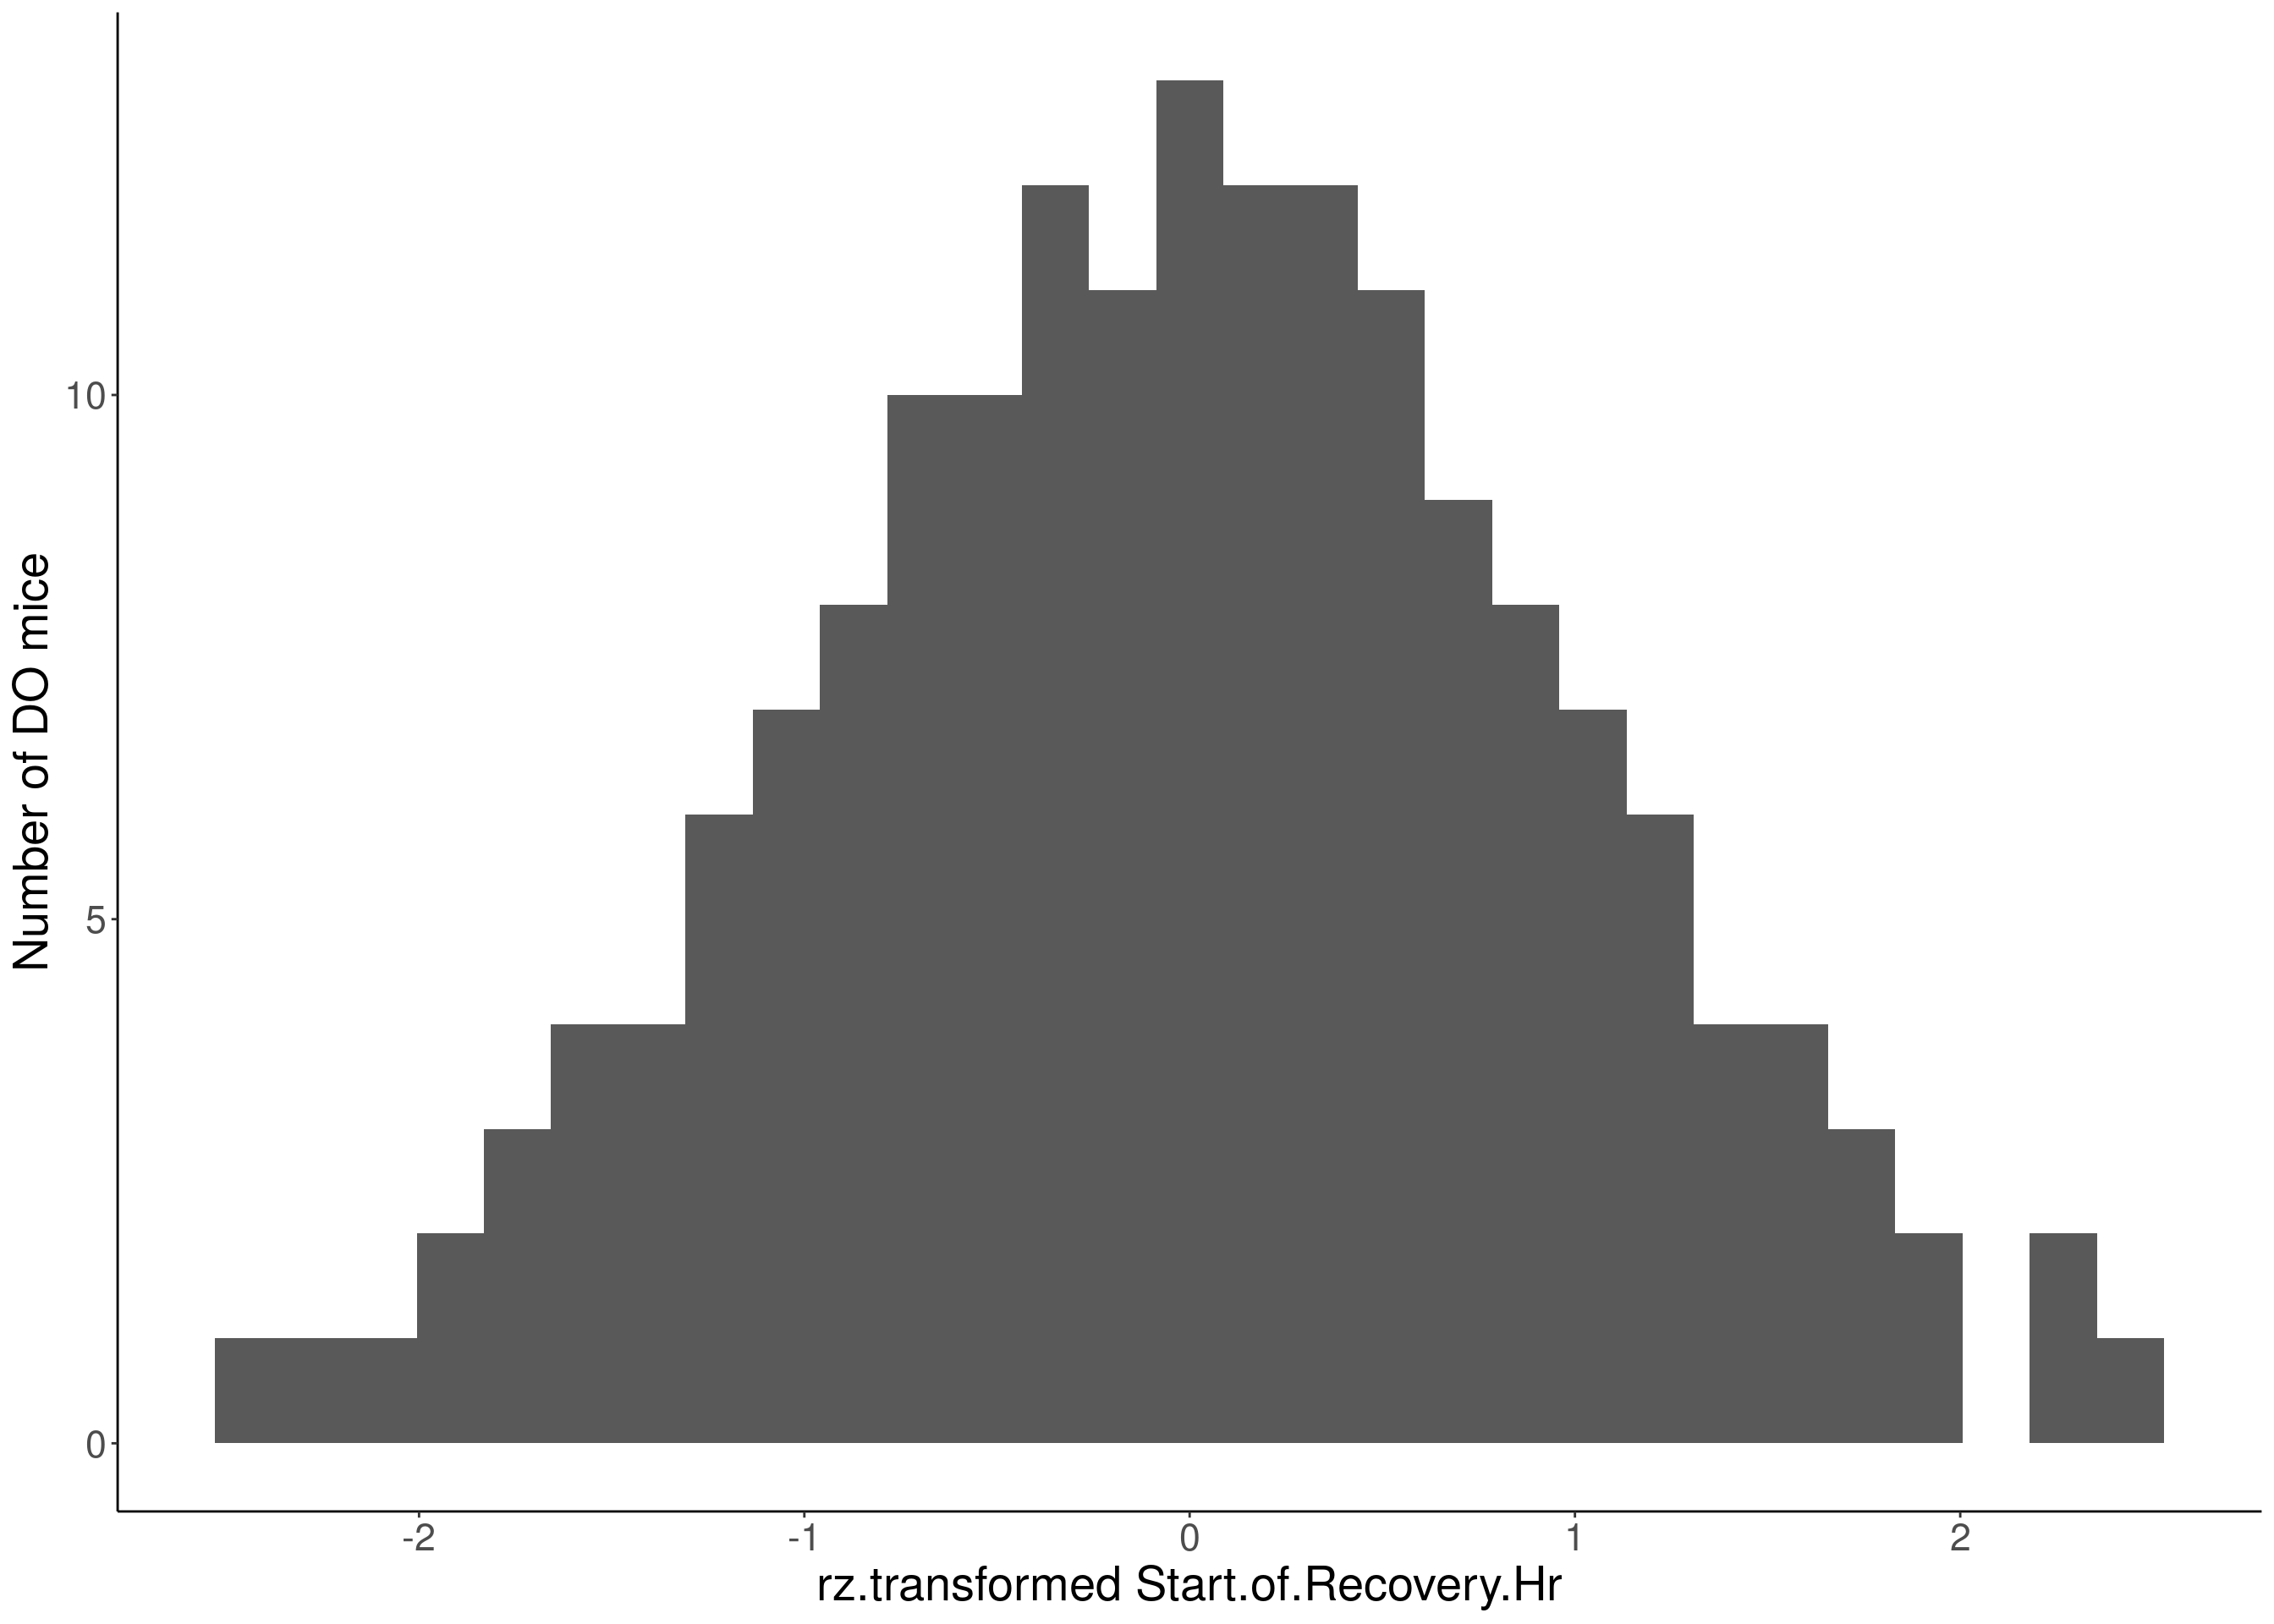
# Warning: Removed 469 rows containing non-finite values (stat_bin).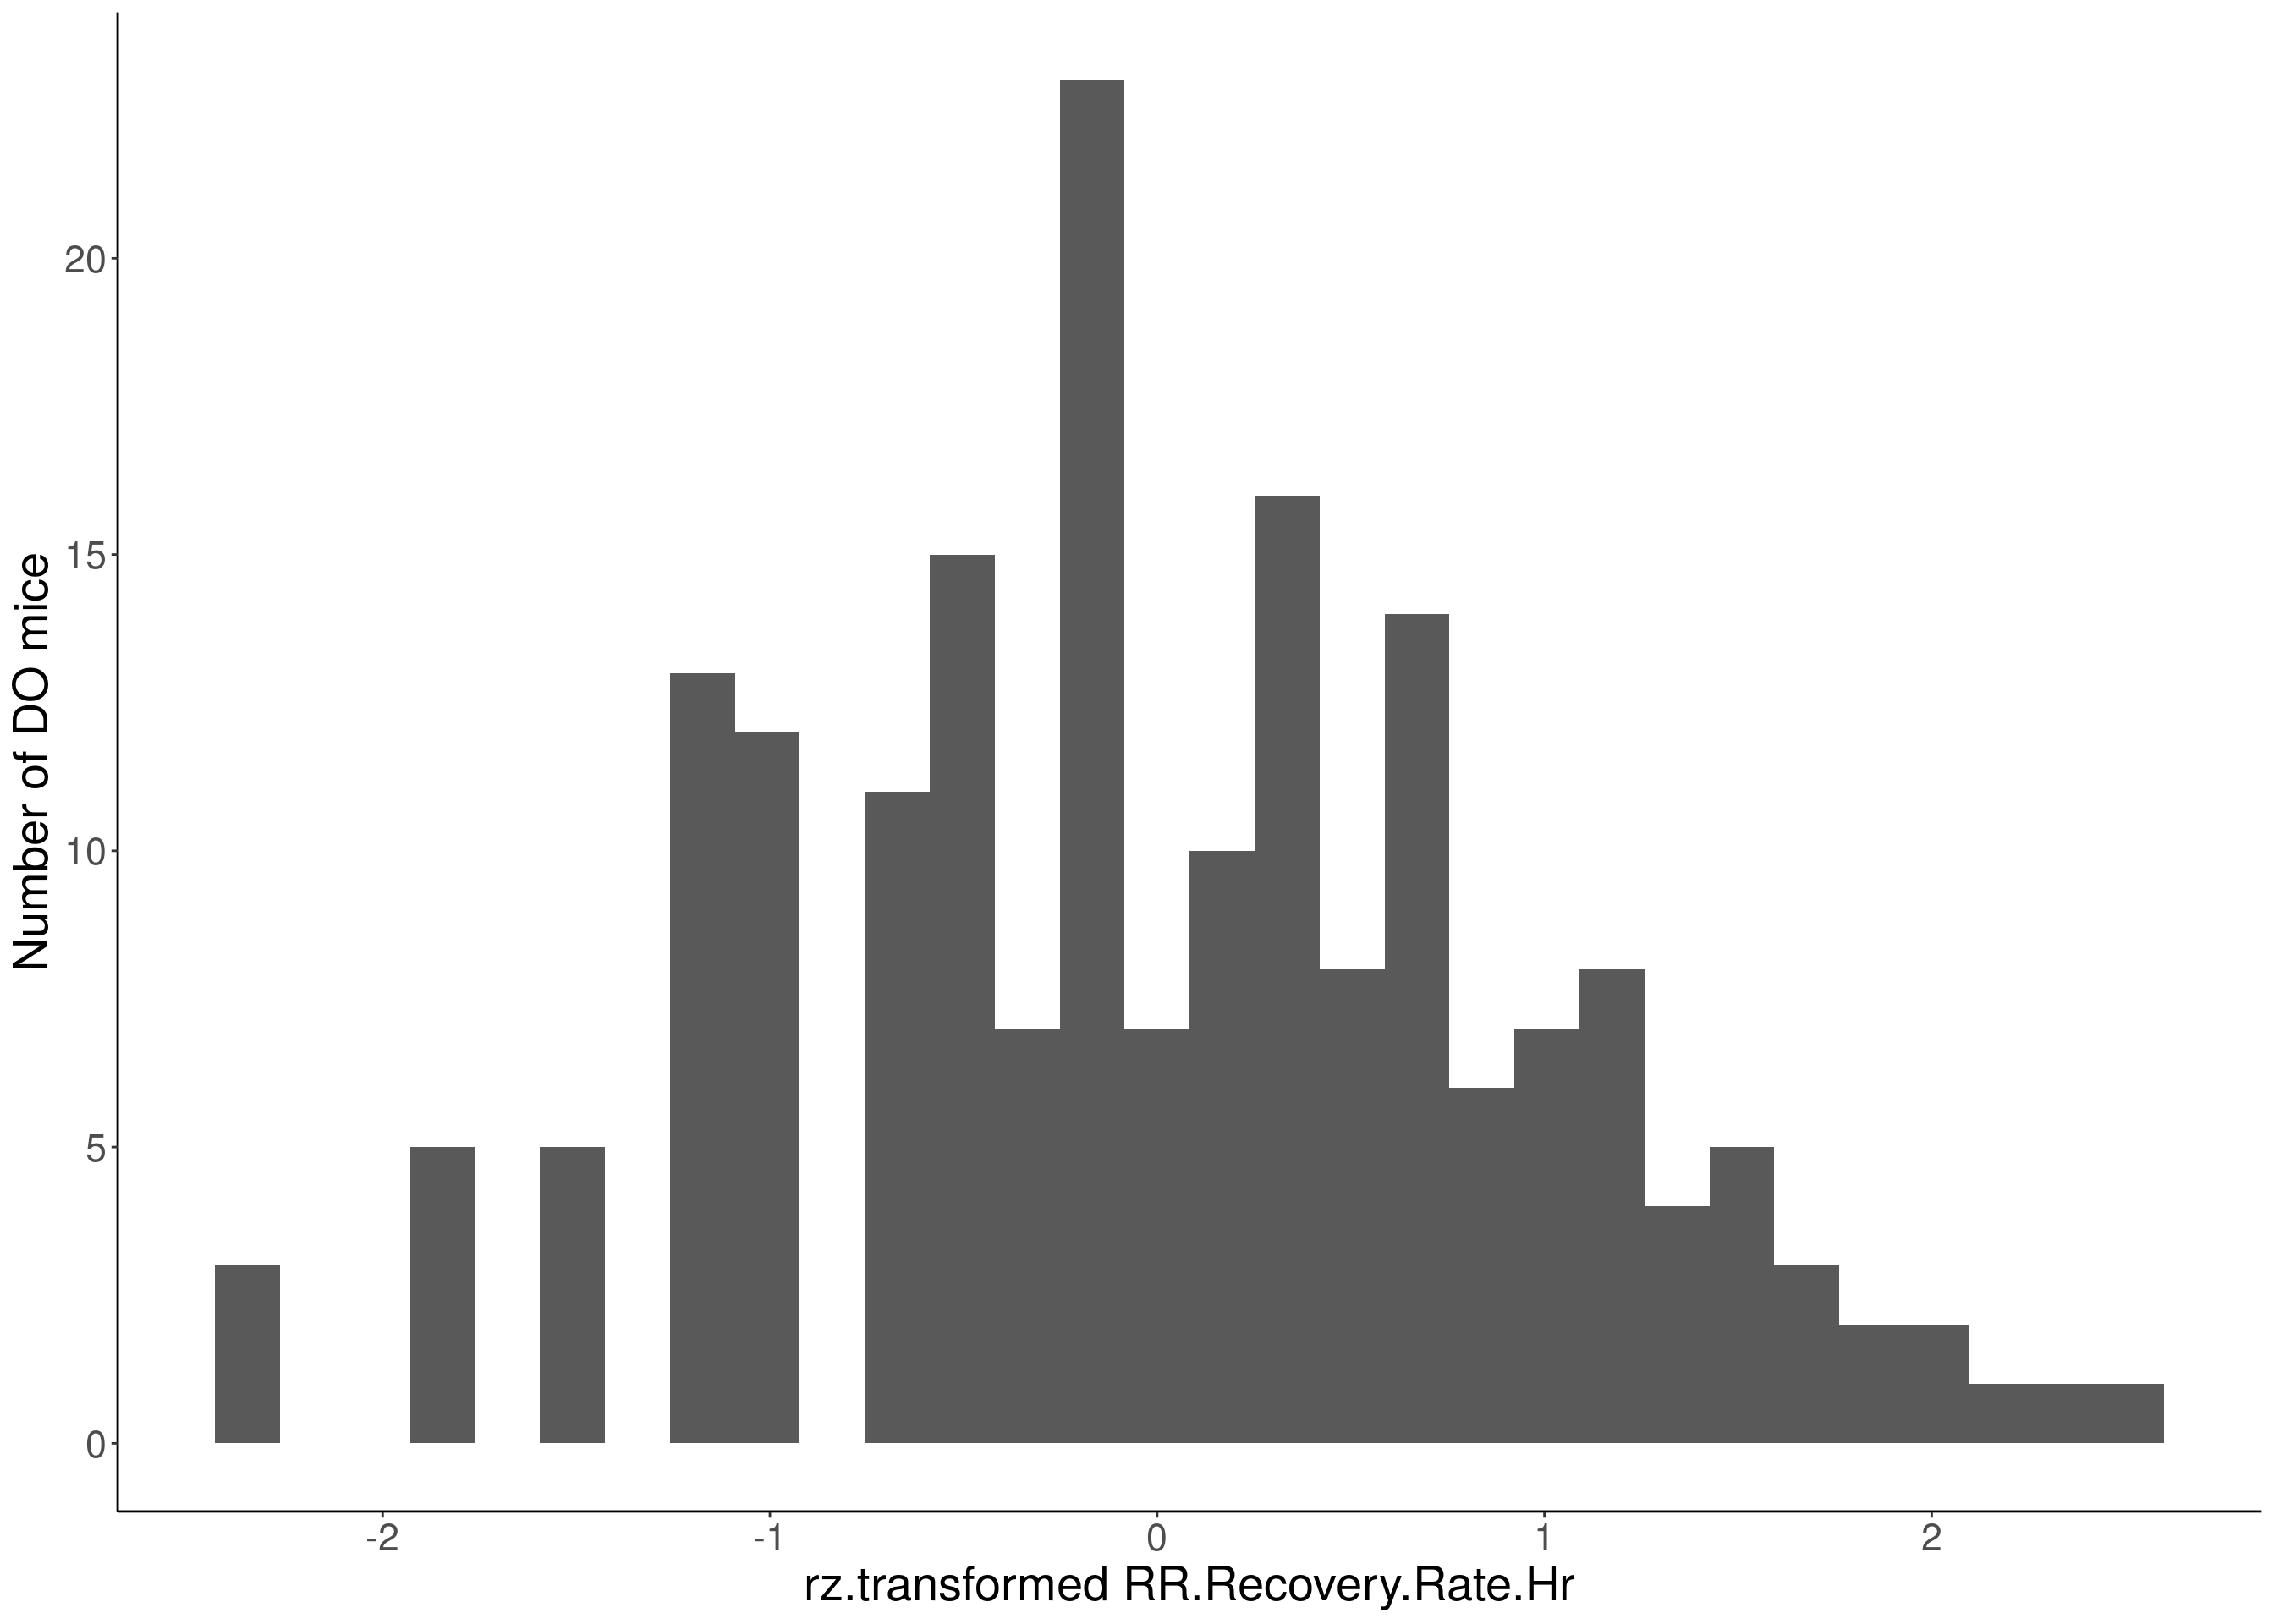
# Warning: Removed 307 rows containing non-finite values (stat_bin).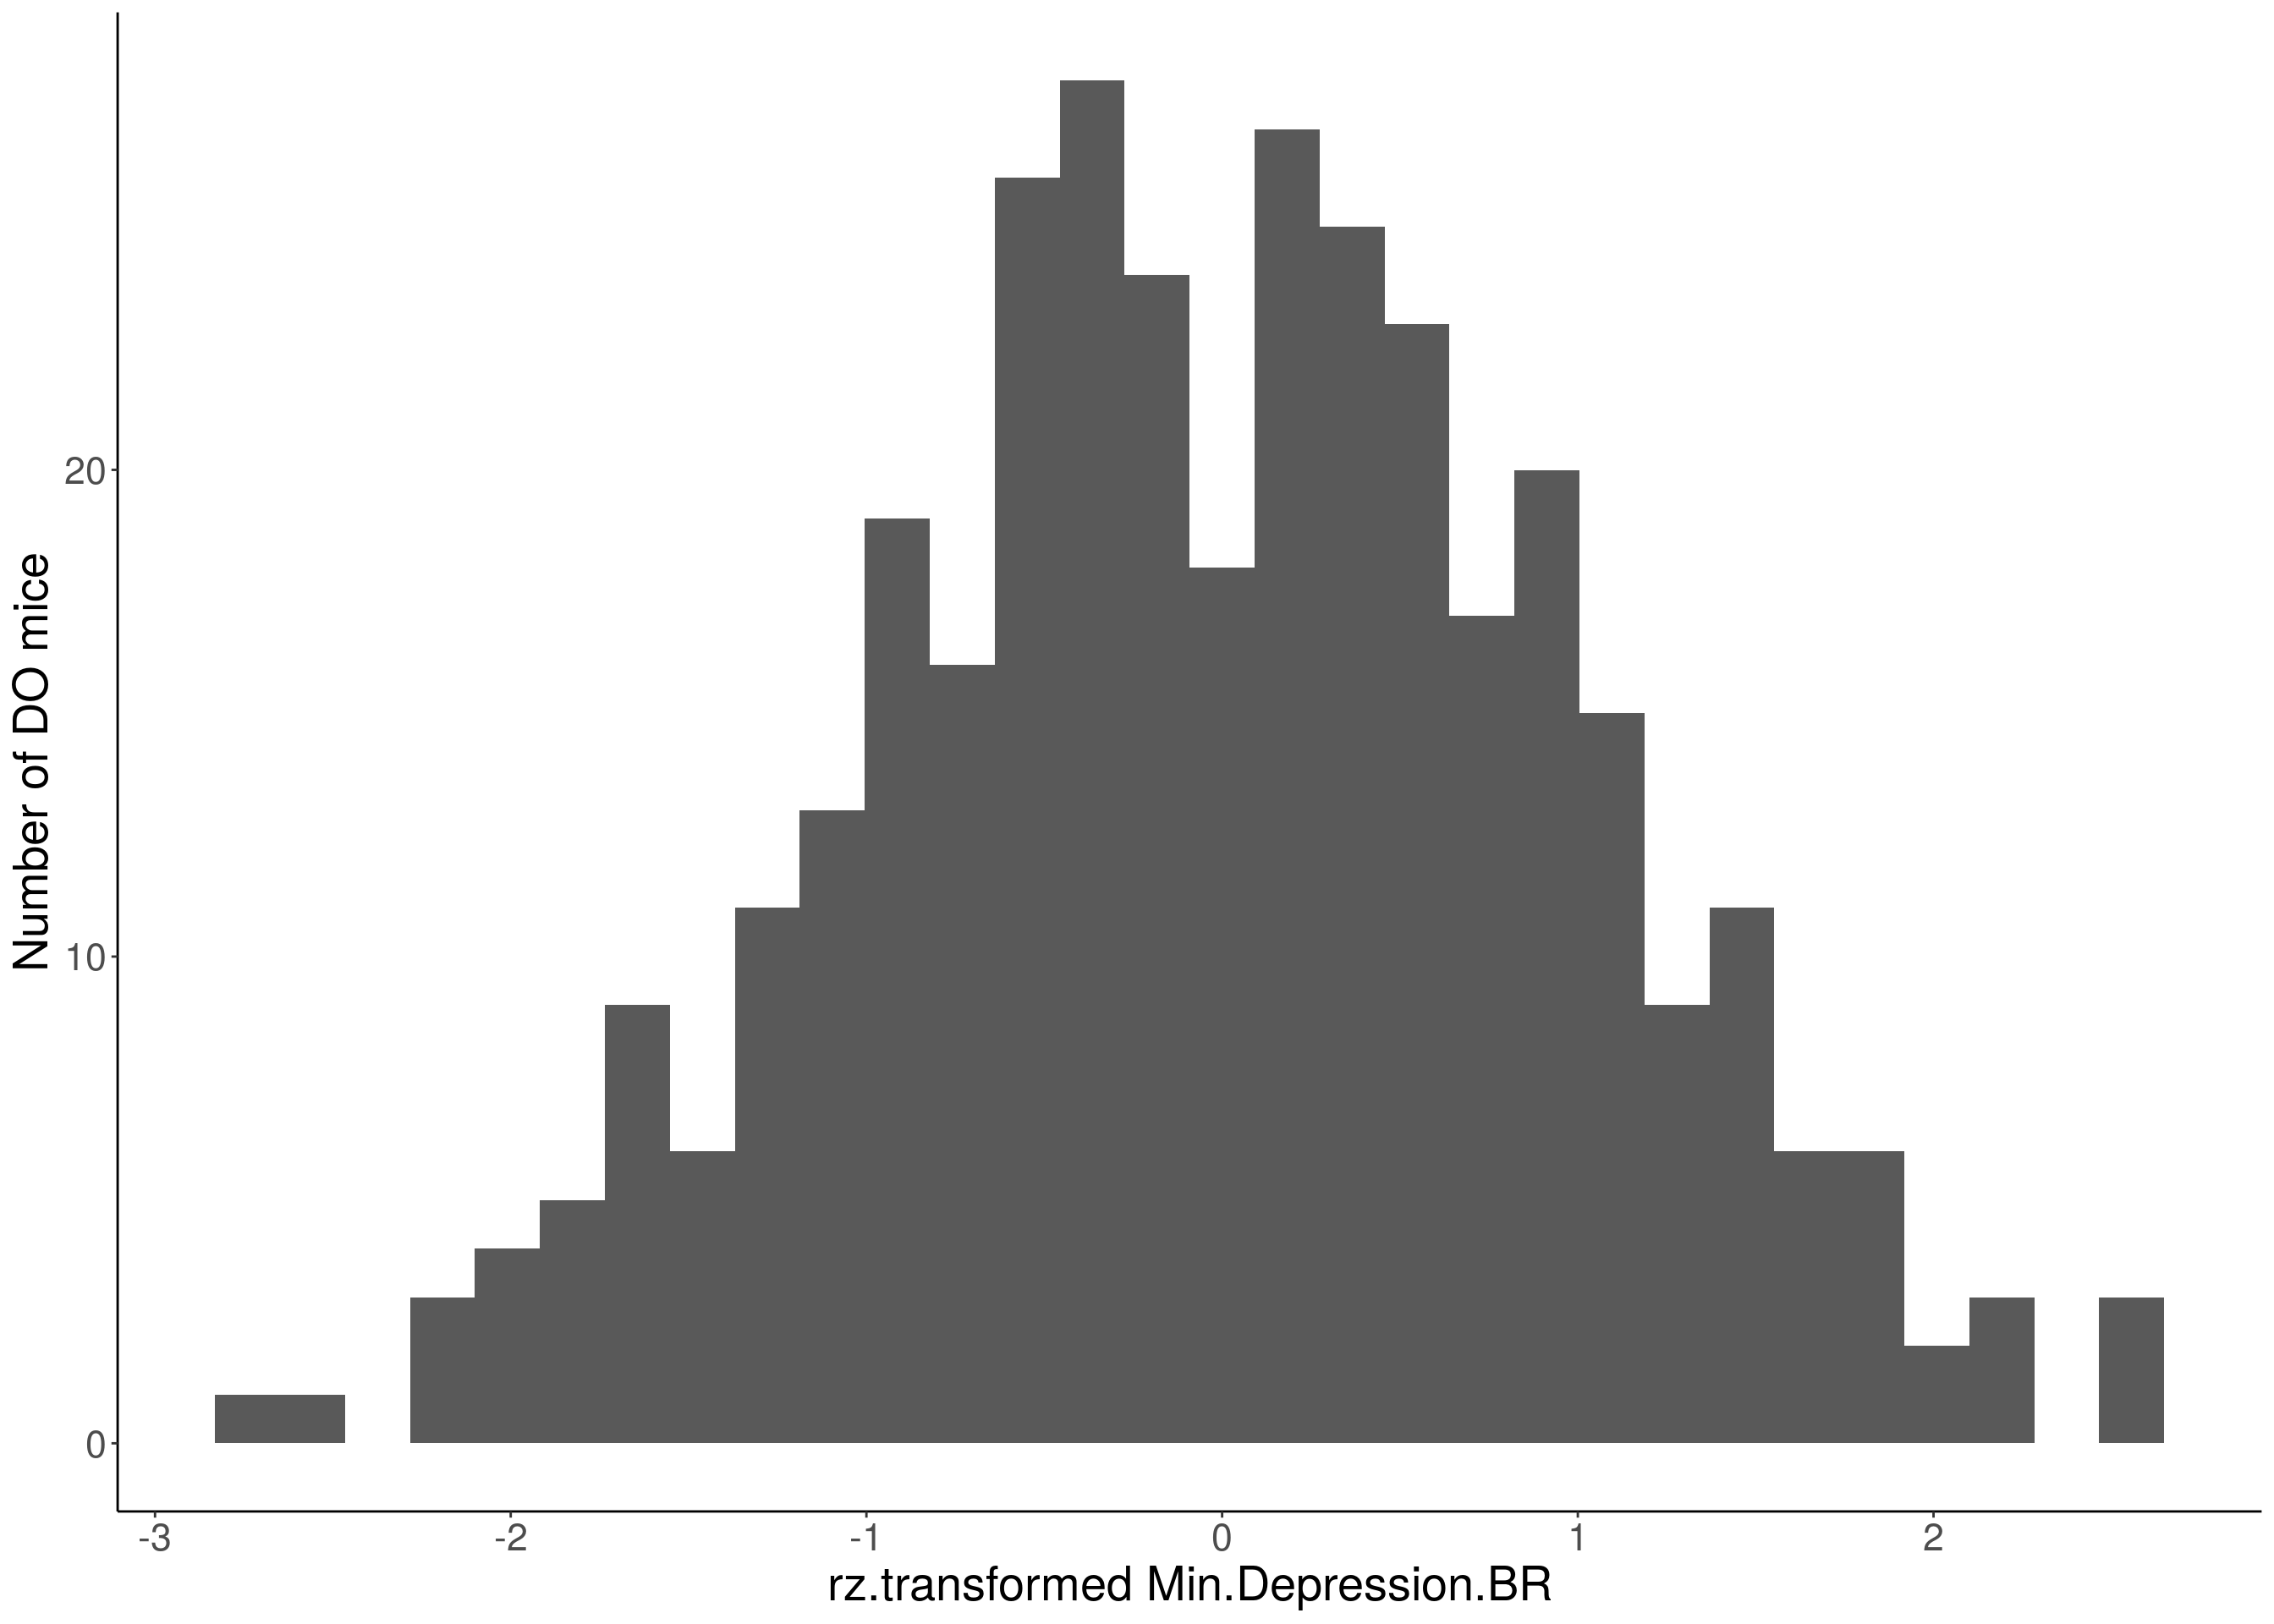
# Warning: Removed 541 rows containing non-finite values (stat_bin).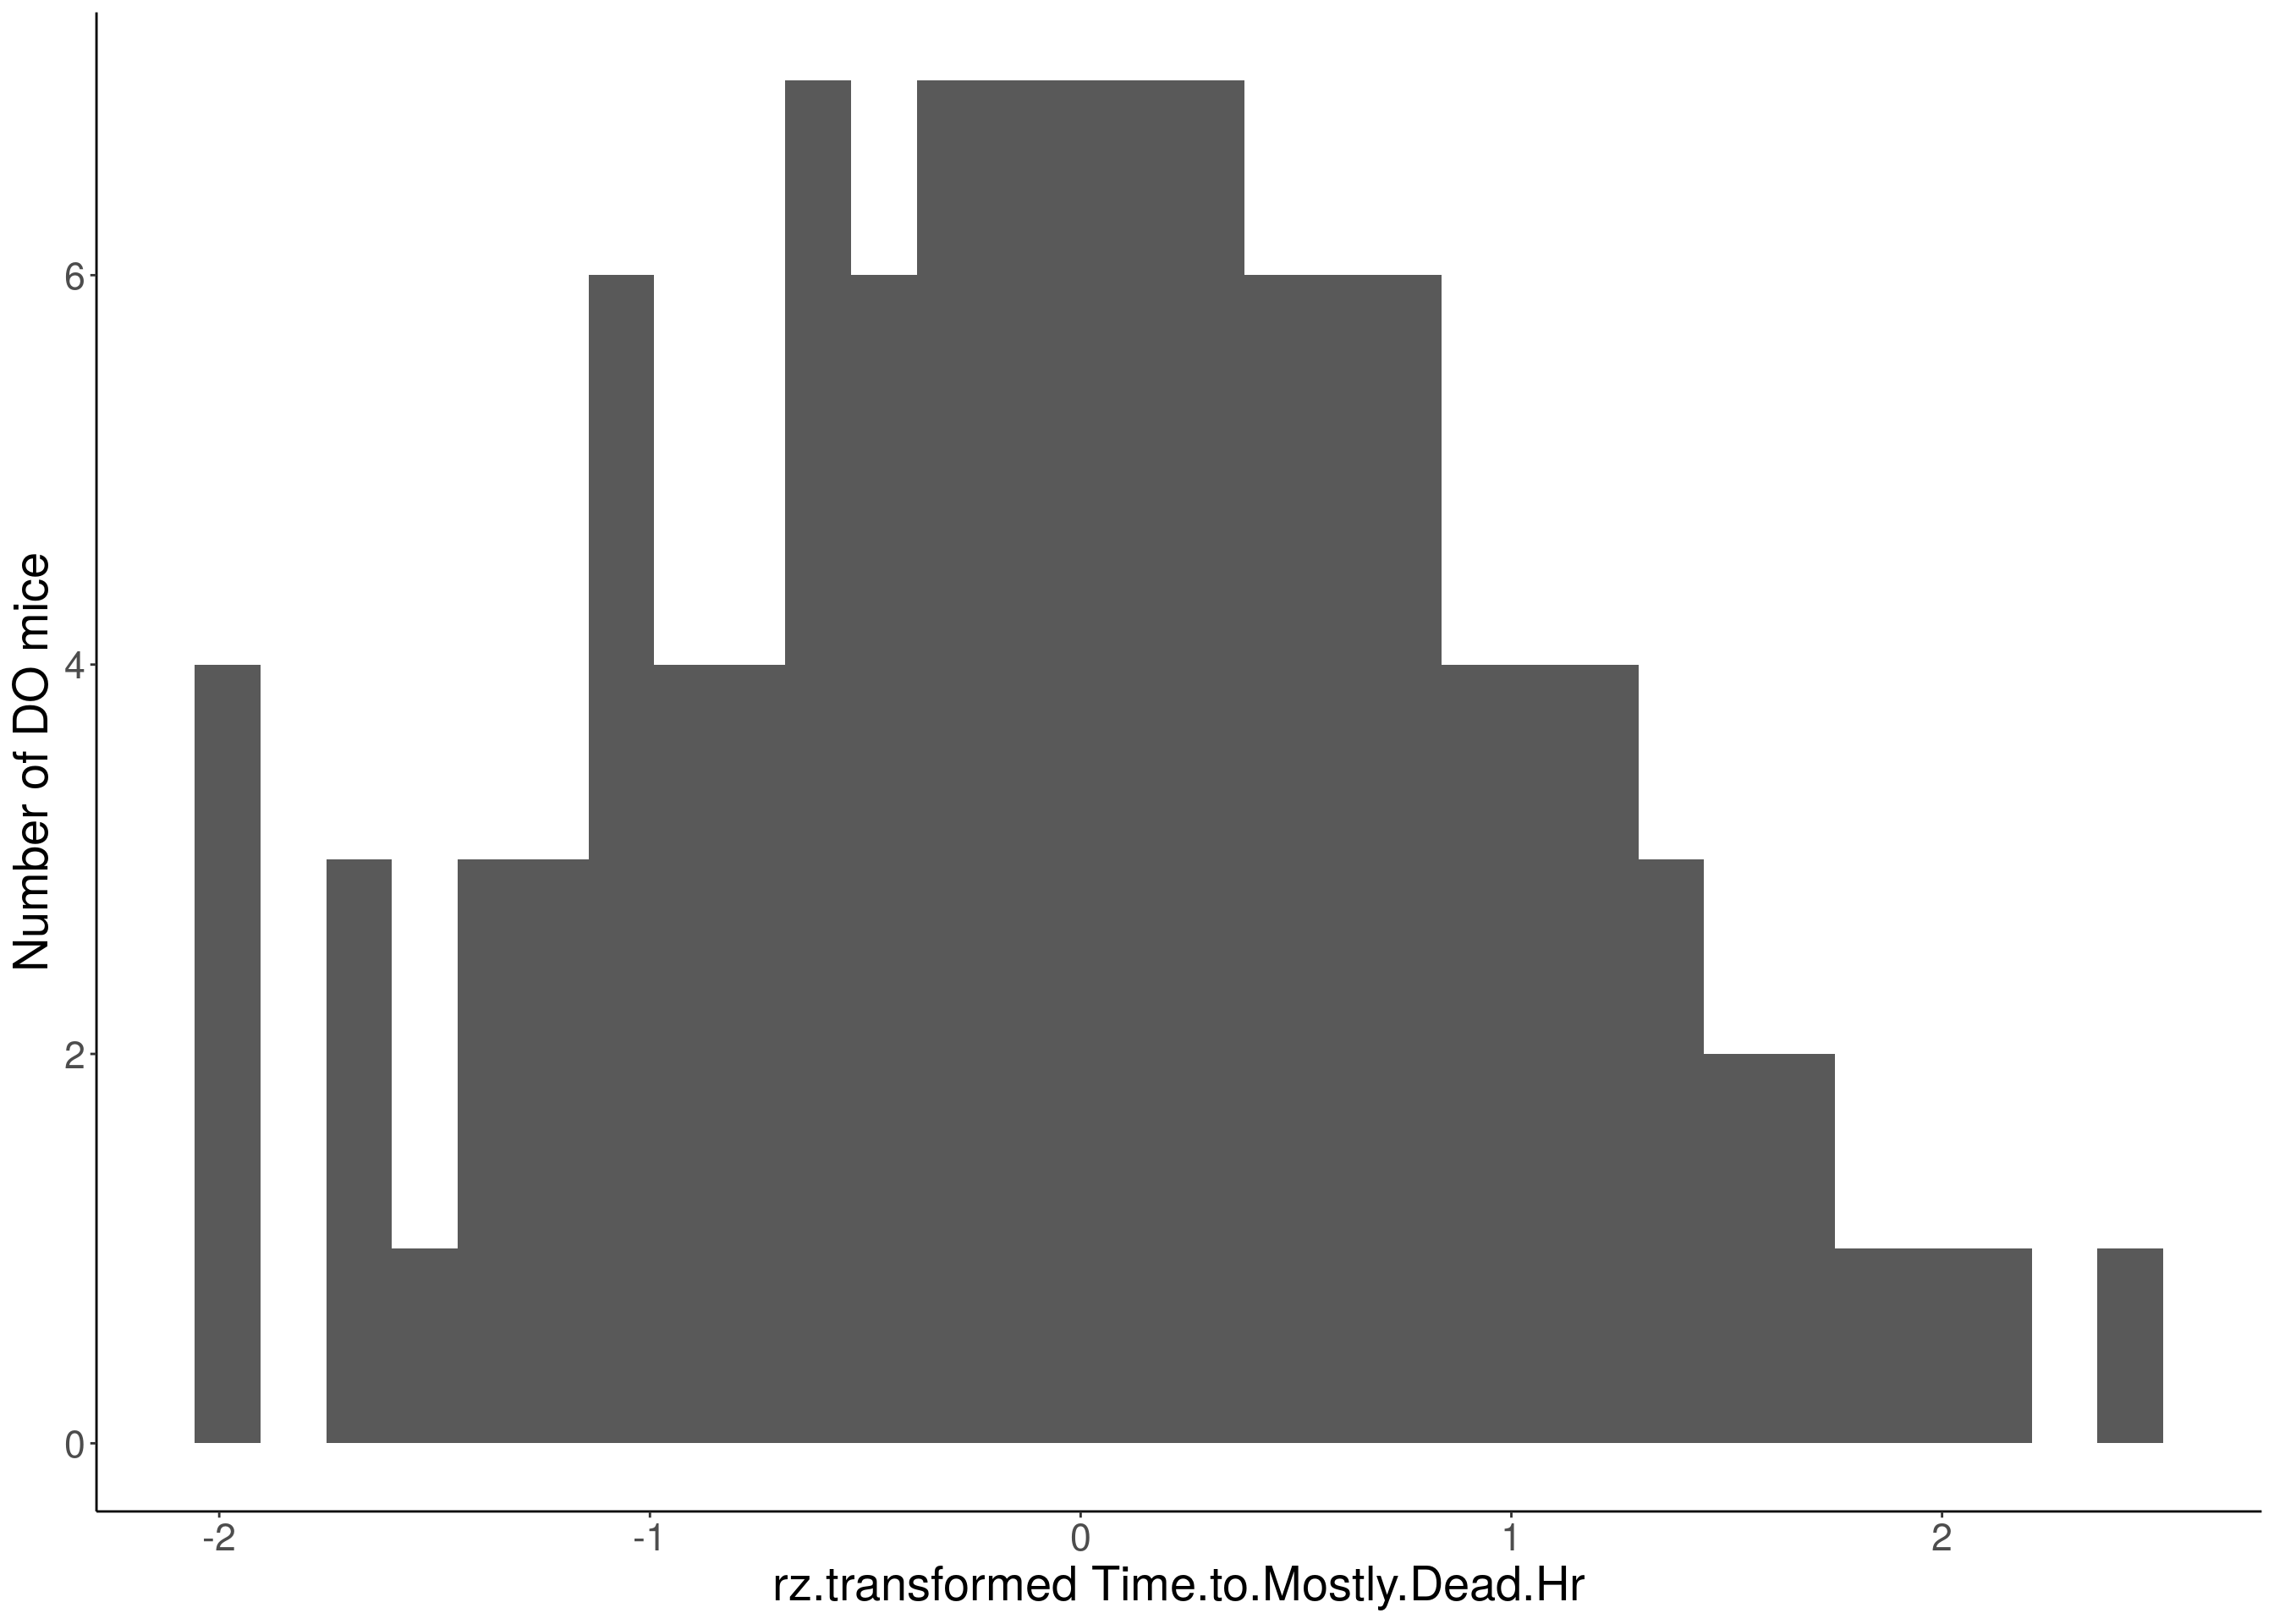
# Warning: Removed 570 rows containing non-finite values (stat_bin).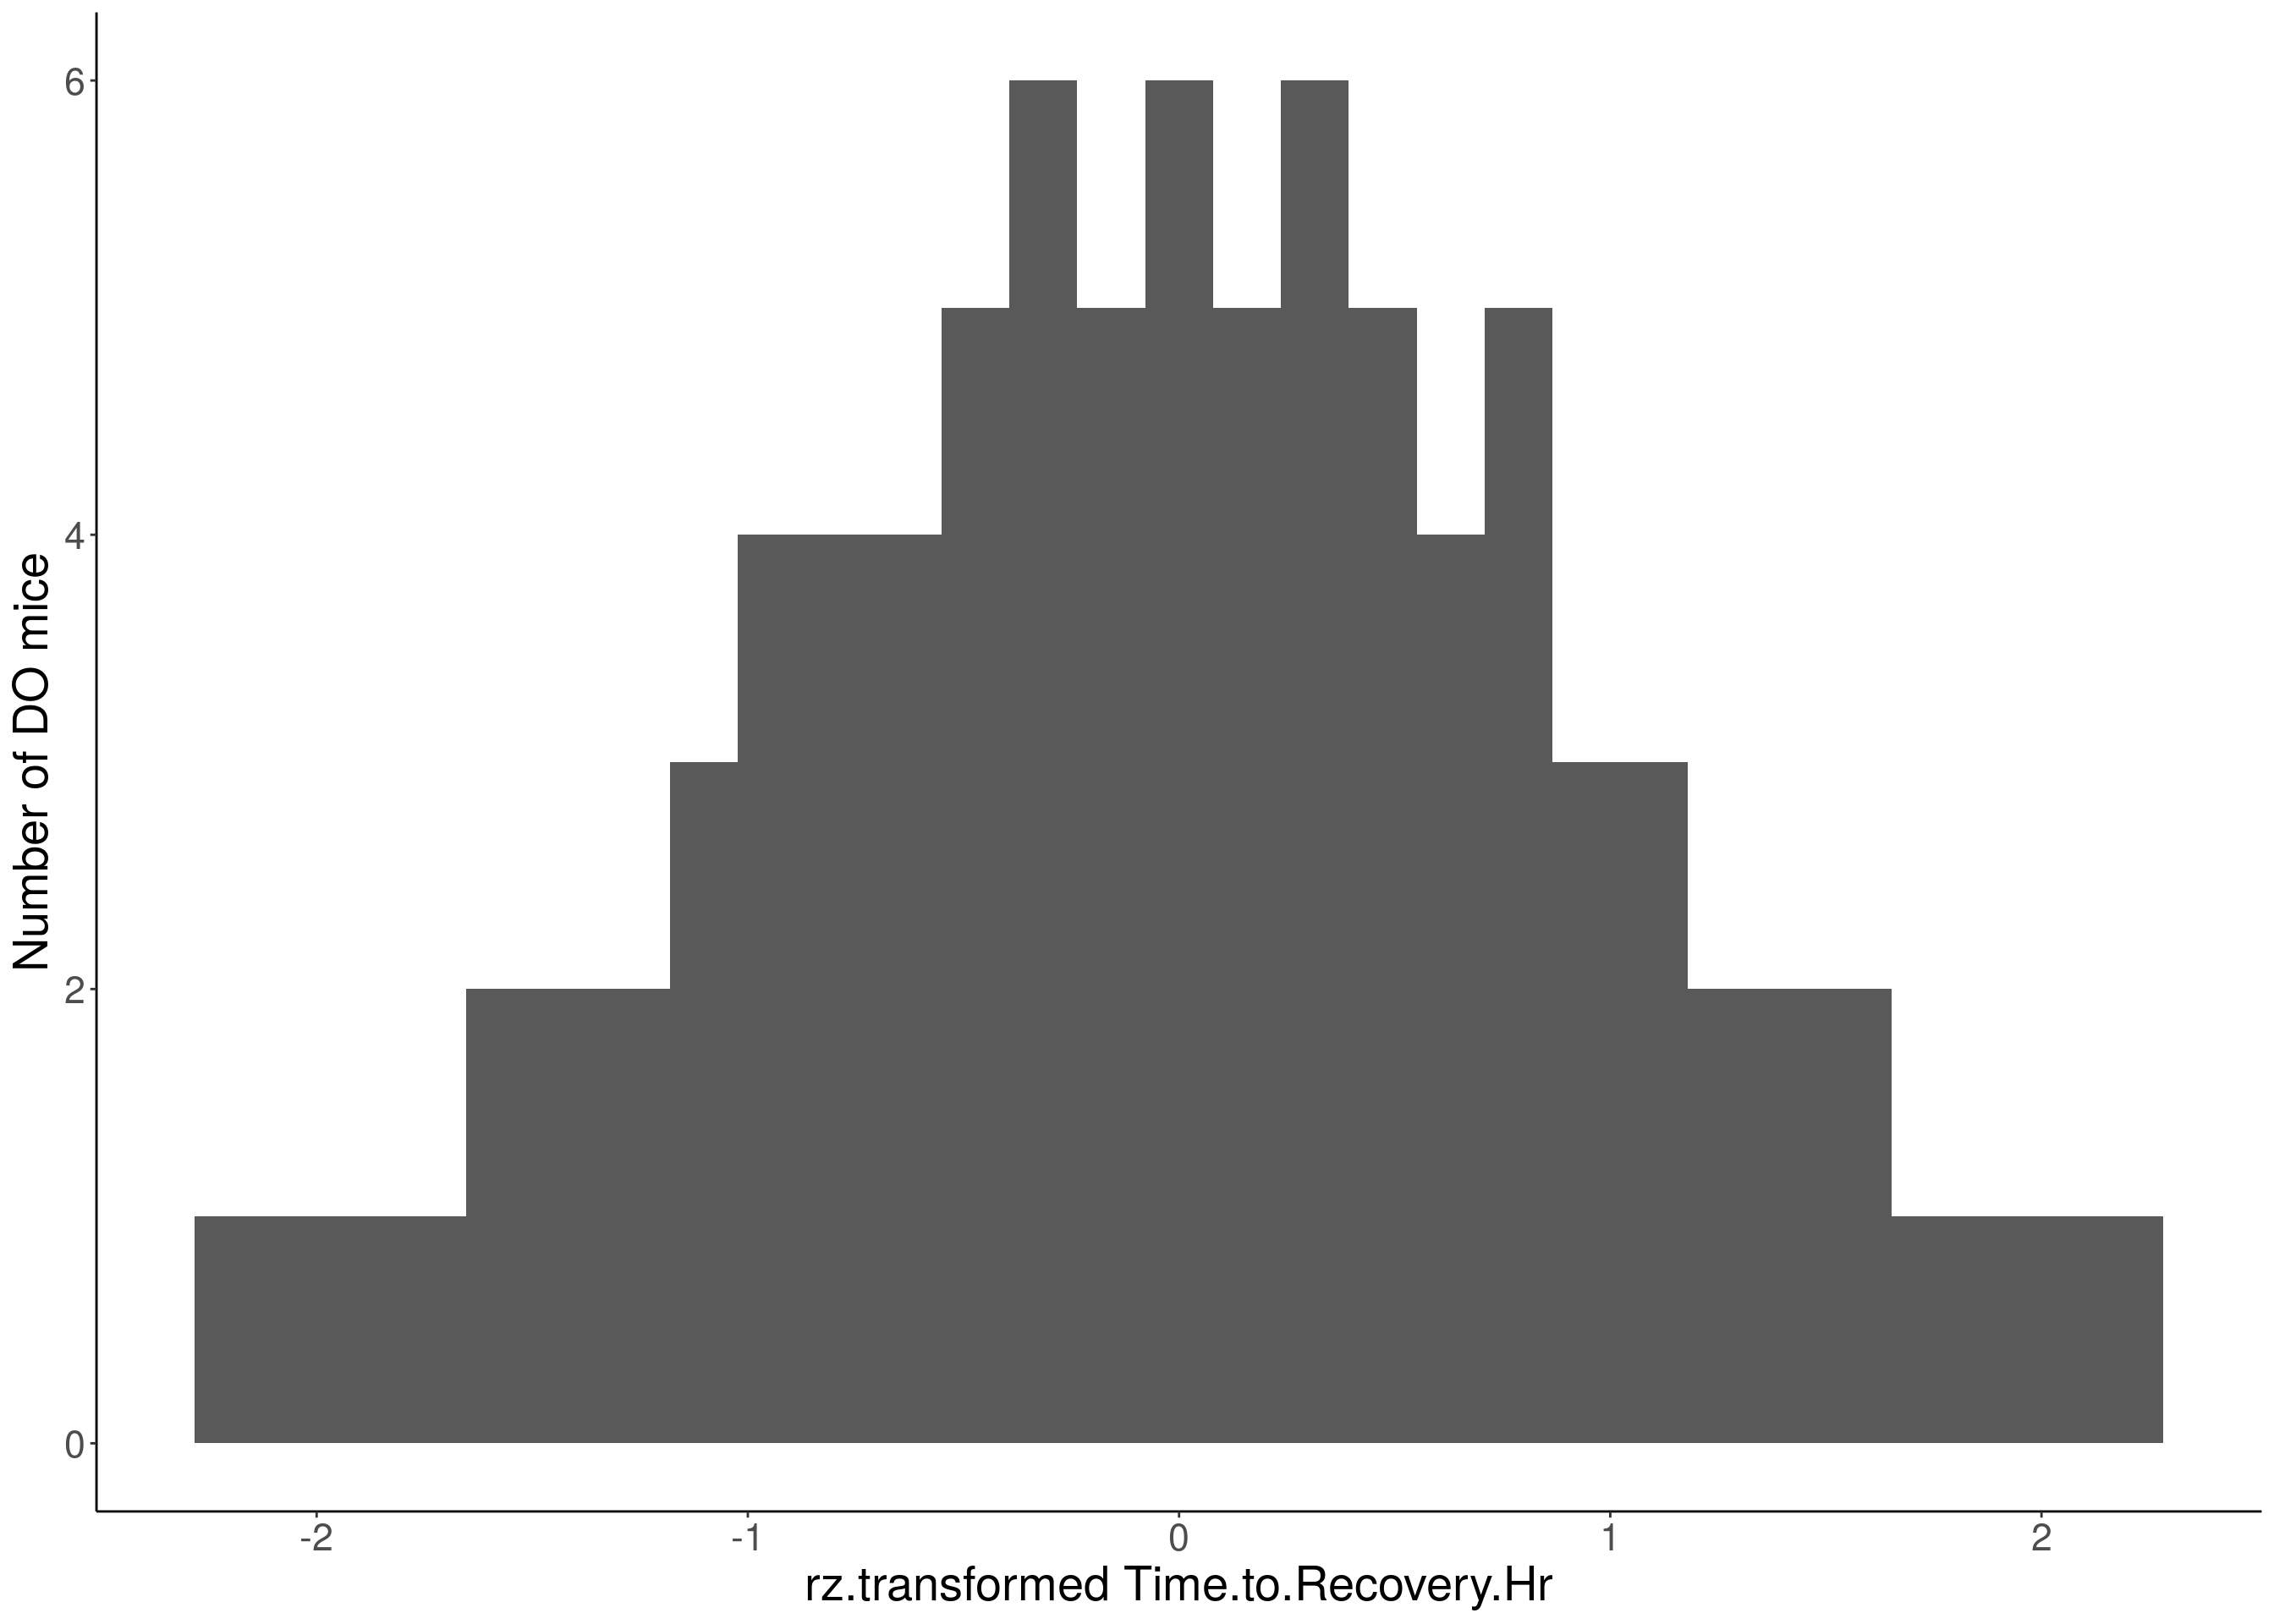
Plot qtl mapping on array
Plot by using its output qtl.fentanyl.combine2cohort.out.RData
load("output/Fentanyl/qtl.fentanyl.combine2cohort.out.RData")
#pmap and gmap
chr.names <- c("1","2","3","4","5","6","7","8","9","10","11","12","13","14","15","16","17","18","19", "X")
gmap <- list()
pmap <- list()
for (chr in chr.names){
gmap[[chr]] <- gm$gmap[[chr]]
pmap[[chr]] <- gm$pmap[[chr]]
}
attr(gmap, "is_x_chr") <- structure(c(rep(FALSE,19),TRUE), names=1:20)
attr(pmap, "is_x_chr") <- structure(c(rep(FALSE,19),TRUE), names=1:20)
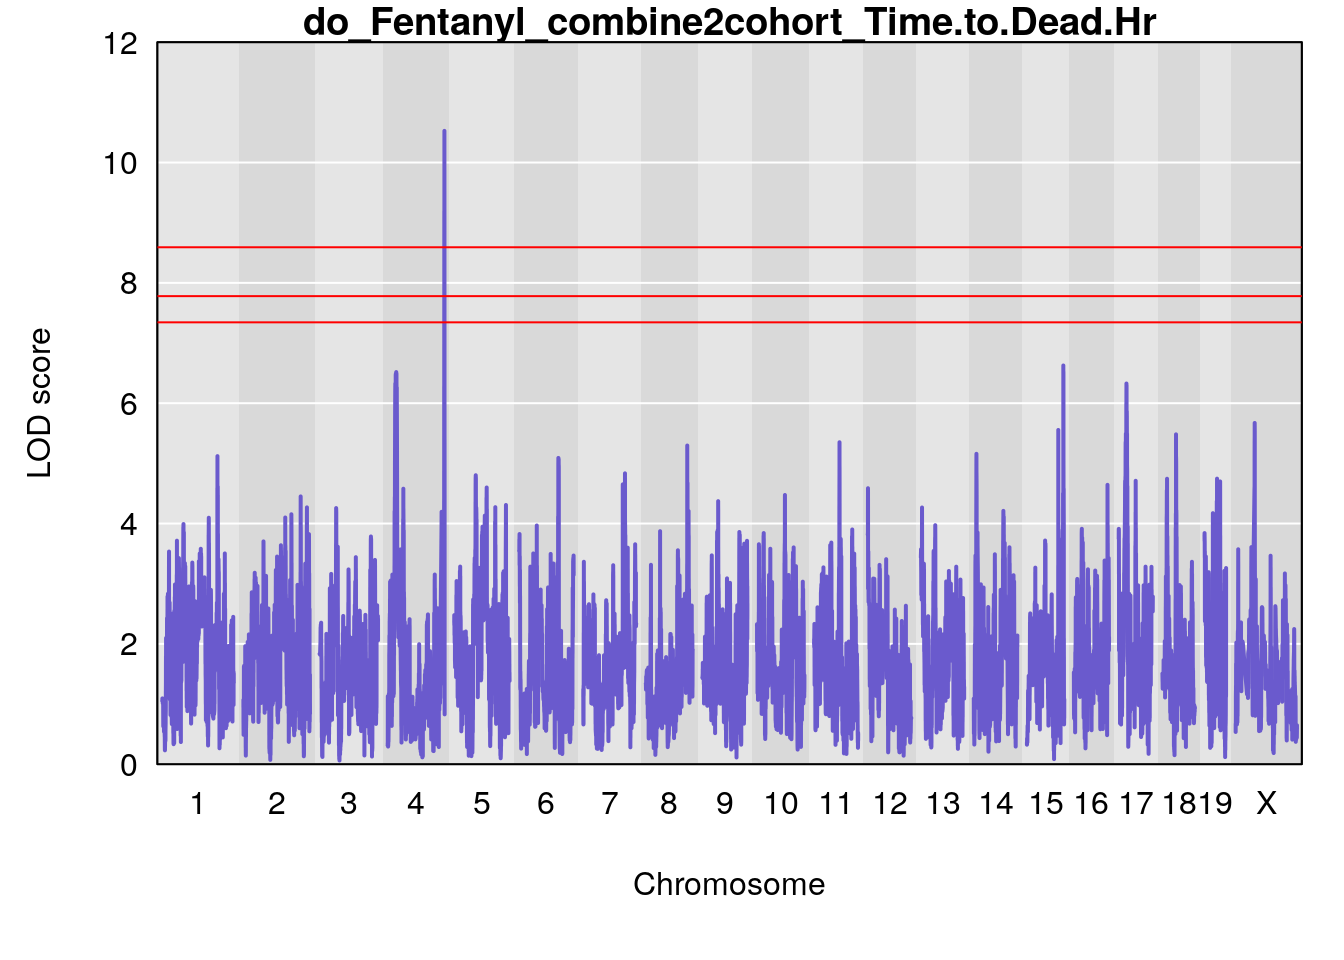
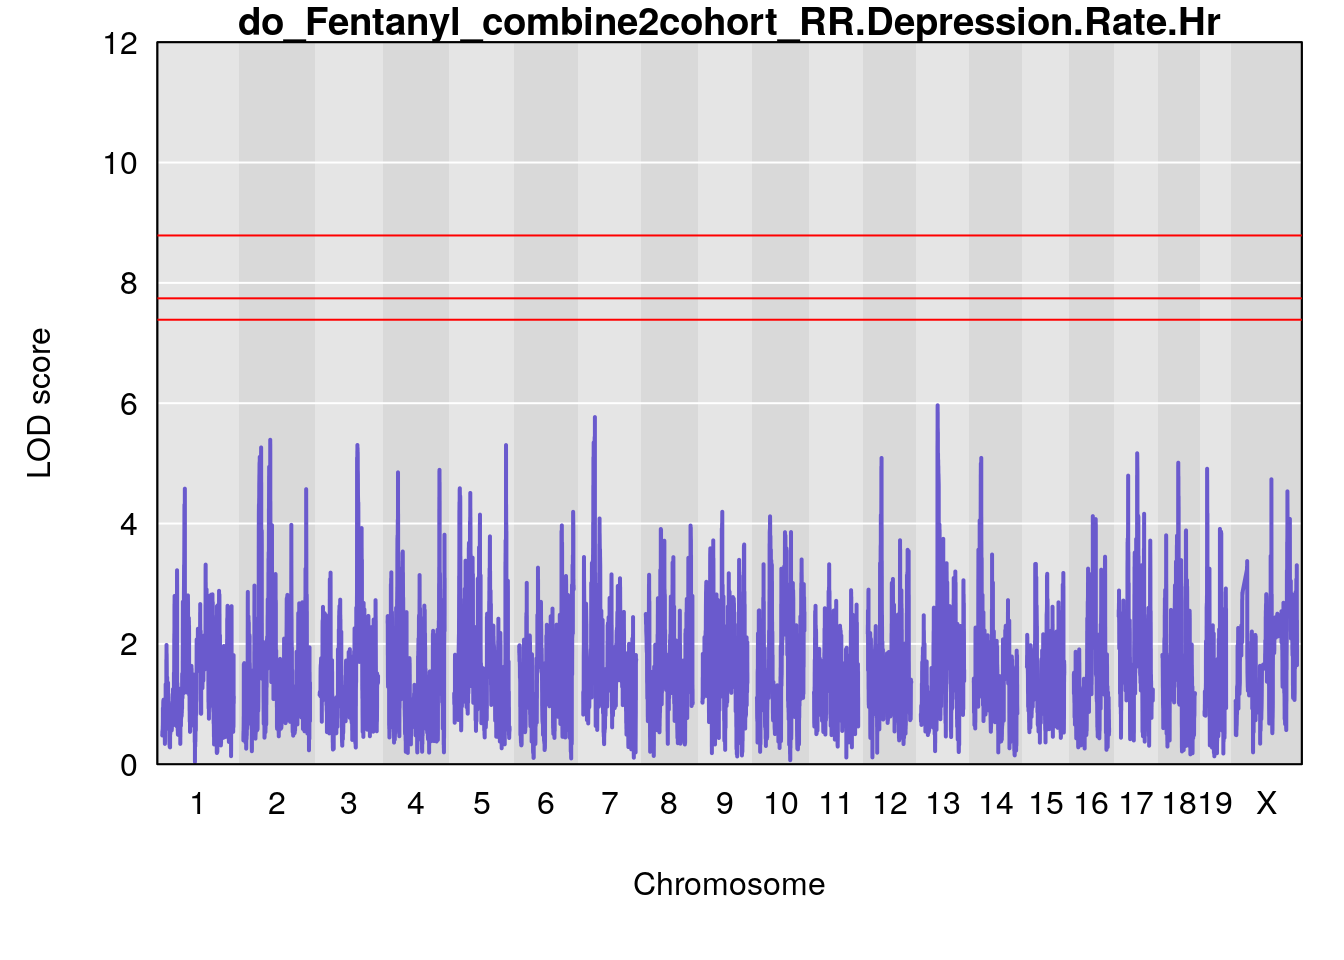
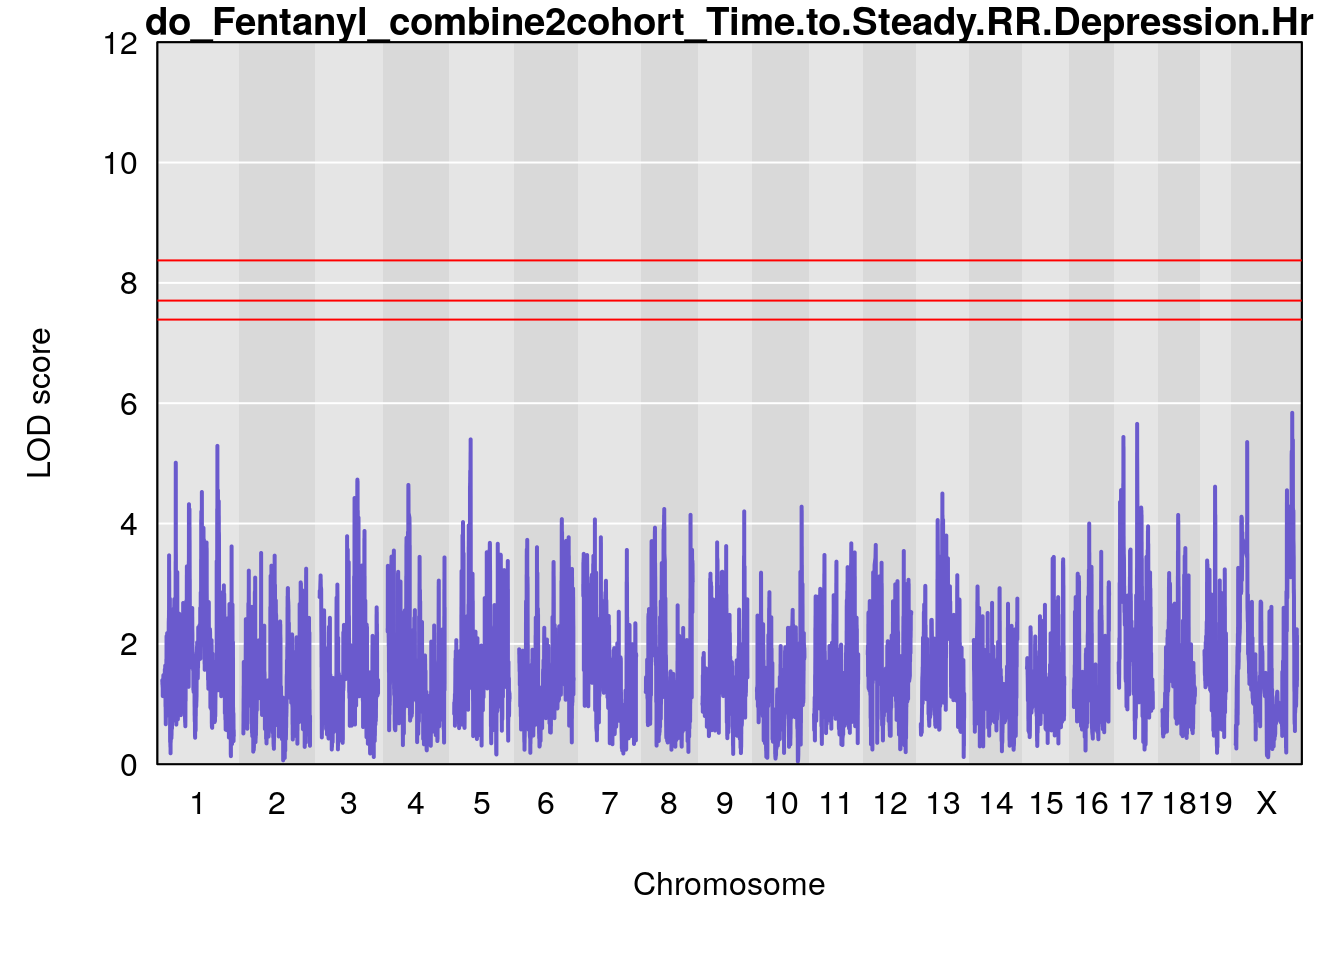
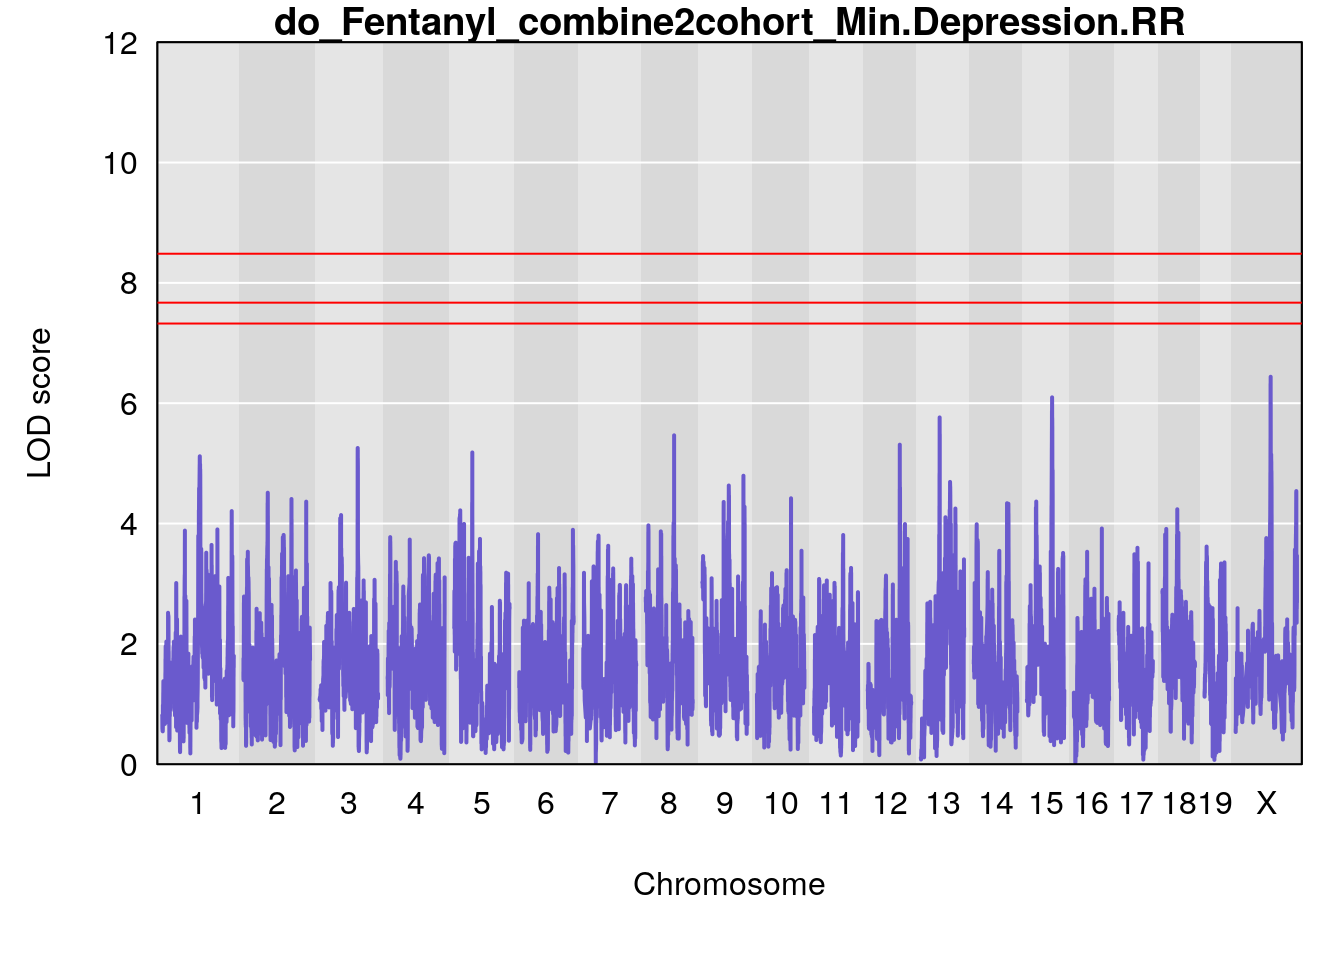
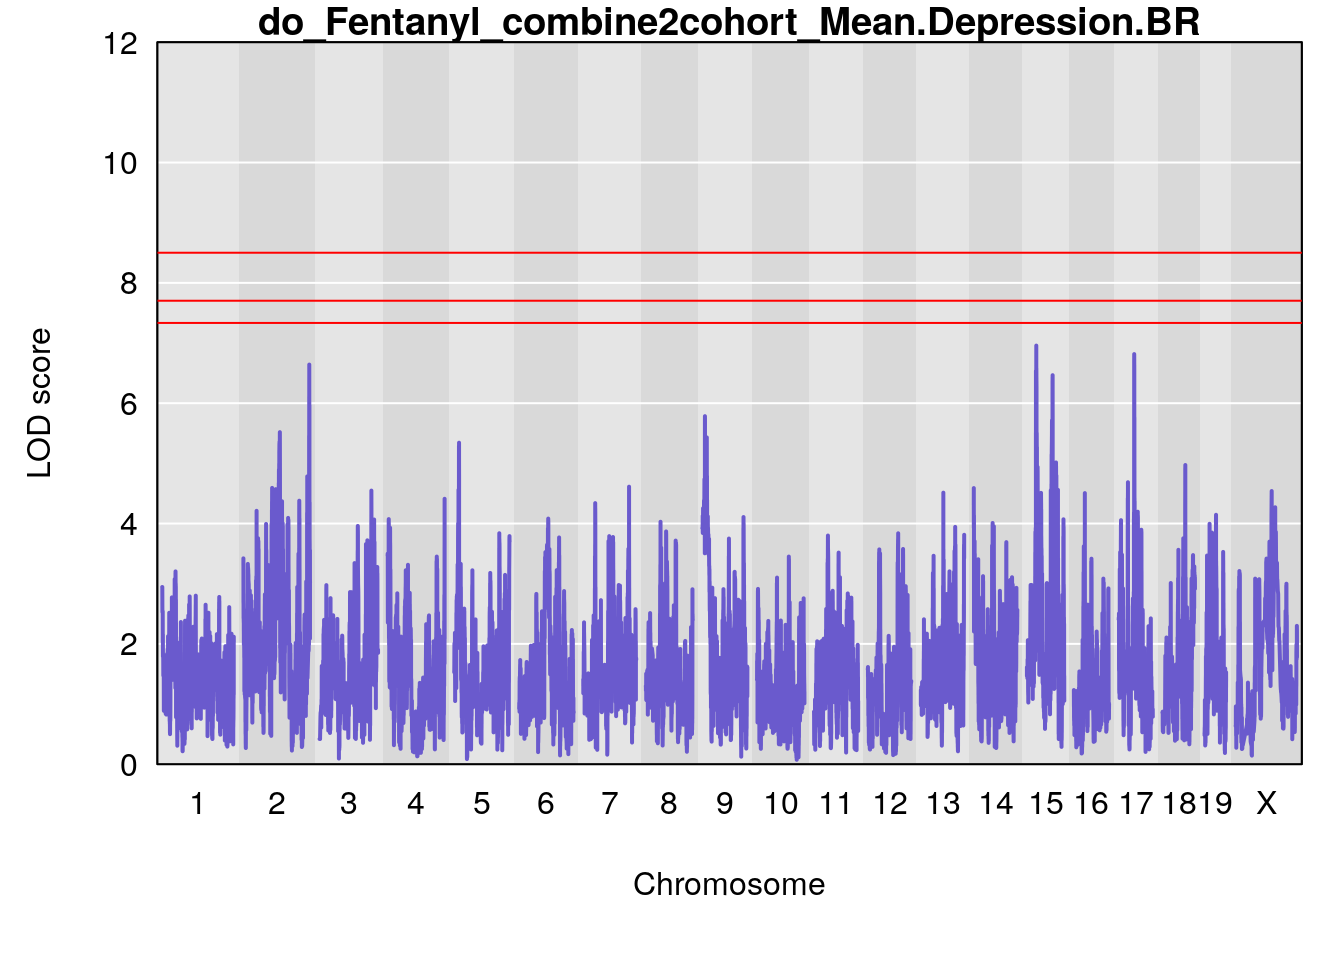
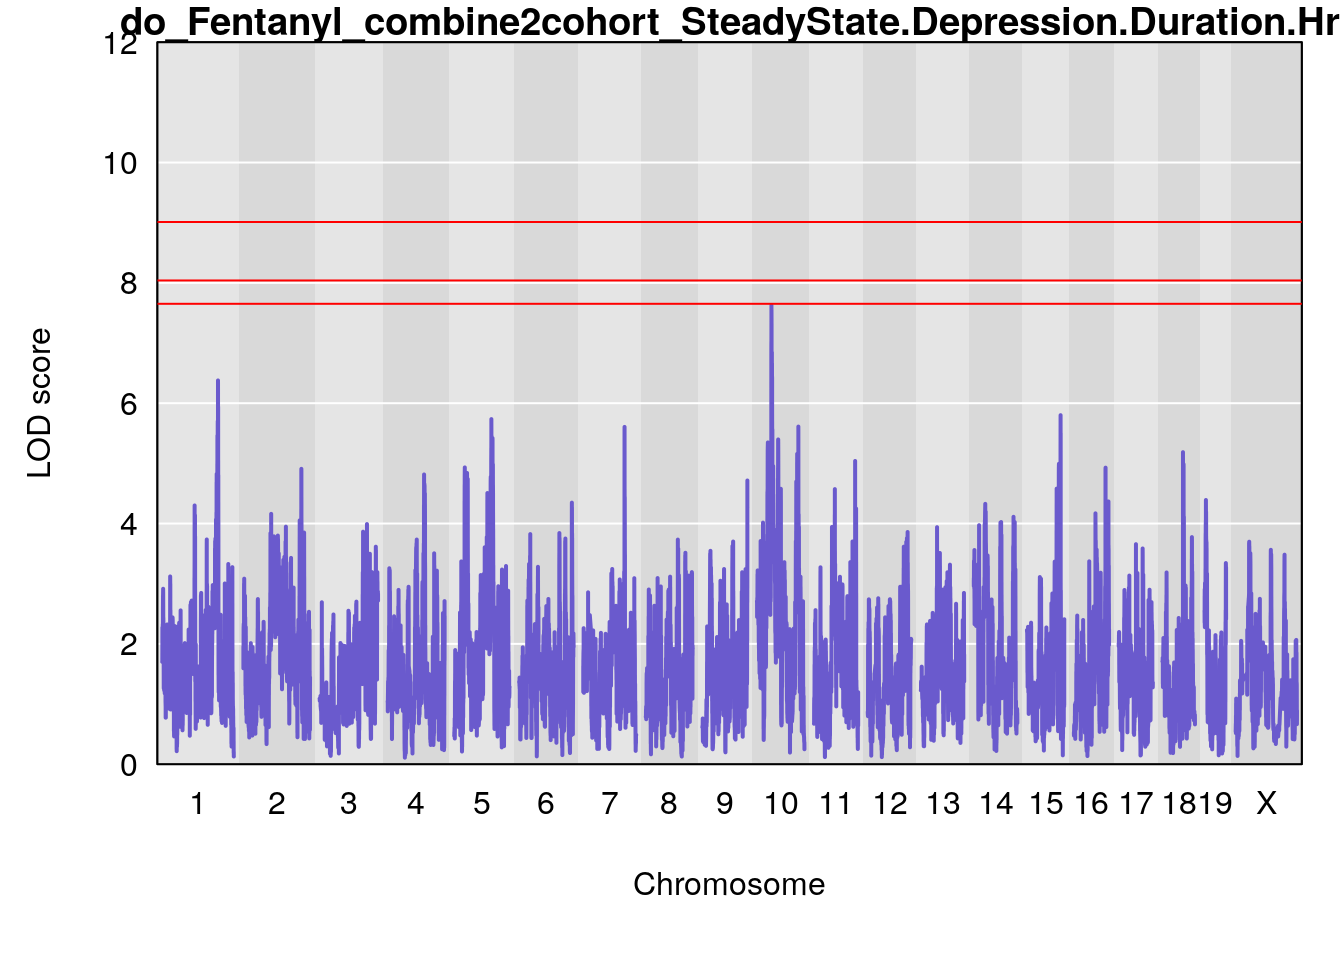
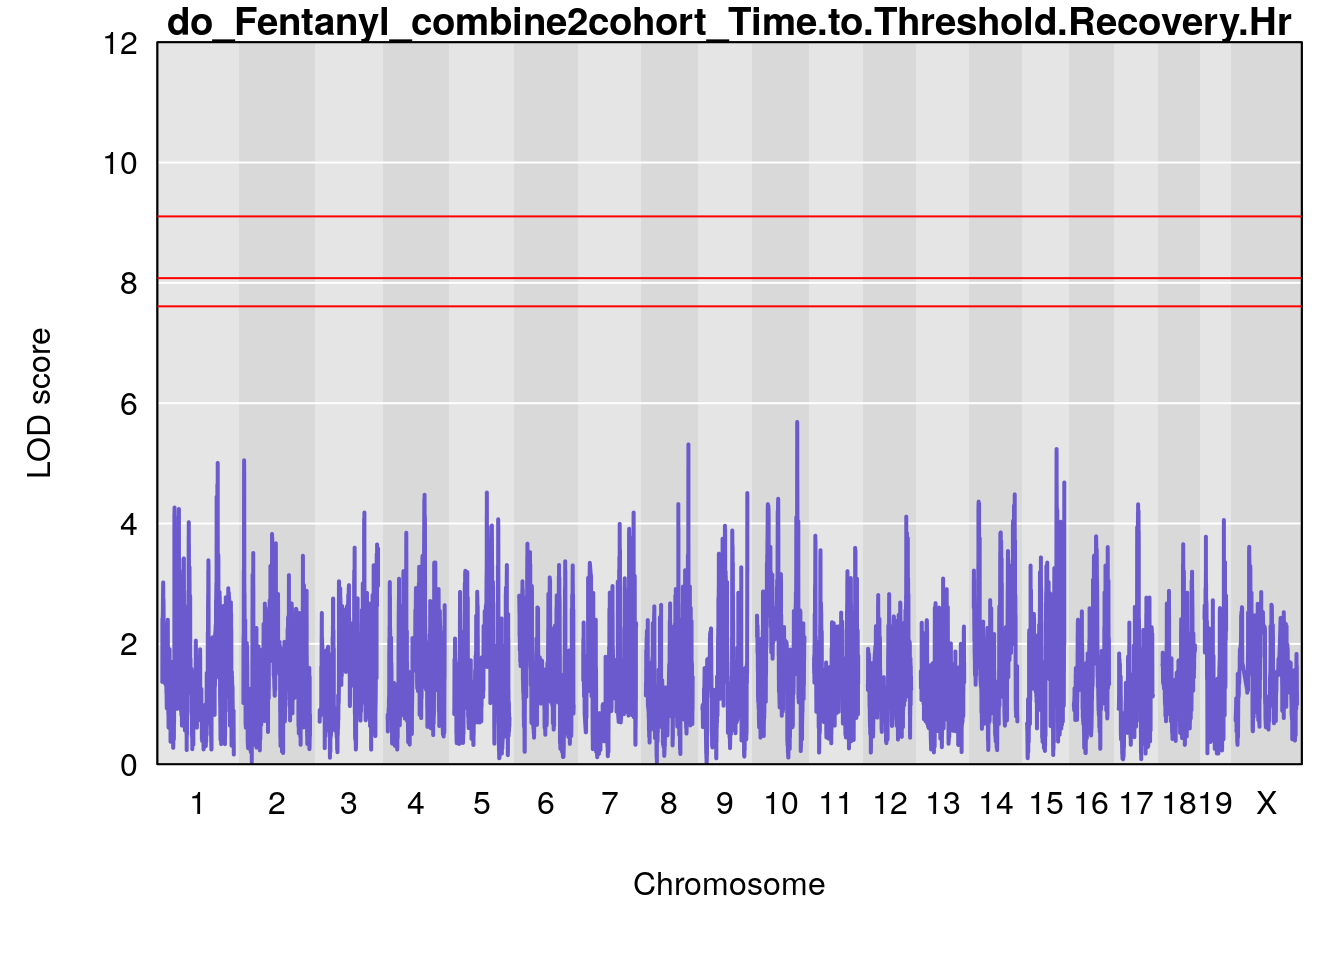
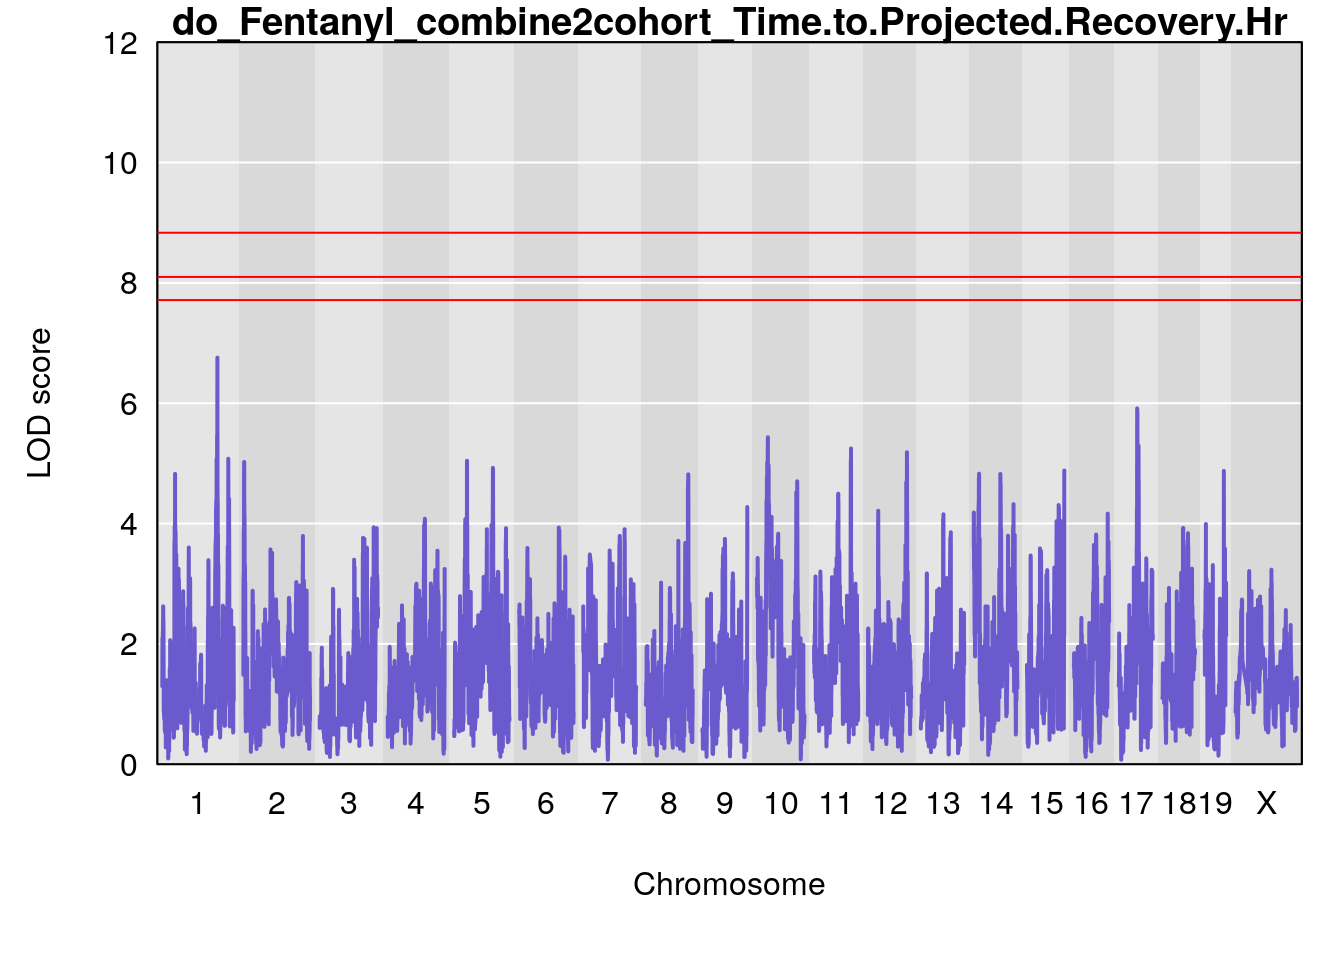
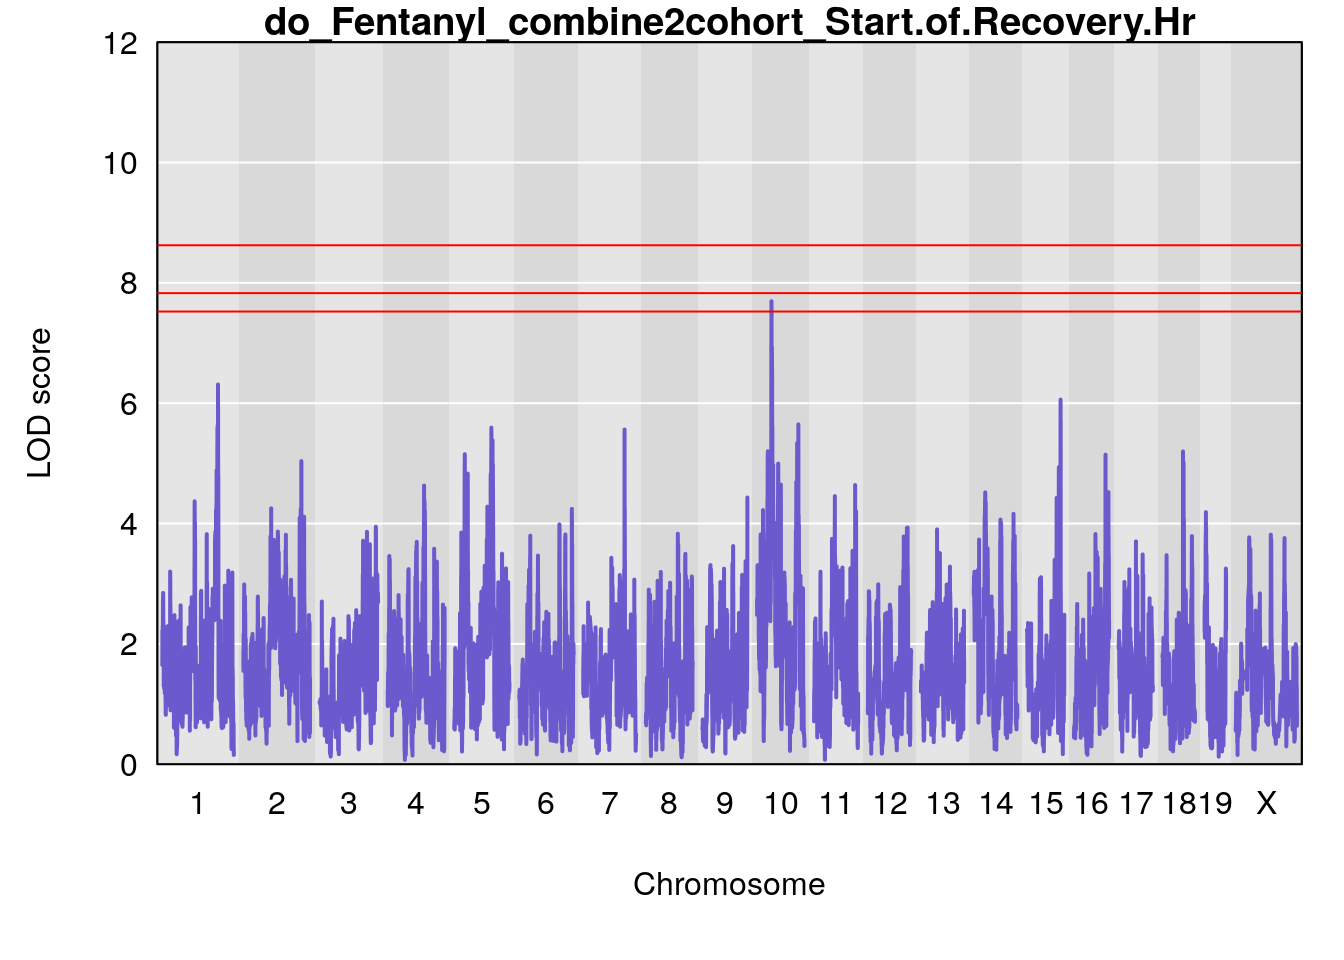
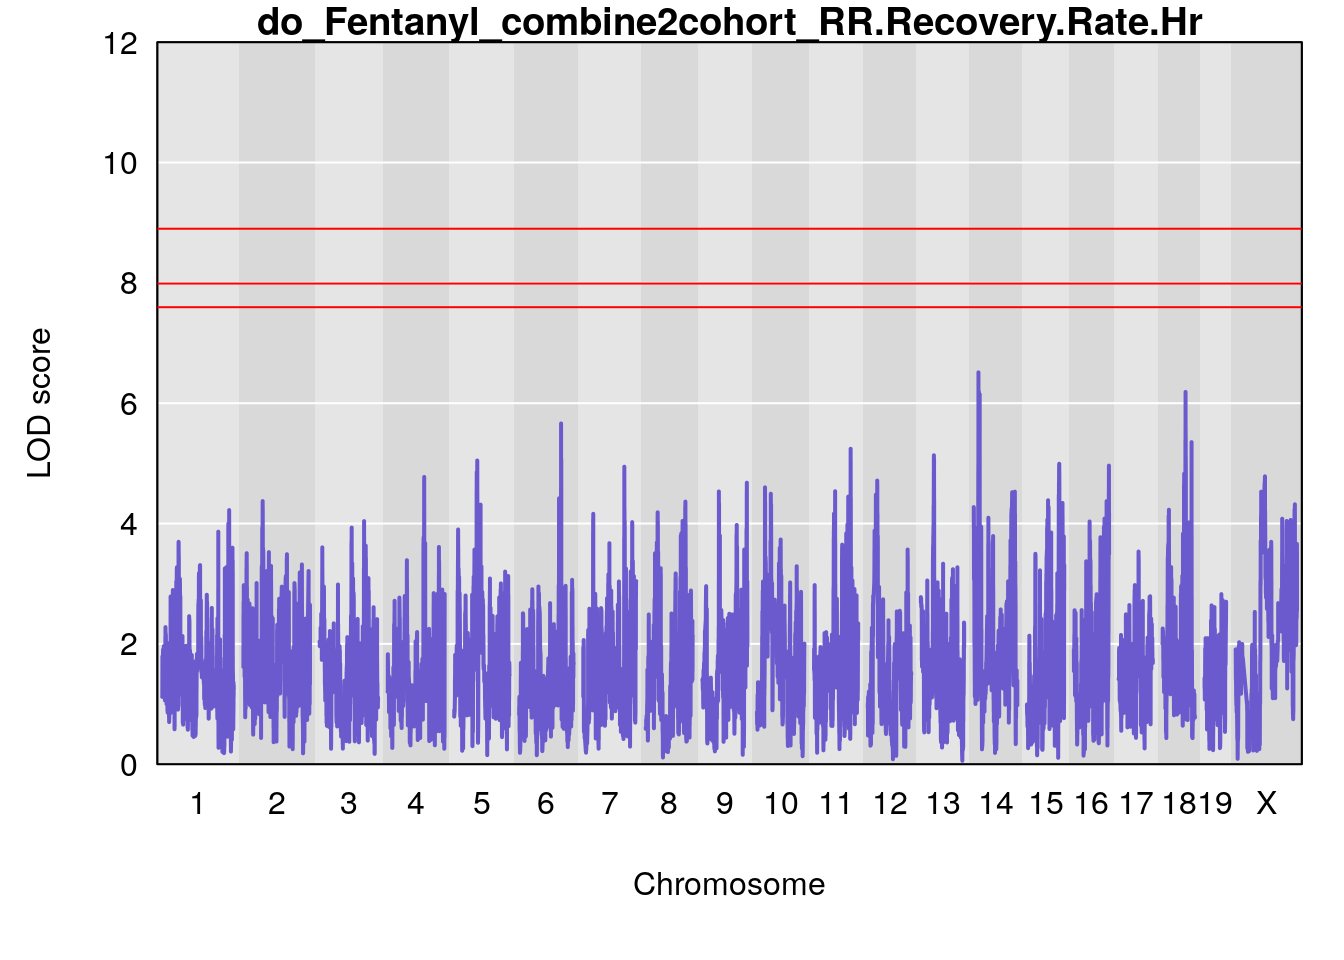
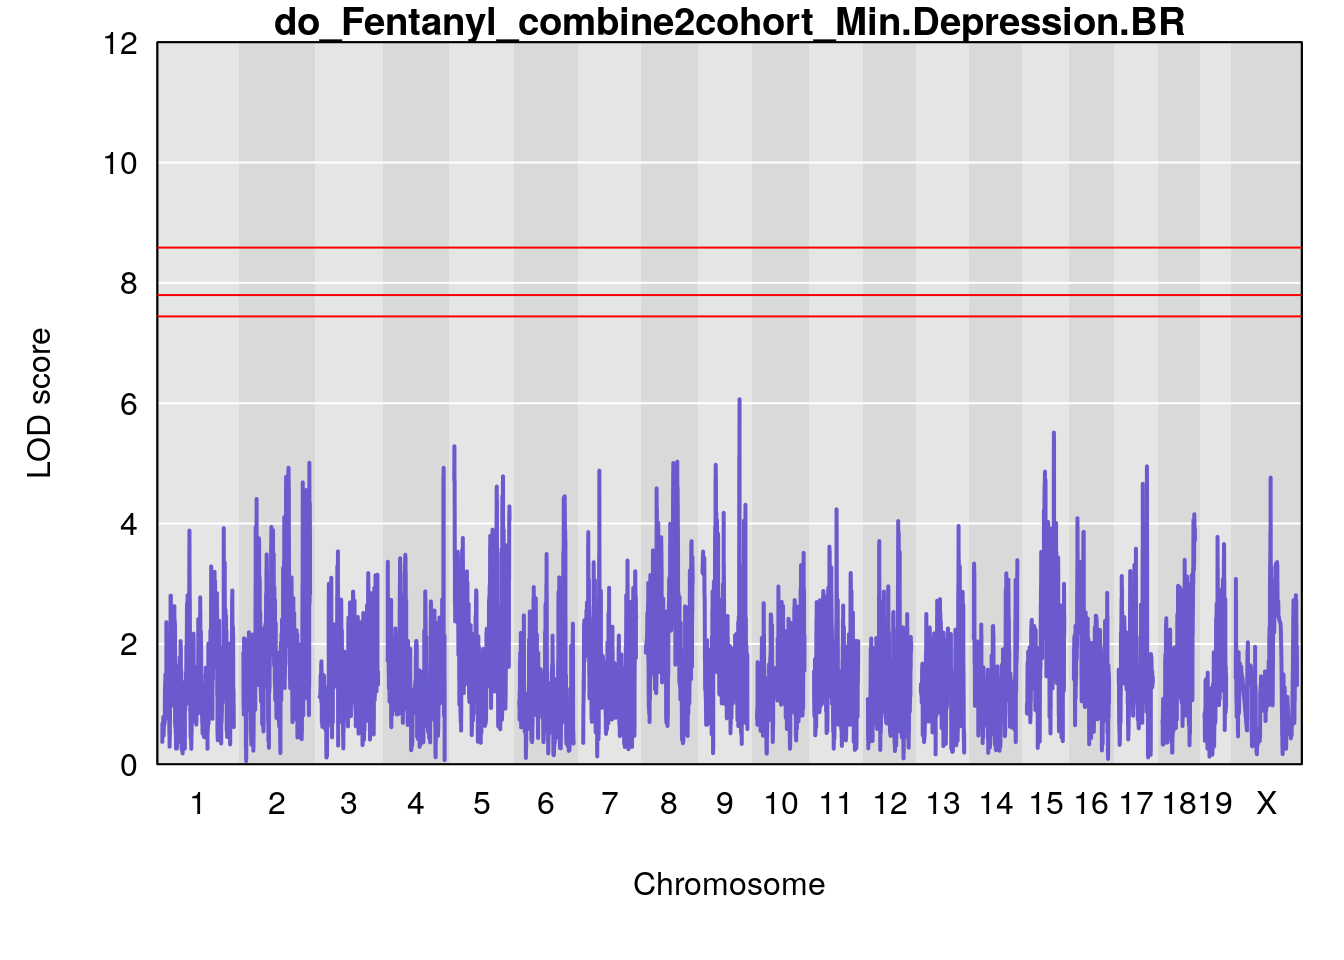
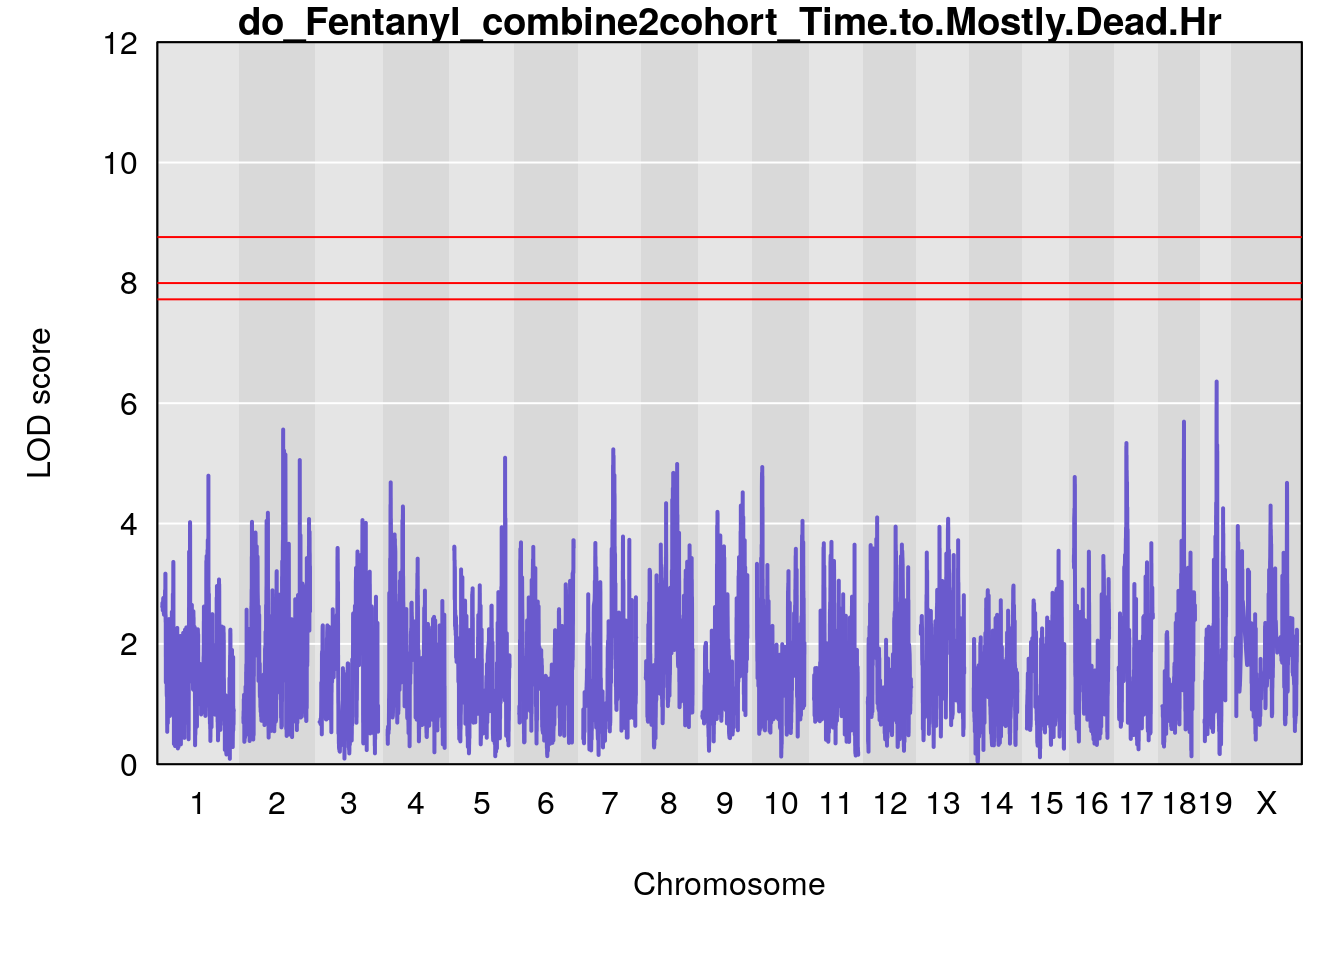
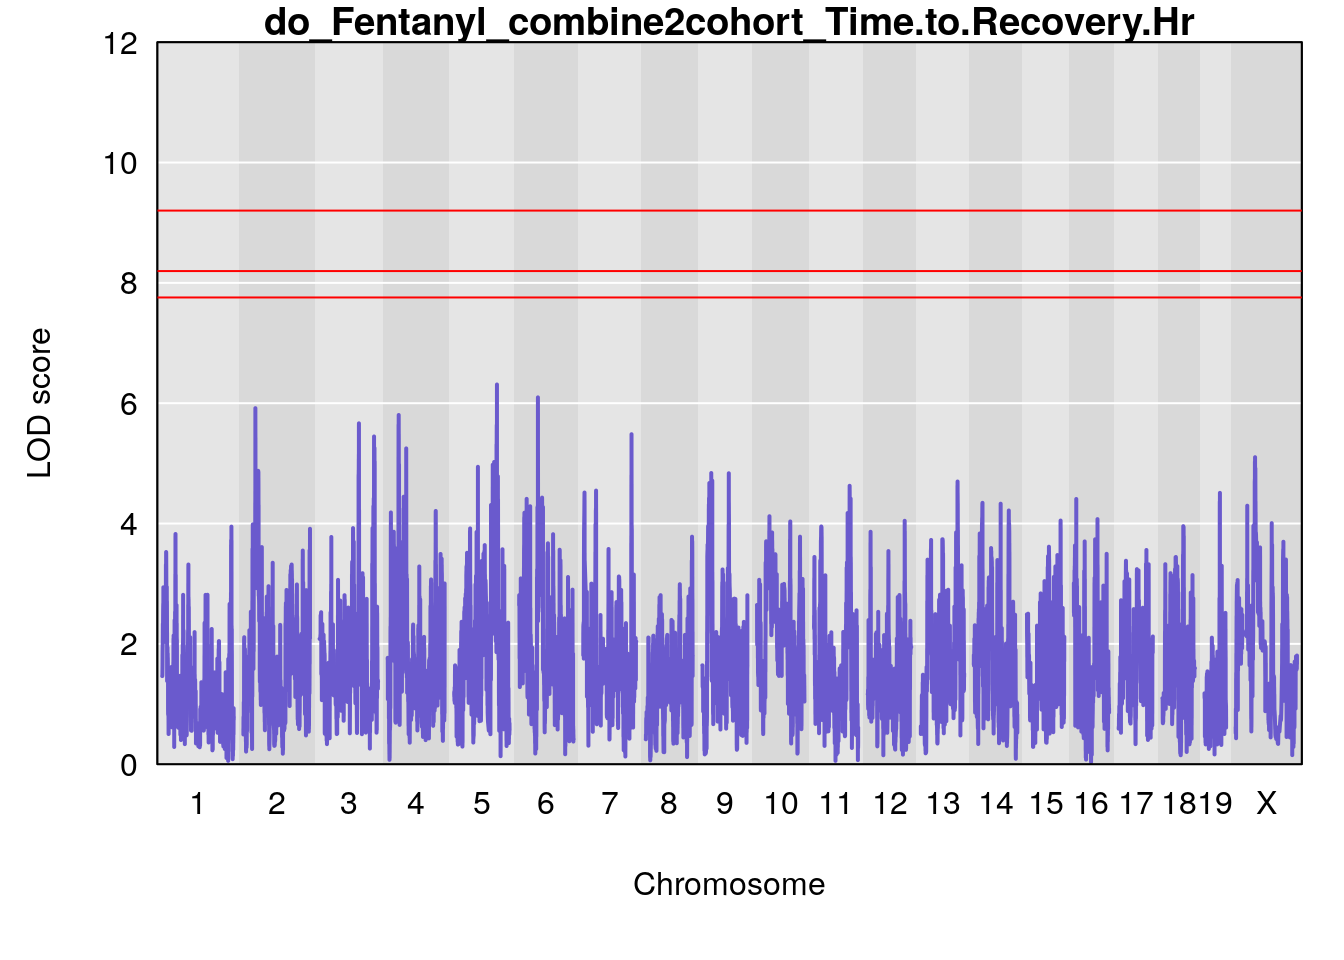
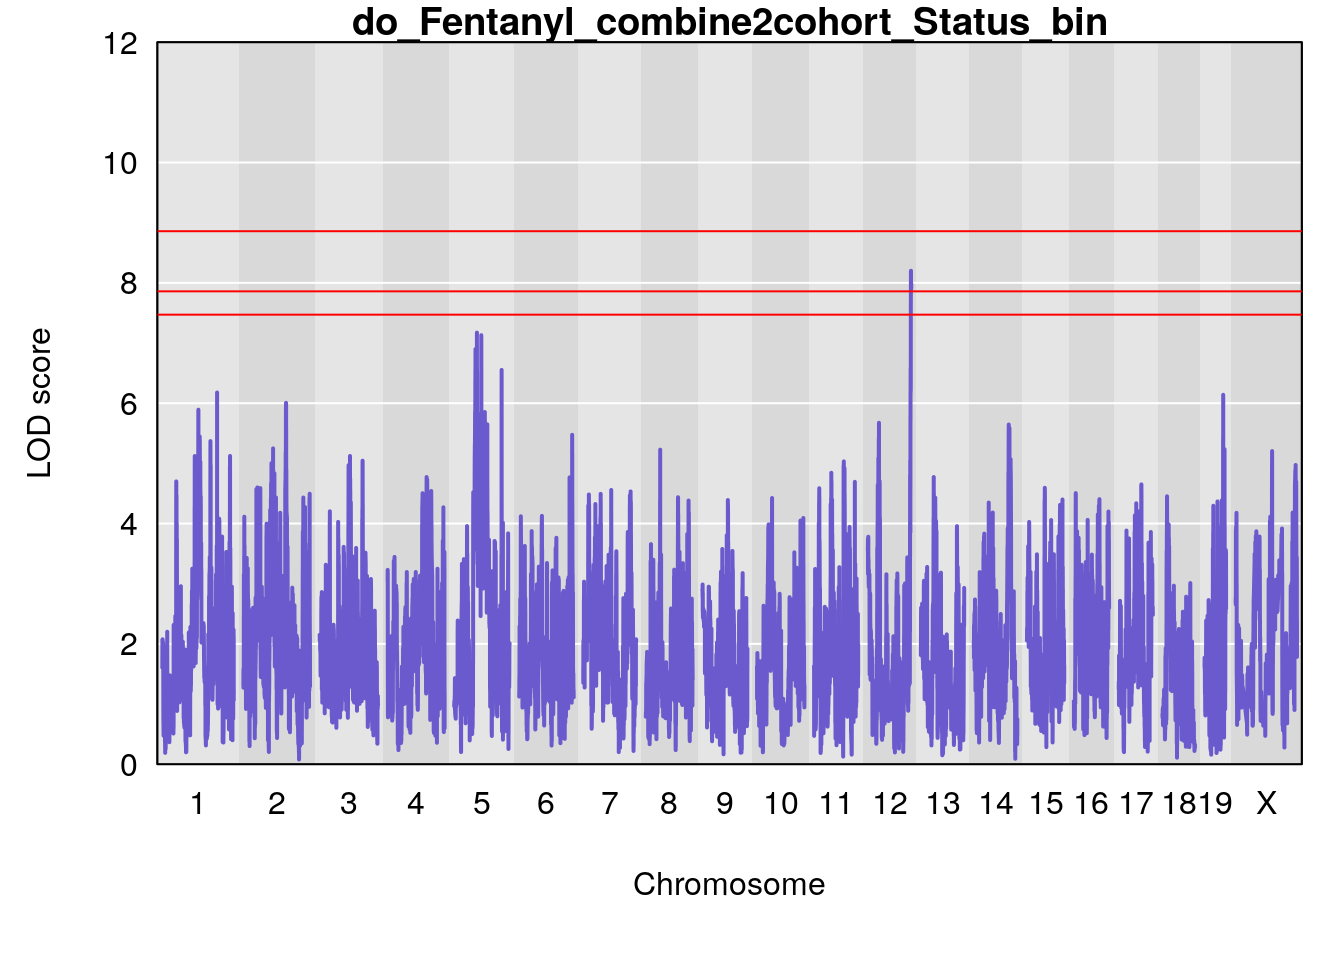
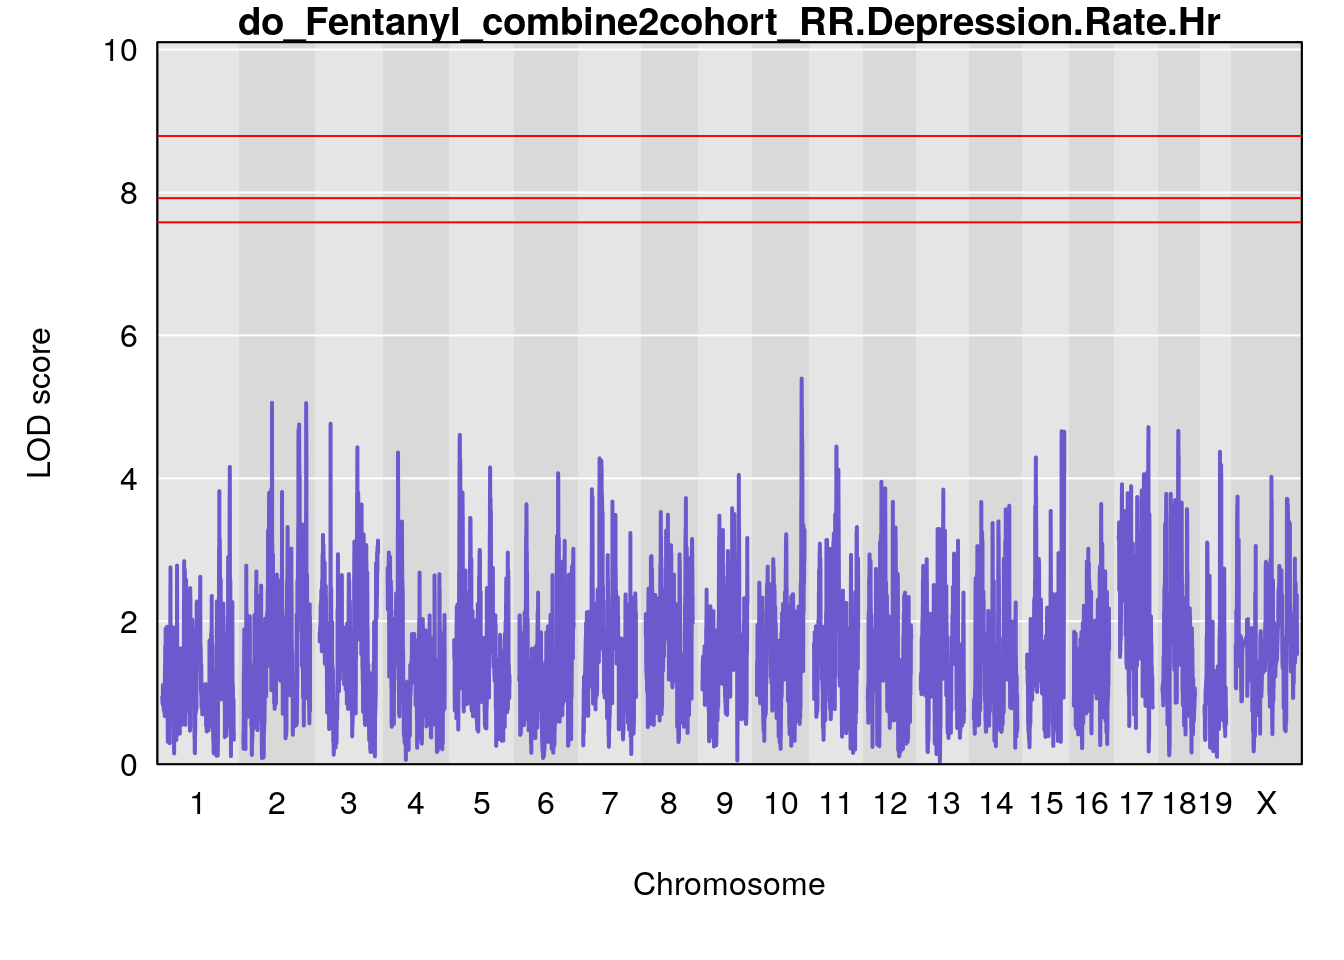
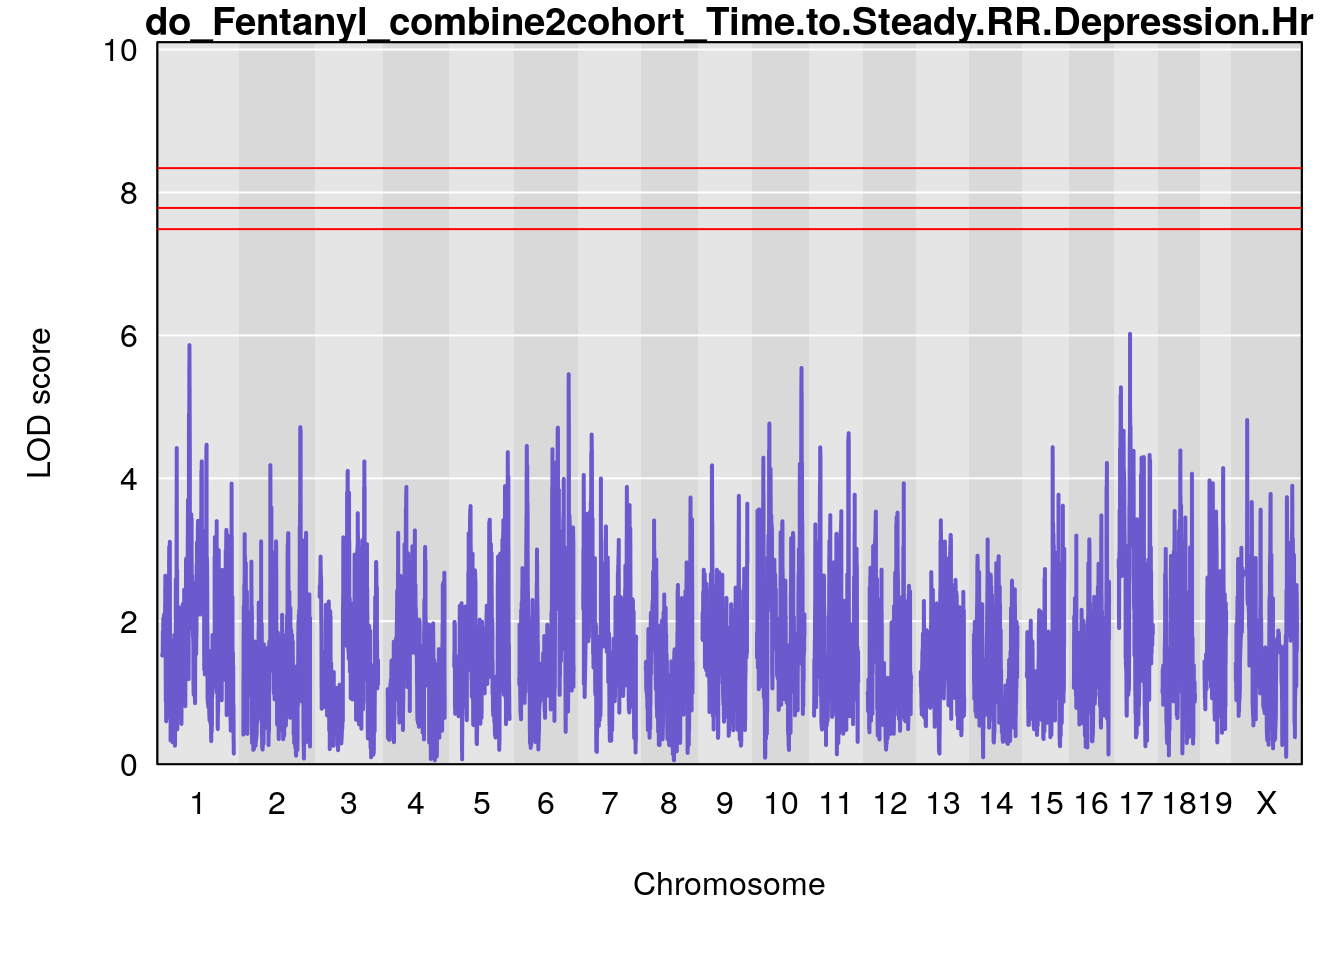
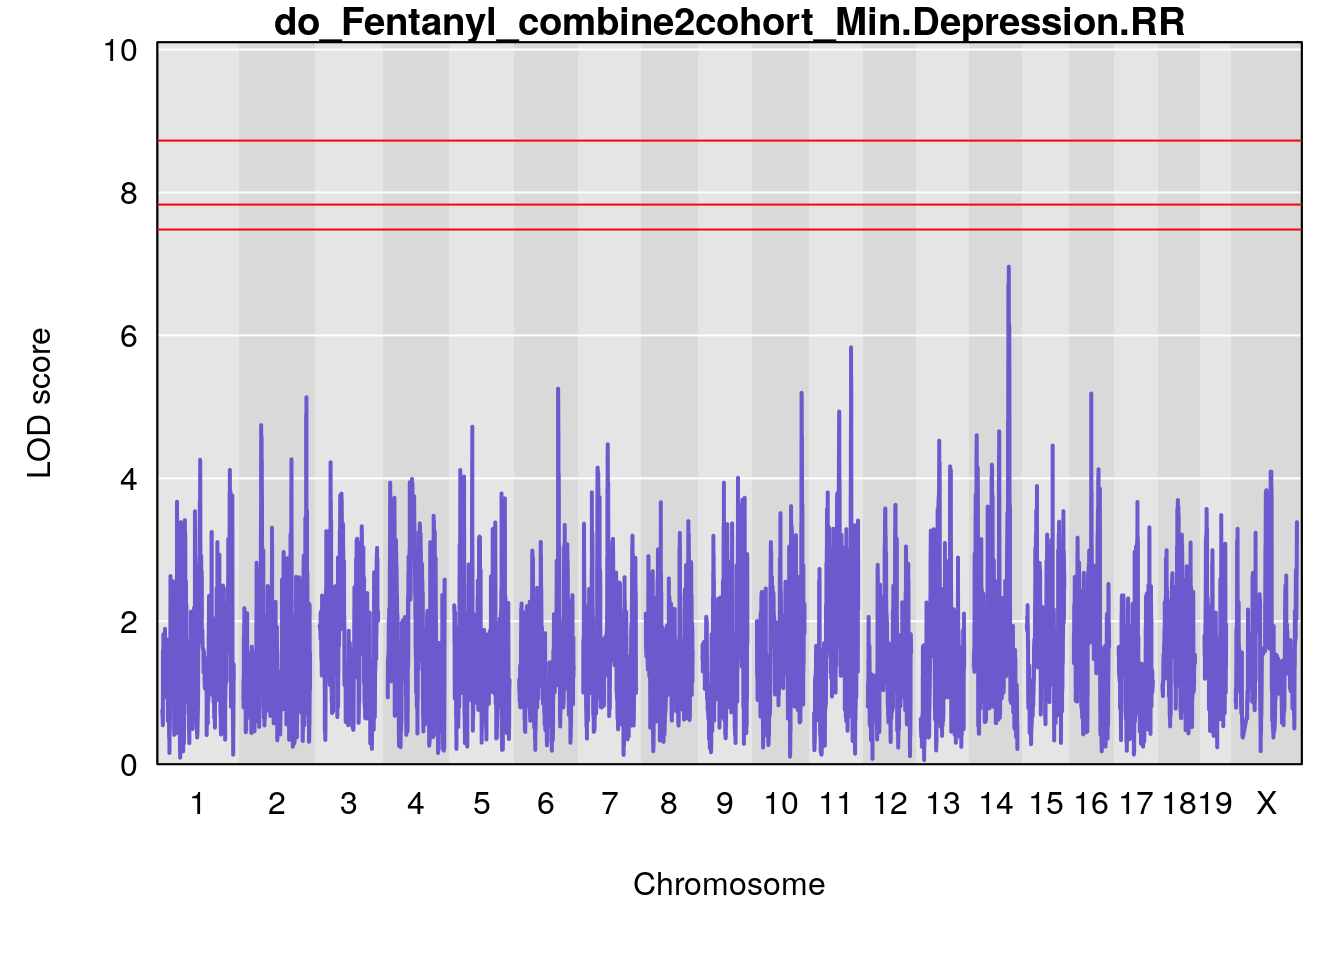
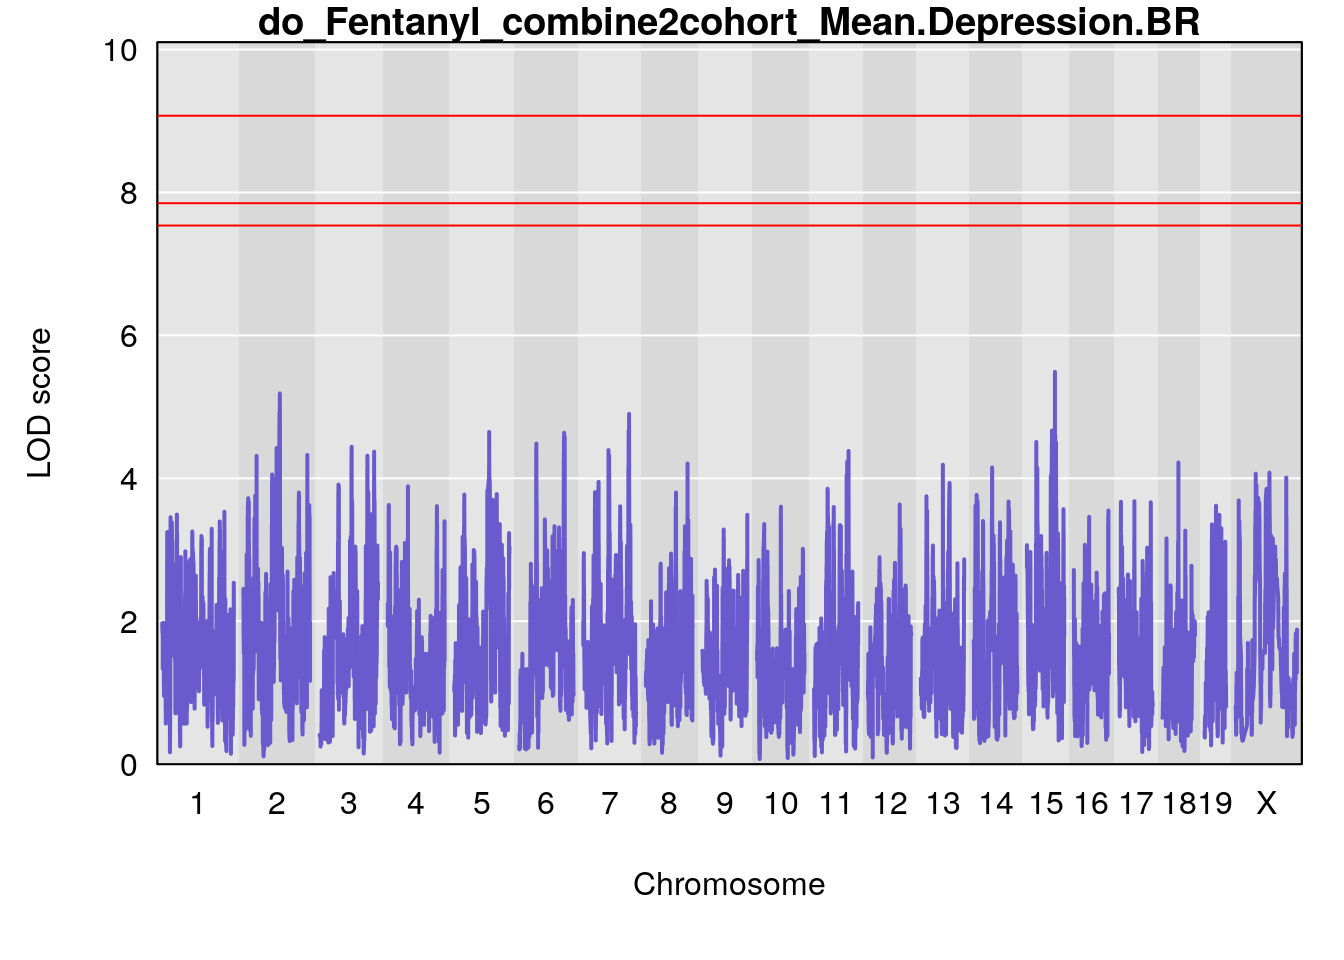
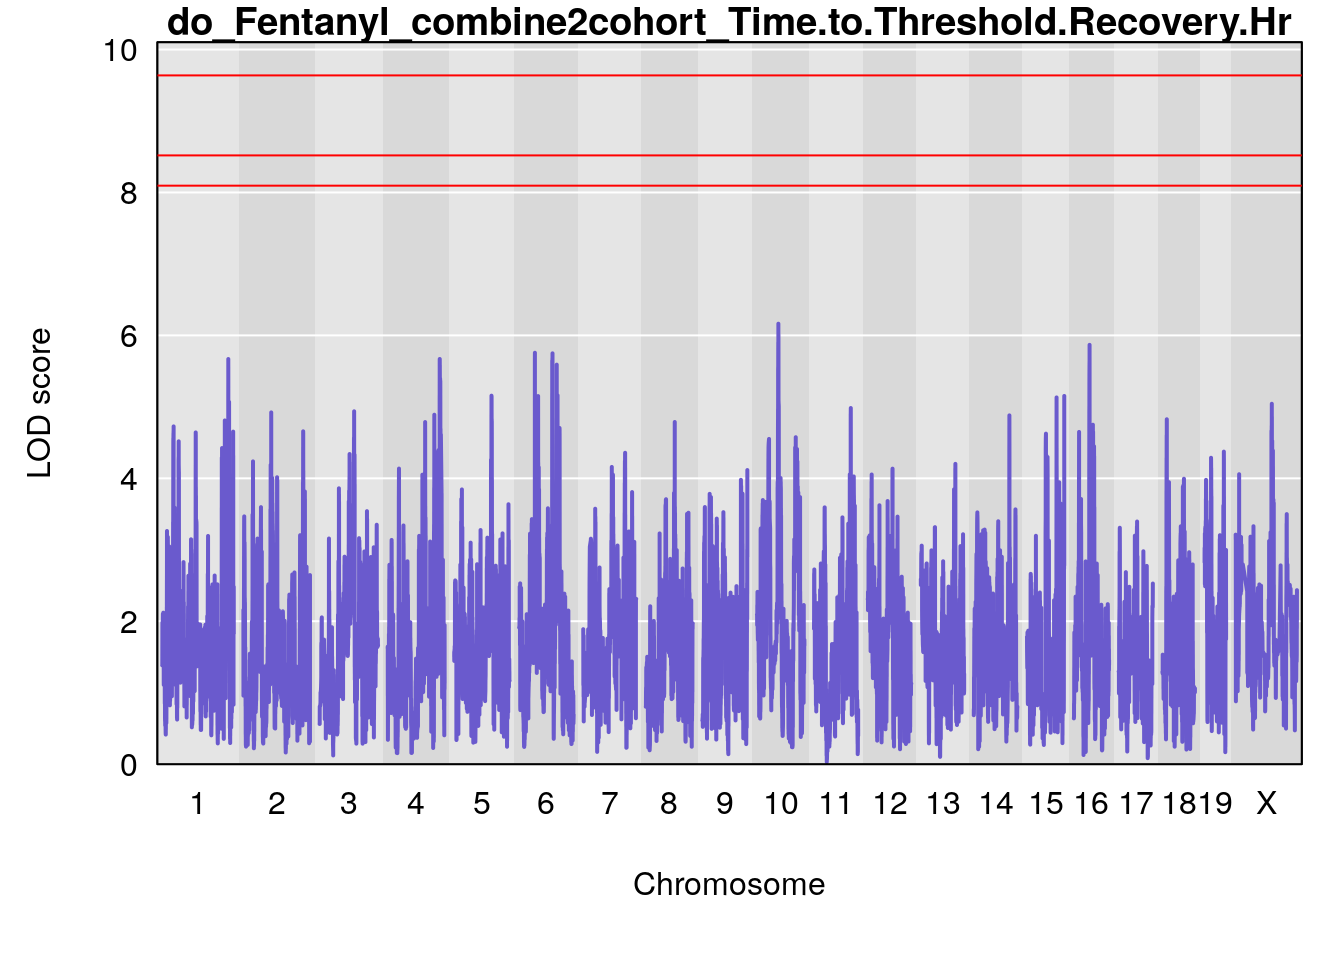
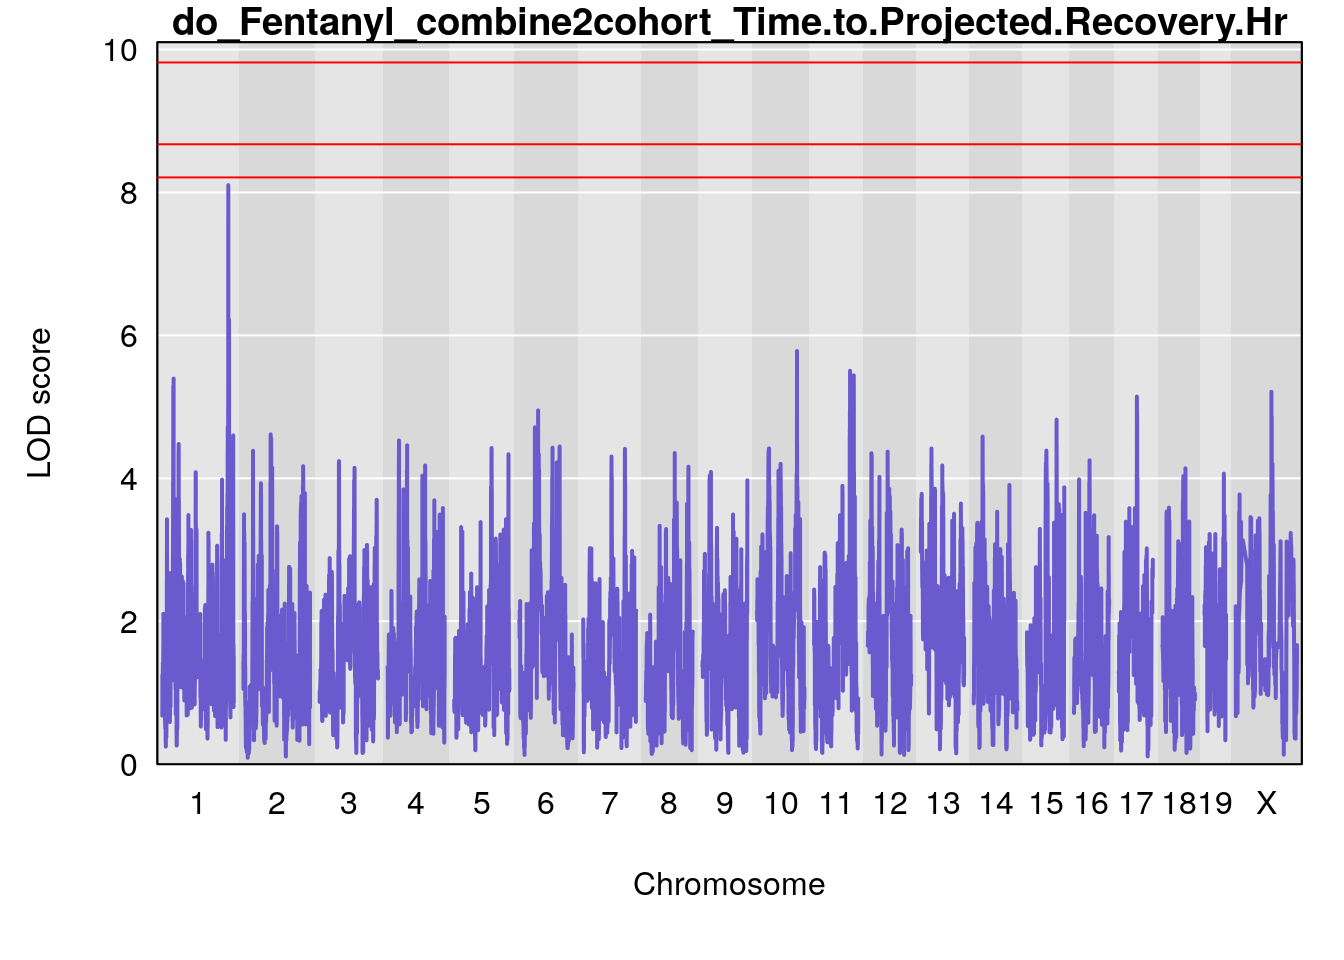
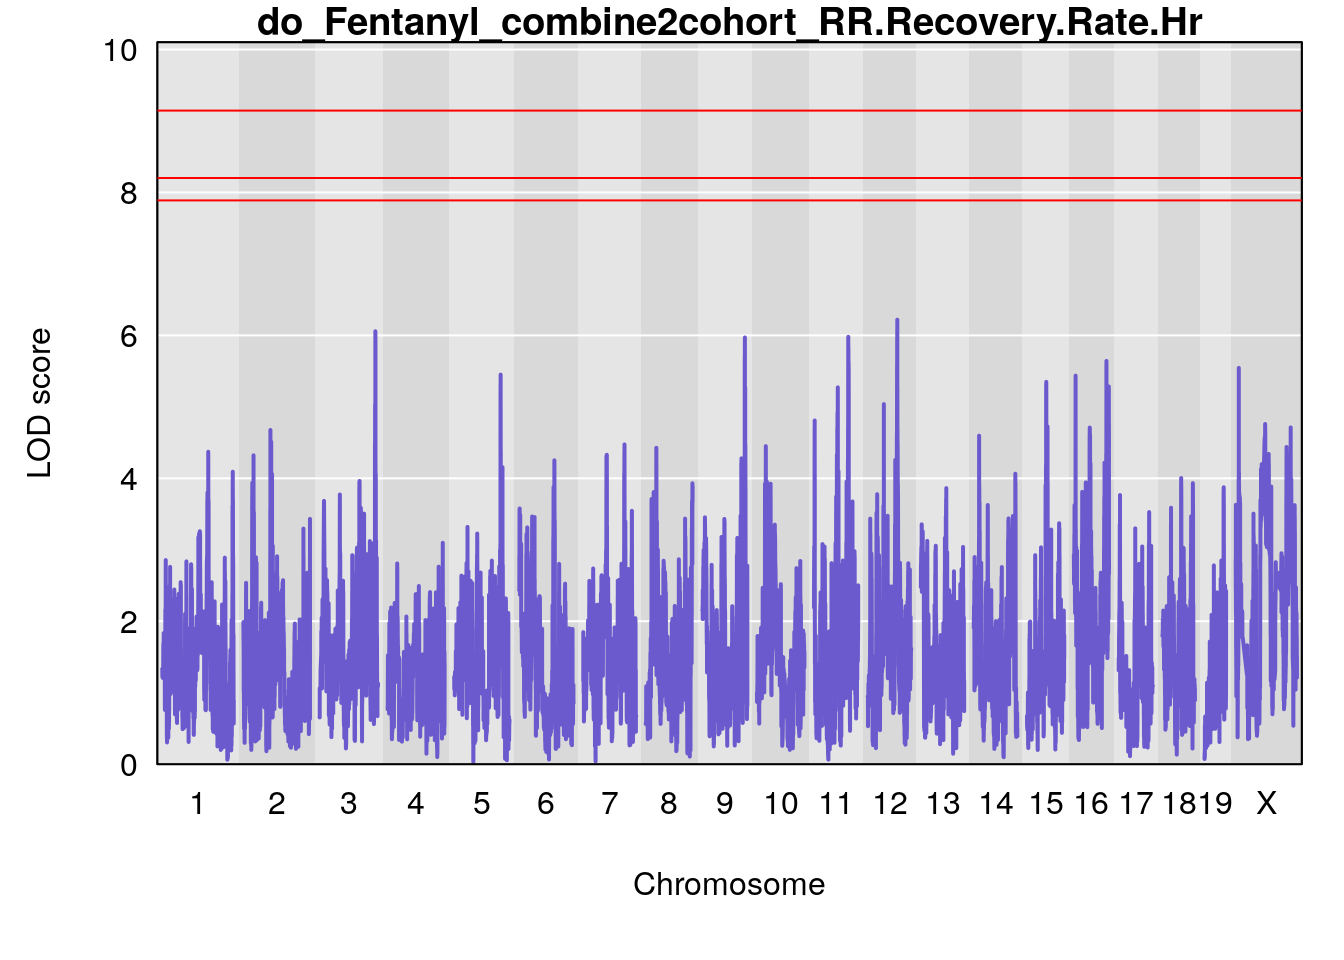
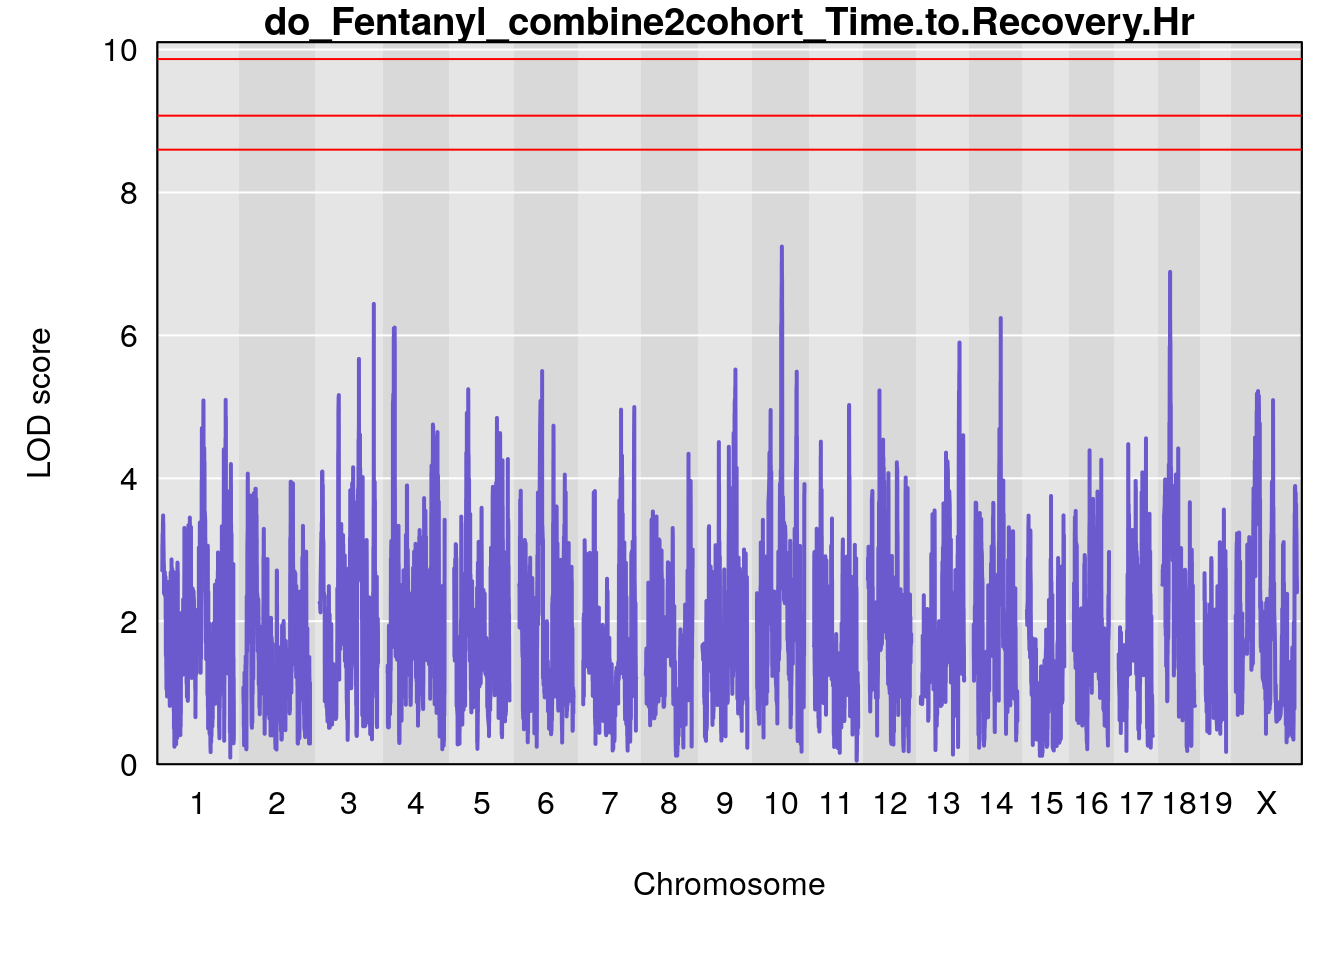
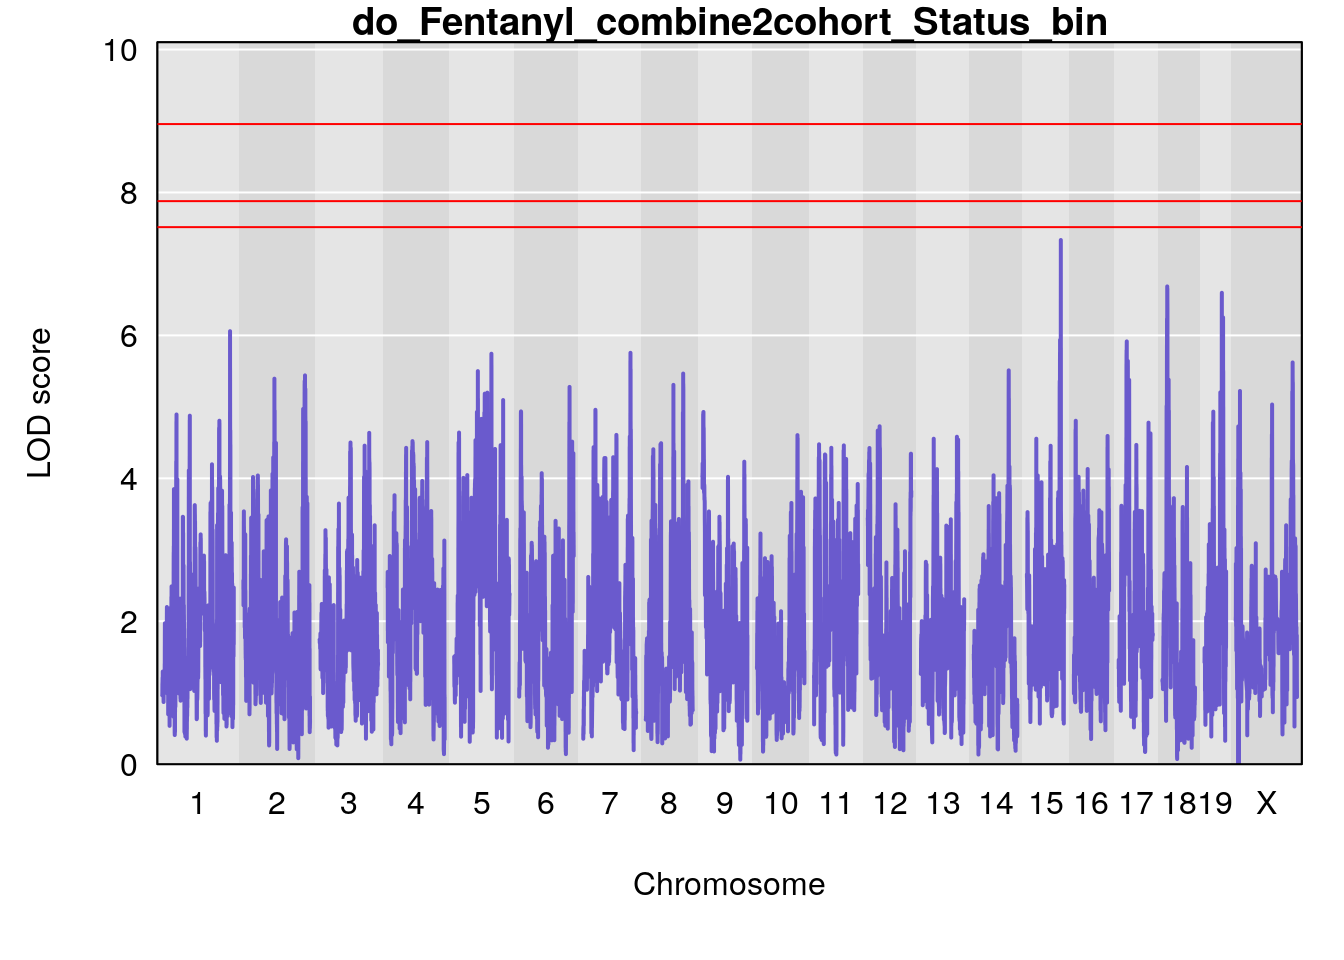
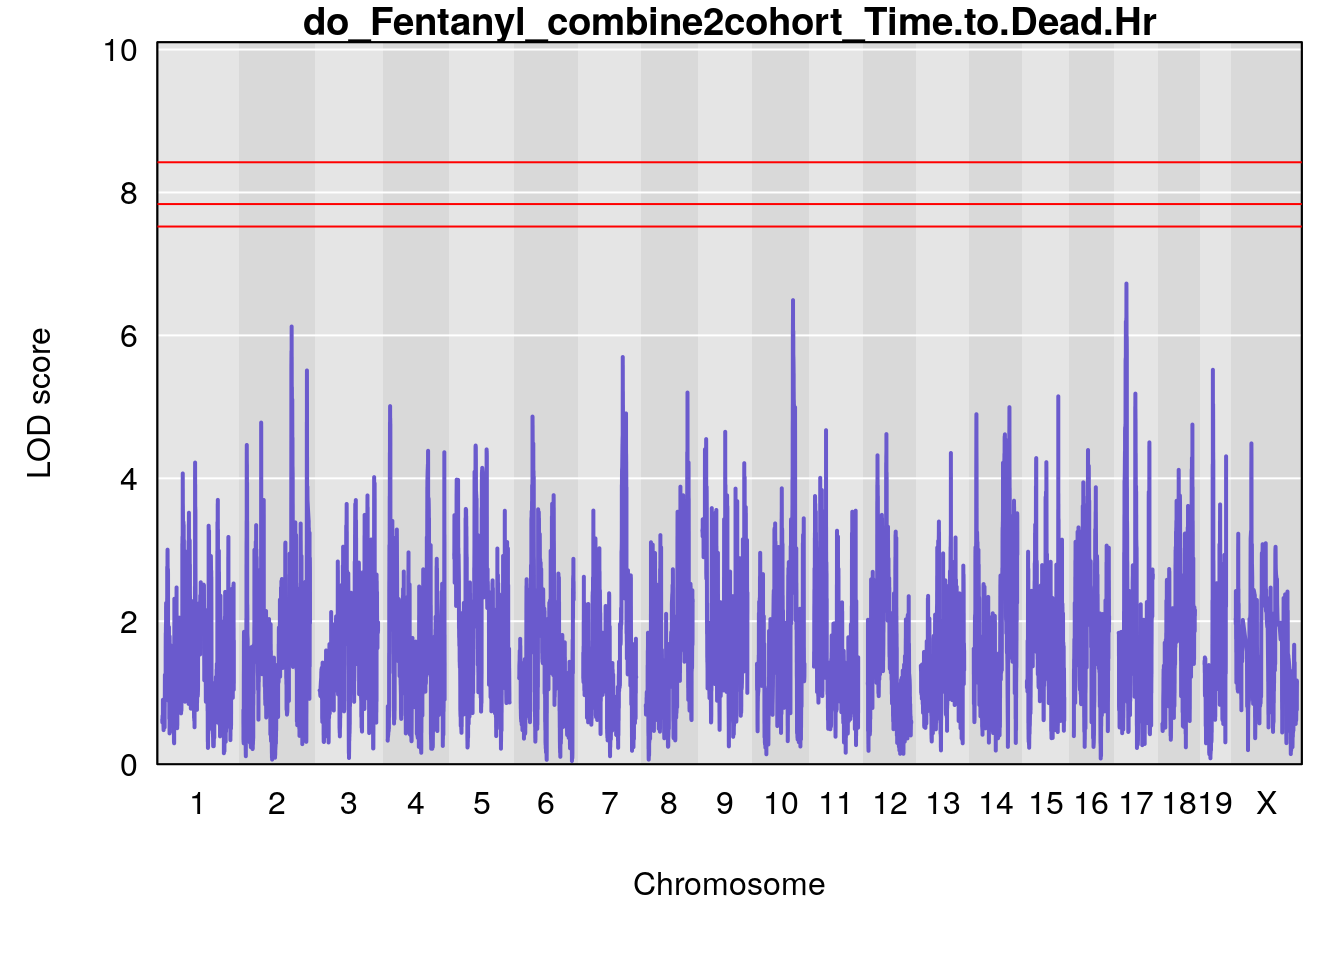
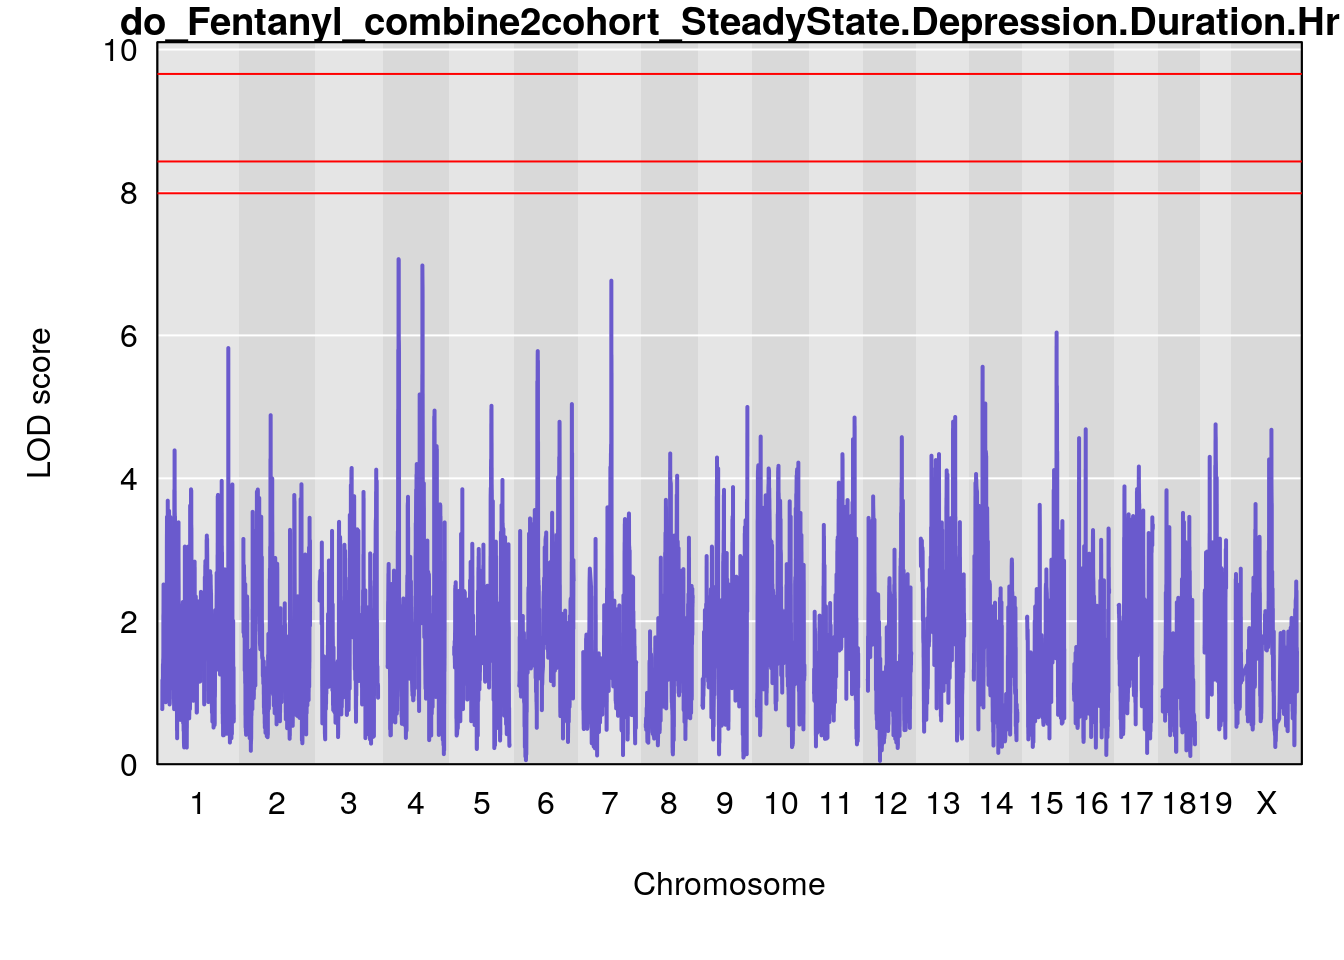
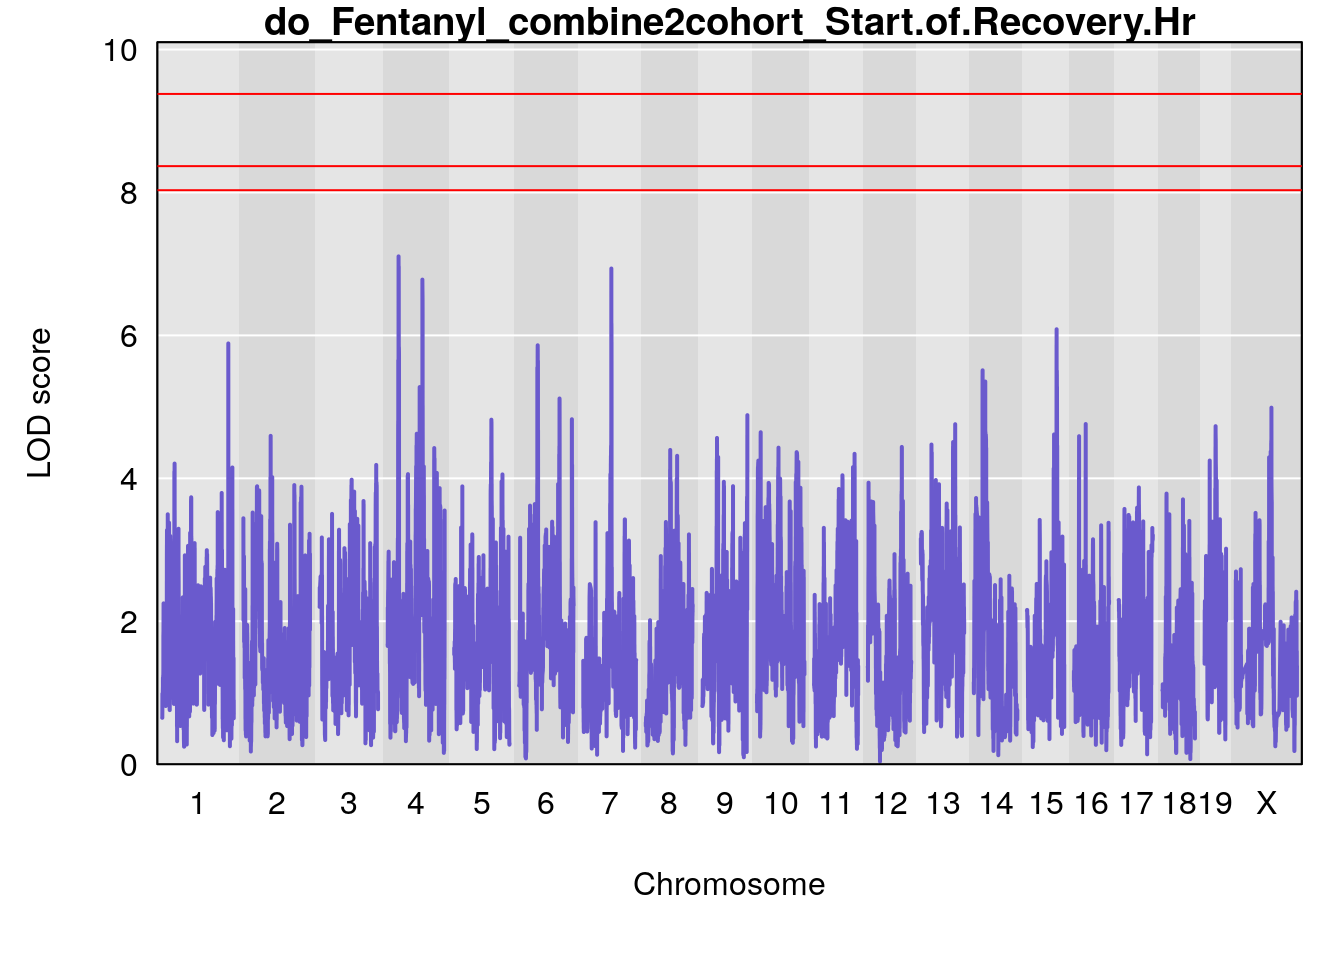
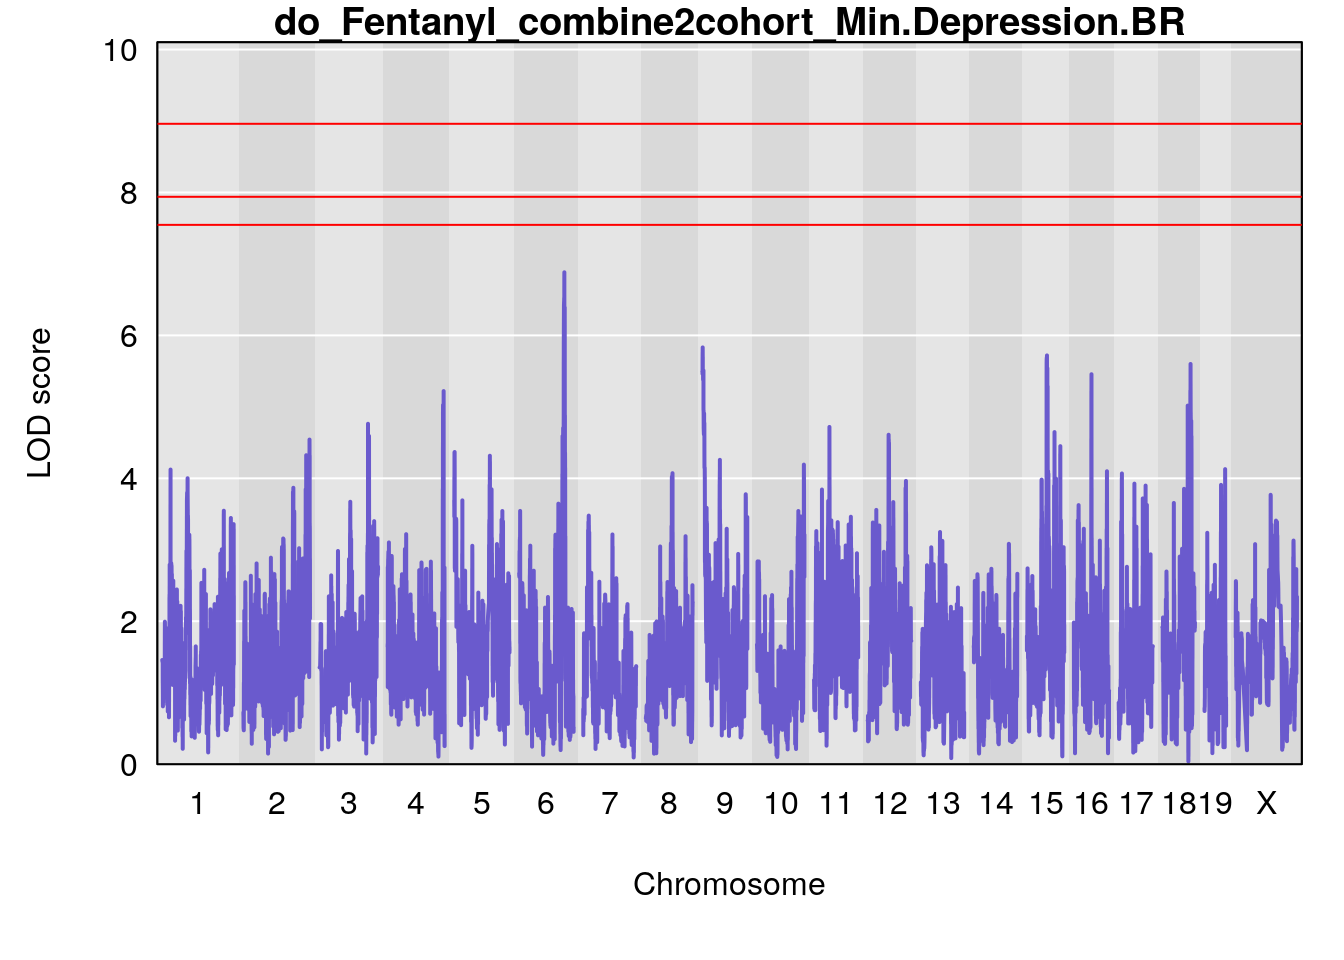
#genome-wide plot
for(i in names(qtl.out)){
par(mar=c(5.1, 4.1, 1.1, 1.1))
ymx <- maxlod(qtl.out[[i]]) # overall maximum LOD score
plot(qtl.out[[i]], map=pmap, lodcolumn=1, col="slateblue", ylim=c(0, 12))
abline(h=summary(qtl.operm[[i]], alpha=c(0.10, 0.05, 0.01))[[1]], col="red")
abline(h=summary(qtl.operm[[i]], alpha=c(0.10, 0.05, 0.01))[[2]], col="red")
abline(h=summary(qtl.operm[[i]], alpha=c(0.10, 0.05, 0.01))[[3]], col="red")
title(main = paste0("do_Fentanyl_combine2cohort_",i))
}
pdf(file = paste0("output/Fentanyl/do_Fentanyl_combine2cohort.pdf"), width = 16, height =8)
#save genome-wide plo
for(i in names(qtl.out)){
par(mar=c(5.1, 4.1, 1.1, 1.1))
ymx <- maxlod(qtl.out[[i]]) # overall maximum LOD score
plot(qtl.out[[i]], map=pmap, lodcolumn=1, col="slateblue", ylim=c(0, 10))
abline(h=summary(qtl.operm[[i]], alpha=c(0.10, 0.05, 0.01))[[1]], col="red")
abline(h=summary(qtl.operm[[i]], alpha=c(0.10, 0.05, 0.01))[[2]], col="red")
abline(h=summary(qtl.operm[[i]], alpha=c(0.10, 0.05, 0.01))[[3]], col="red")
title(main = paste0("do_Fentanyl_combine2cohort_",i))
}
dev.off()
# png
# 2
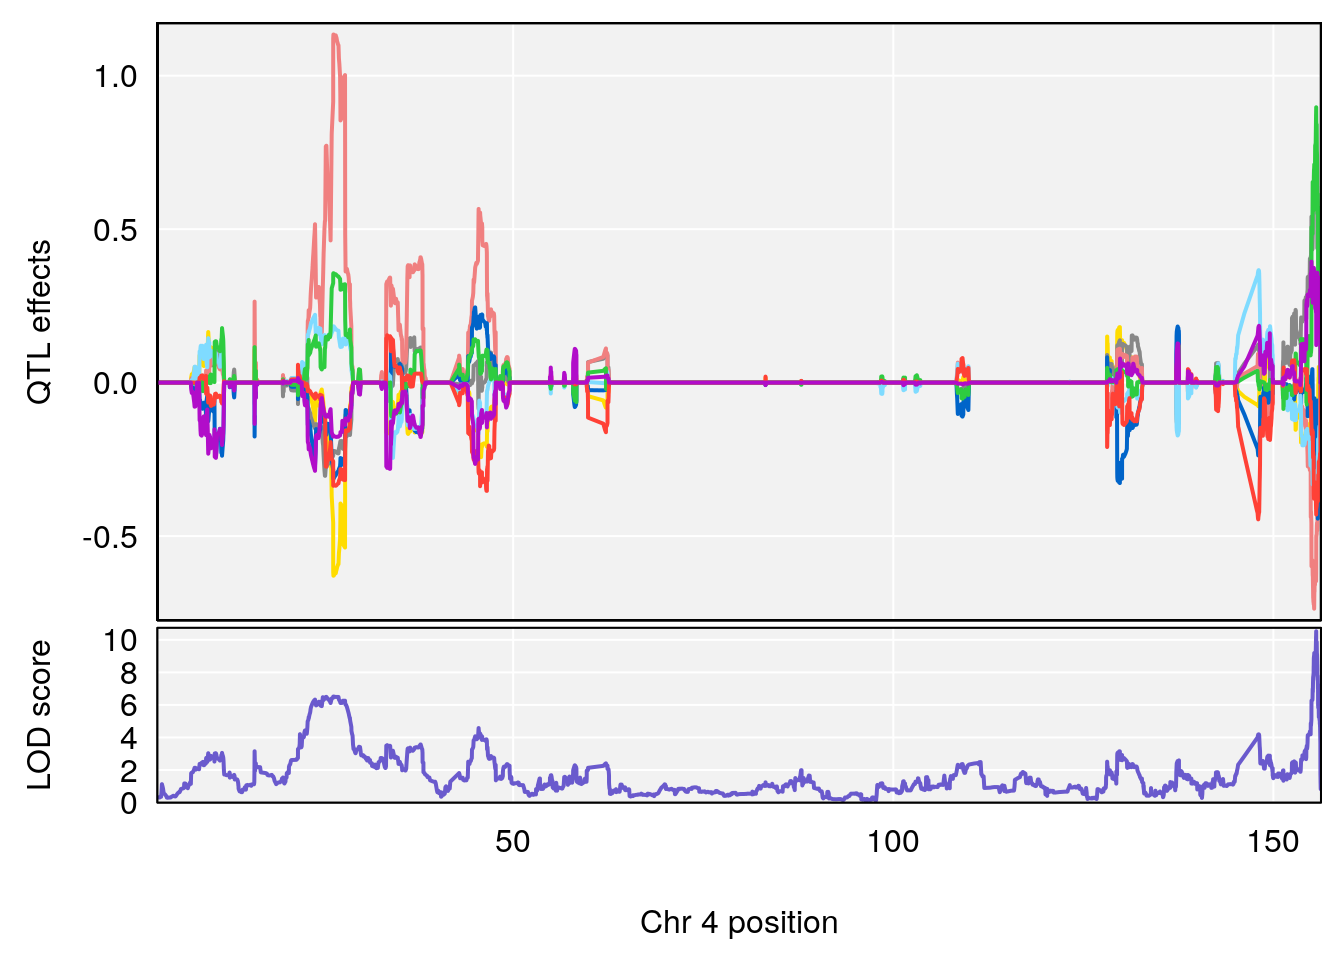
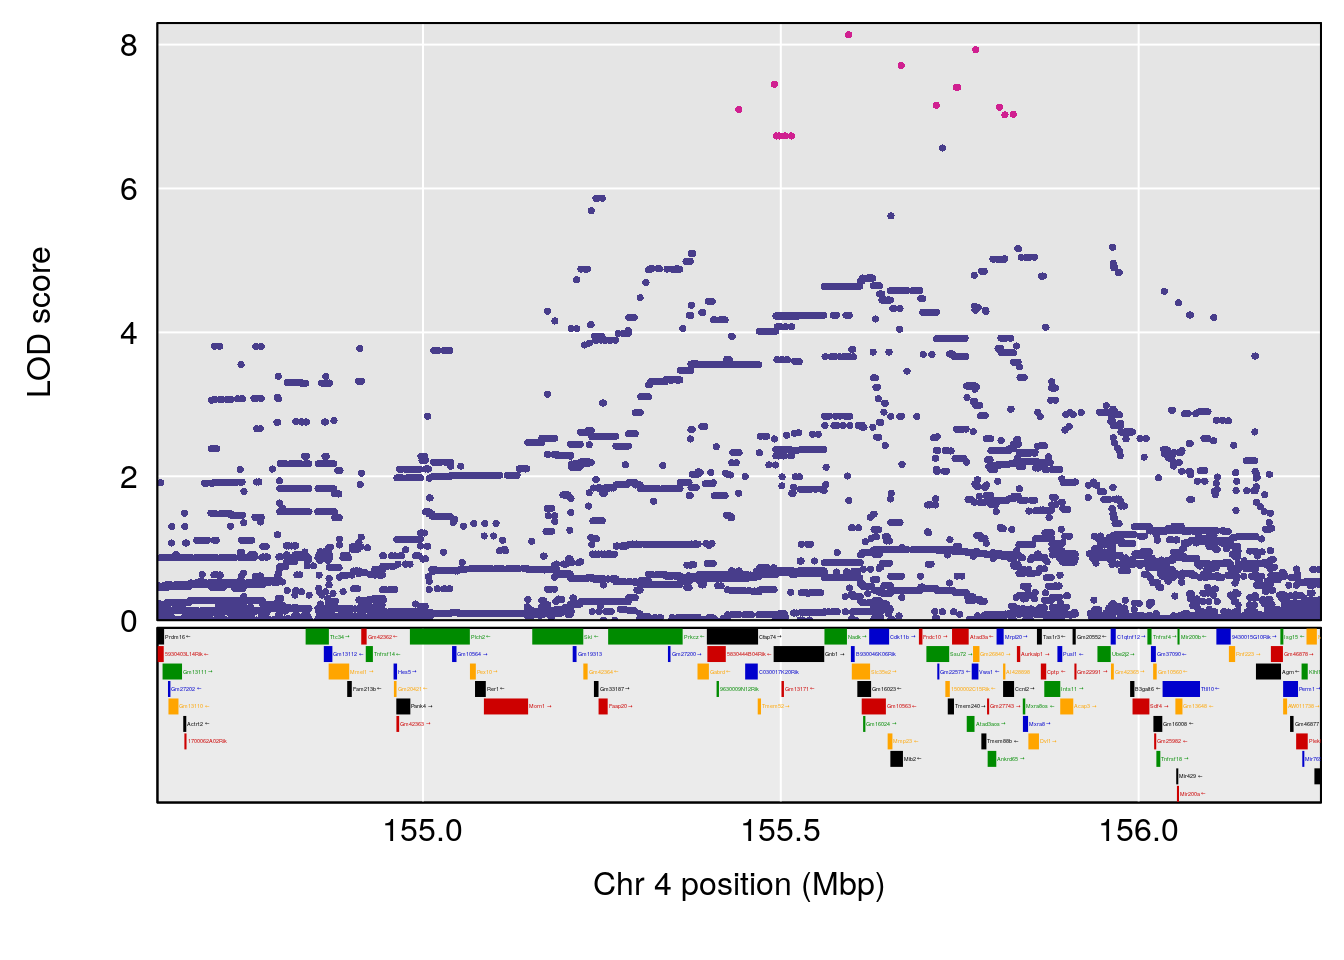
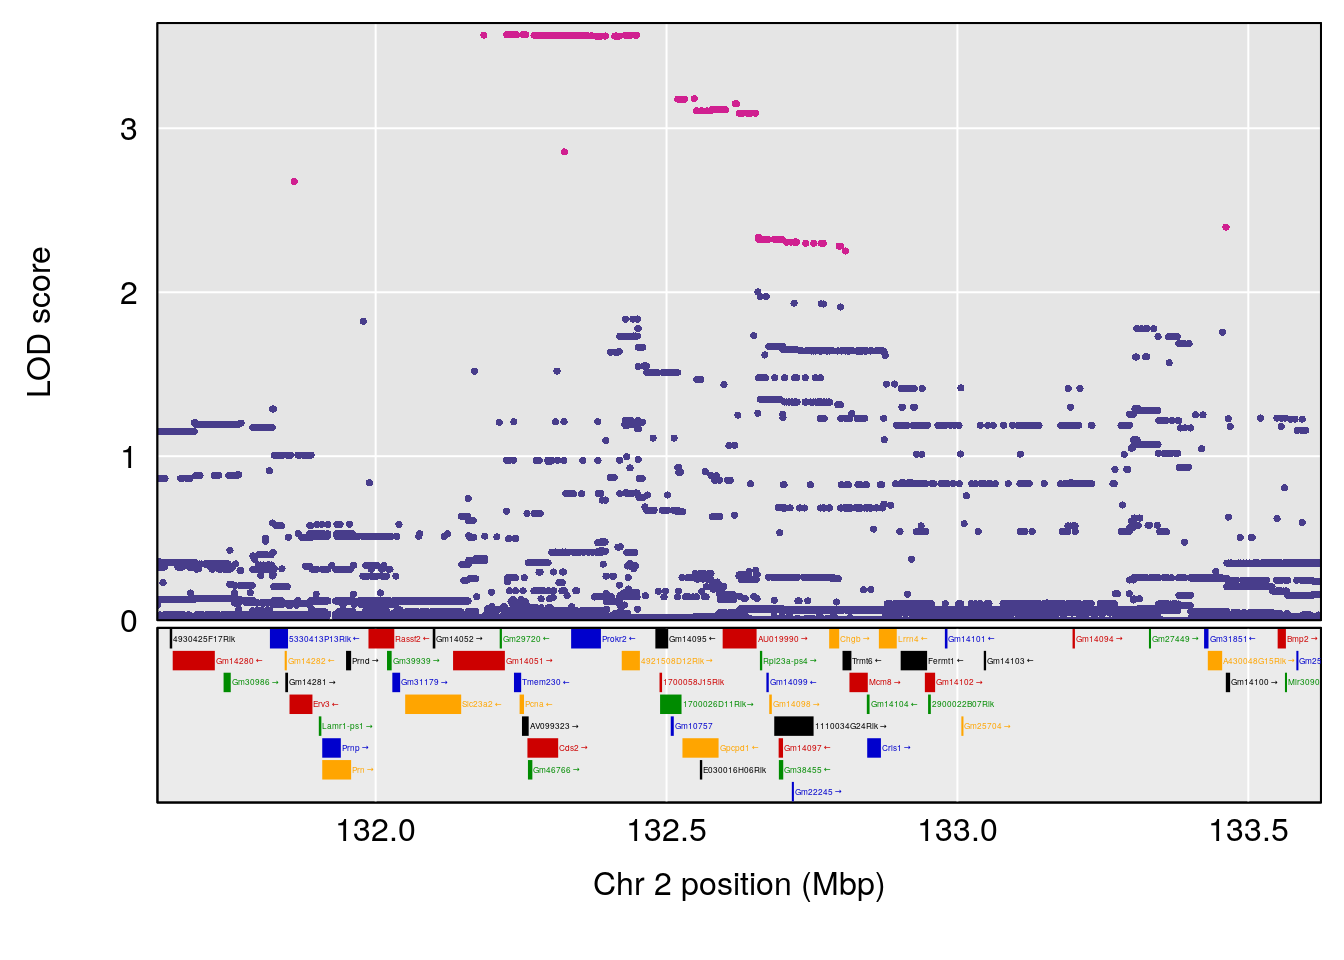
#peaks coeff plot
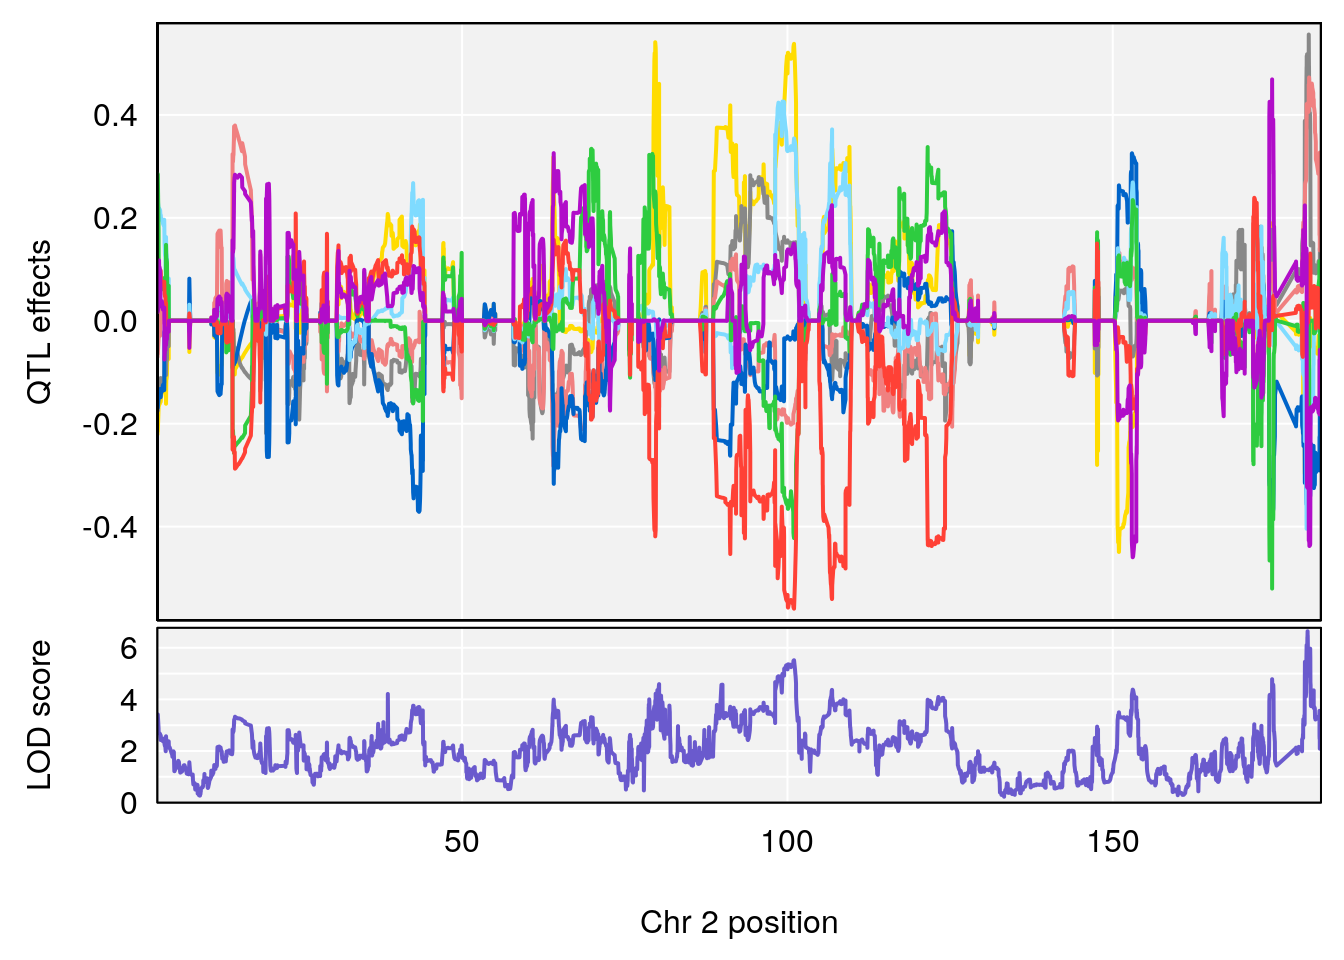
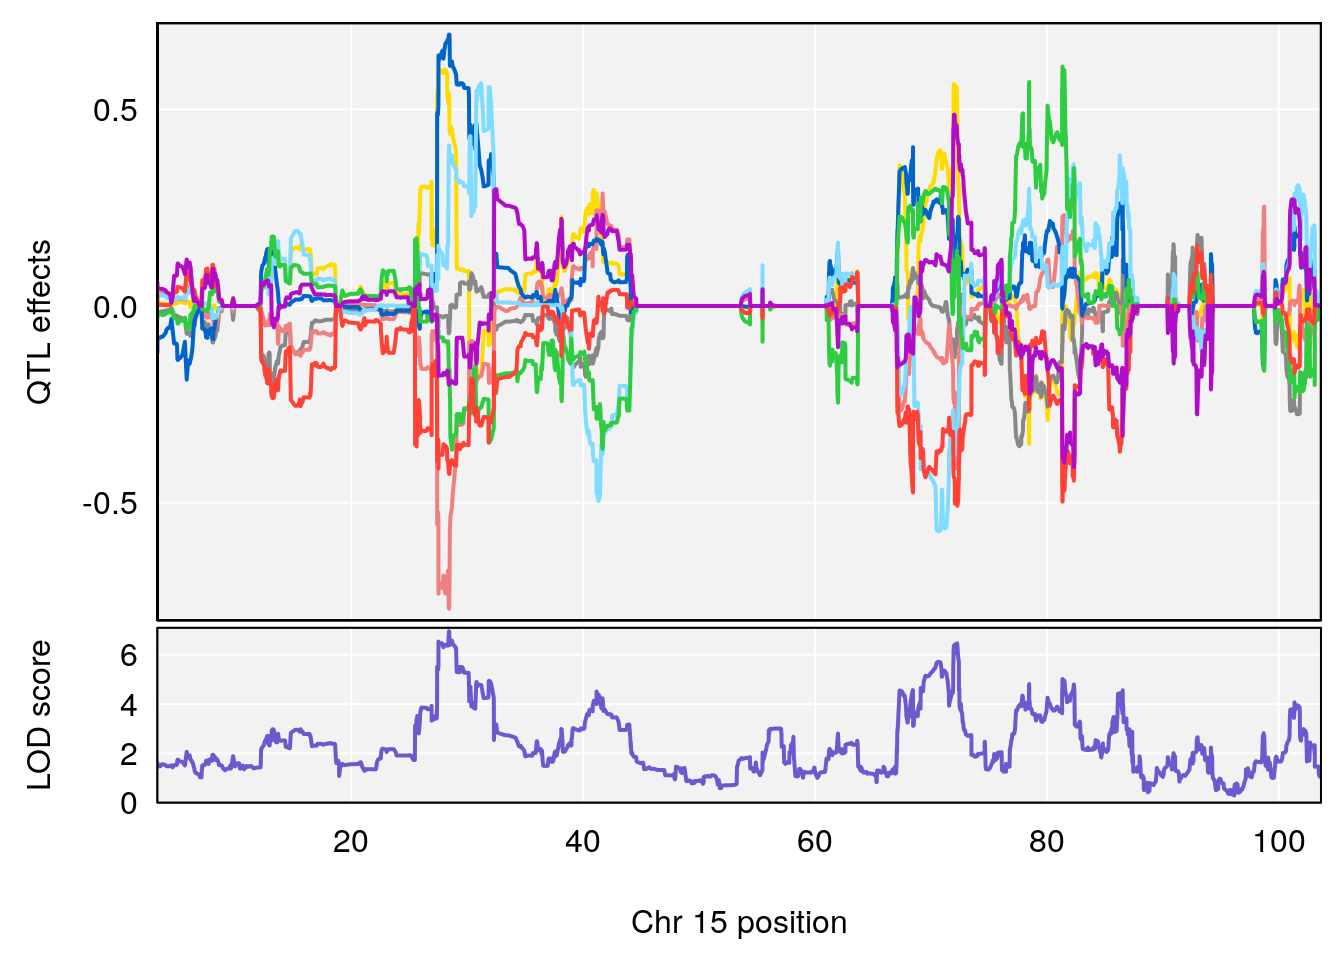
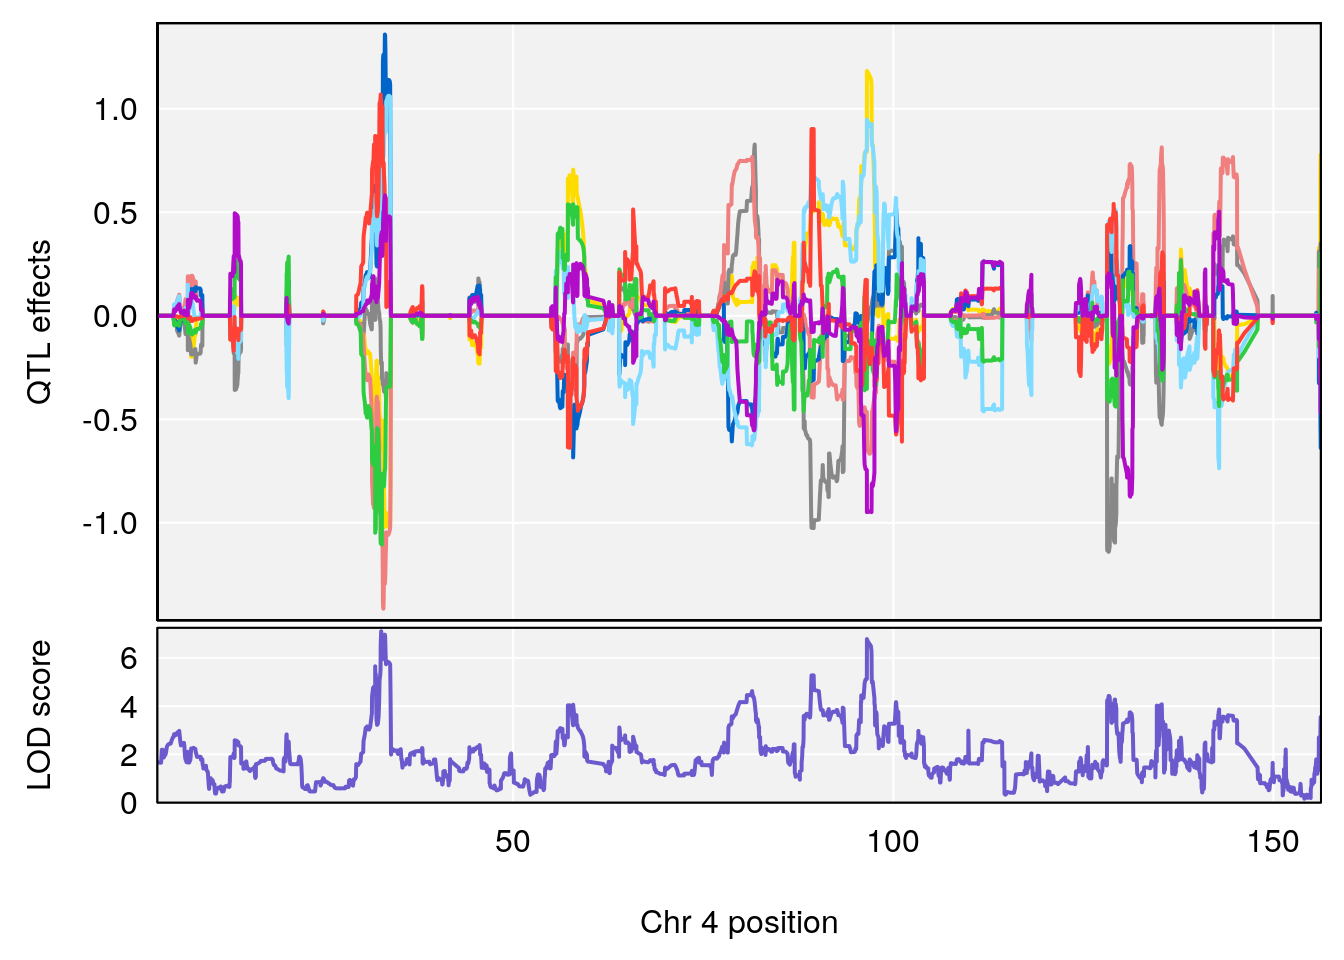
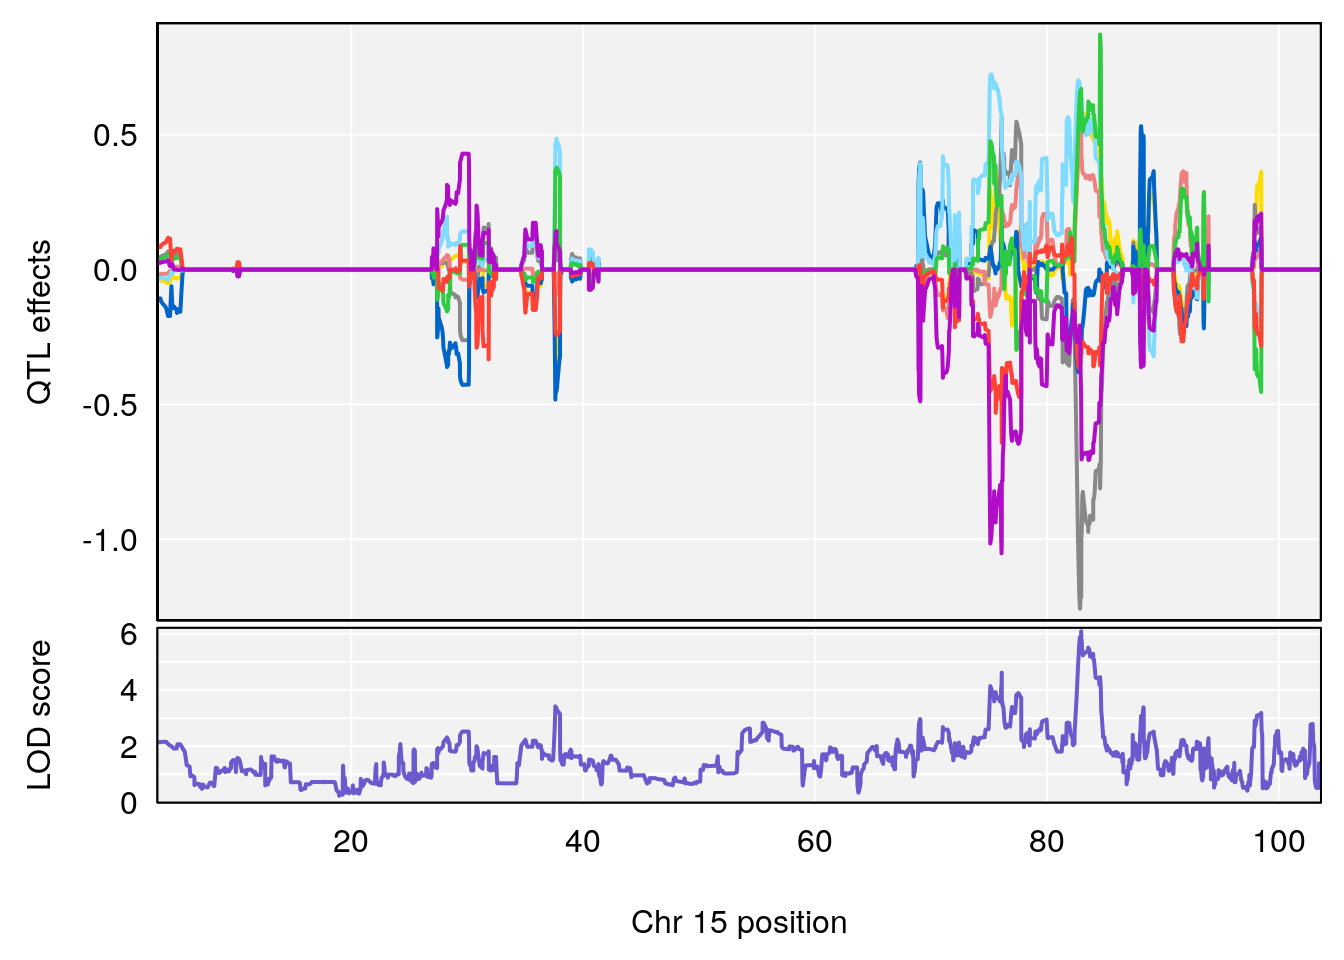
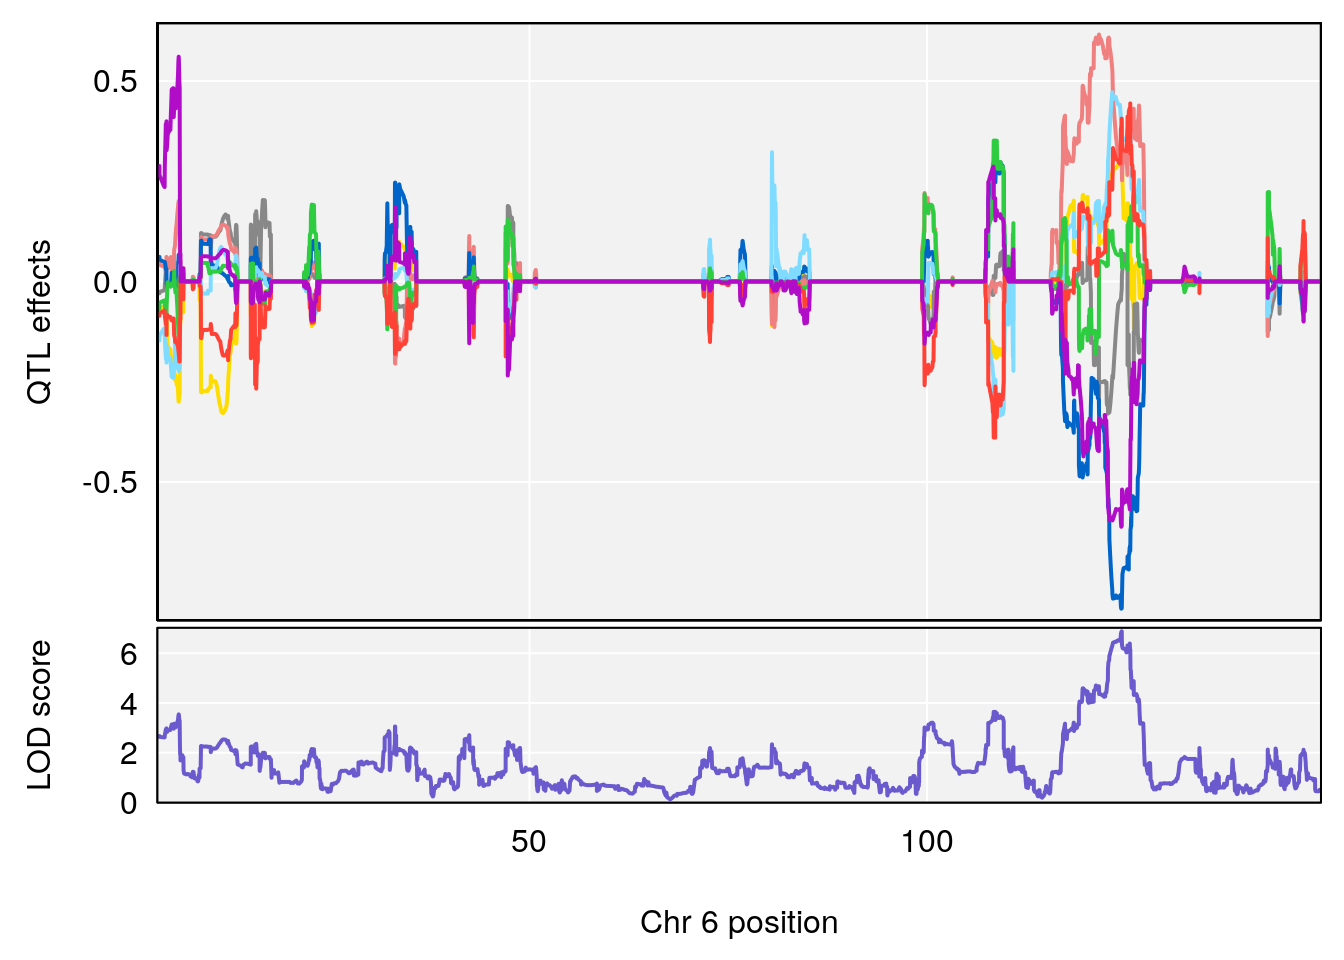
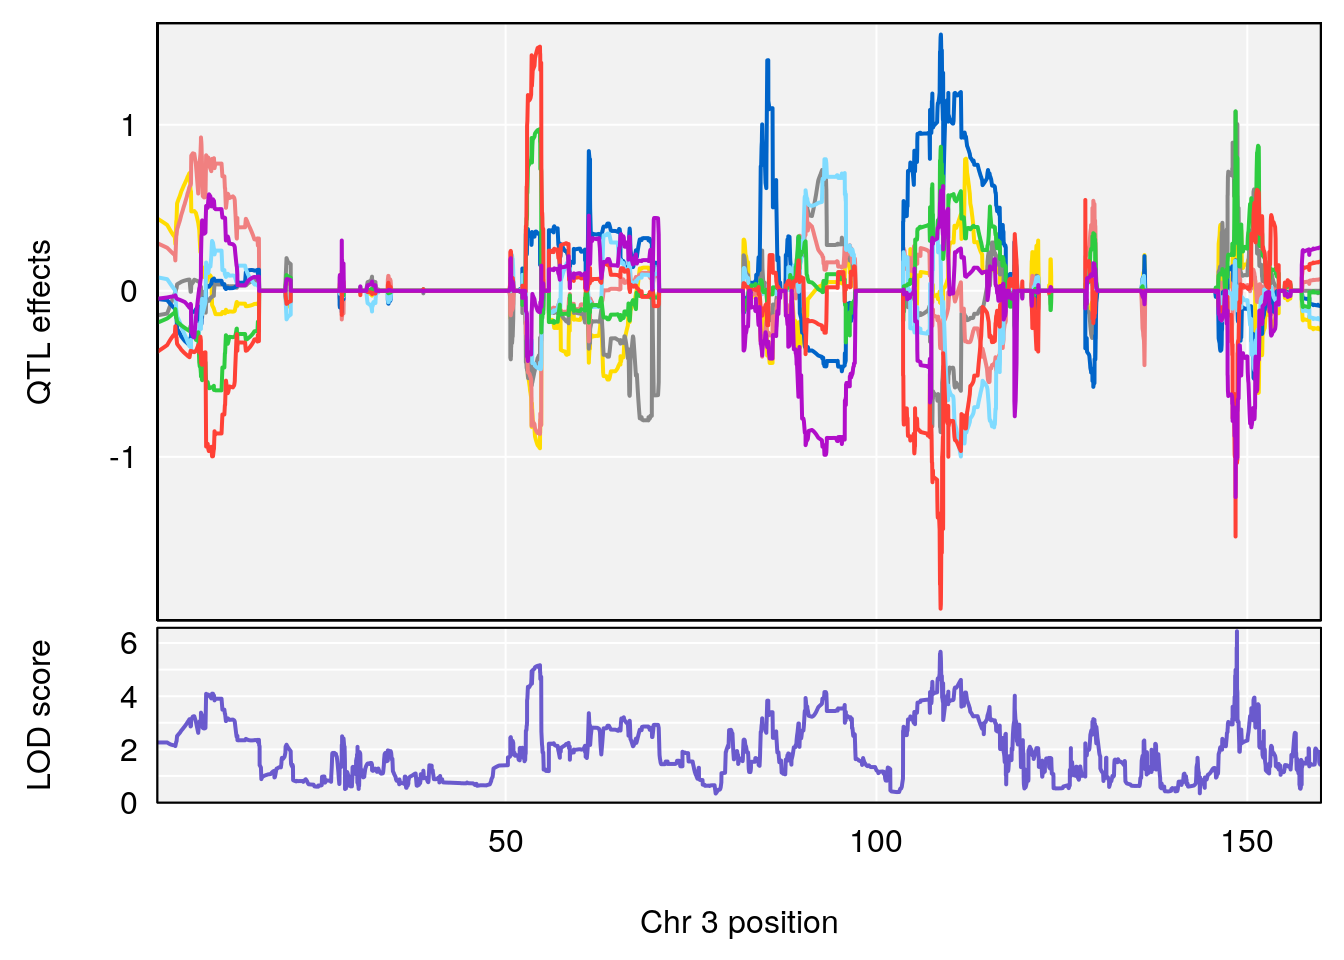
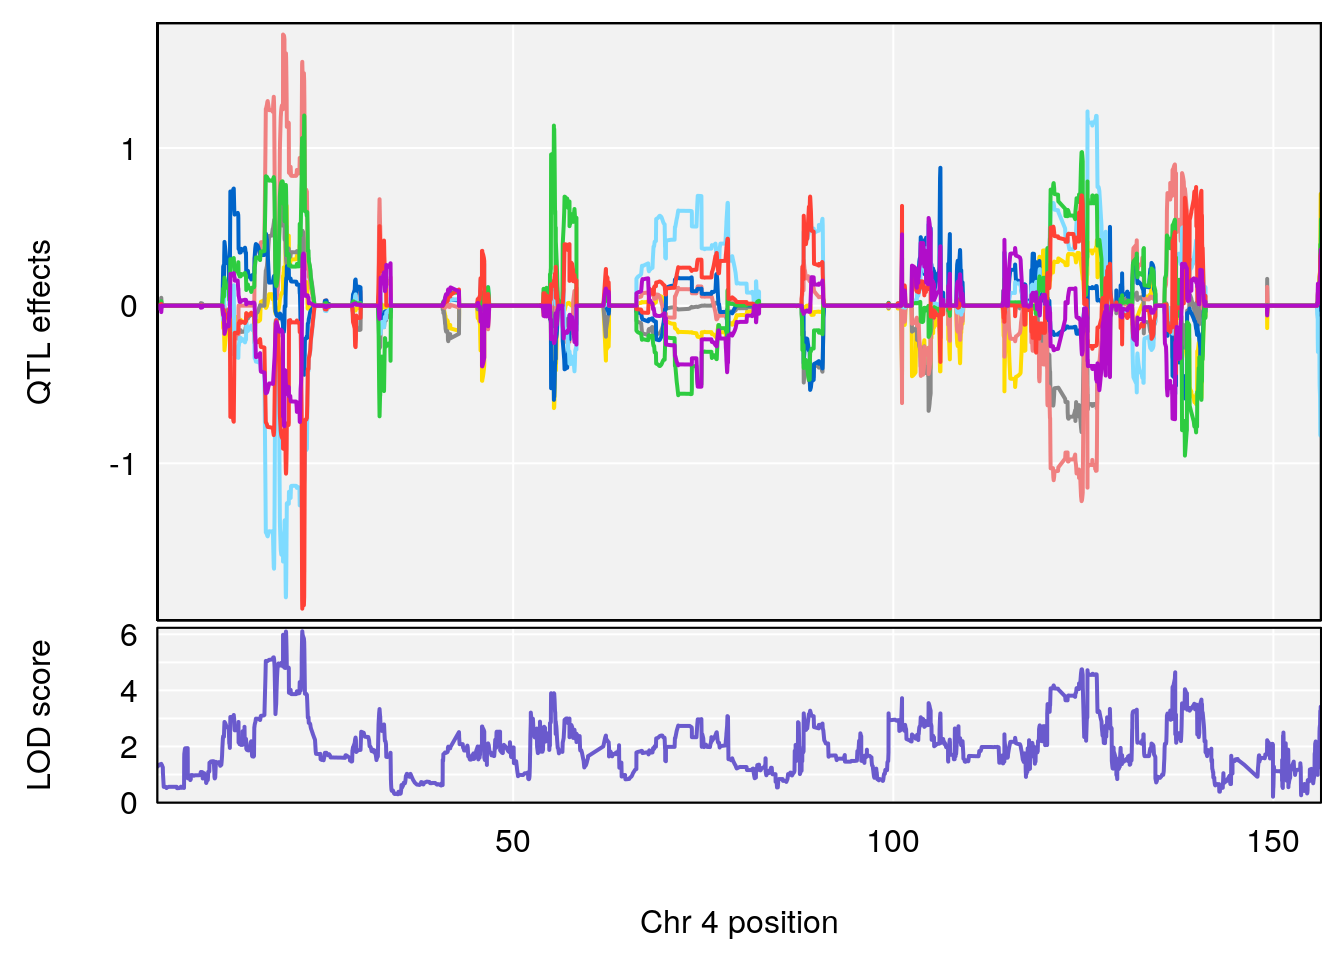
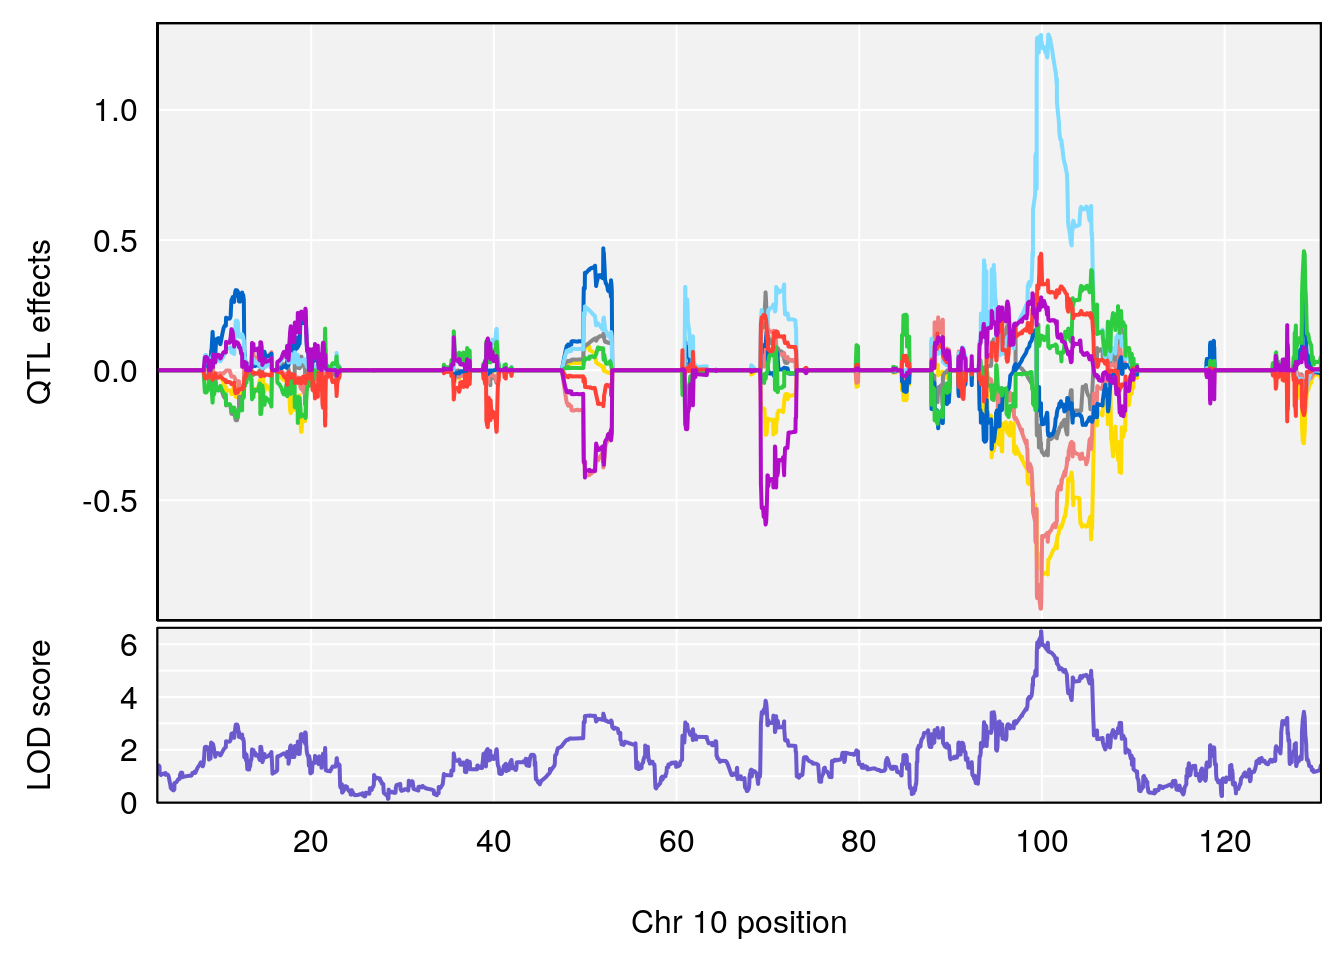
for(i in names(qtl.out)){
print(i)
peaks <- find_peaks(qtl.out[[i]], map=pmap, threshold=6, drop=1.5)
if(nrow(peaks) > 0) {
print(peaks)
for(p in 1:dim(peaks)[1]) {
print(p)
chr <-peaks[p,3]
#coeff plot
par(mar=c(4.1, 4.1, 0.6, 0.6))
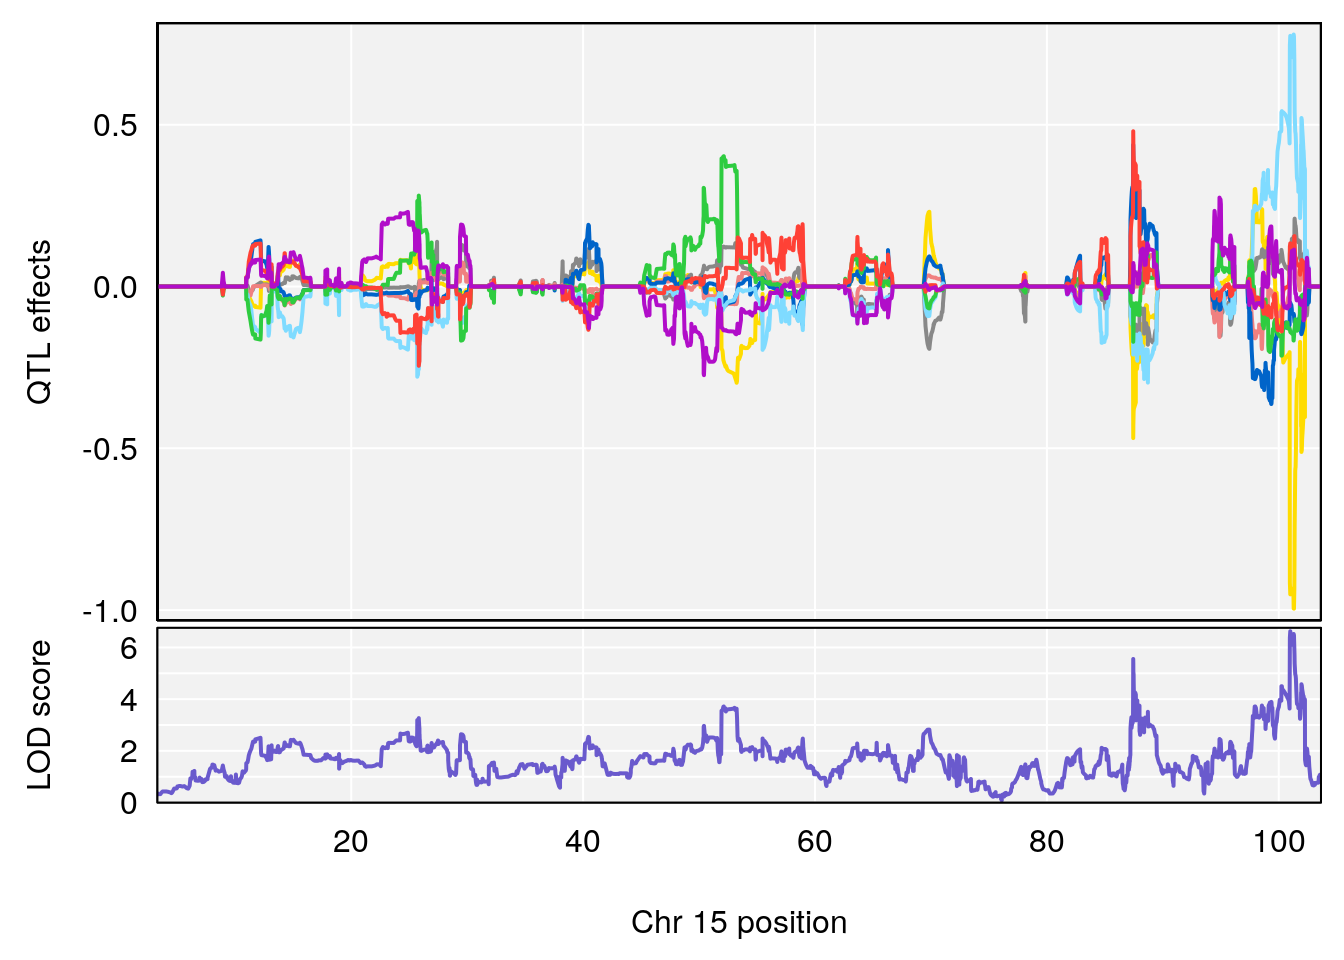
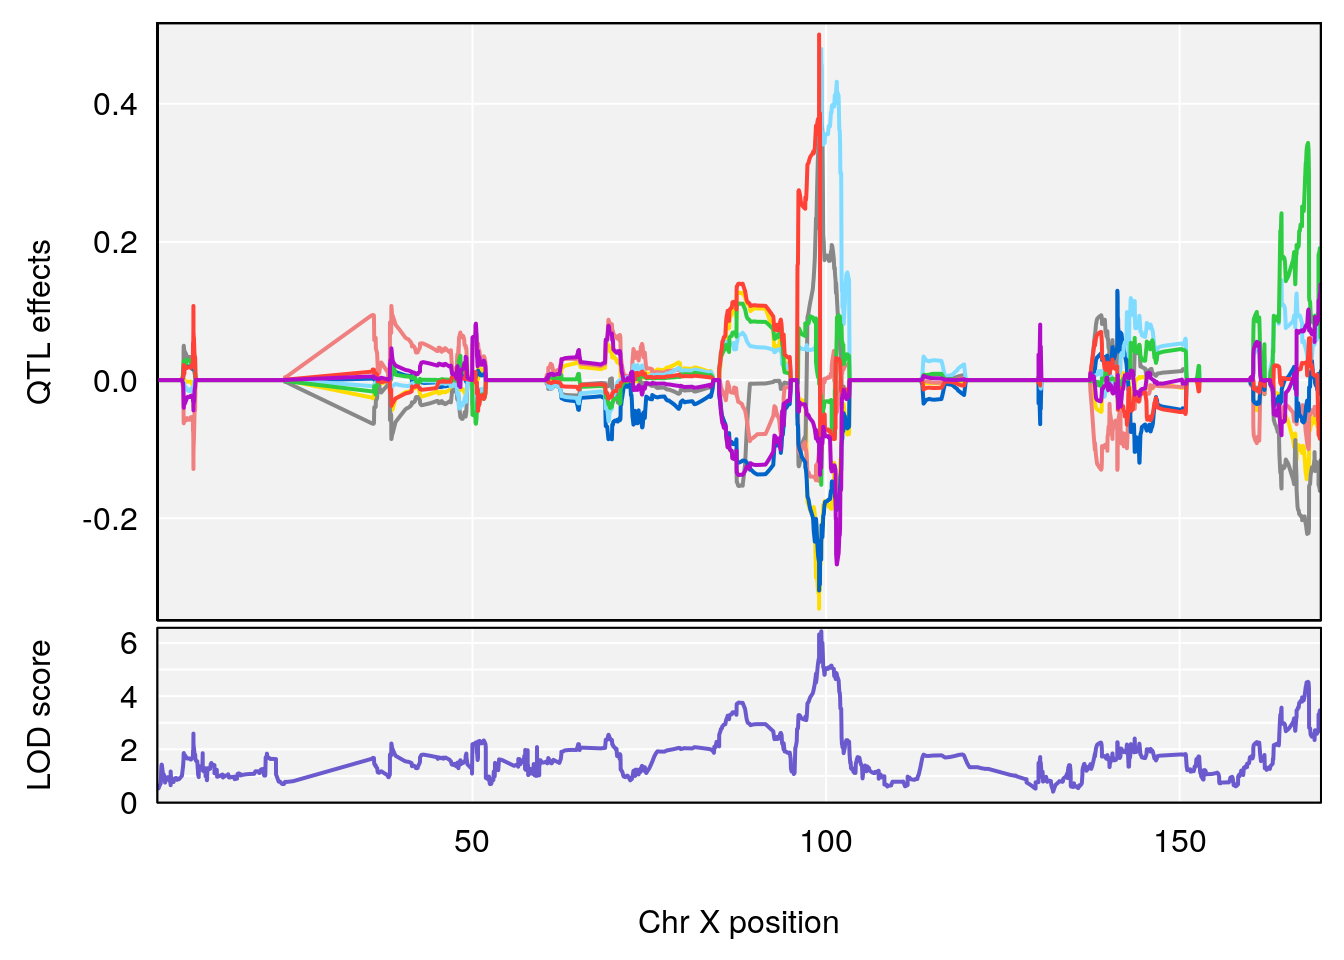
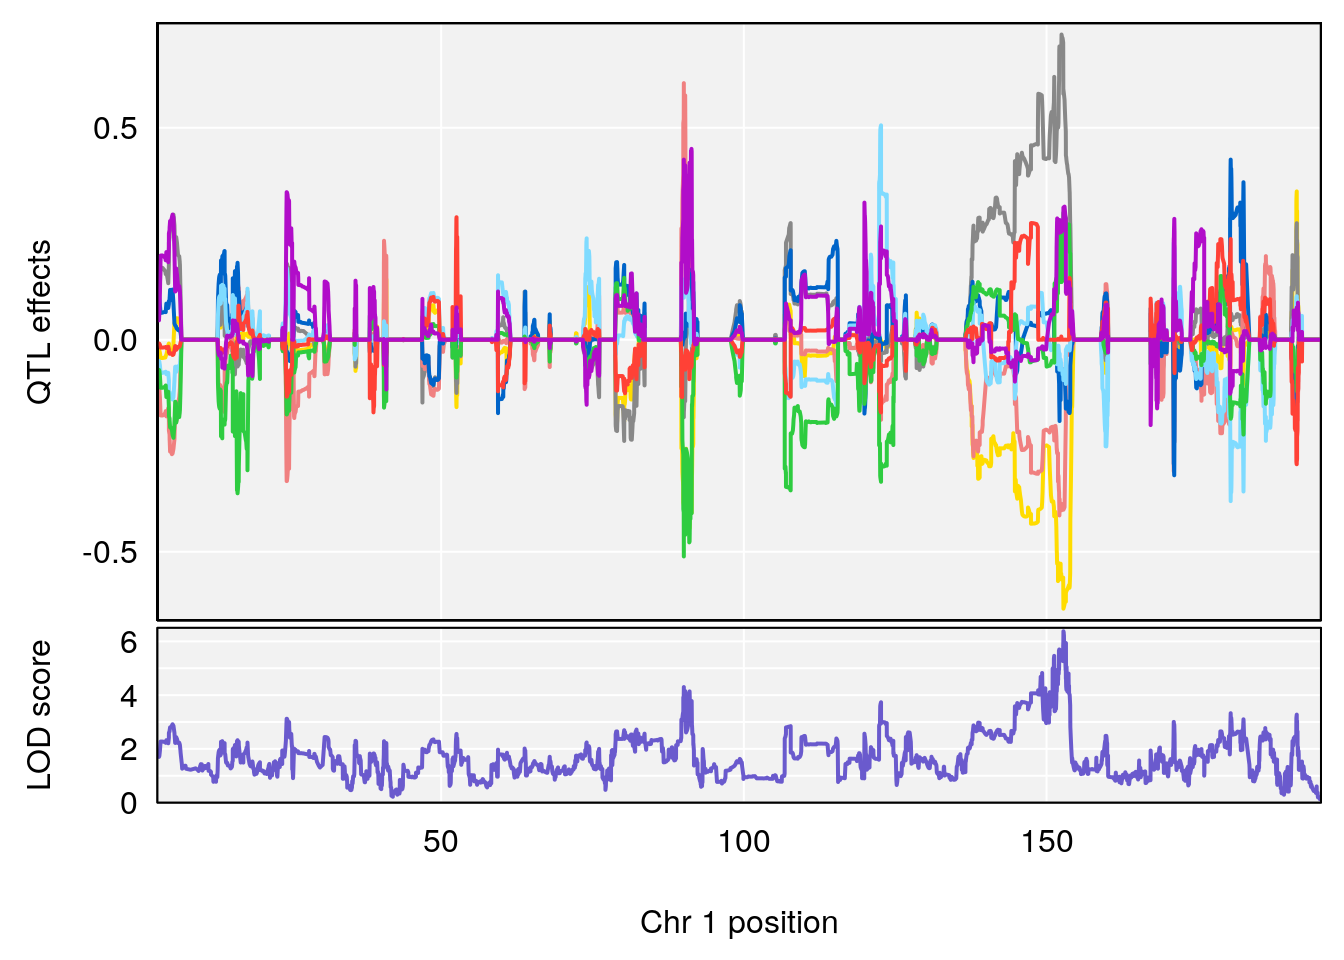
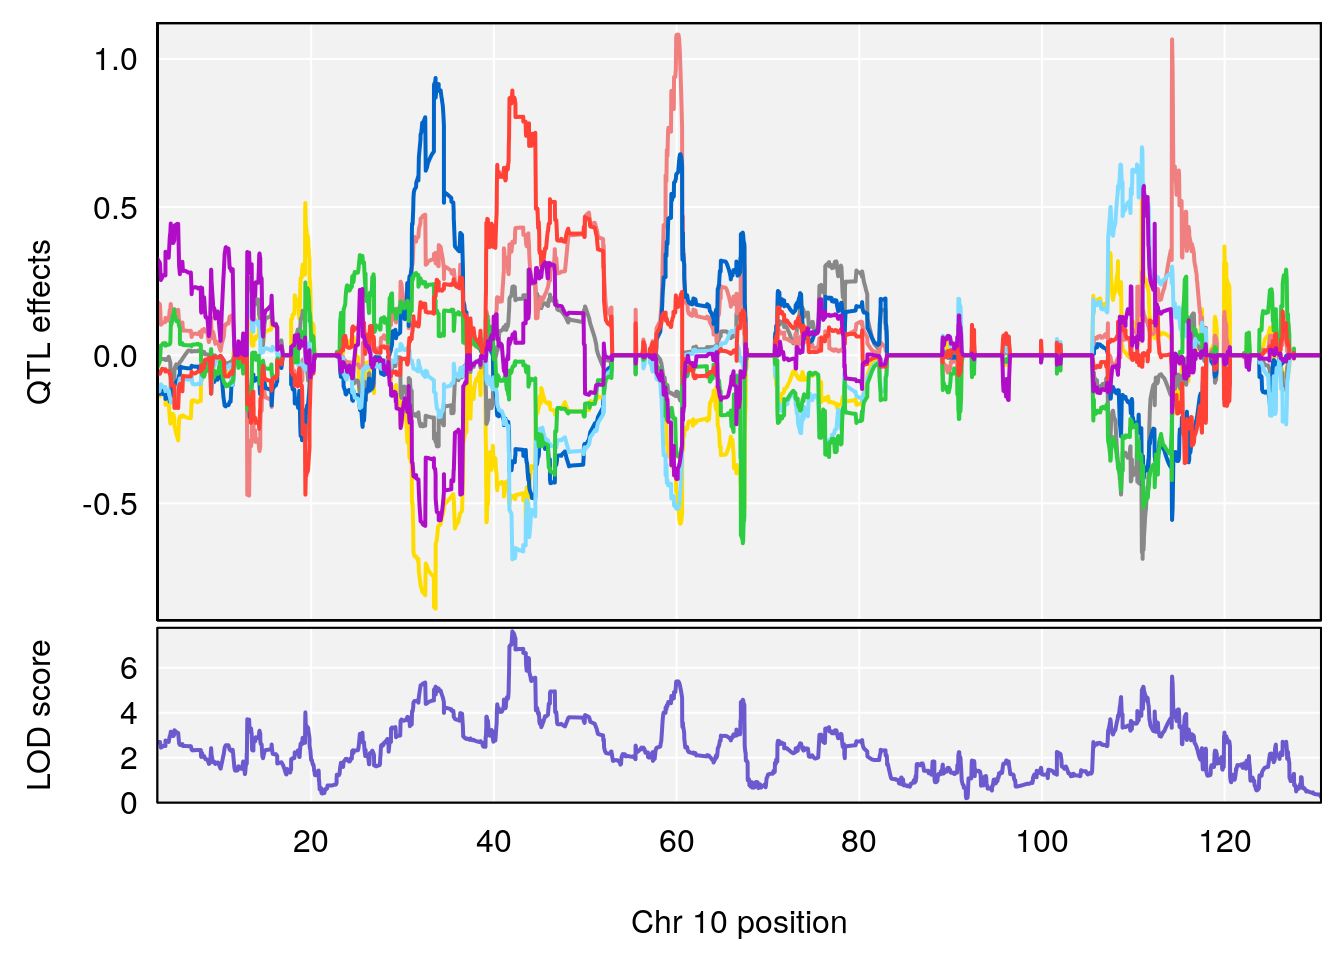
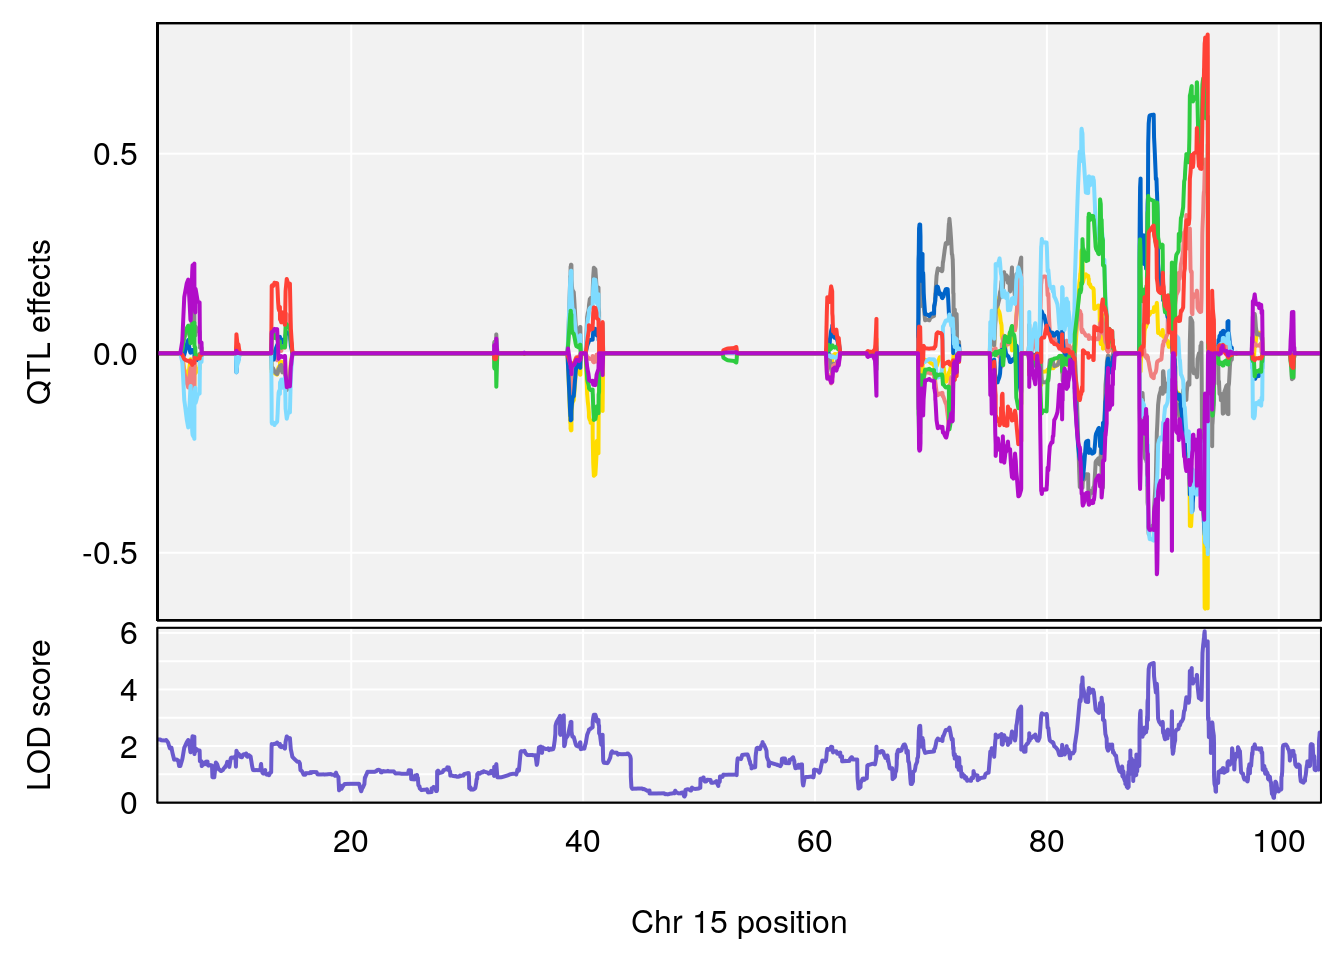
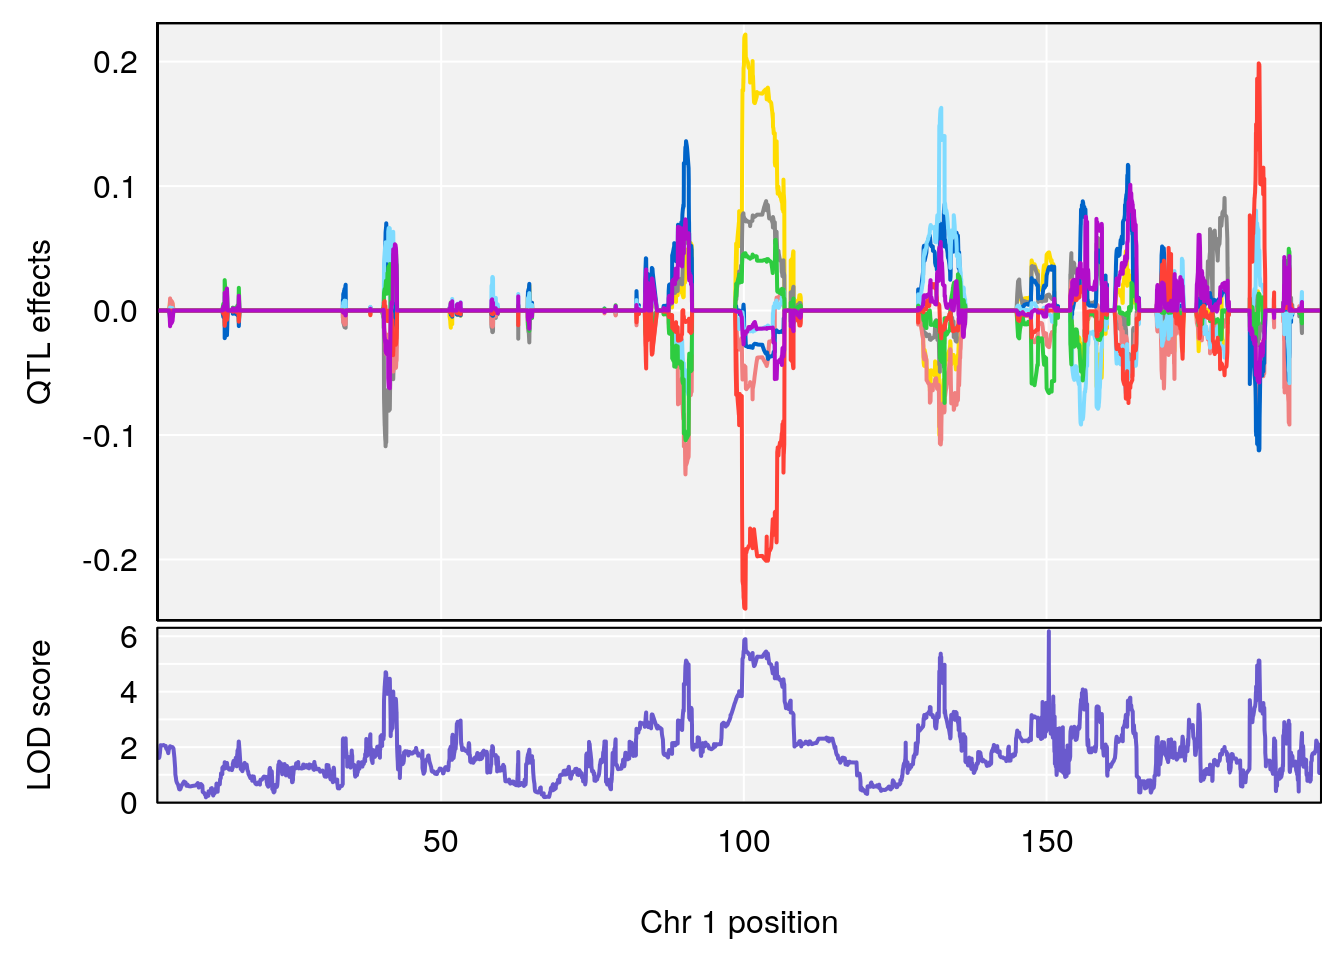
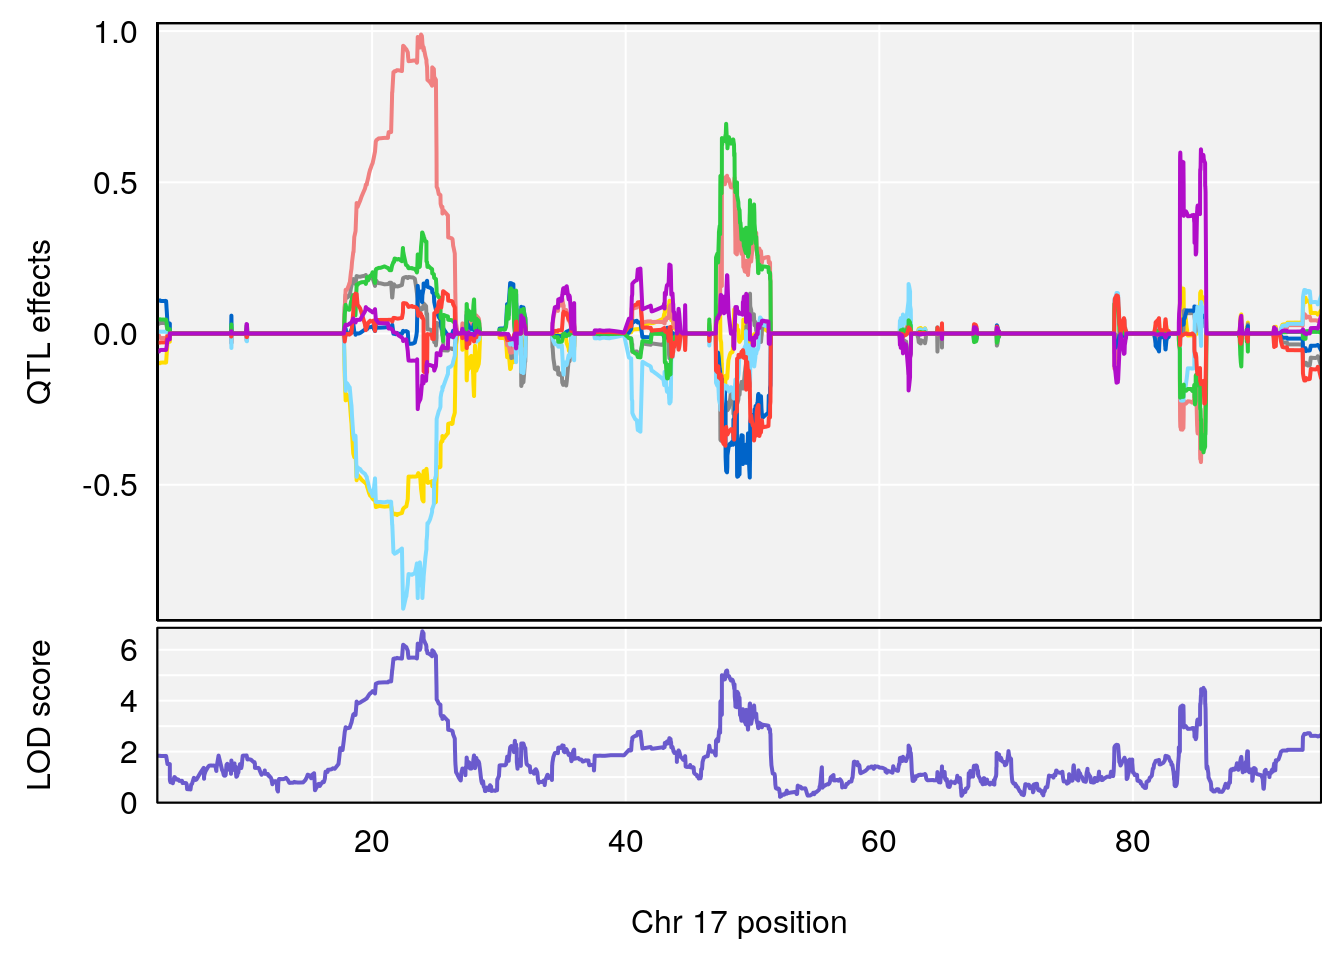
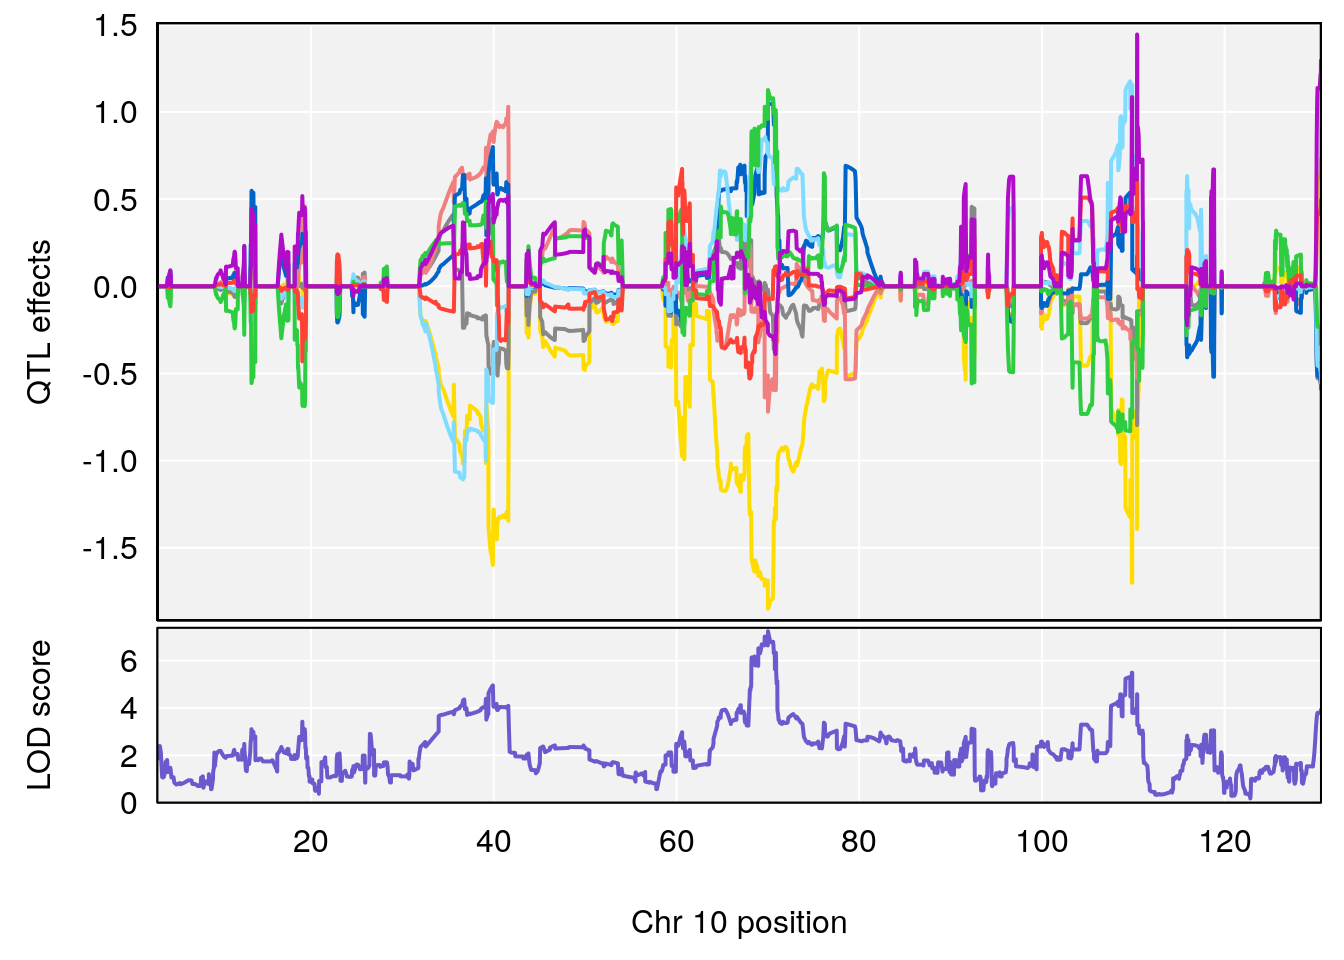
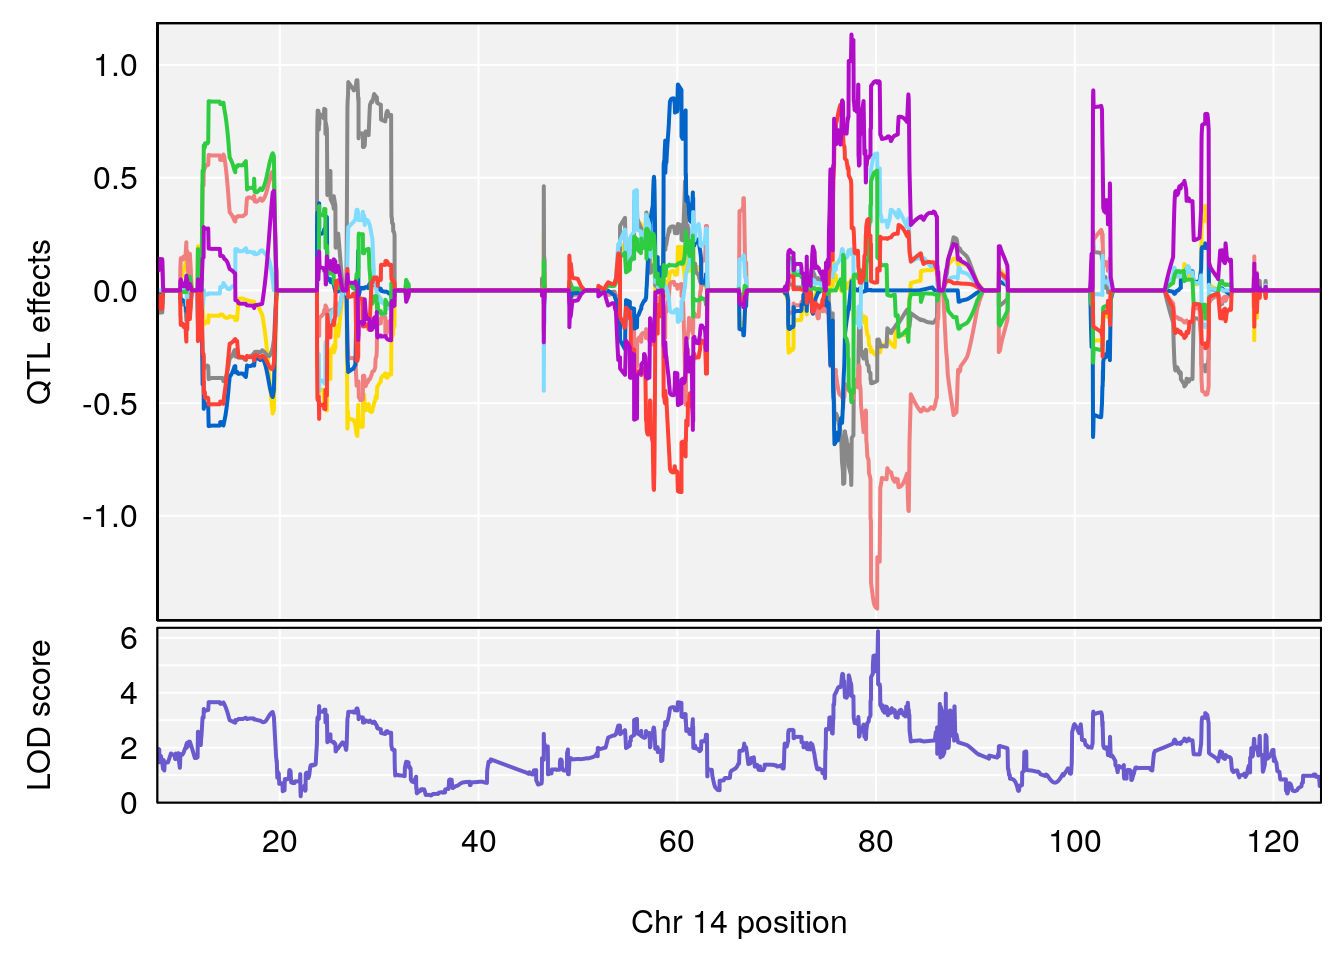
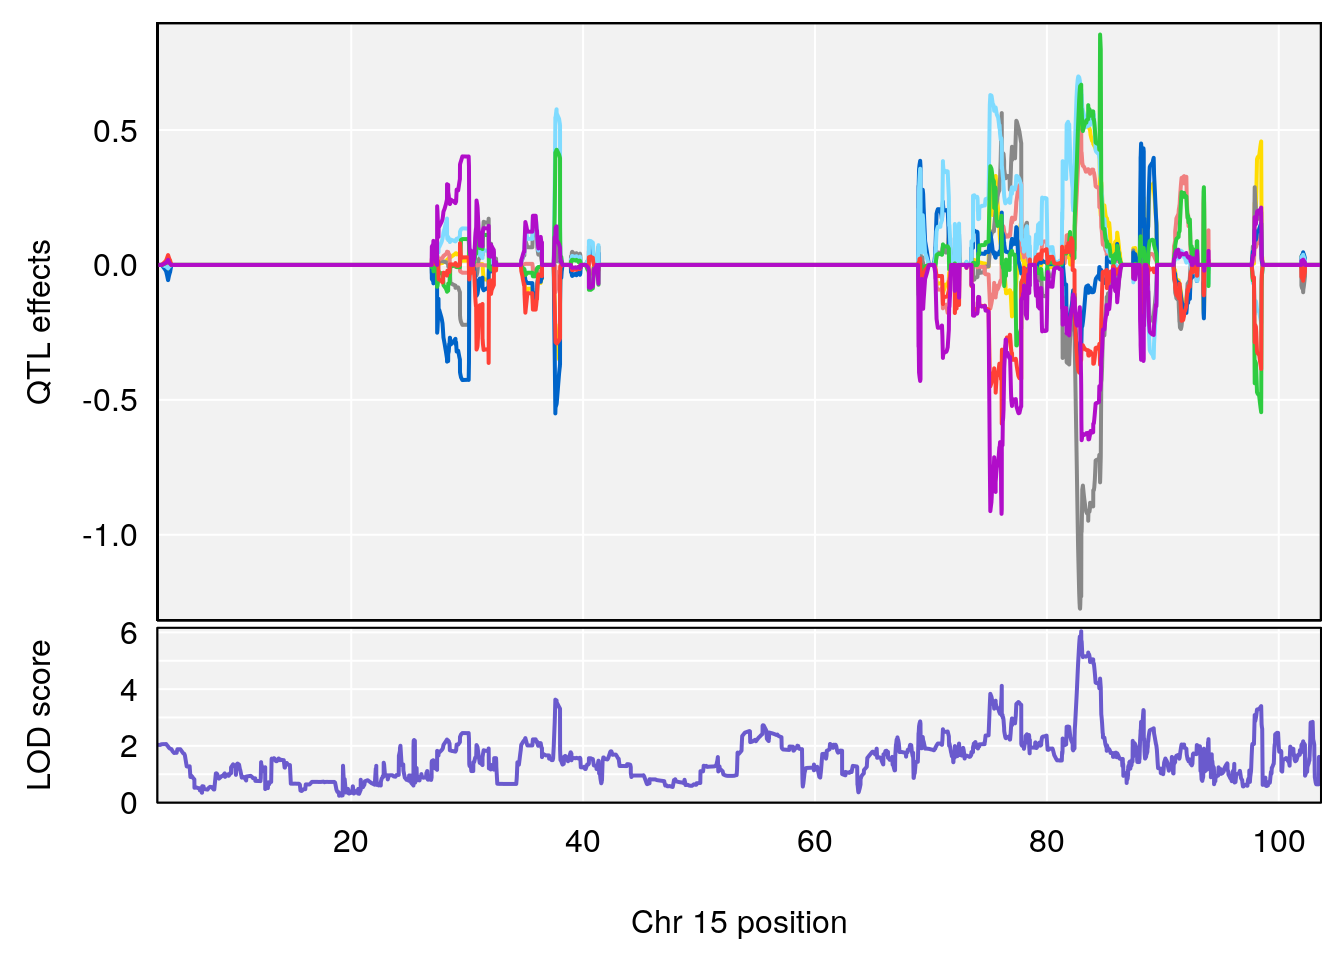
plot_coefCC(coef_c1[[i]][[p]], pmap[chr], scan1_output=qtl.out[[i]], bgcolor="gray95", legend=NULL)
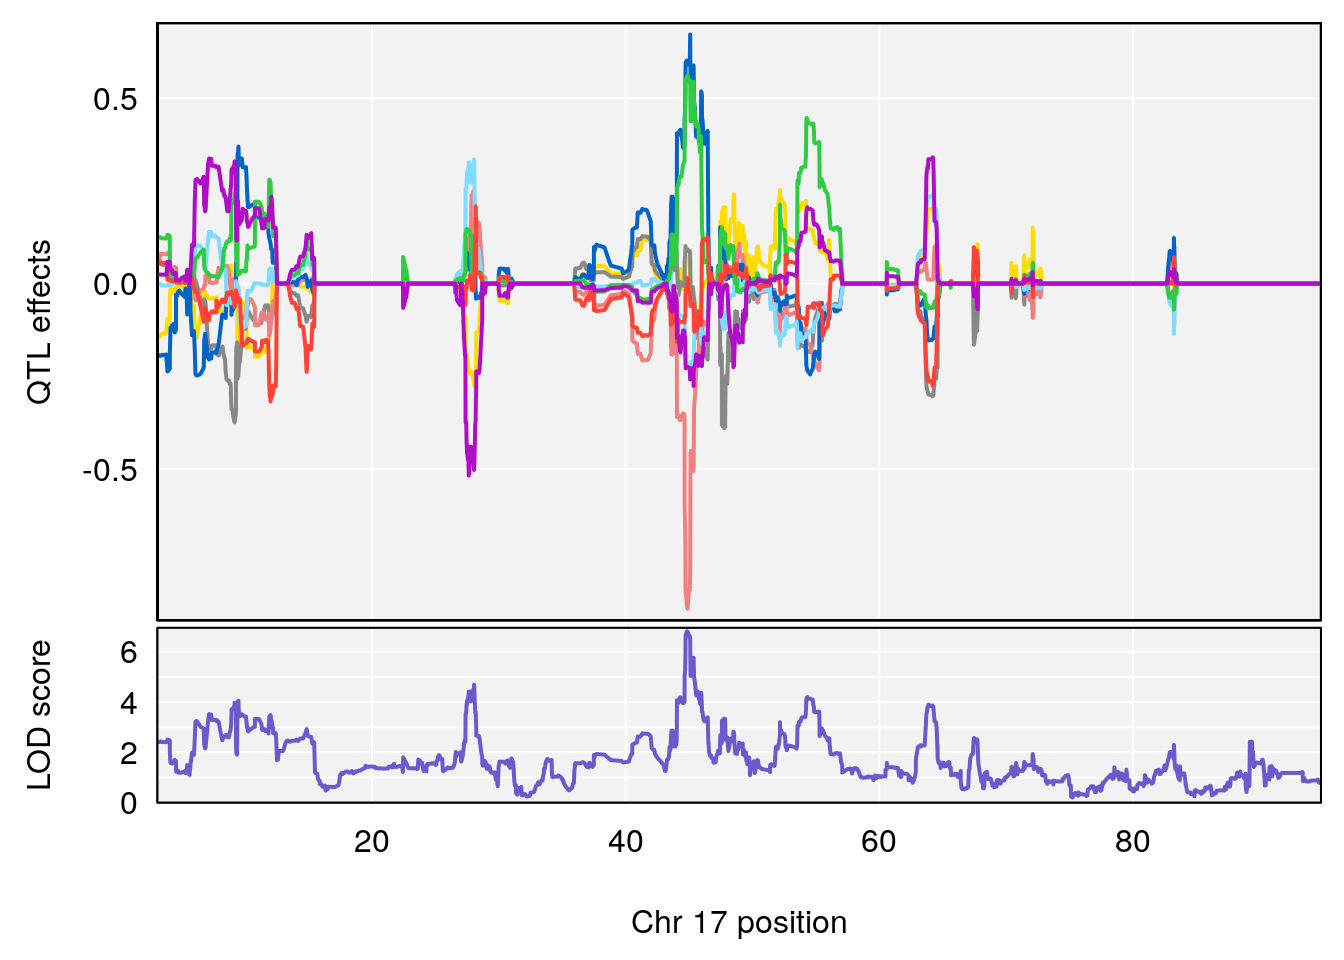
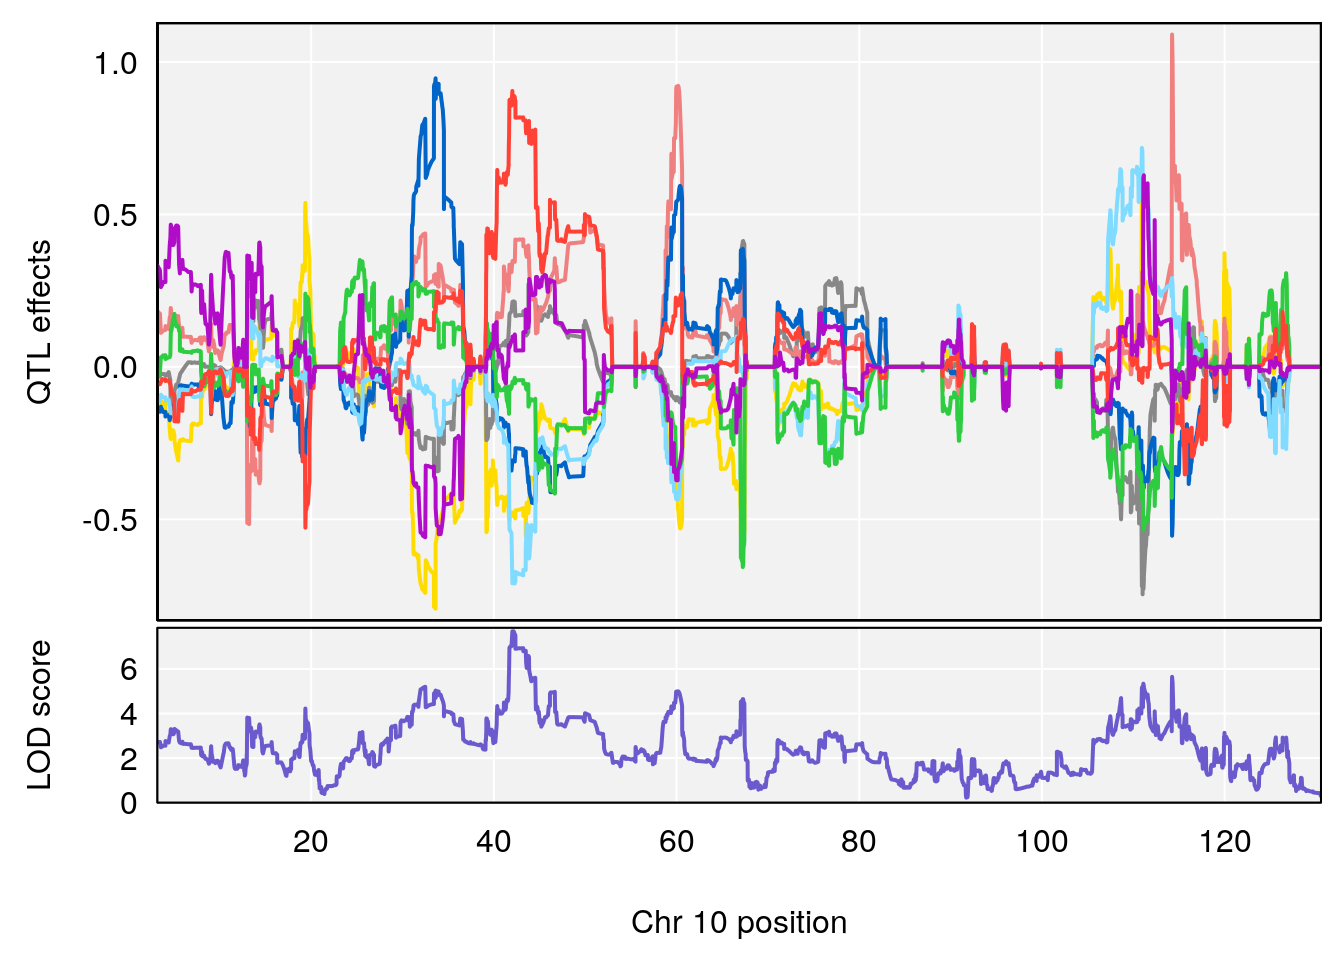
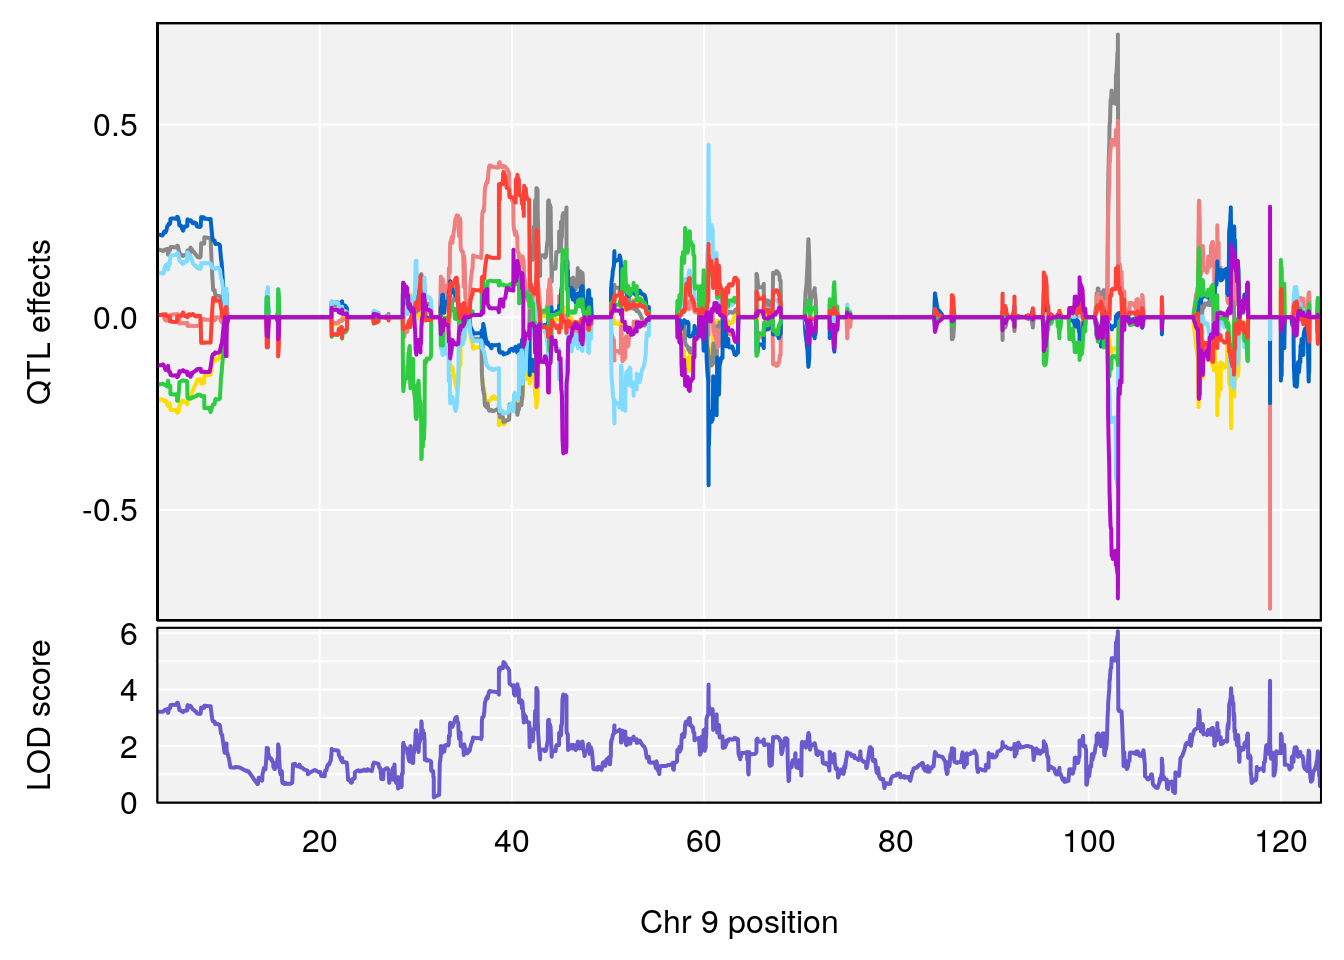
plot_coefCC(coef_c2[[i]][[p]], pmap[chr], scan1_output=qtl.out[[i]], bgcolor="gray95", legend=NULL)
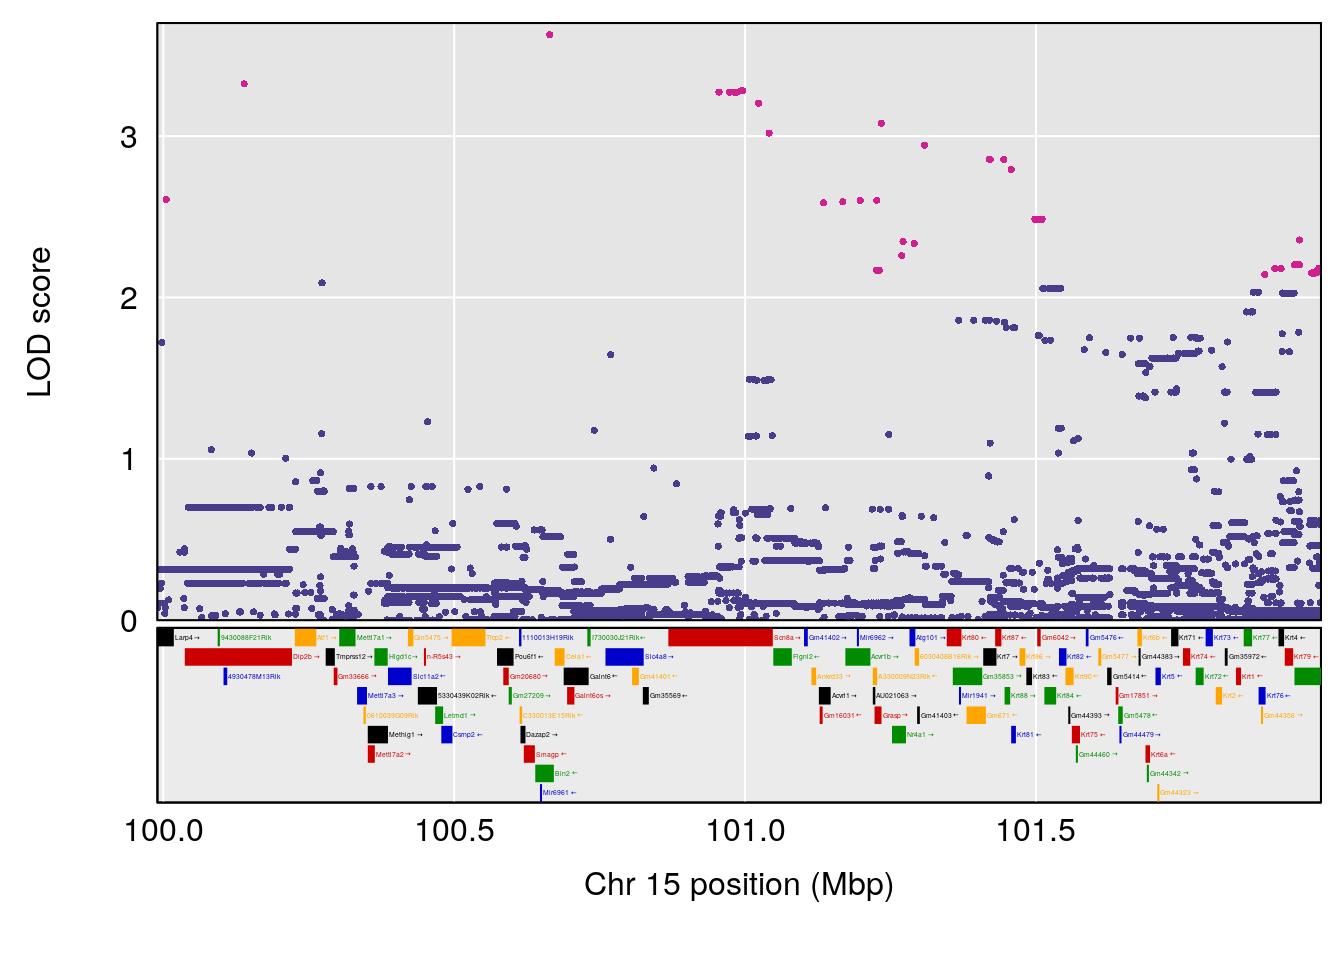
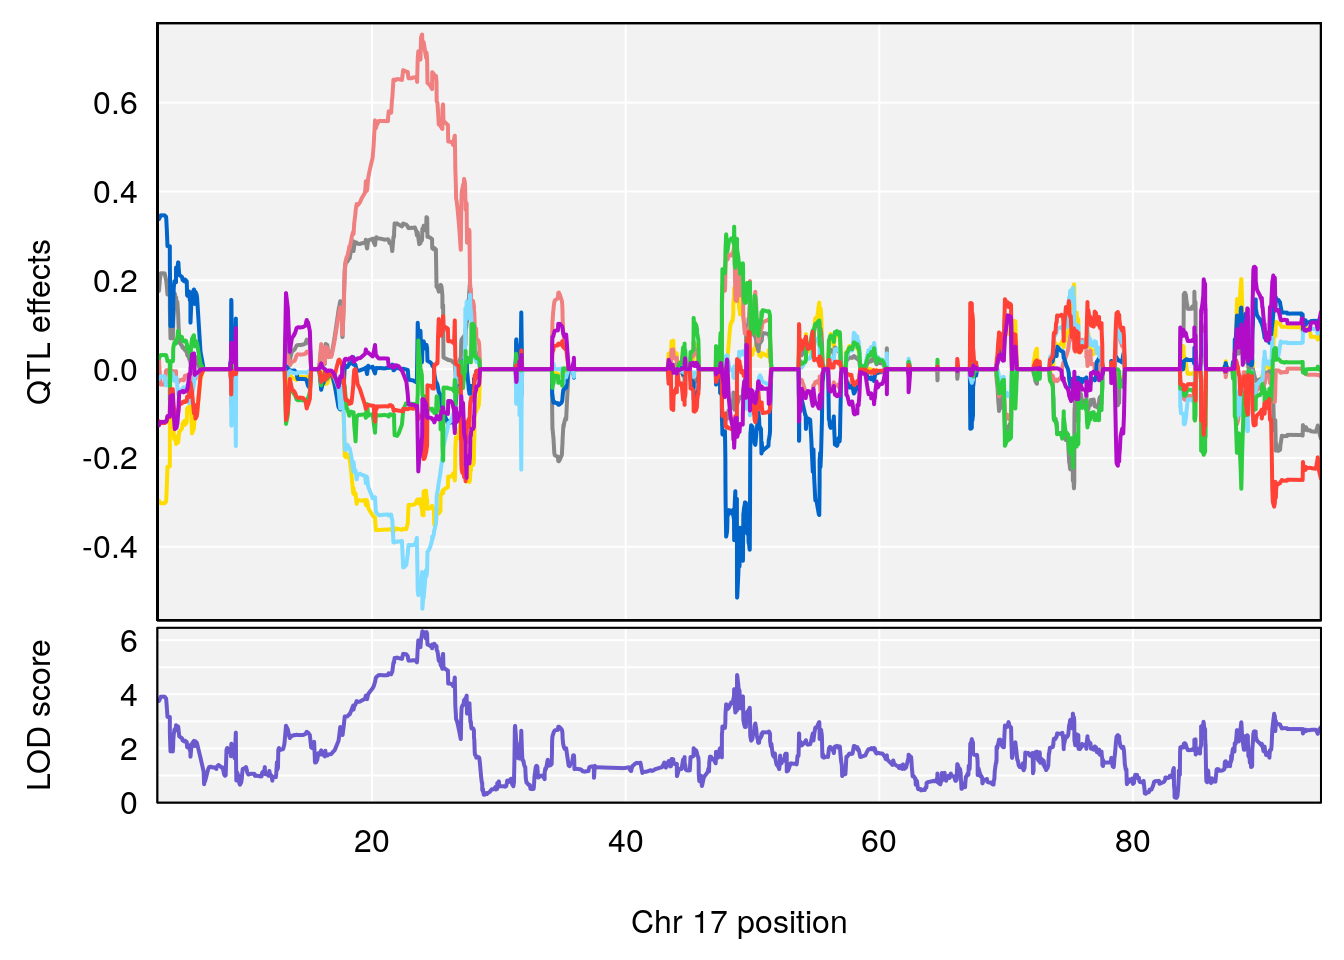
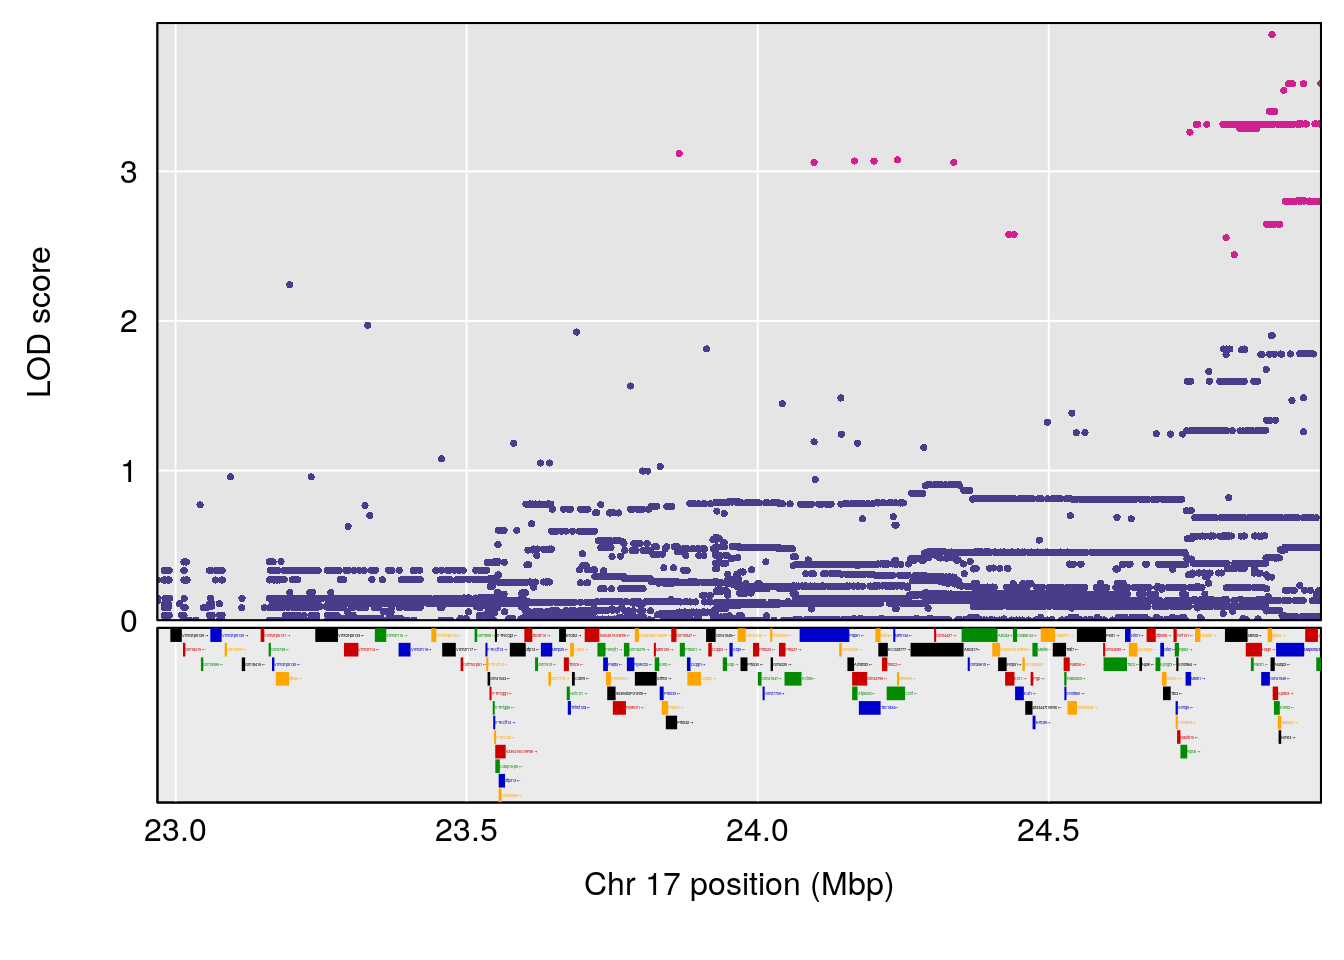
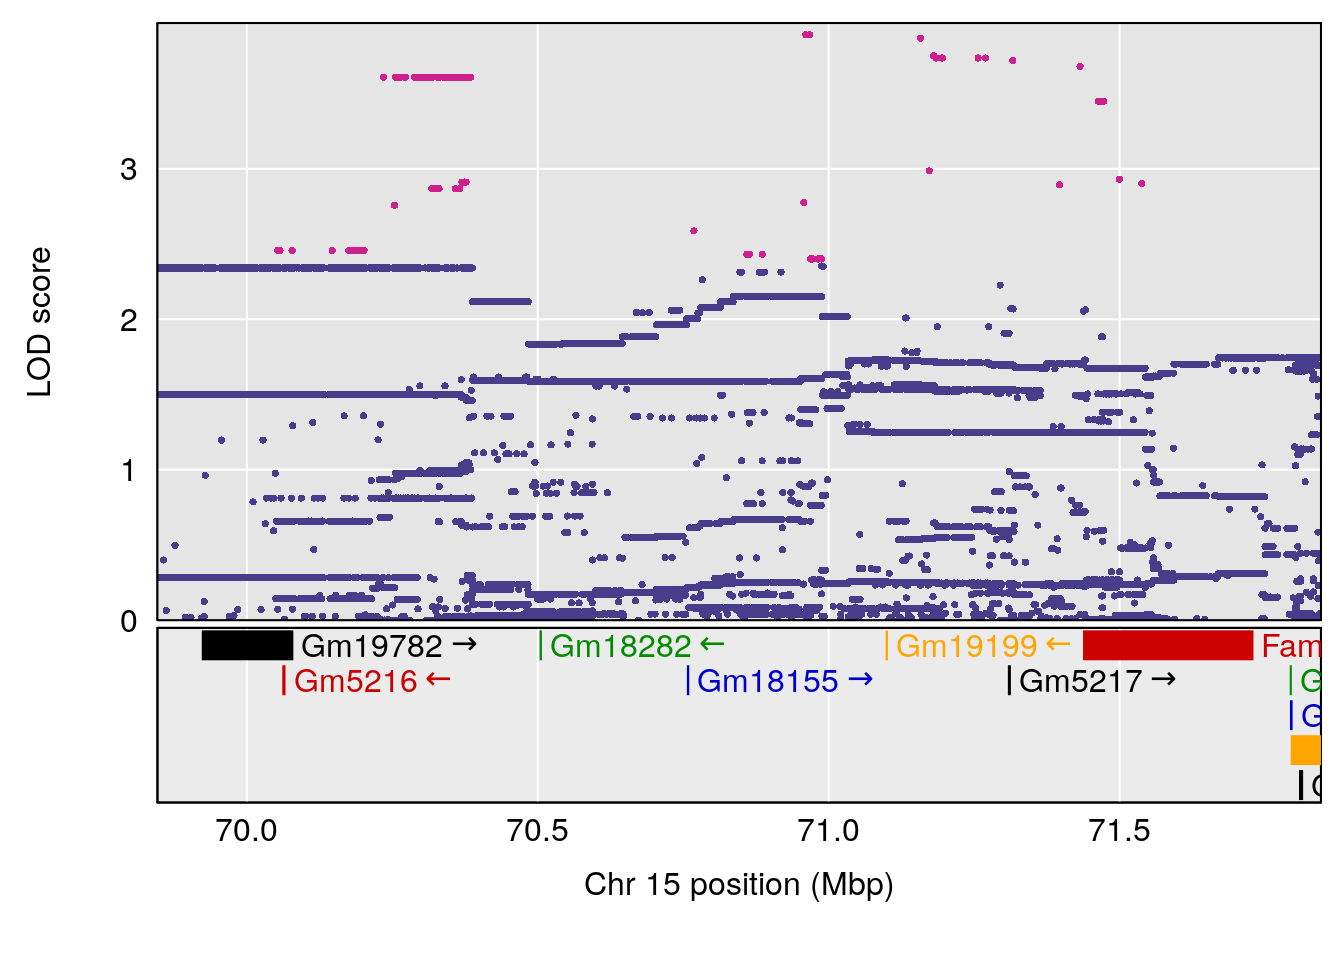
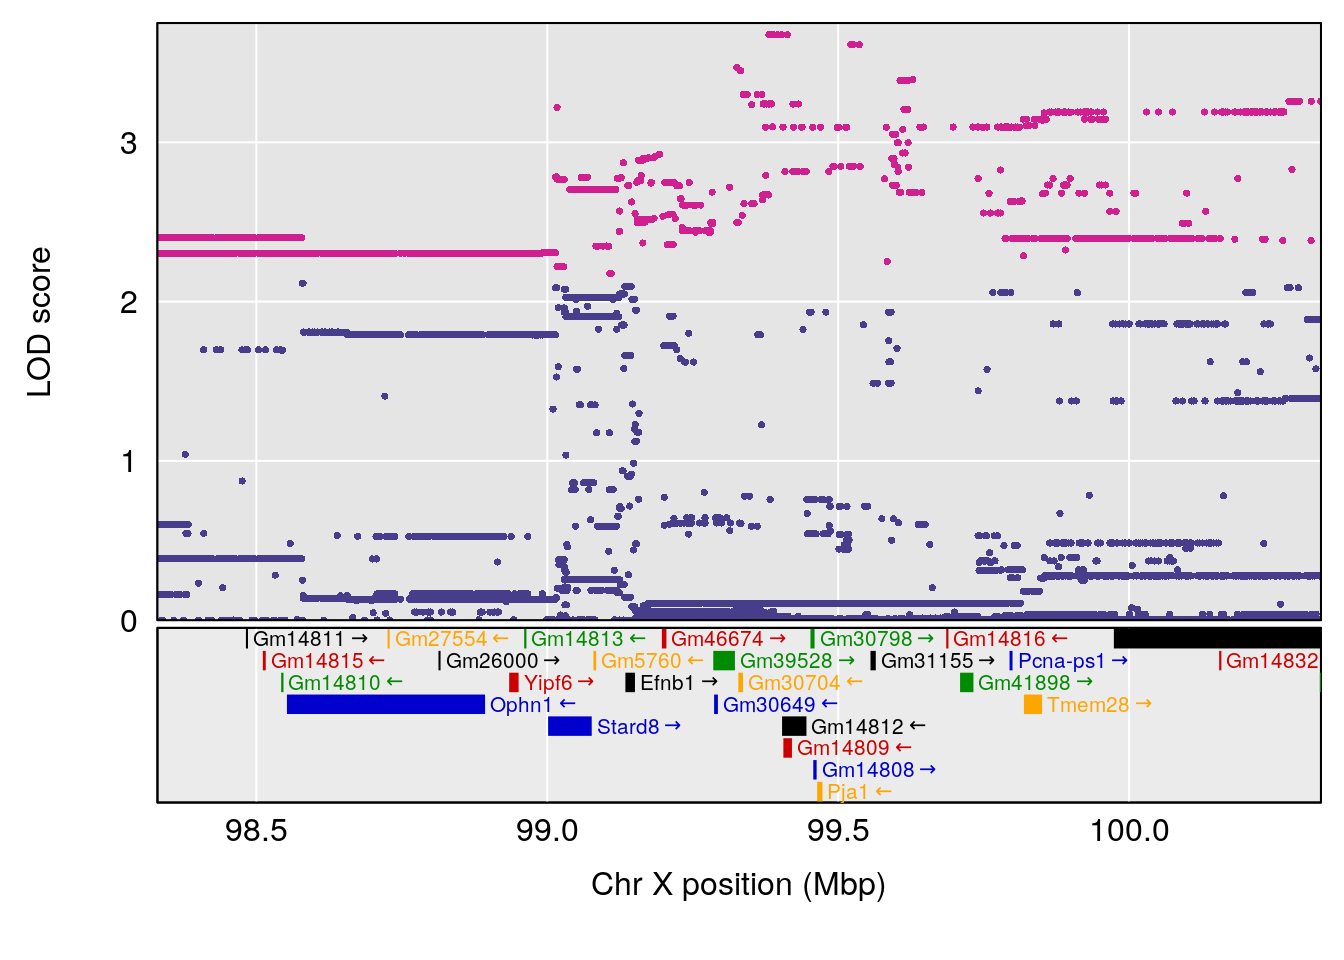
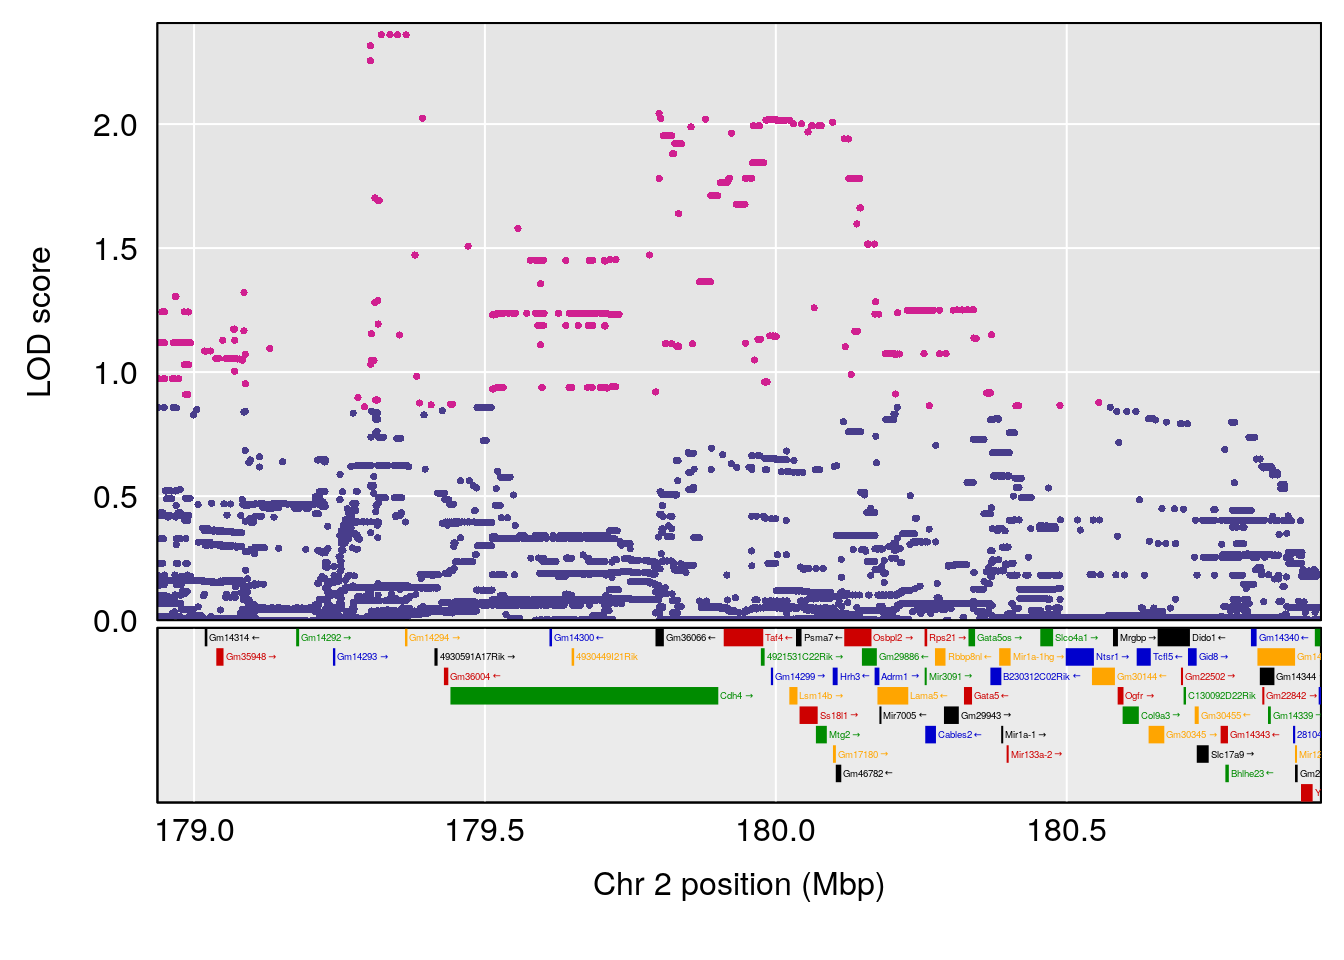
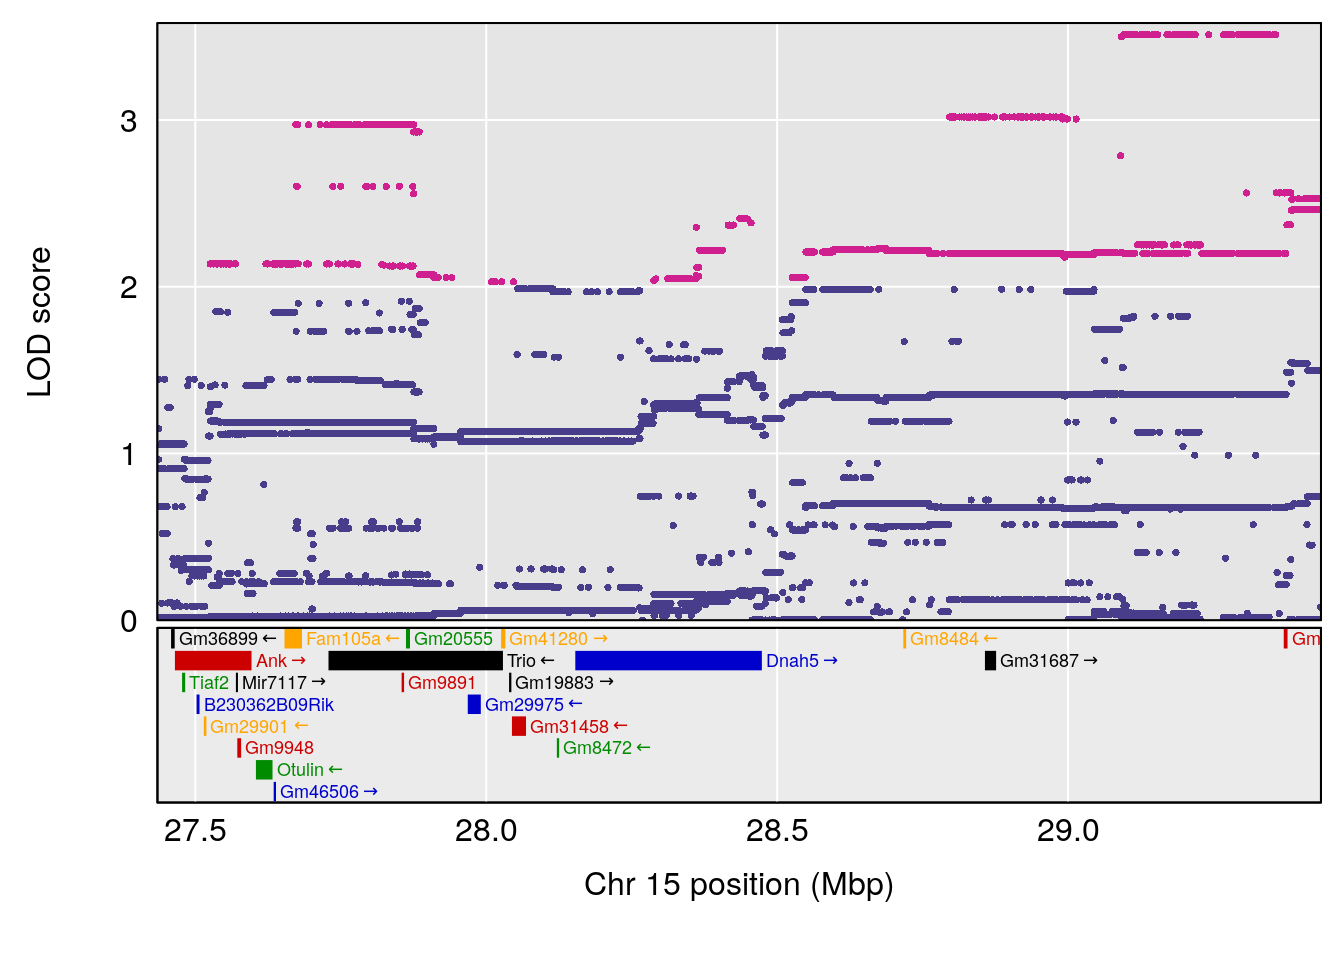
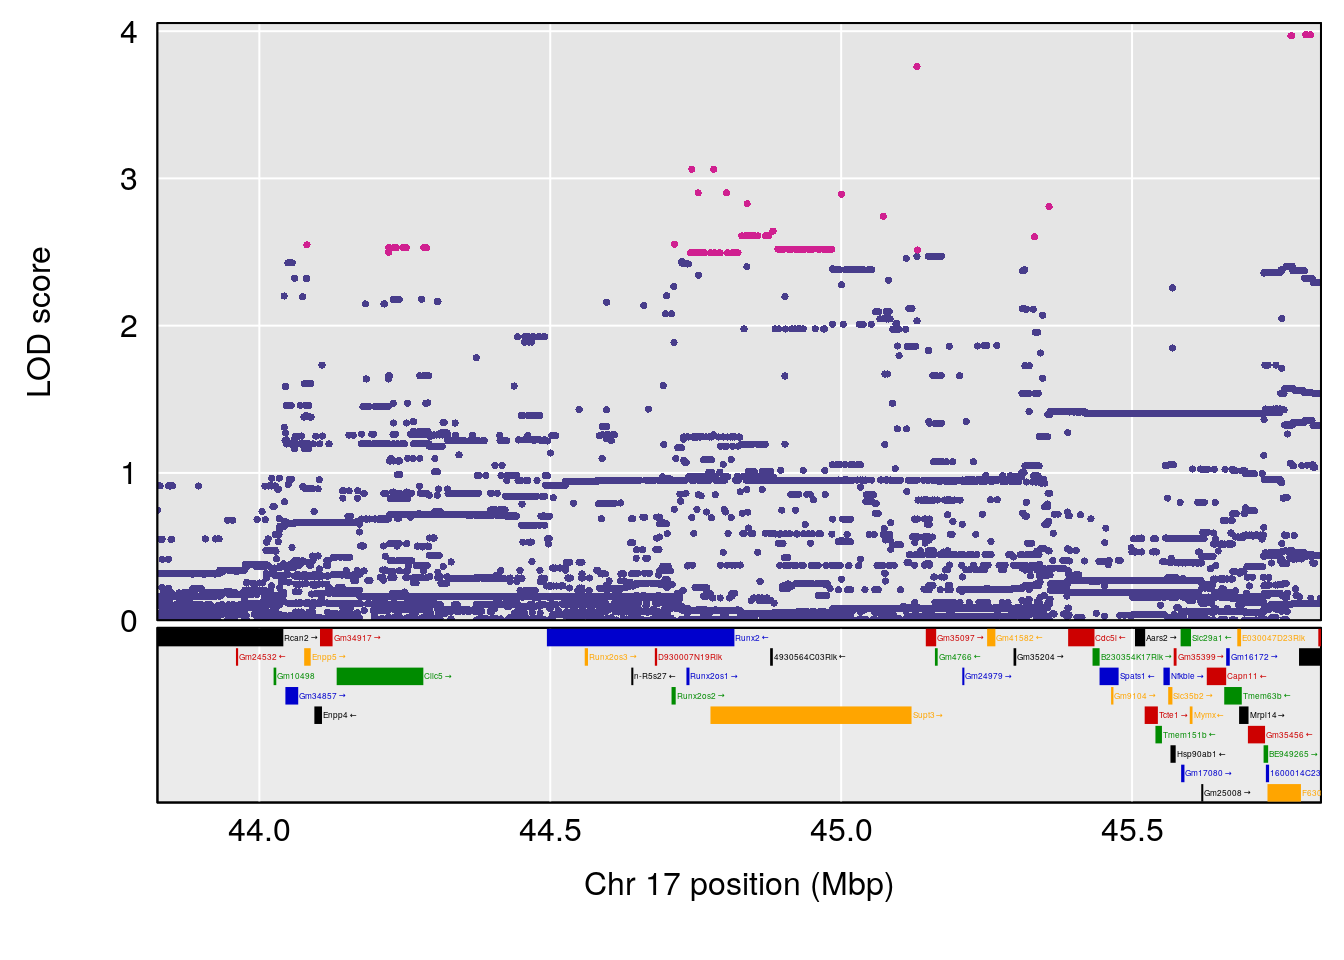
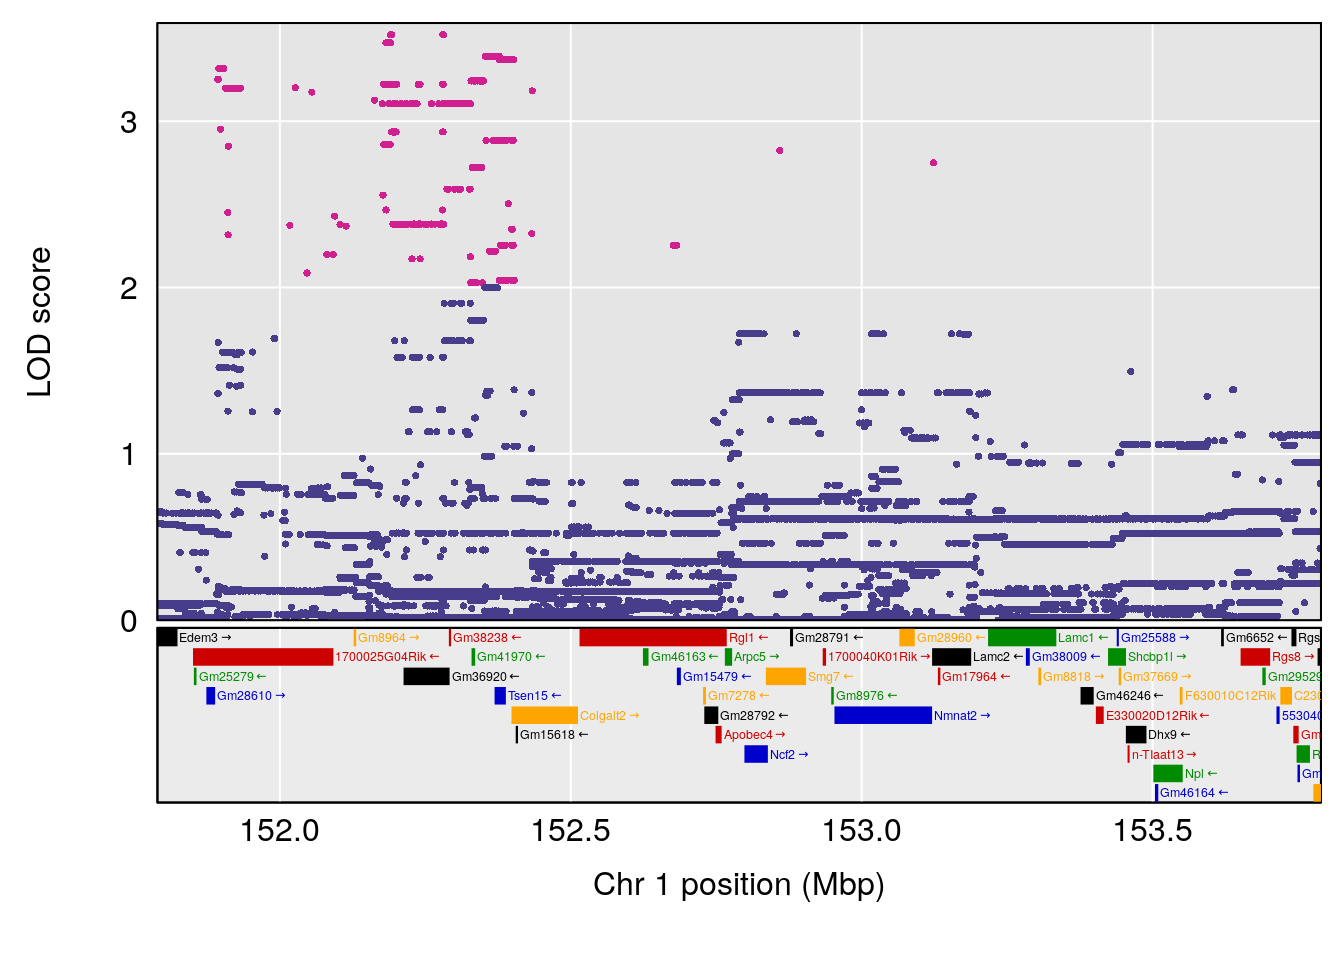
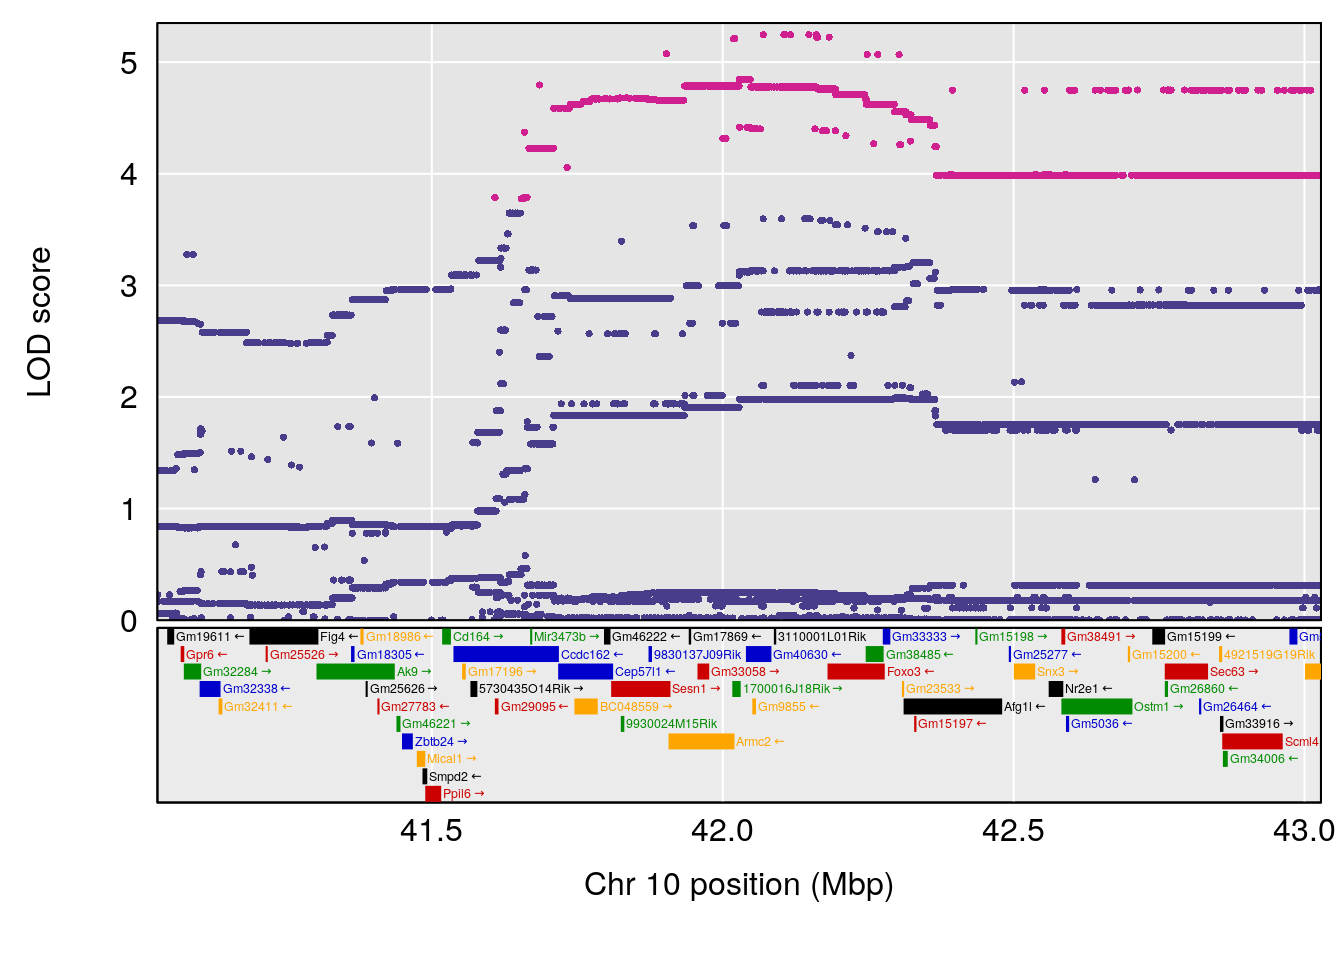
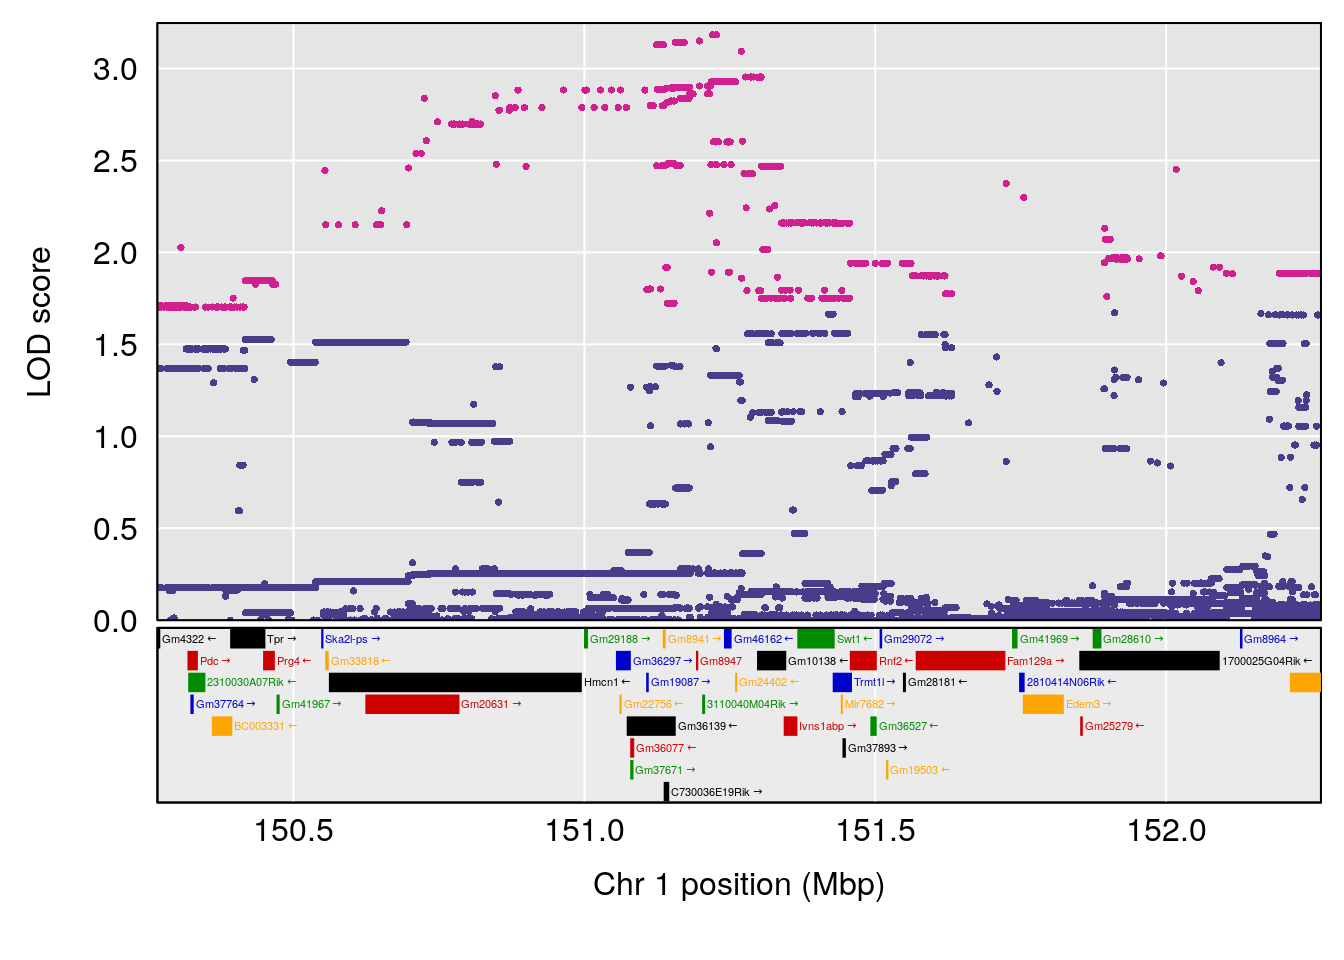
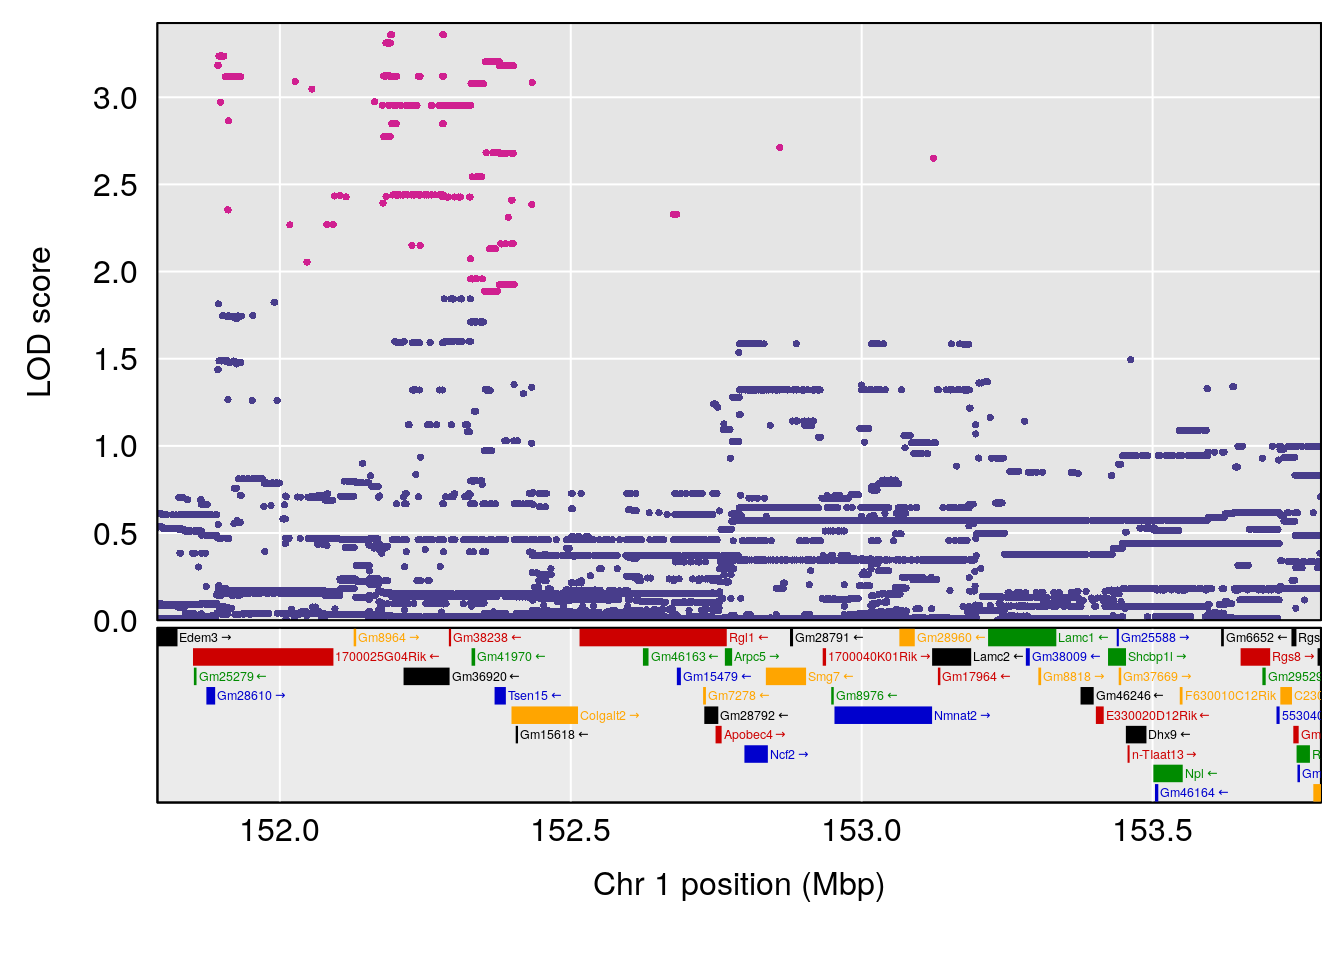
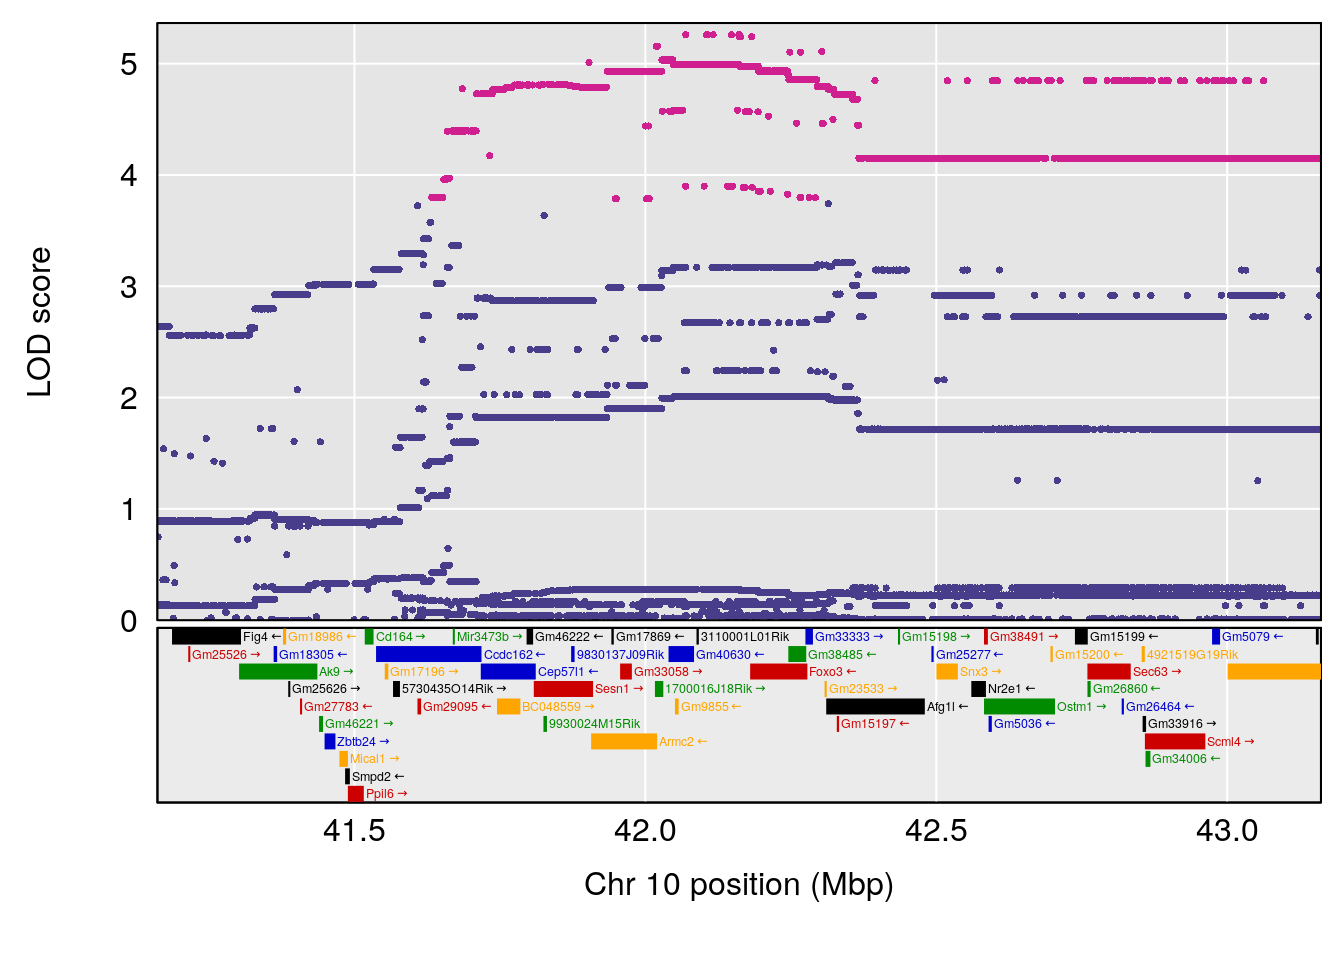
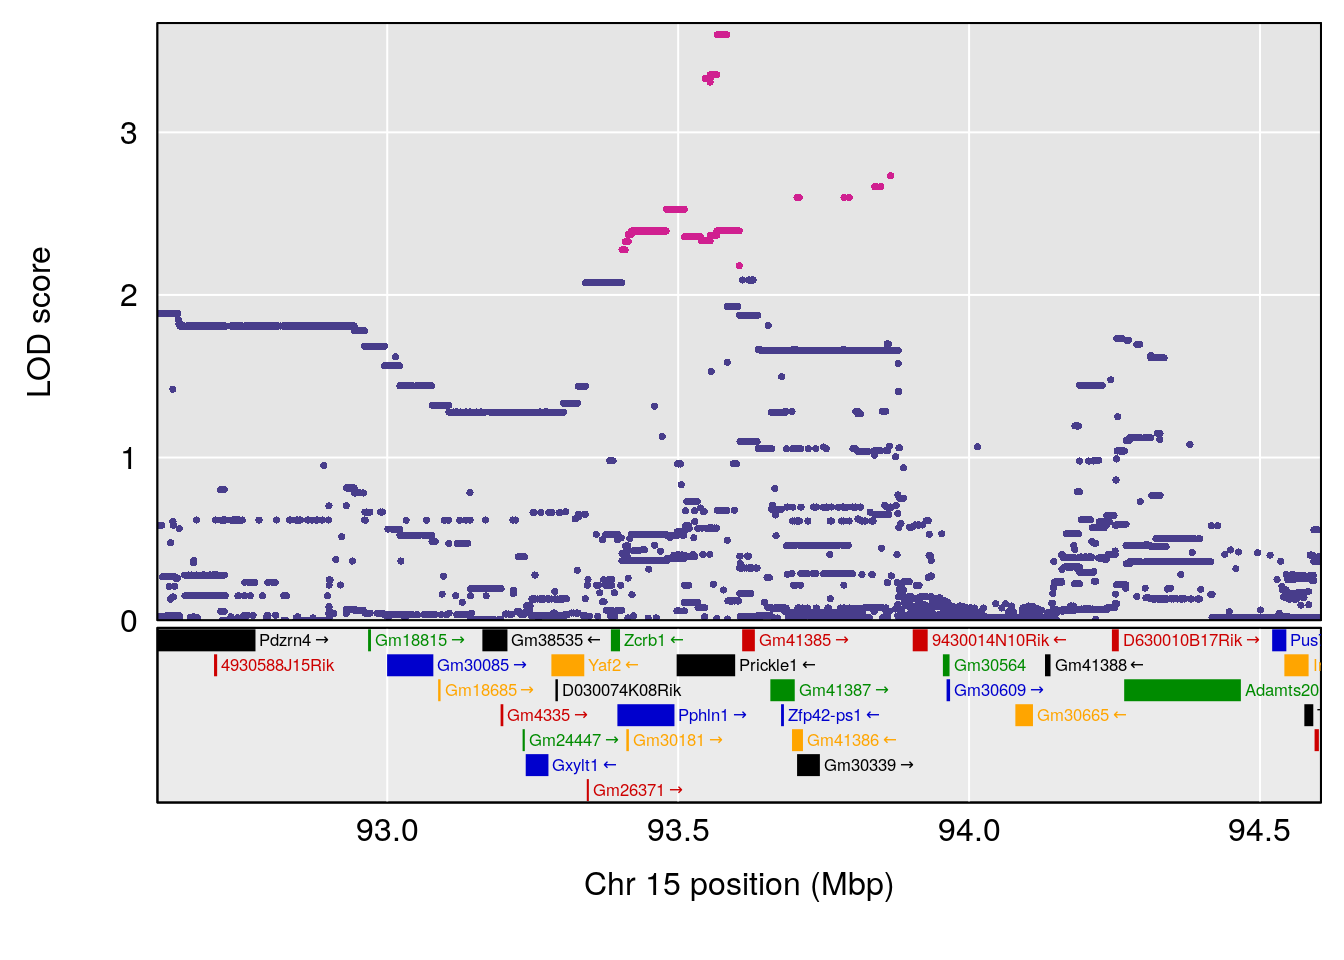
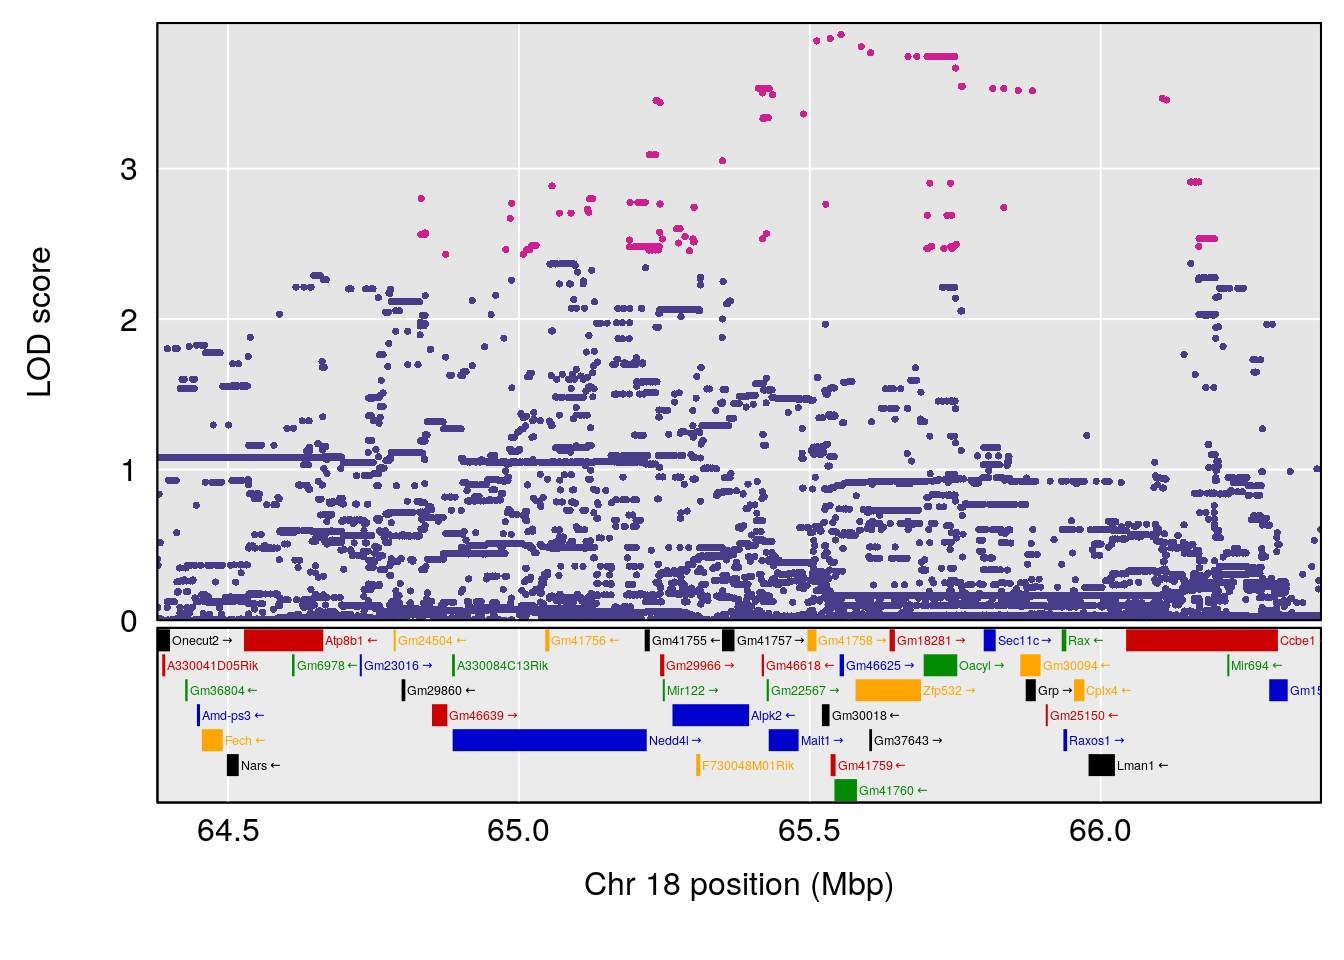
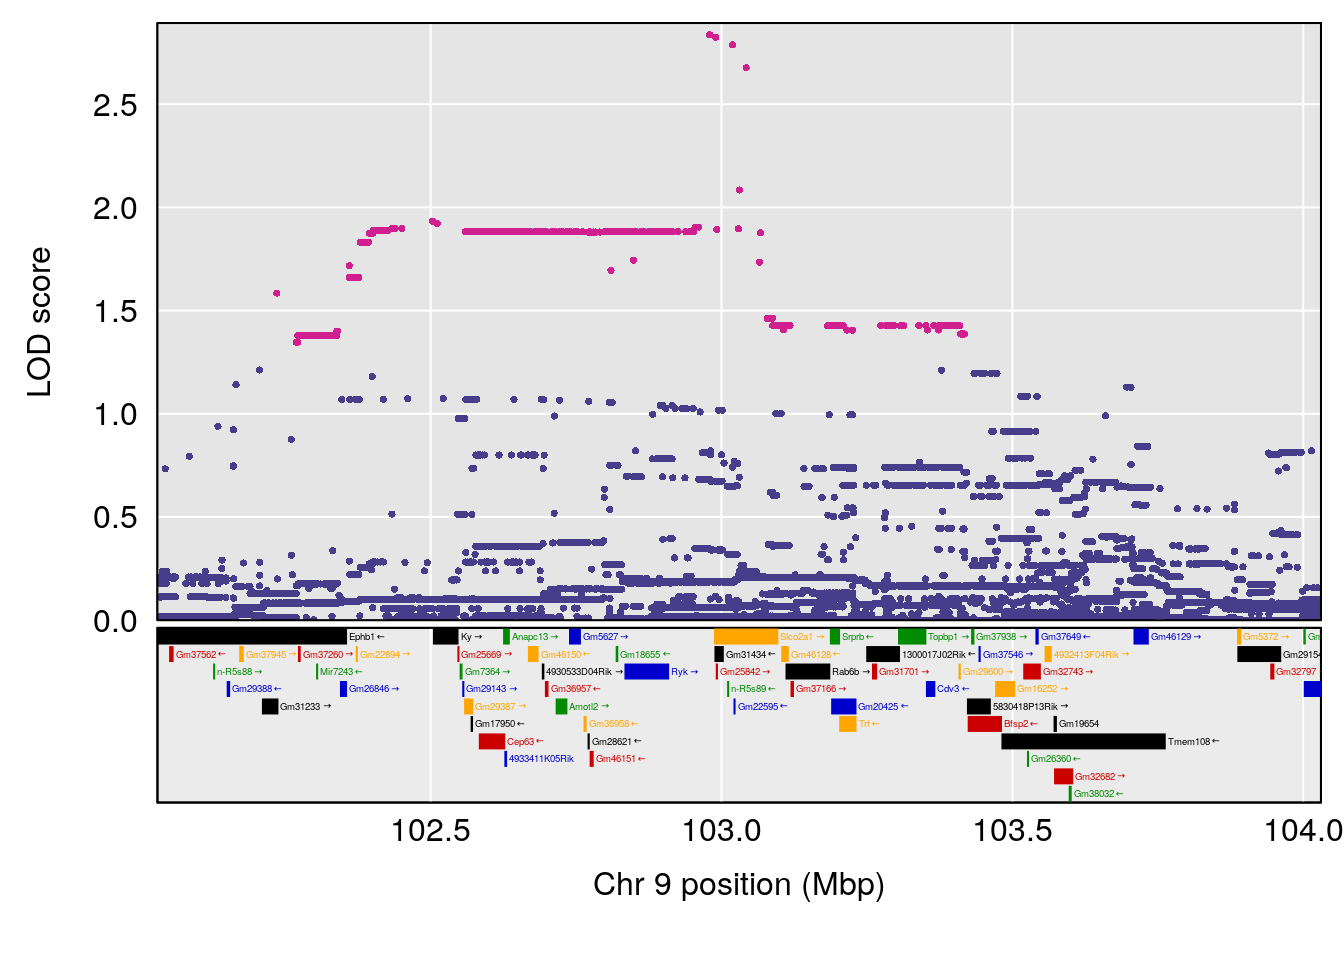
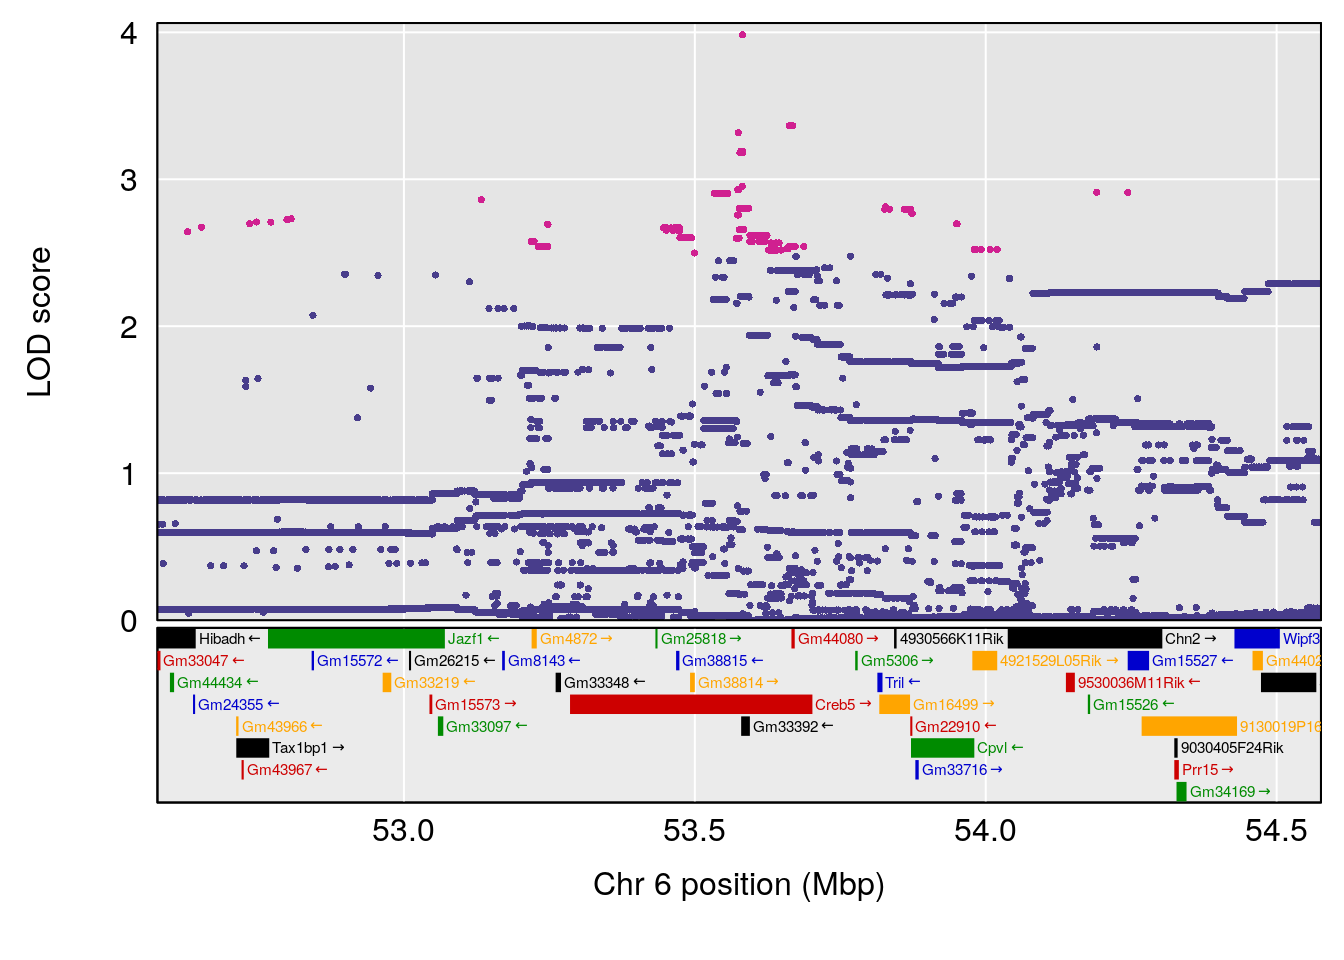
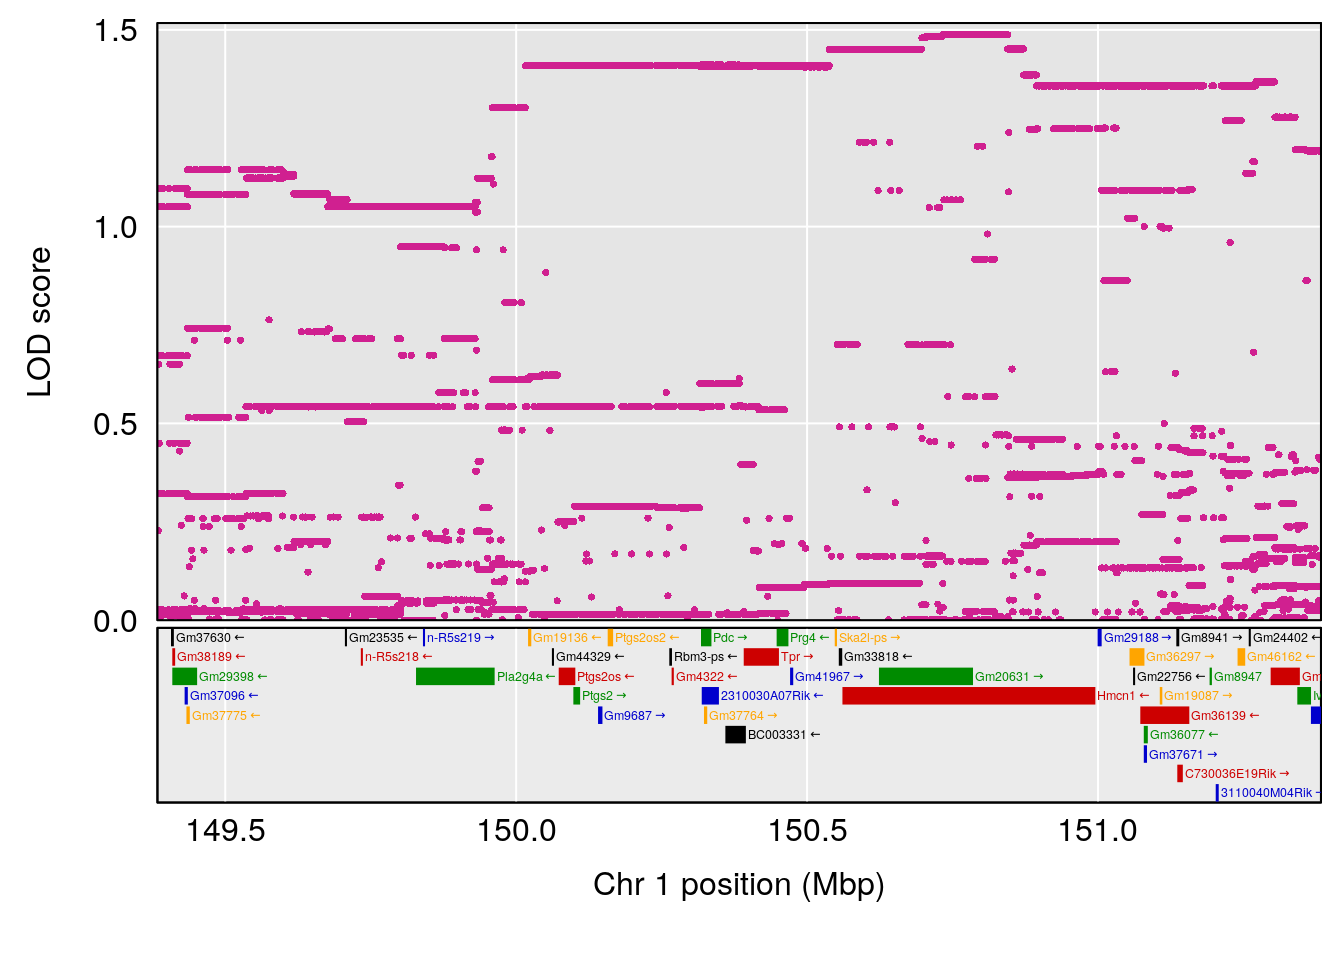
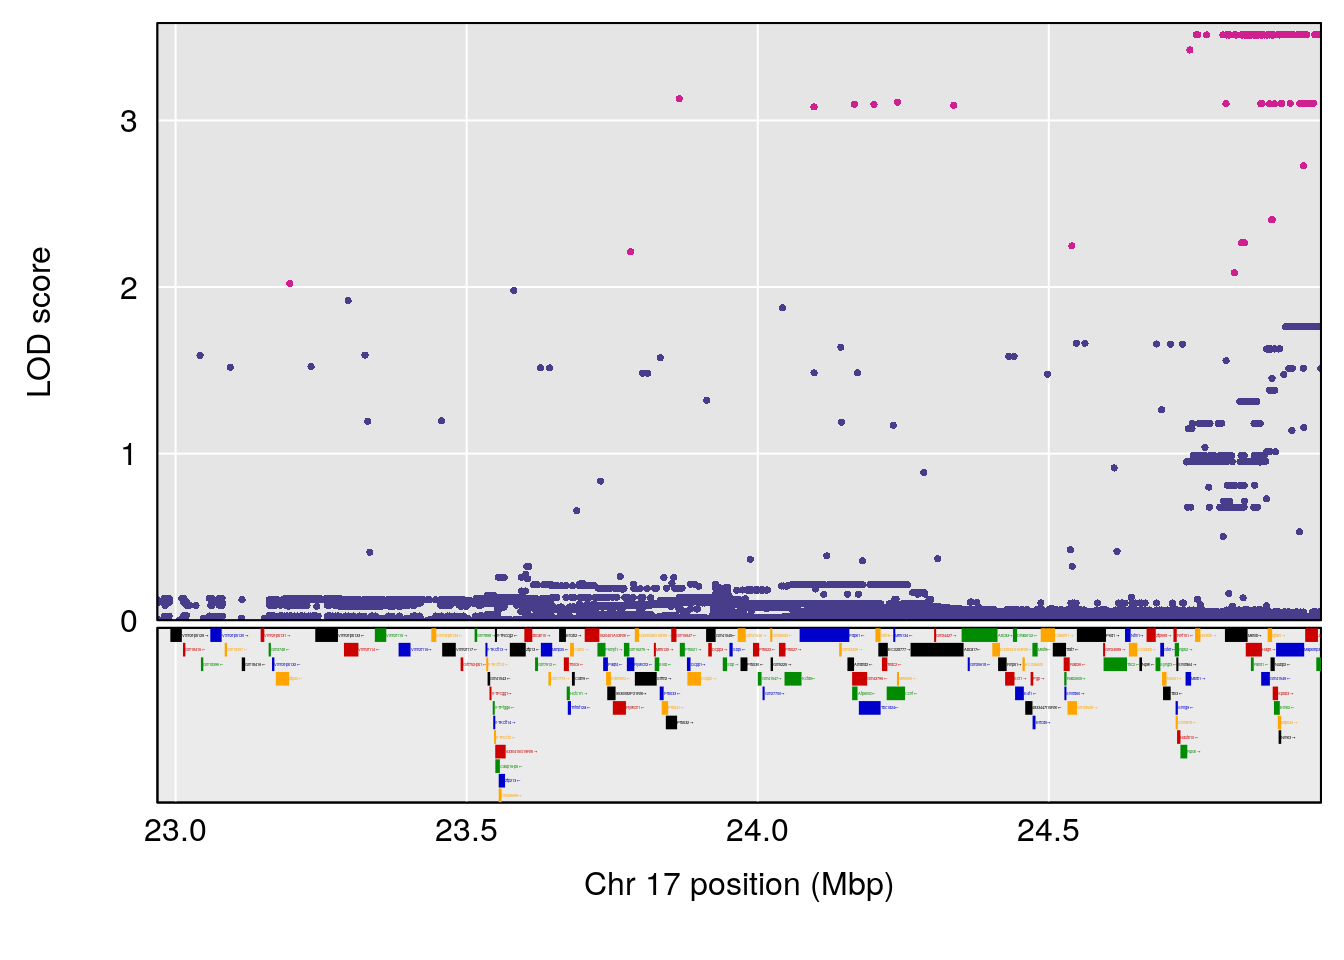
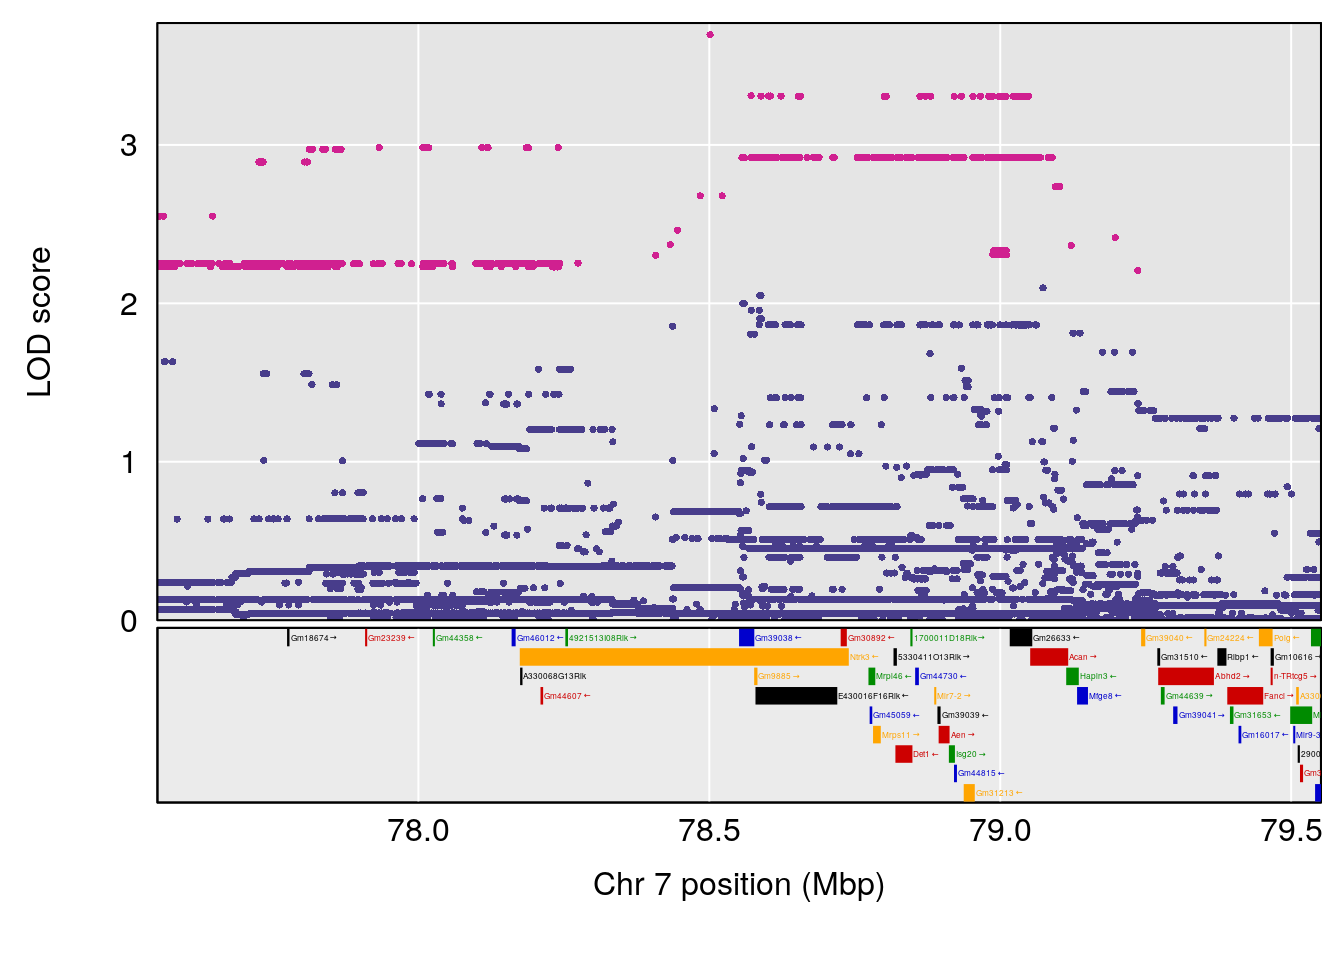
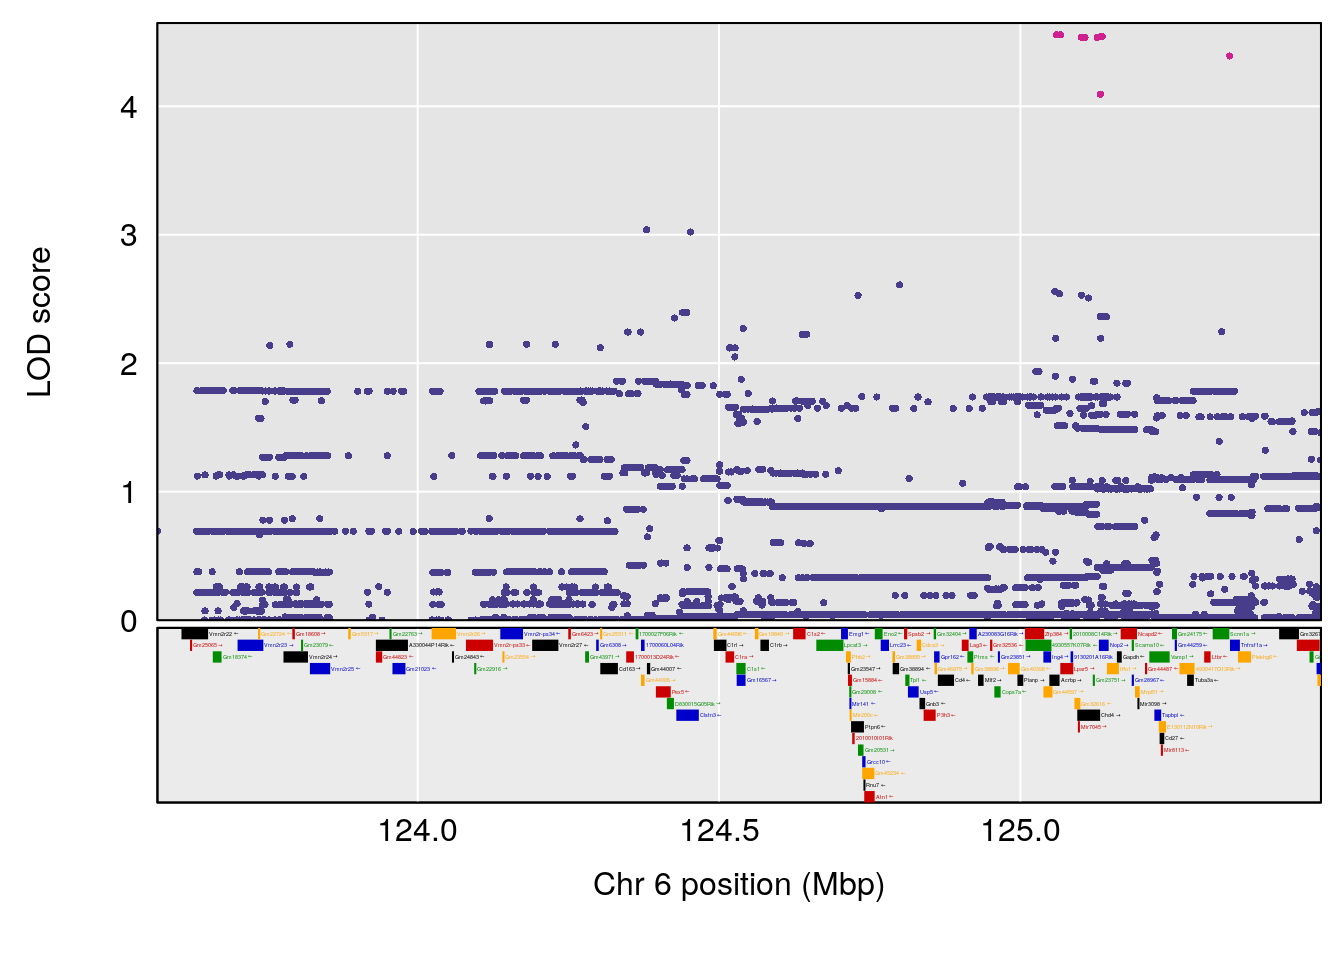
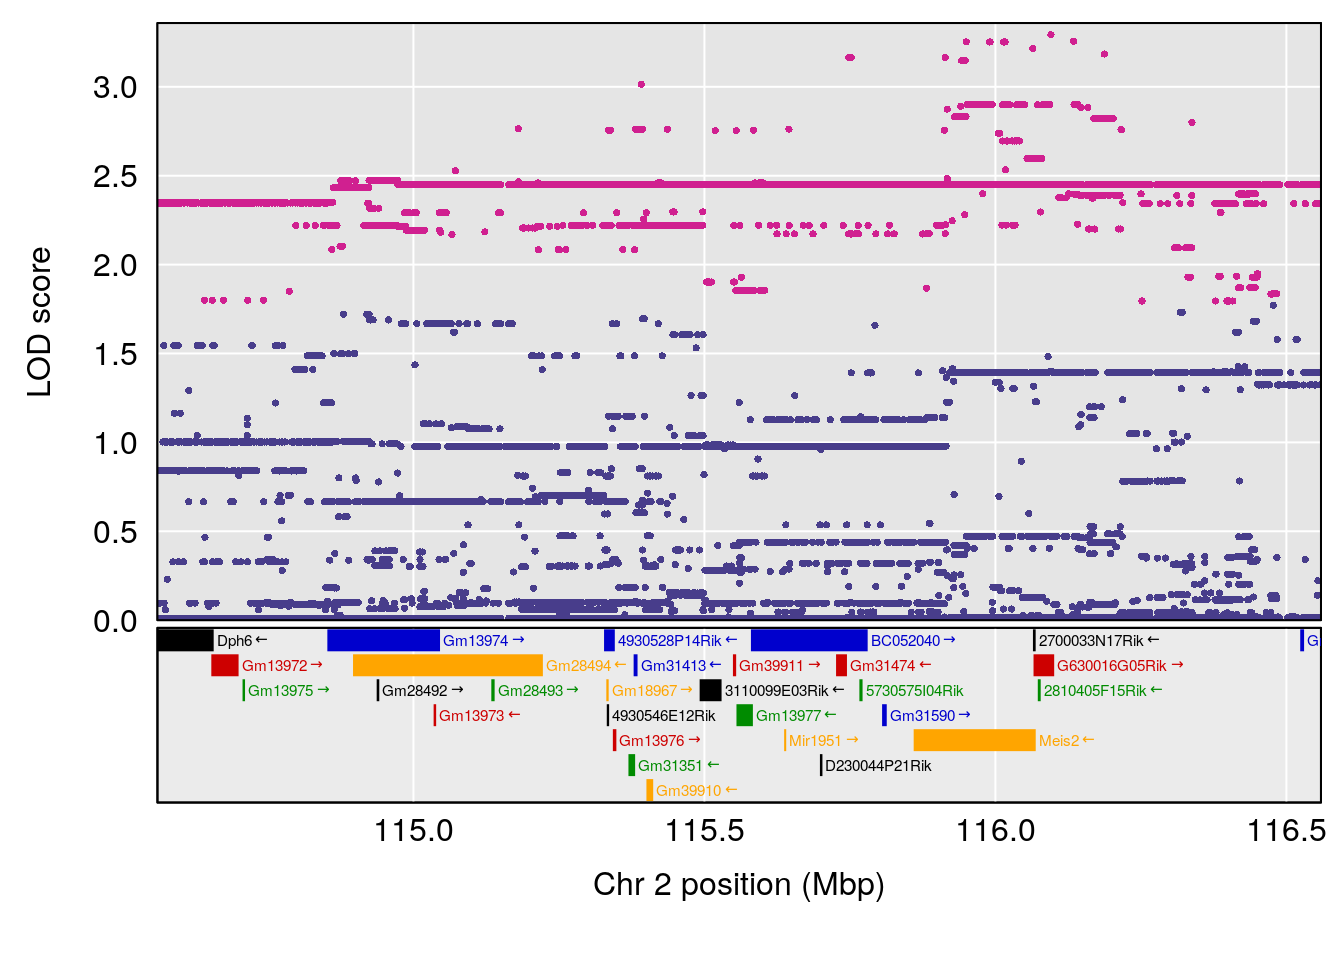
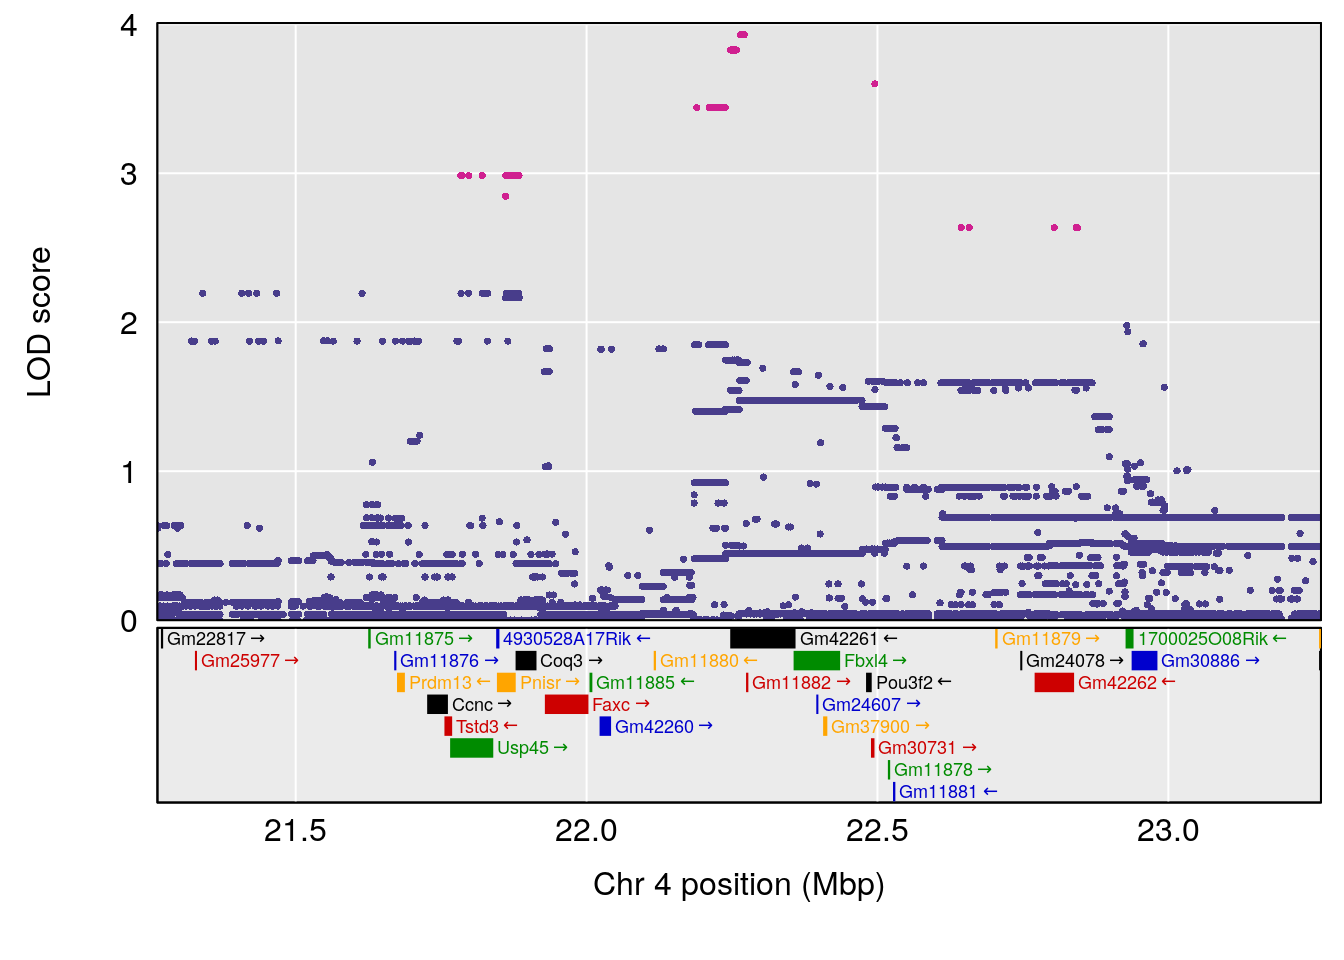
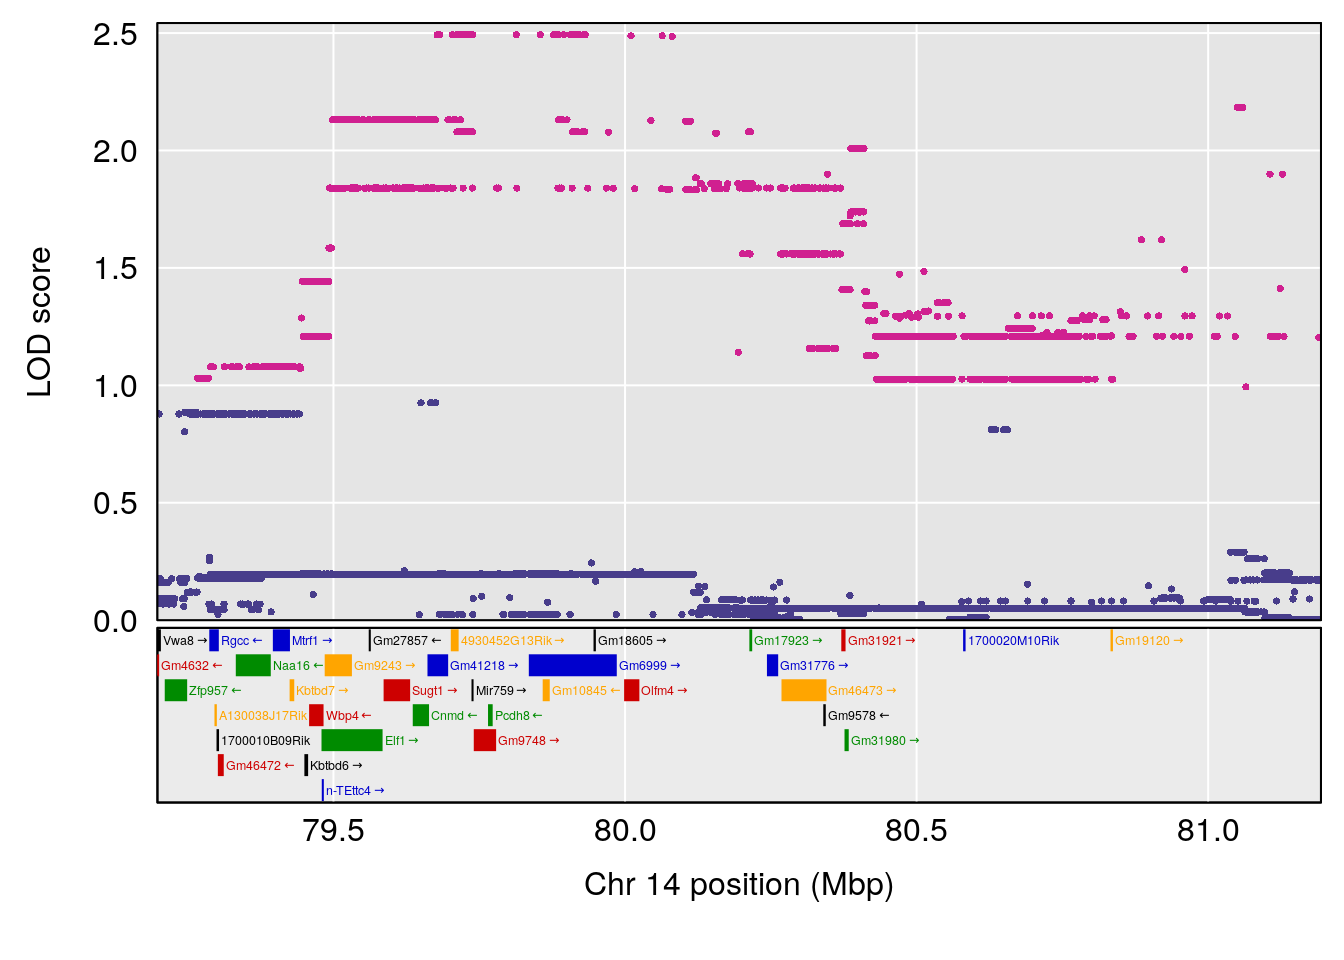
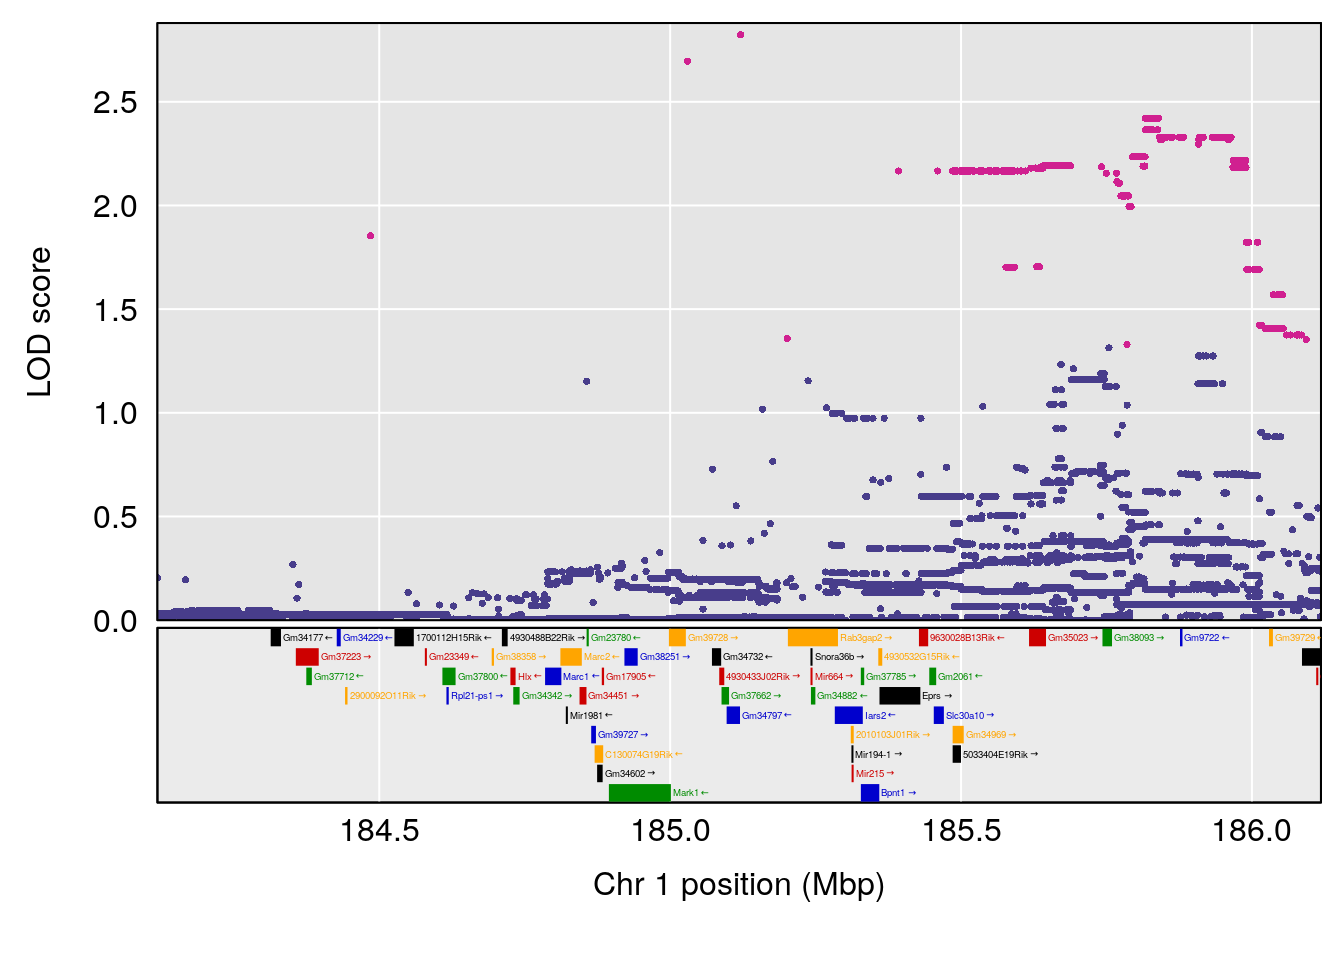
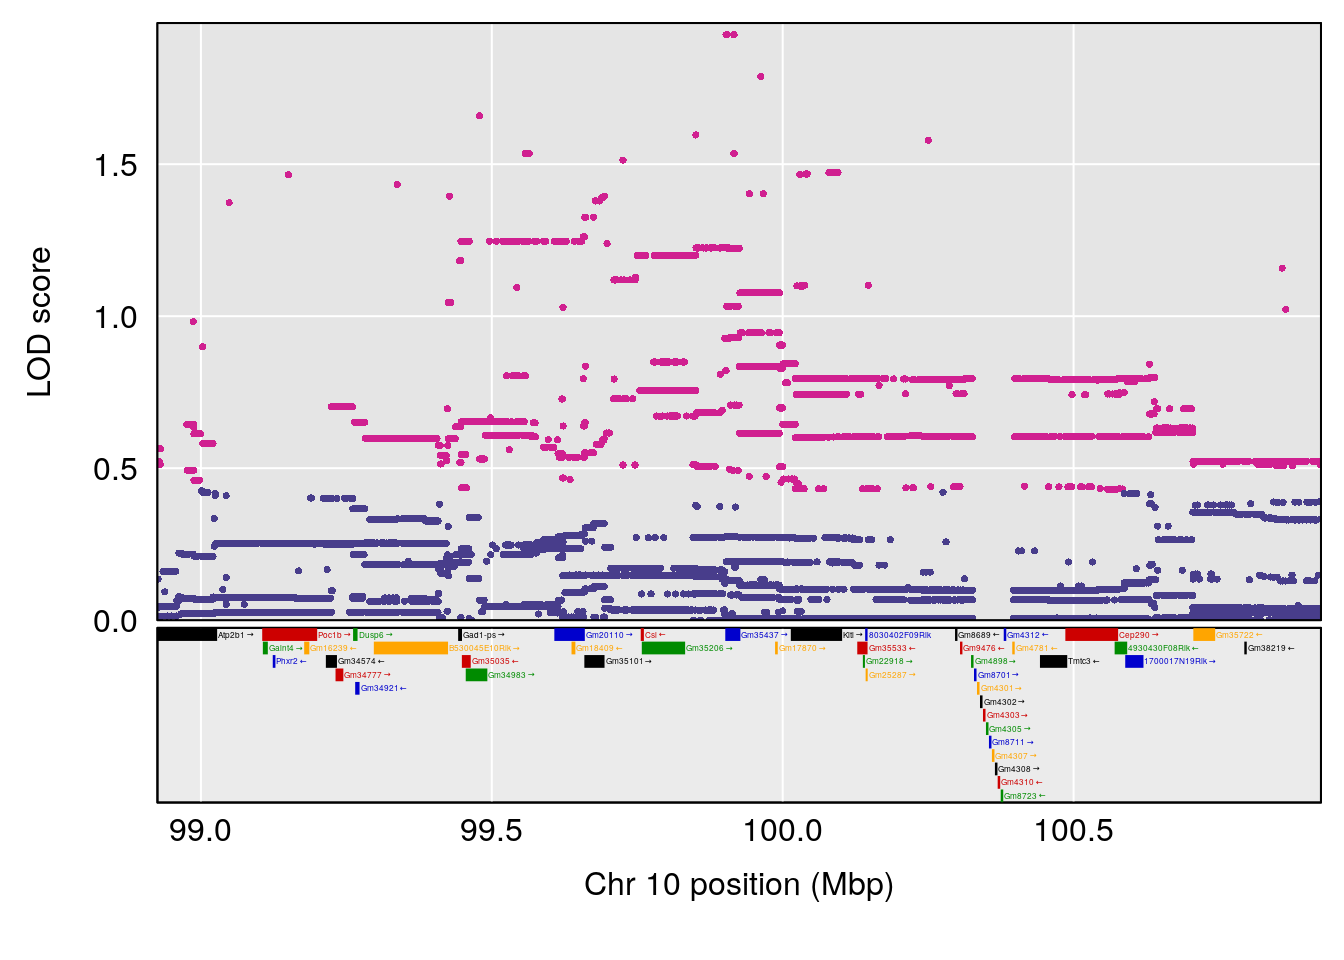
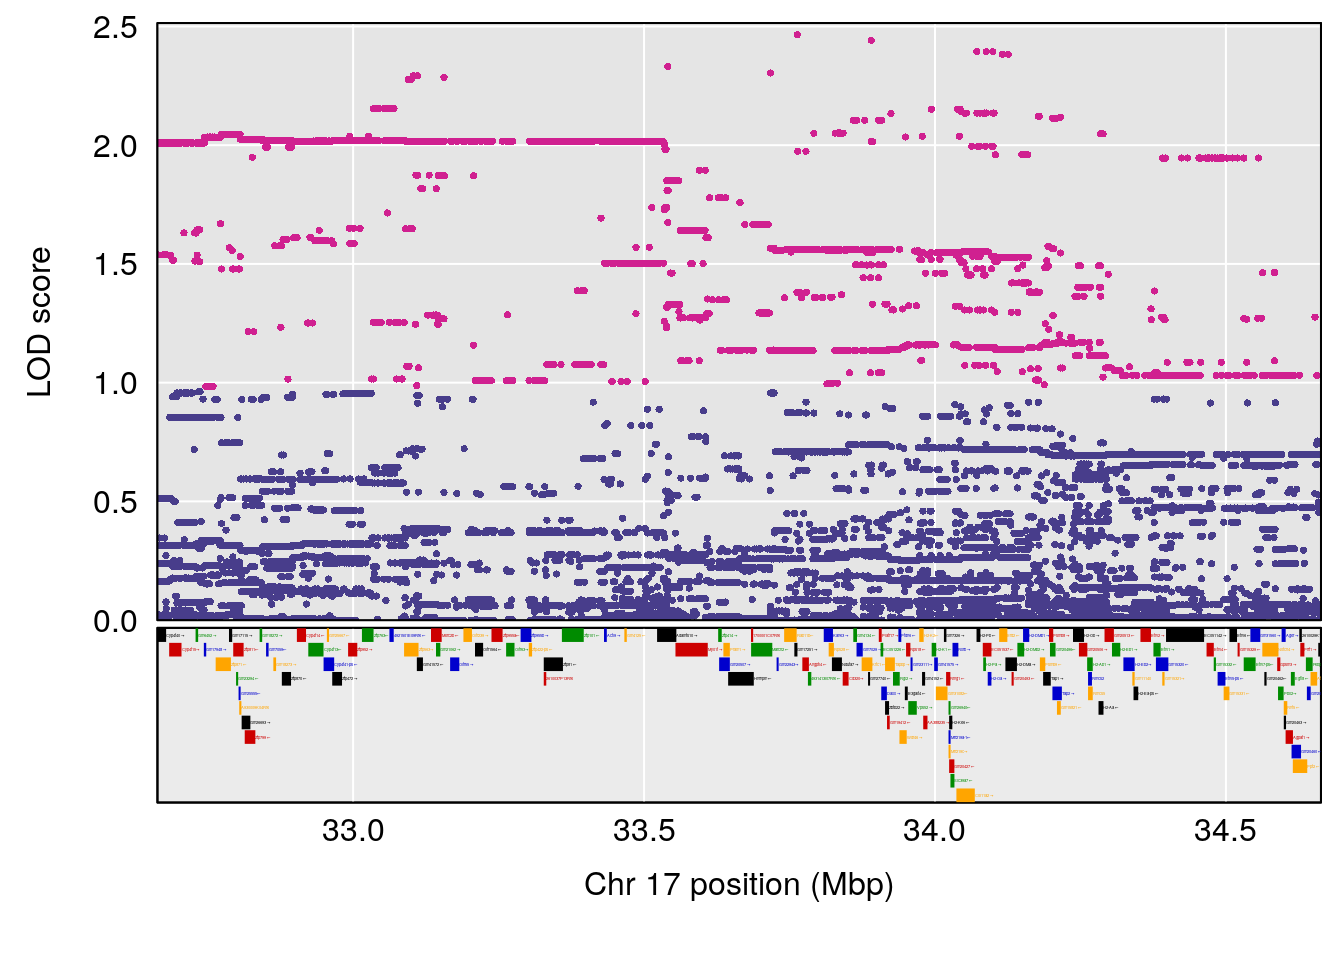
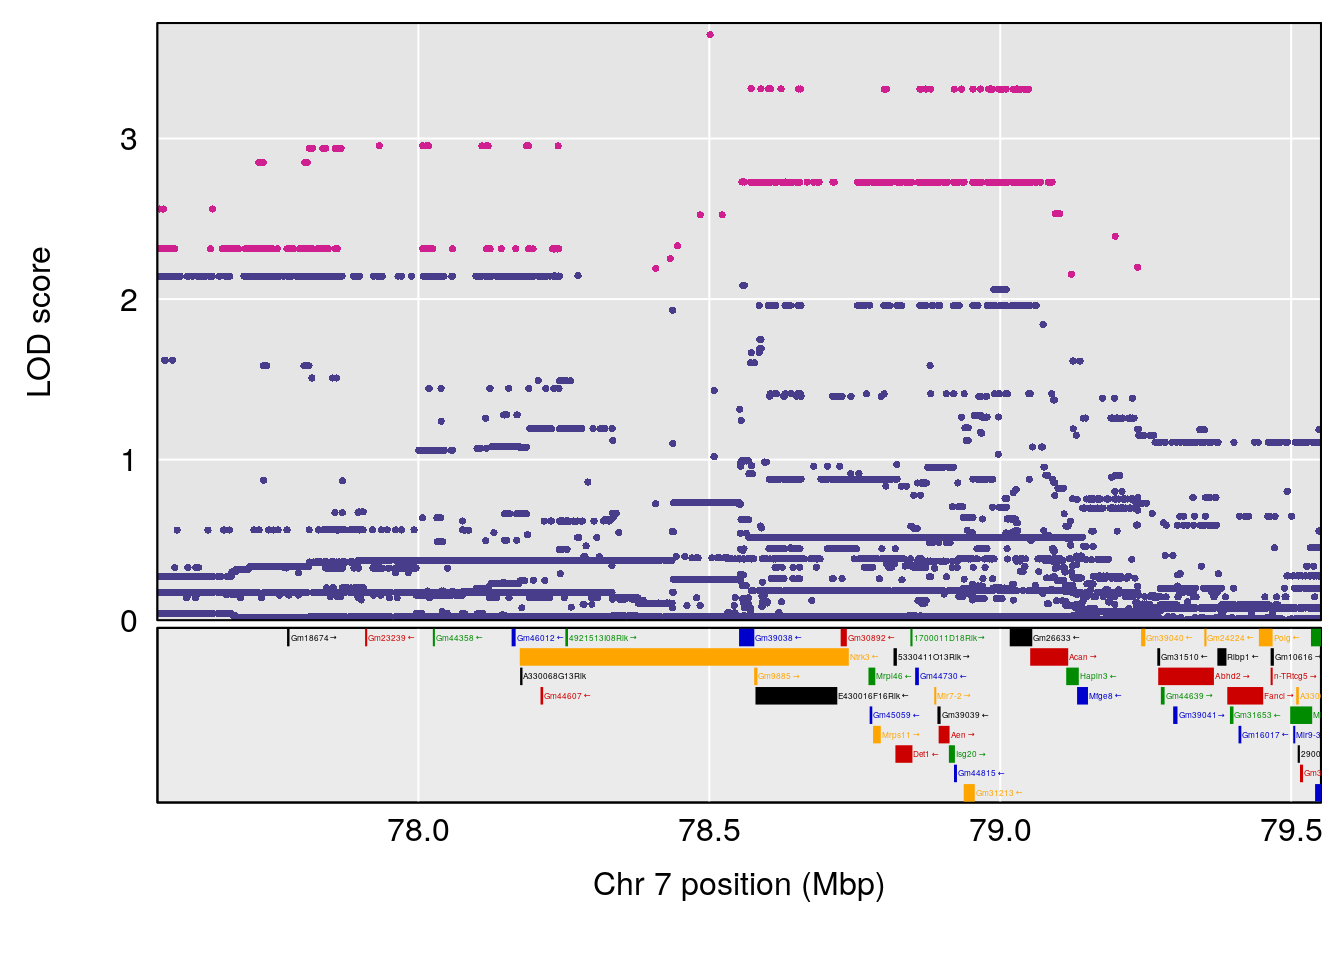
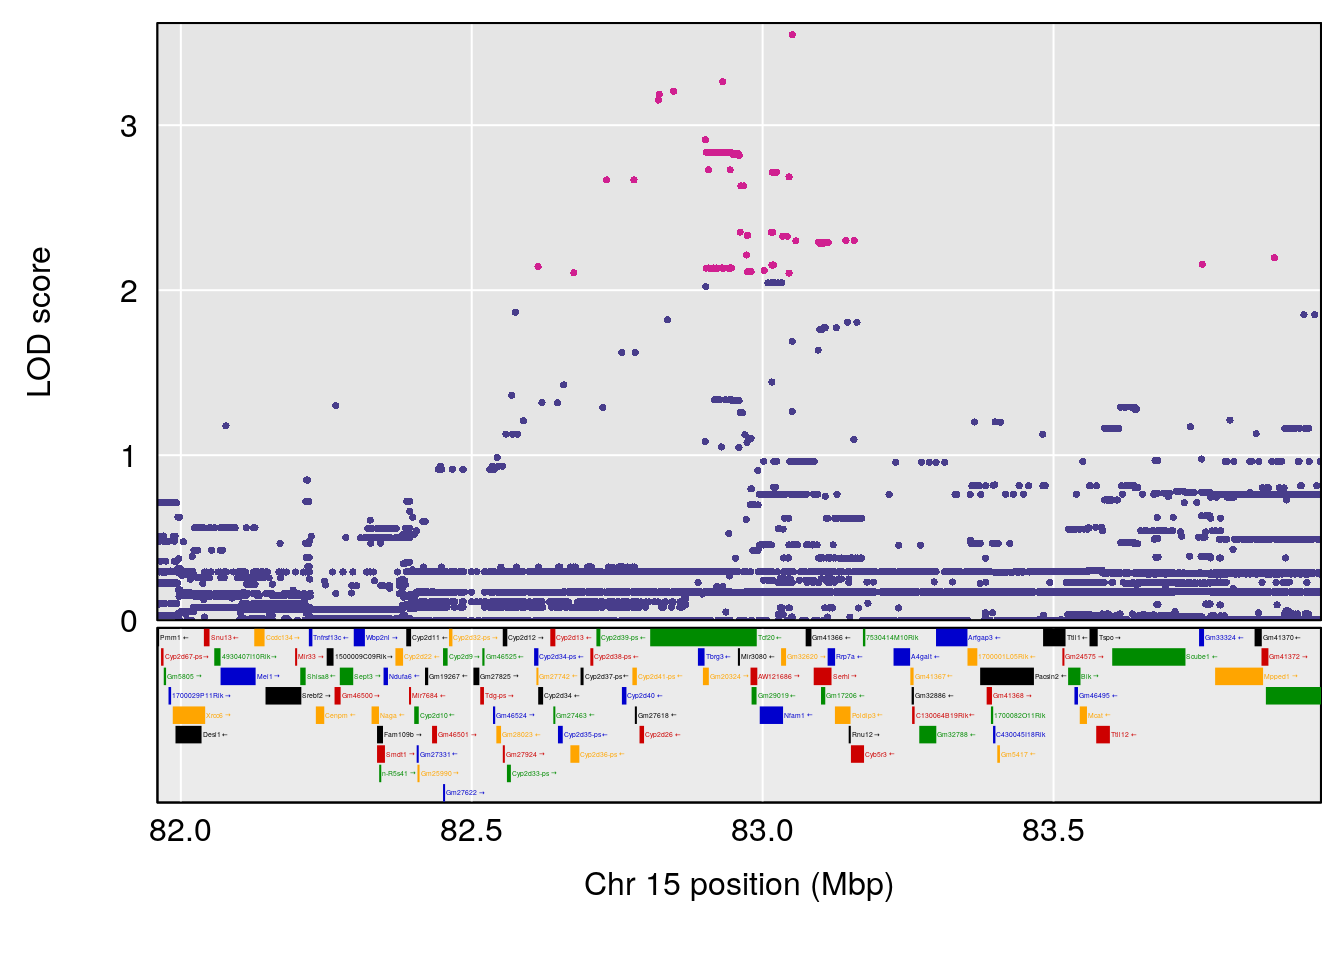
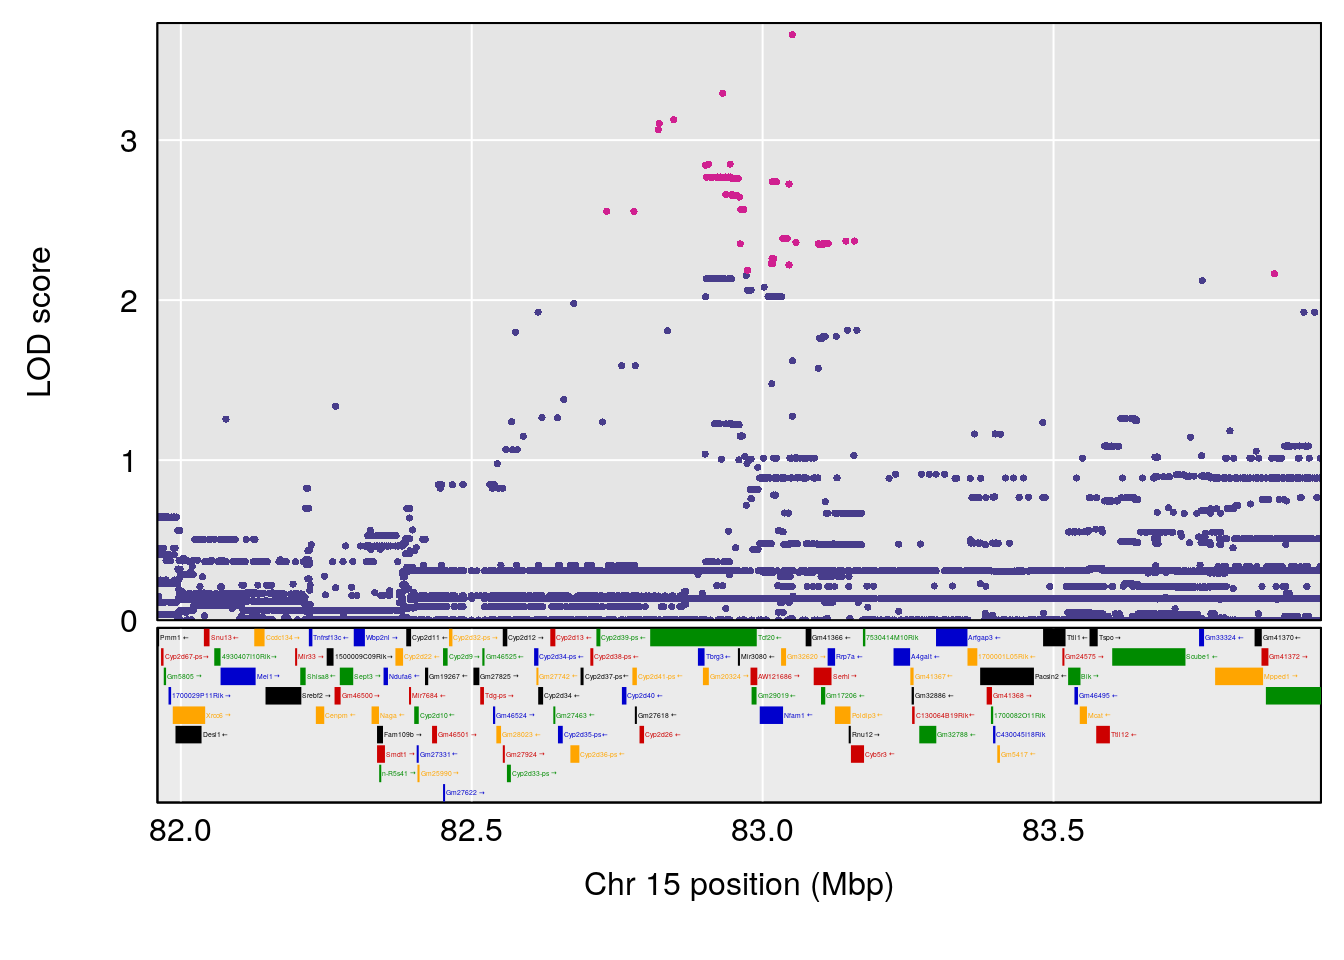
plot(out_snps[[i]][[p]]$lod, out_snps[[i]][[p]]$snpinfo, drop_hilit=1.5, genes=out_genes[[i]][[p]])
}
}
}
# [1] "Time.to.Dead.Hr"
# lodindex lodcolumn chr pos lod ci_lo ci_hi
# 1 1 pheno1 4 155.62894 10.526649 155.33847 155.75940
# 2 1 pheno1 15 100.98983 6.626767 87.42813 101.41826
# 3 1 pheno1 17 23.96788 6.327276 21.57341 26.00445
# [1] 1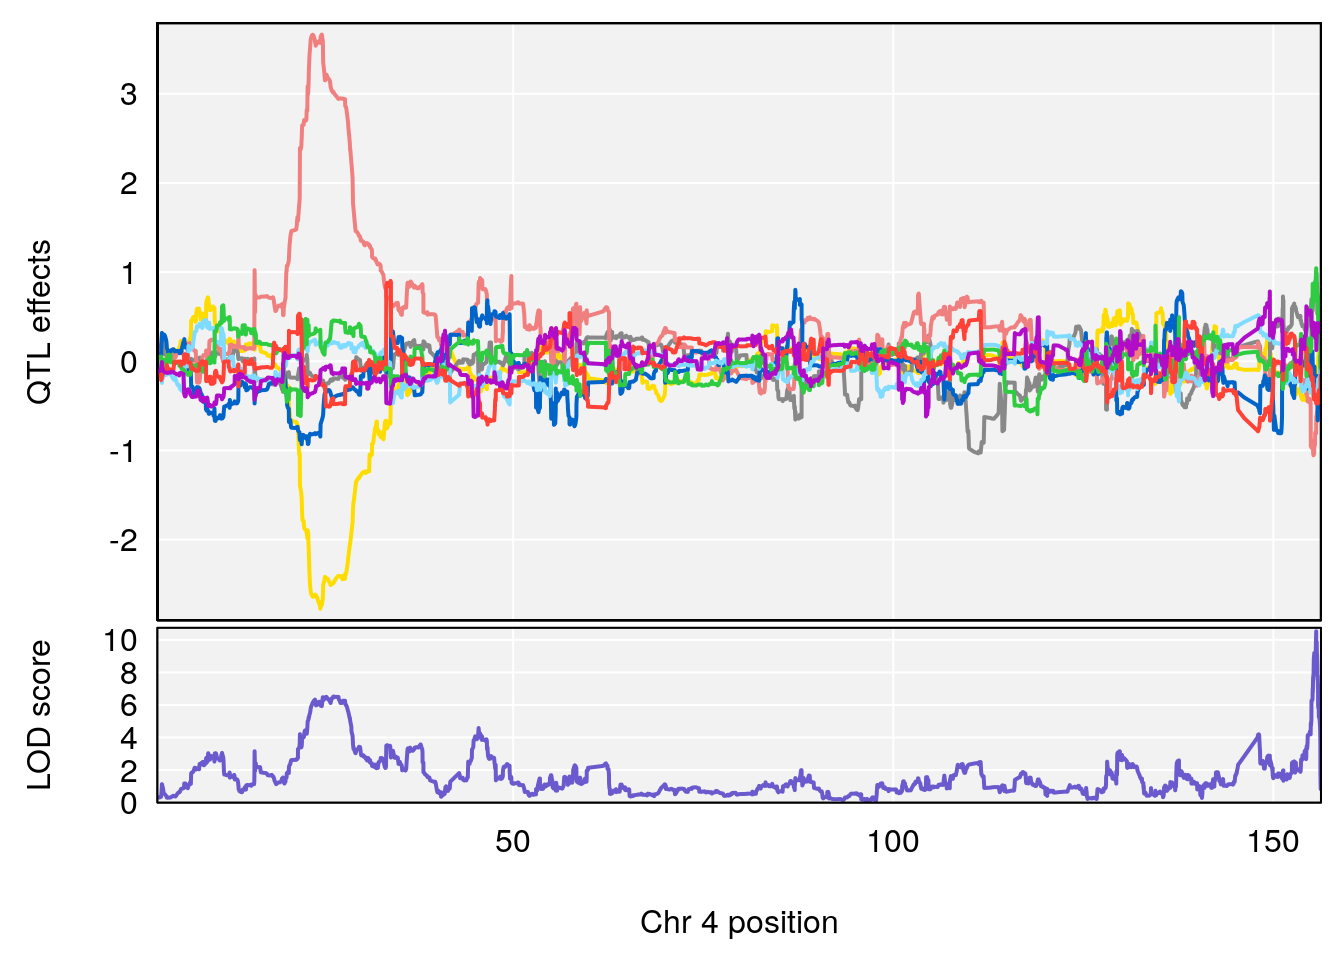
# [1] 2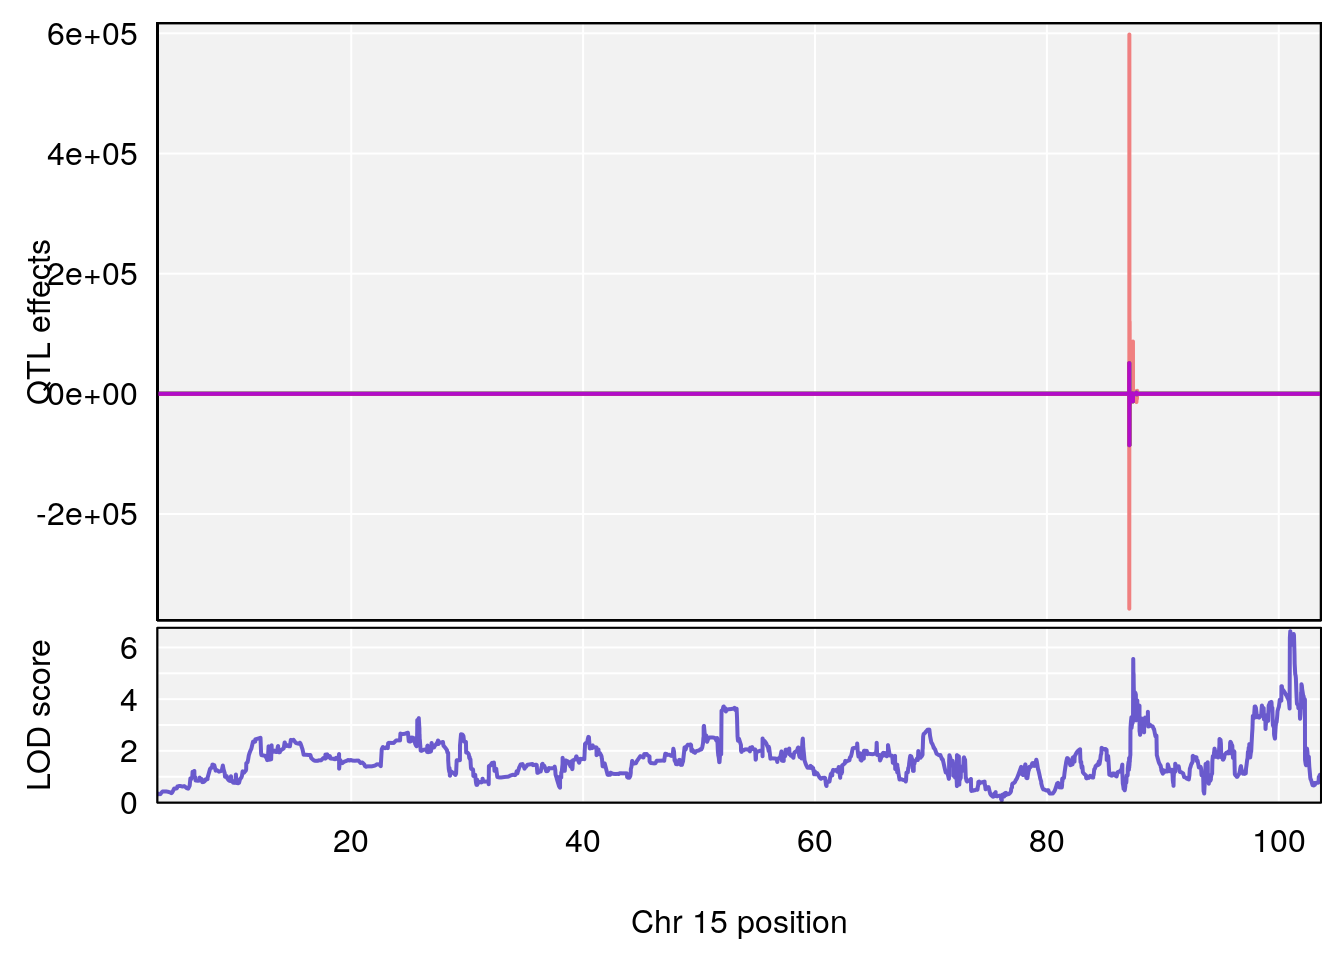
# [1] 3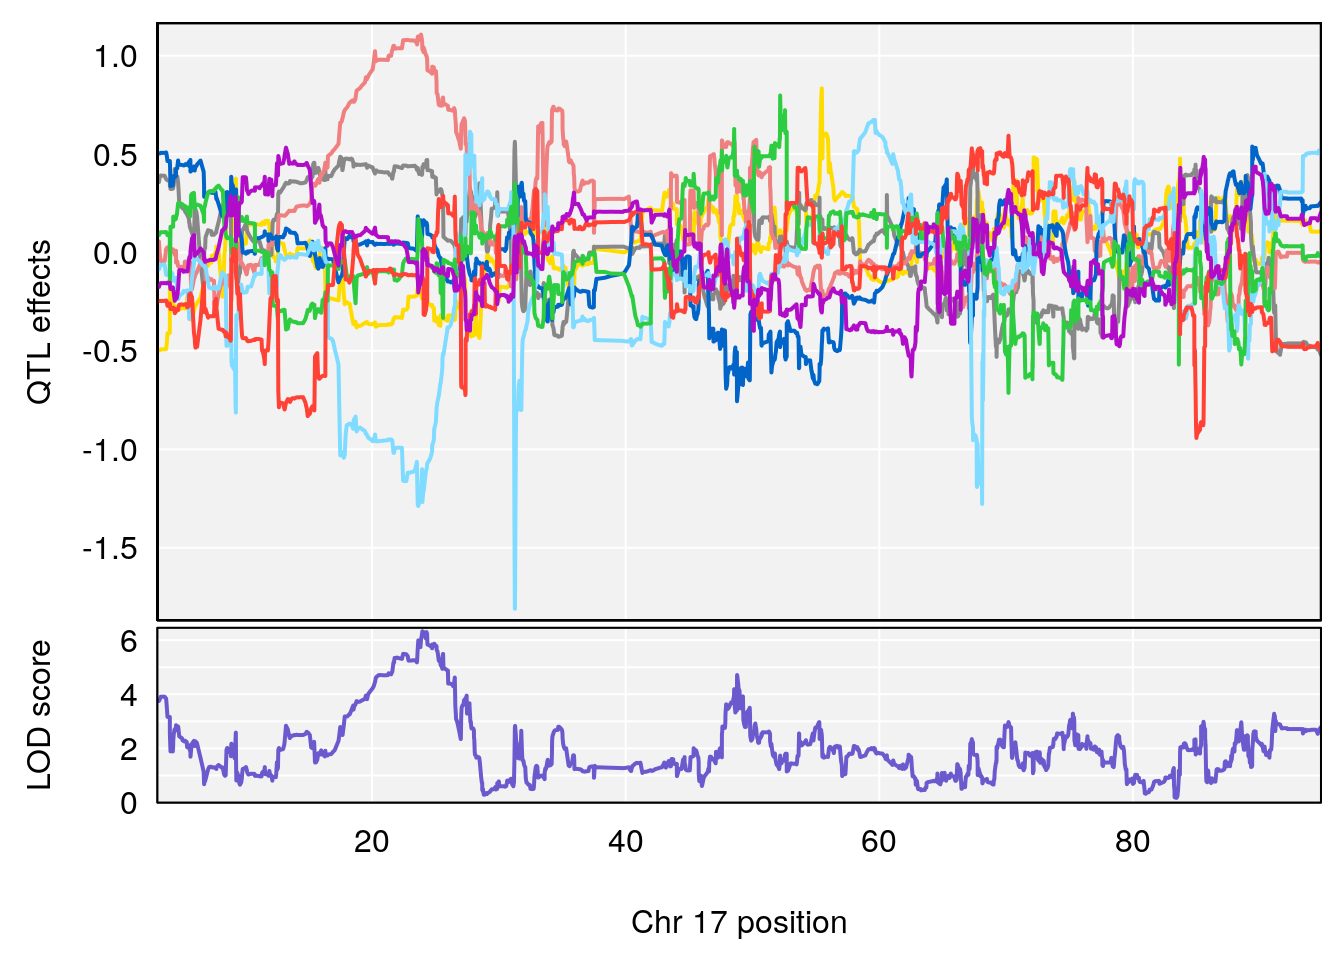
# [1] "RR.Depression.Rate.Hr"
# [1] "Time.to.Steady.RR.Depression.Hr"
# [1] "Min.Depression.RR"
# lodindex lodcolumn chr pos lod ci_lo ci_hi
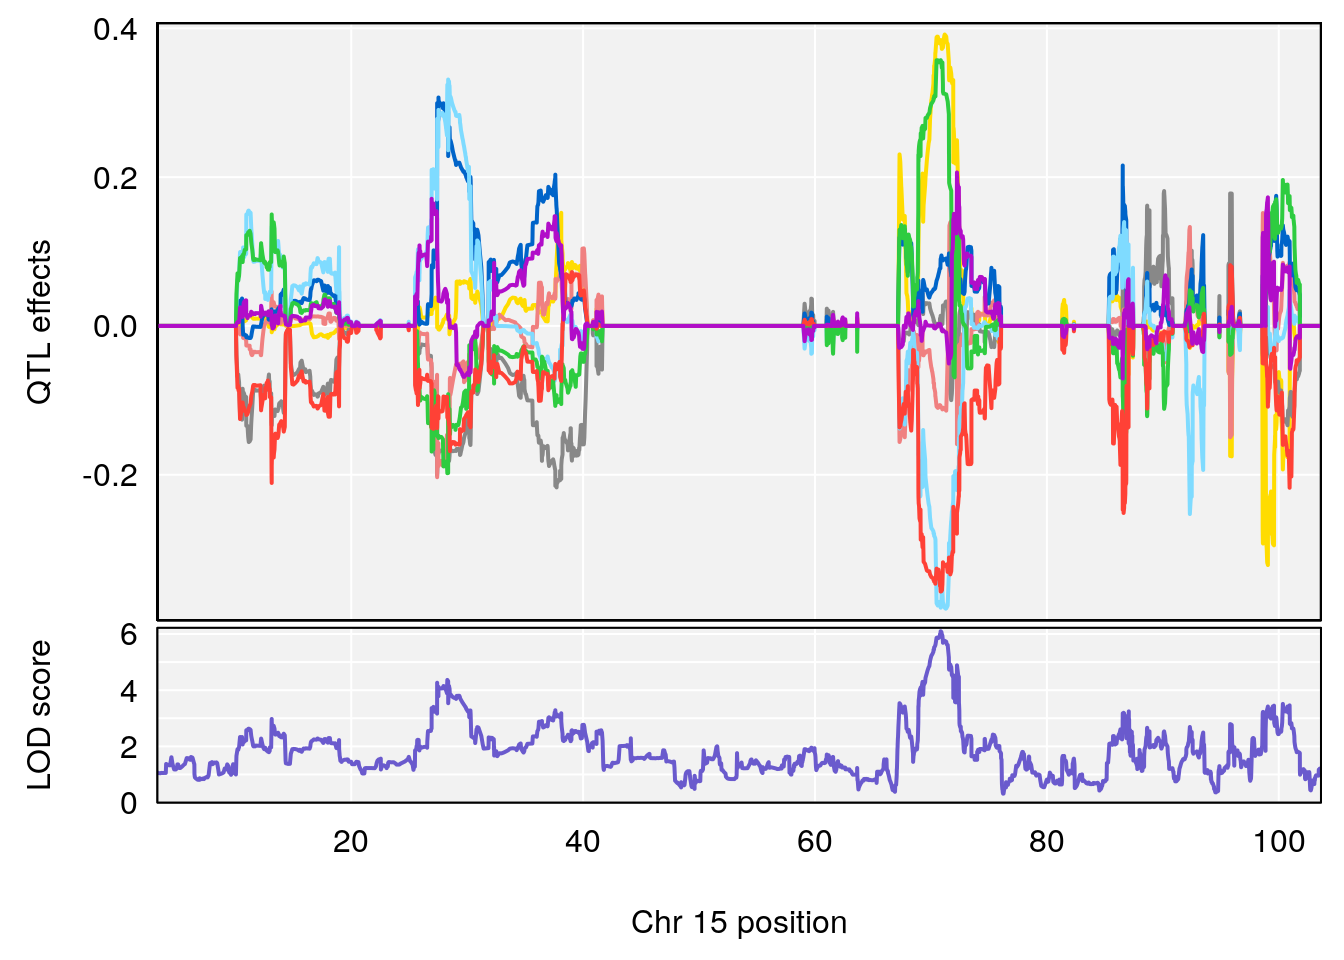
# 1 1 pheno1 15 70.84631 6.097157 69.53075 72.33644
# 2 1 pheno1 X 99.32996 6.439452 98.70699 101.15048
# [1] 1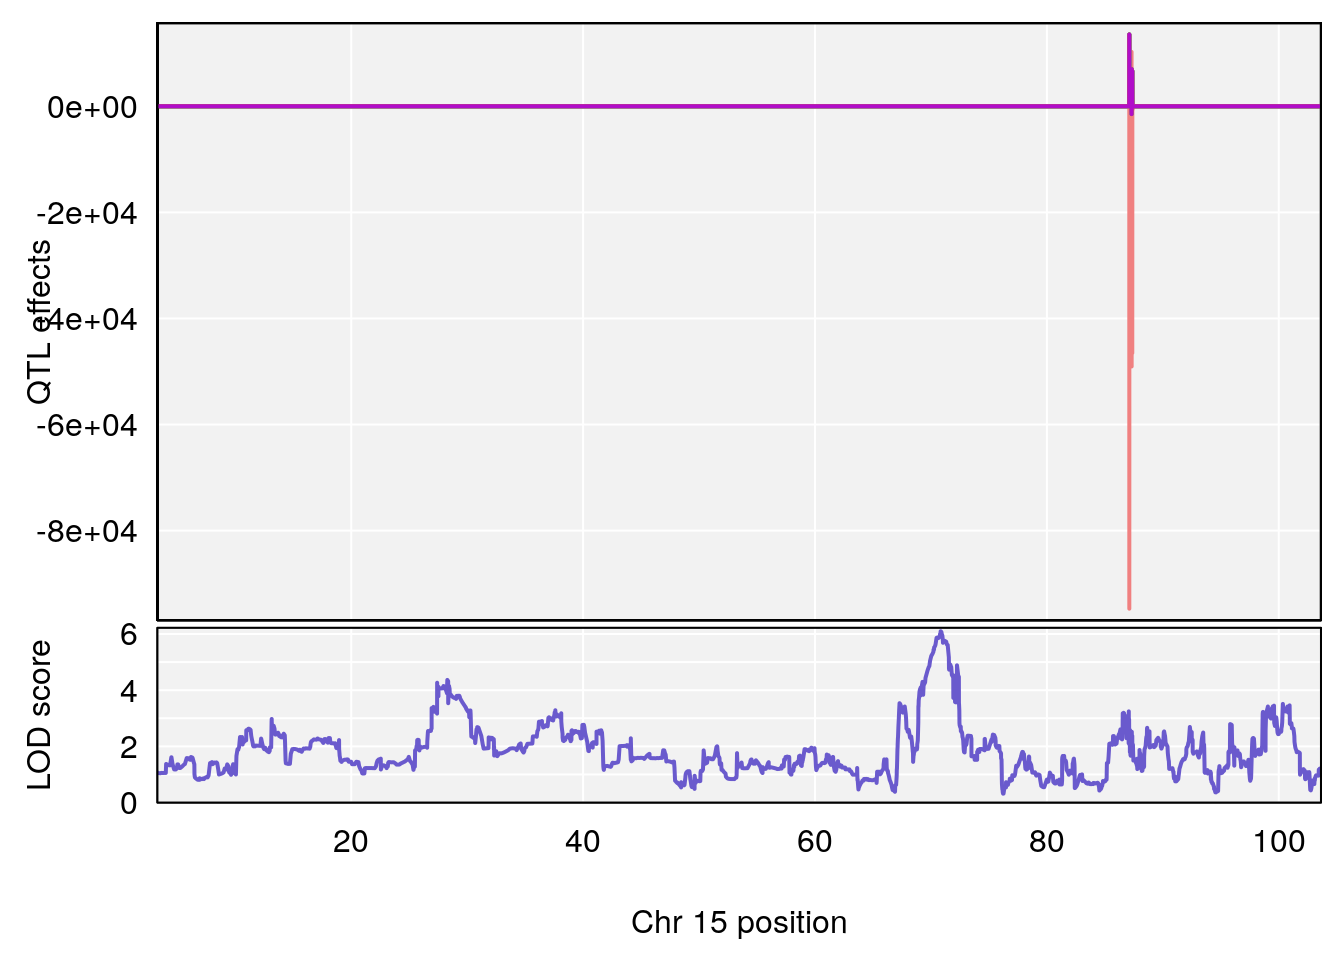
| Version | Author | Date |
|---|---|---|
| 0971ef2 | xhyuo | 2022-07-05 |
# [1] 2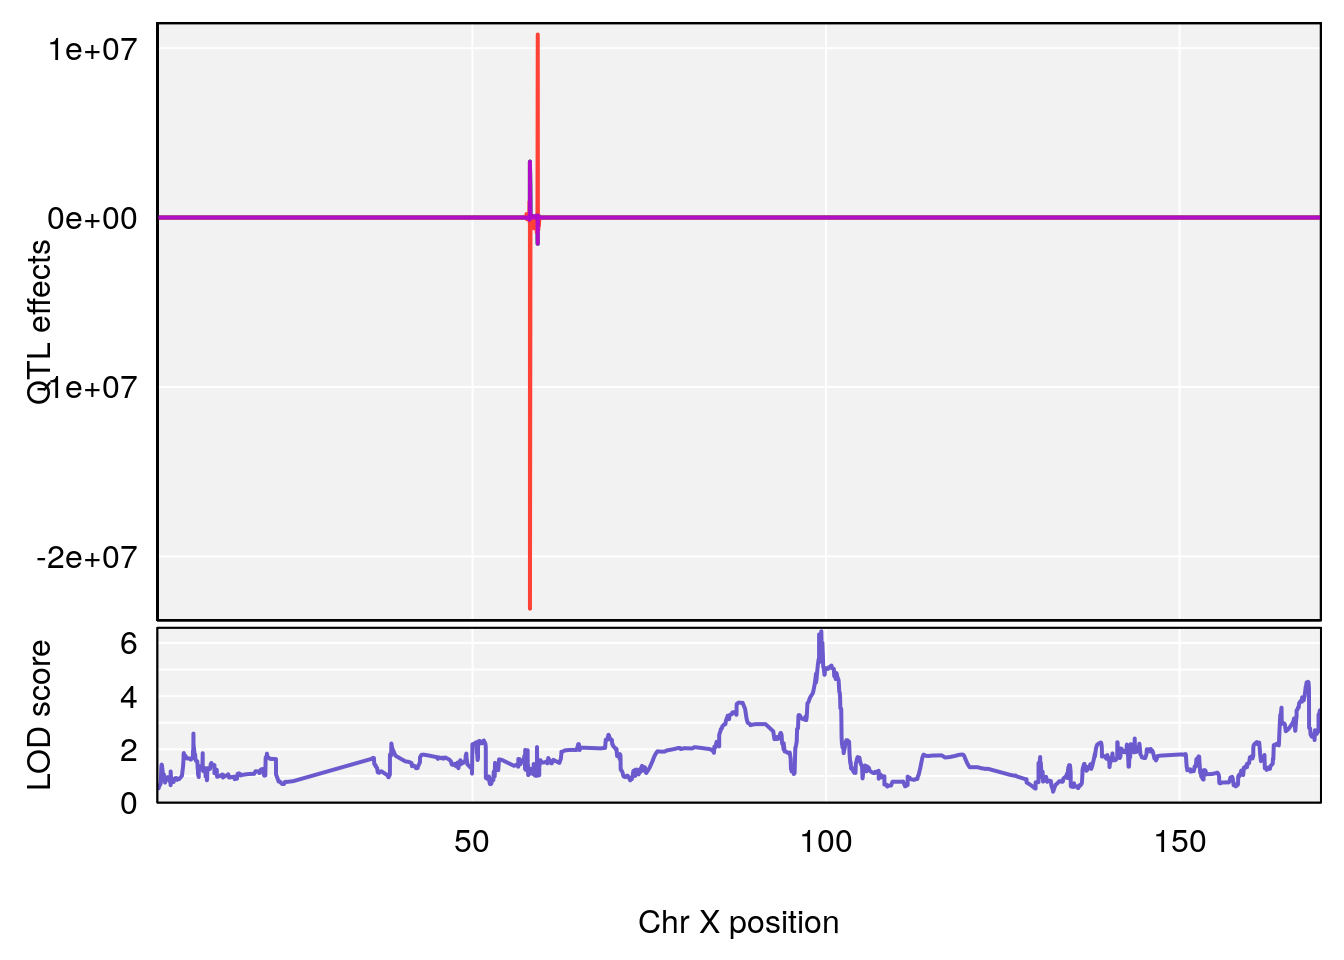
| Version | Author | Date |
|---|---|---|
| 0971ef2 | xhyuo | 2022-07-05 |
| Version | Author | Date |
|---|---|---|
| 0971ef2 | xhyuo | 2022-07-05 |
| Version | Author | Date |
|---|---|---|
| 0971ef2 | xhyuo | 2022-07-05 |
# [1] "Mean.Depression.BR"
#   lodindex lodcolumn chr       pos      lod    ci_lo     ci_hi
# 1        1    pheno1   2 179.93697 6.642010 99.48509 180.36898
# 2        1    pheno1  15  28.43474 6.957455 27.40518  72.41165
# 3        1    pheno1  17  44.82475 6.816106 44.68776  45.38912
# [1] 1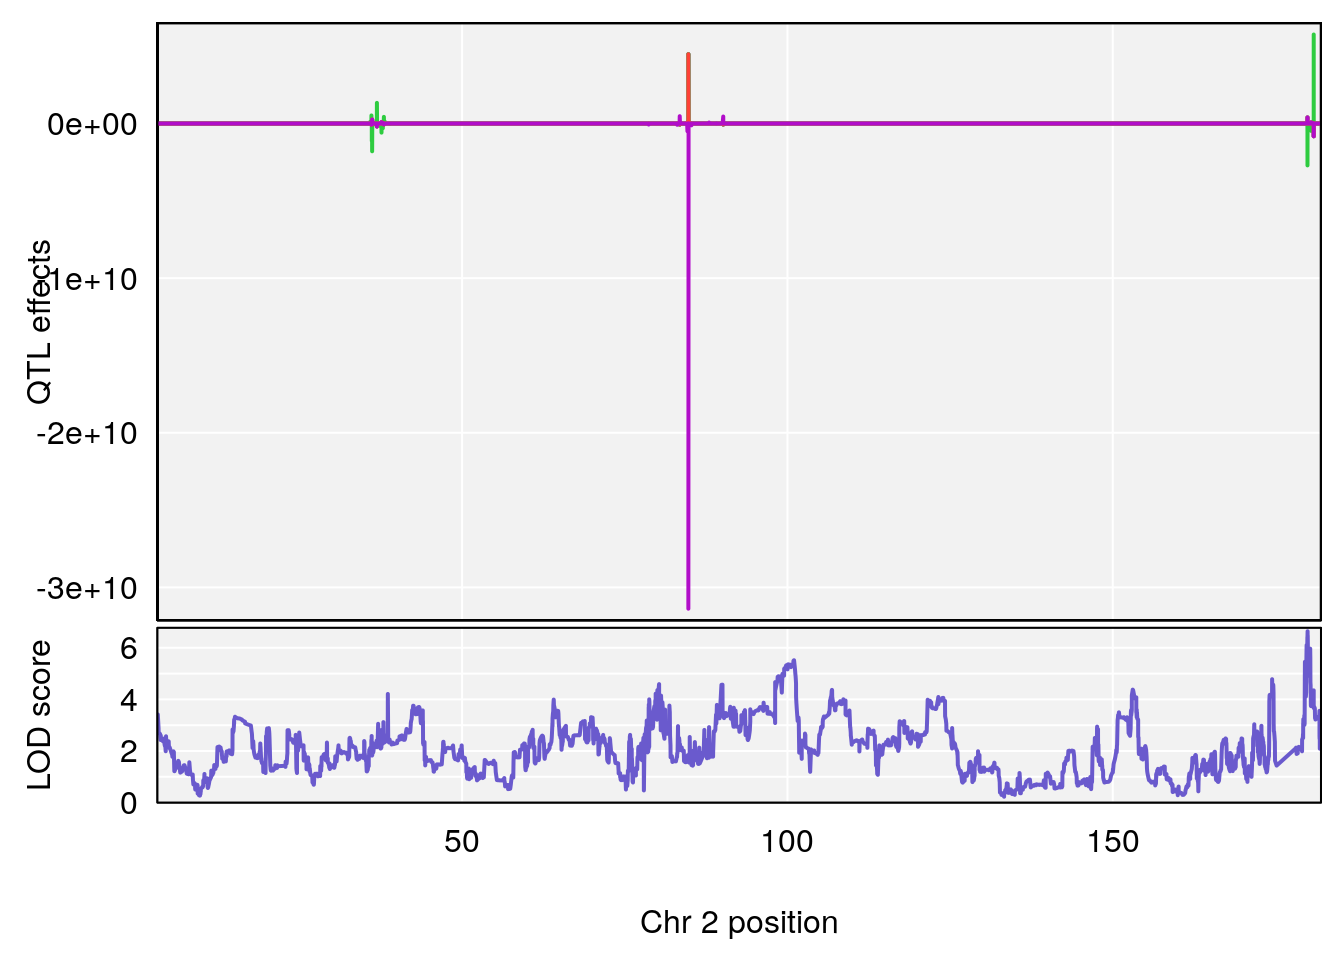
| Version | Author | Date |
|---|---|---|
| 0971ef2 | xhyuo | 2022-07-05 |
| Version | Author | Date |
|---|---|---|
| 0971ef2 | xhyuo | 2022-07-05 |
| Version | Author | Date |
|---|---|---|
| 0971ef2 | xhyuo | 2022-07-05 |
# [1] 2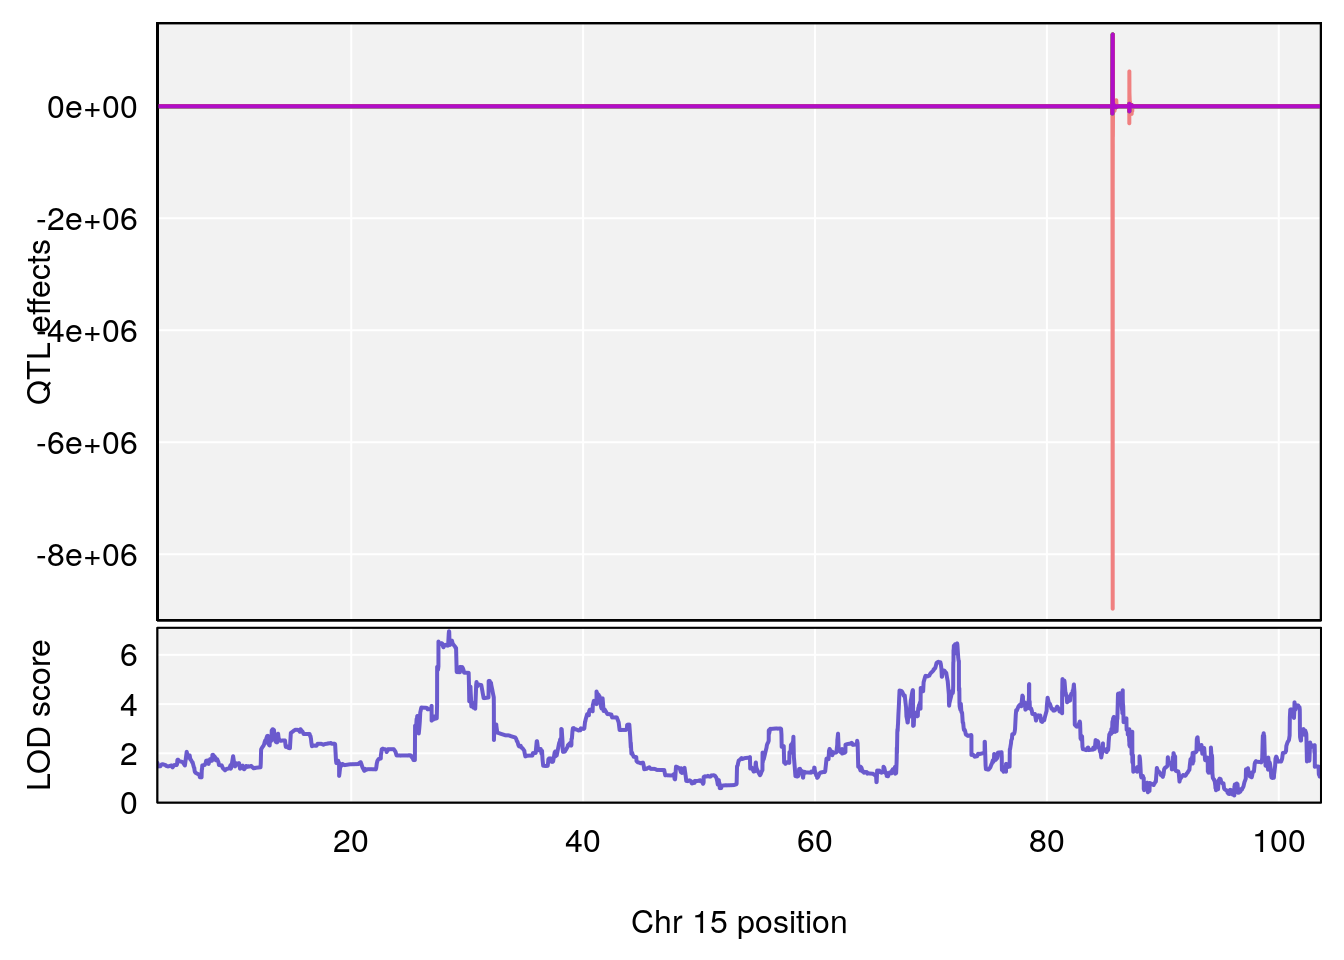
| Version | Author | Date |
|---|---|---|
| 0971ef2 | xhyuo | 2022-07-05 |
| Version | Author | Date |
|---|---|---|
| 0971ef2 | xhyuo | 2022-07-05 |
| Version | Author | Date |
|---|---|---|
| 0971ef2 | xhyuo | 2022-07-05 |
# [1] 3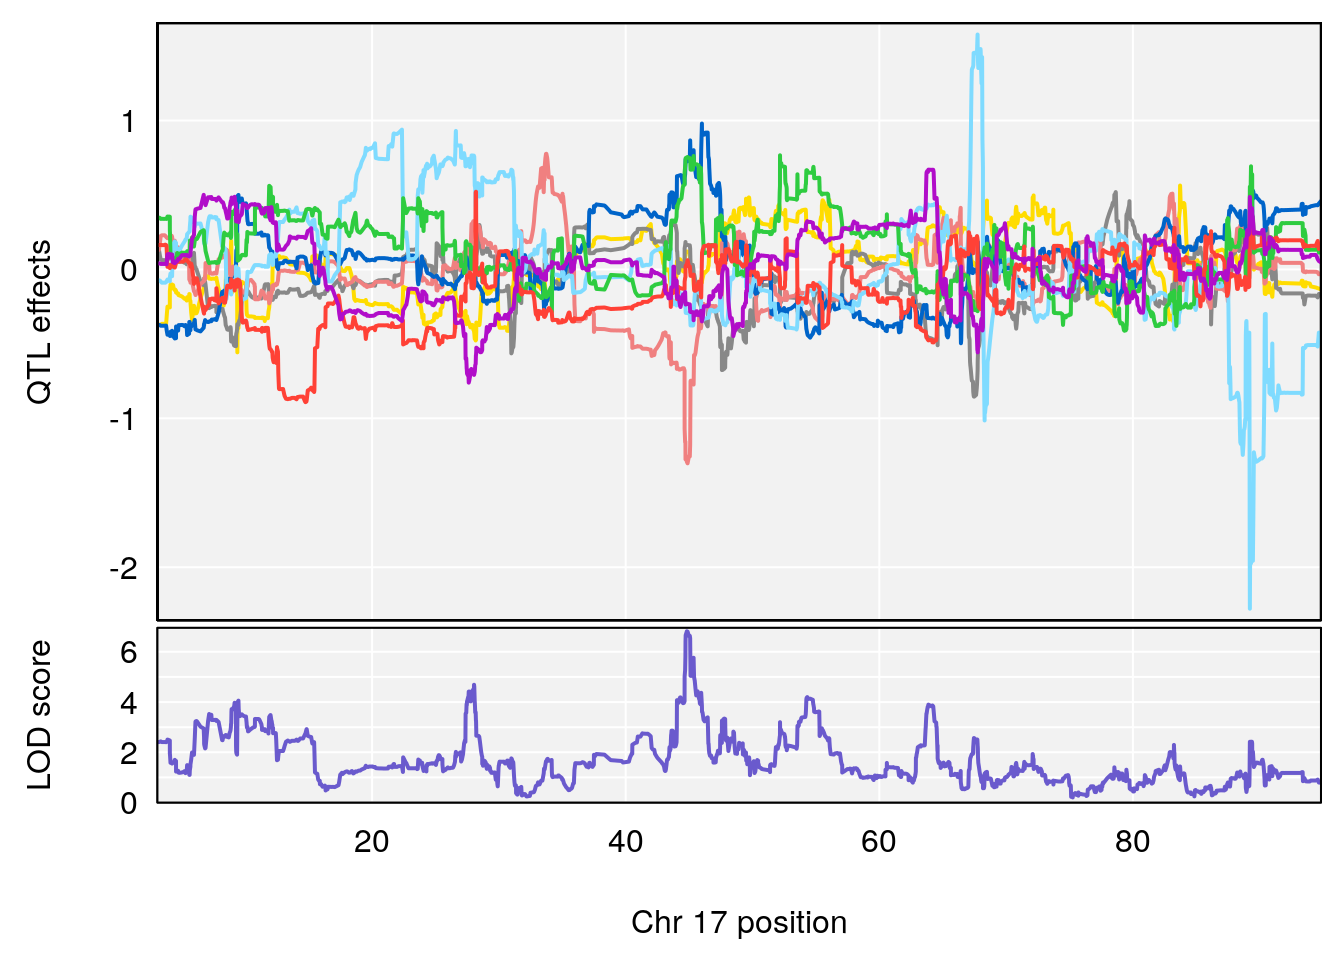
| Version | Author | Date |
|---|---|---|
| 0971ef2 | xhyuo | 2022-07-05 |
| Version | Author | Date |
|---|---|---|
| 0971ef2 | xhyuo | 2022-07-05 |
| Version | Author | Date |
|---|---|---|
| 0971ef2 | xhyuo | 2022-07-05 |
# [1] "SteadyState.Depression.Duration.Hr"
# lodindex lodcolumn chr pos lod ci_lo ci_hi
# 1 1 pheno1 1 152.78955 6.378383 151.00100 153.36692
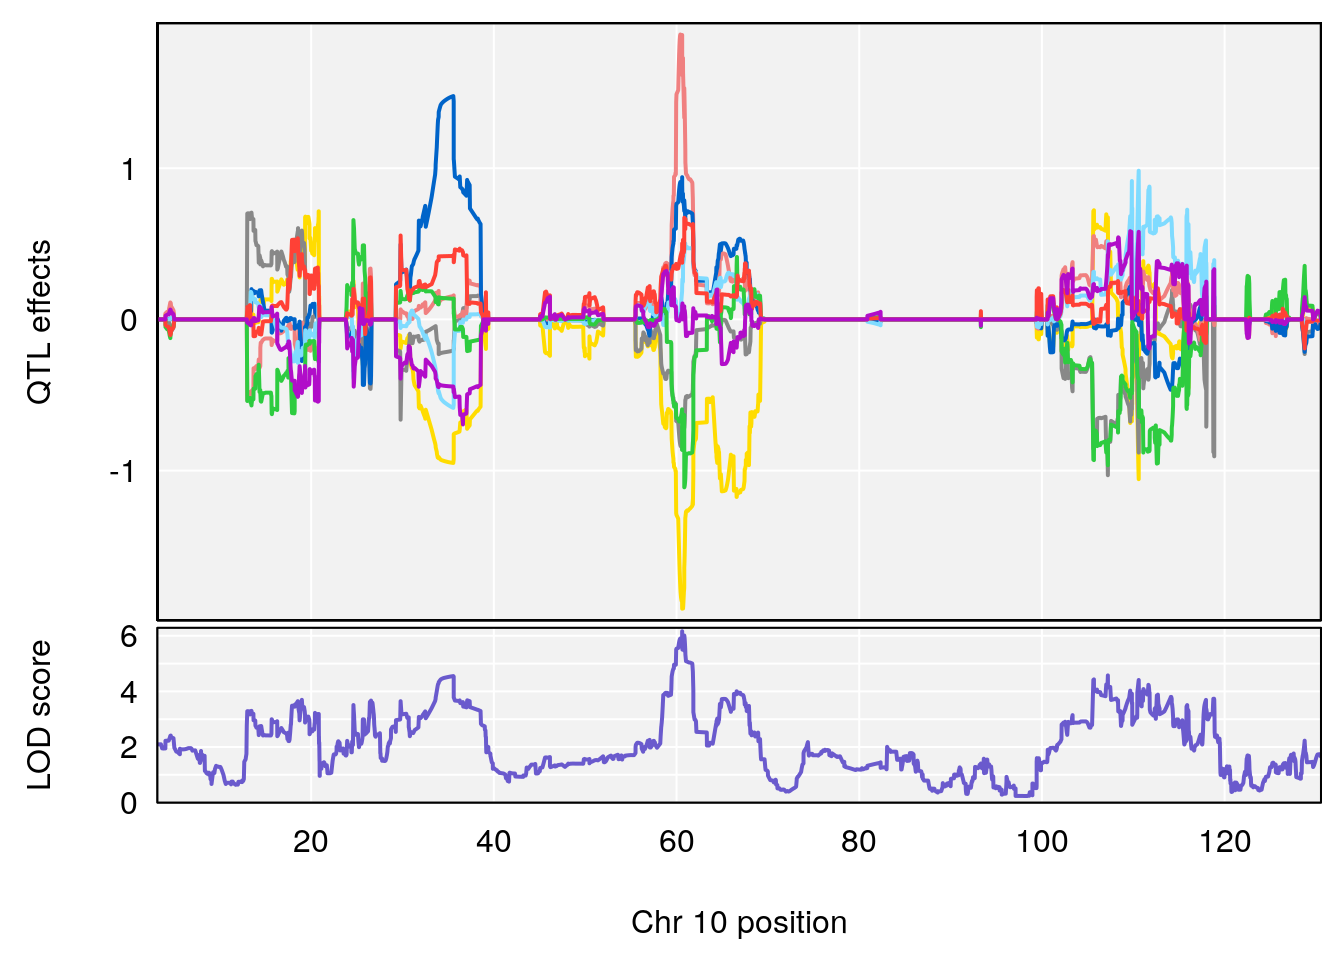
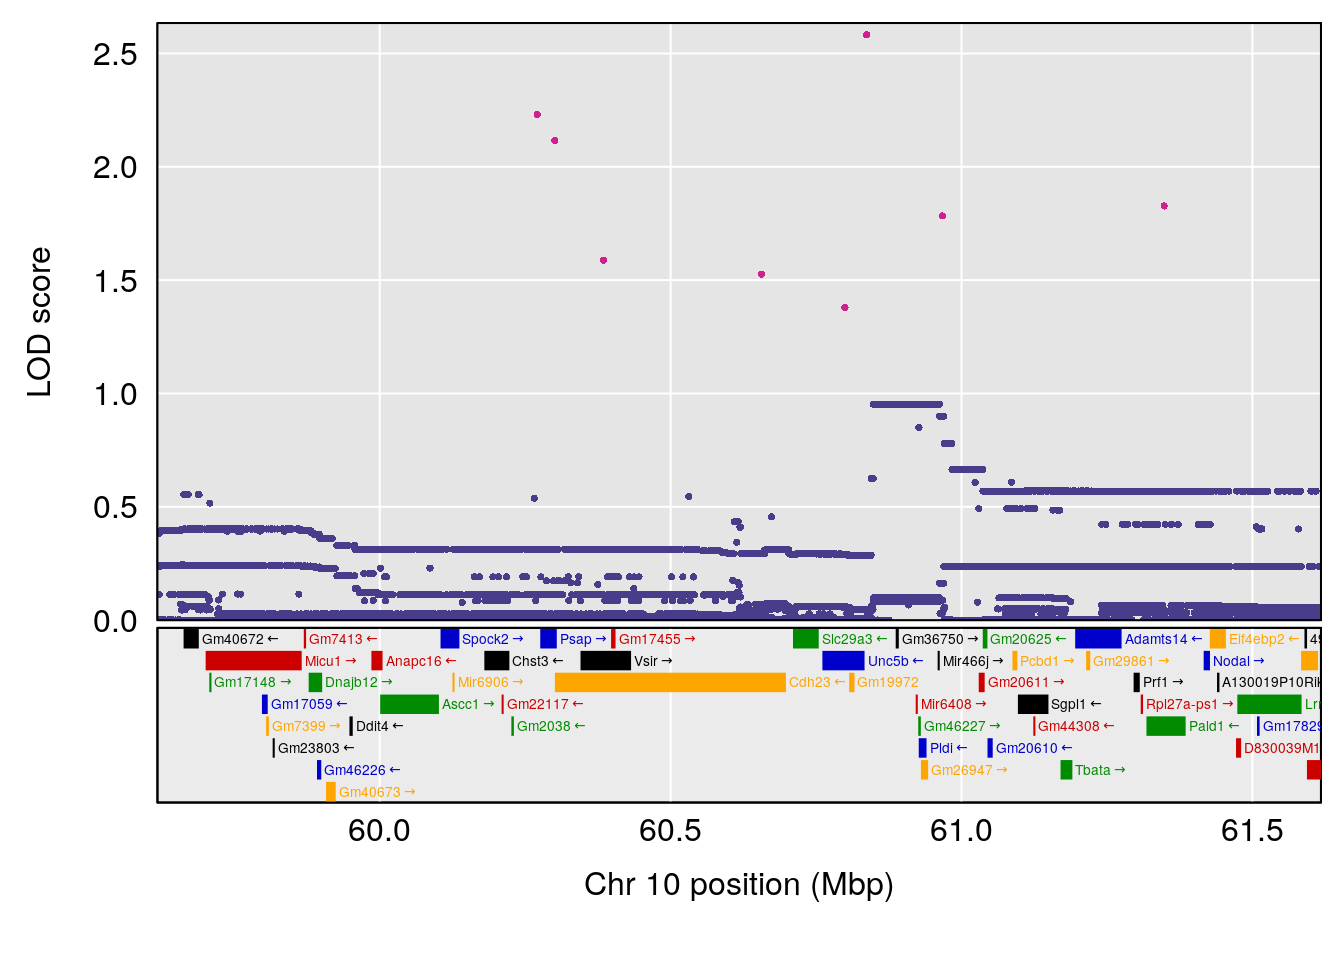
# 2 1 pheno1 10 42.02827 7.628133 41.66399 43.86722
# [1] 1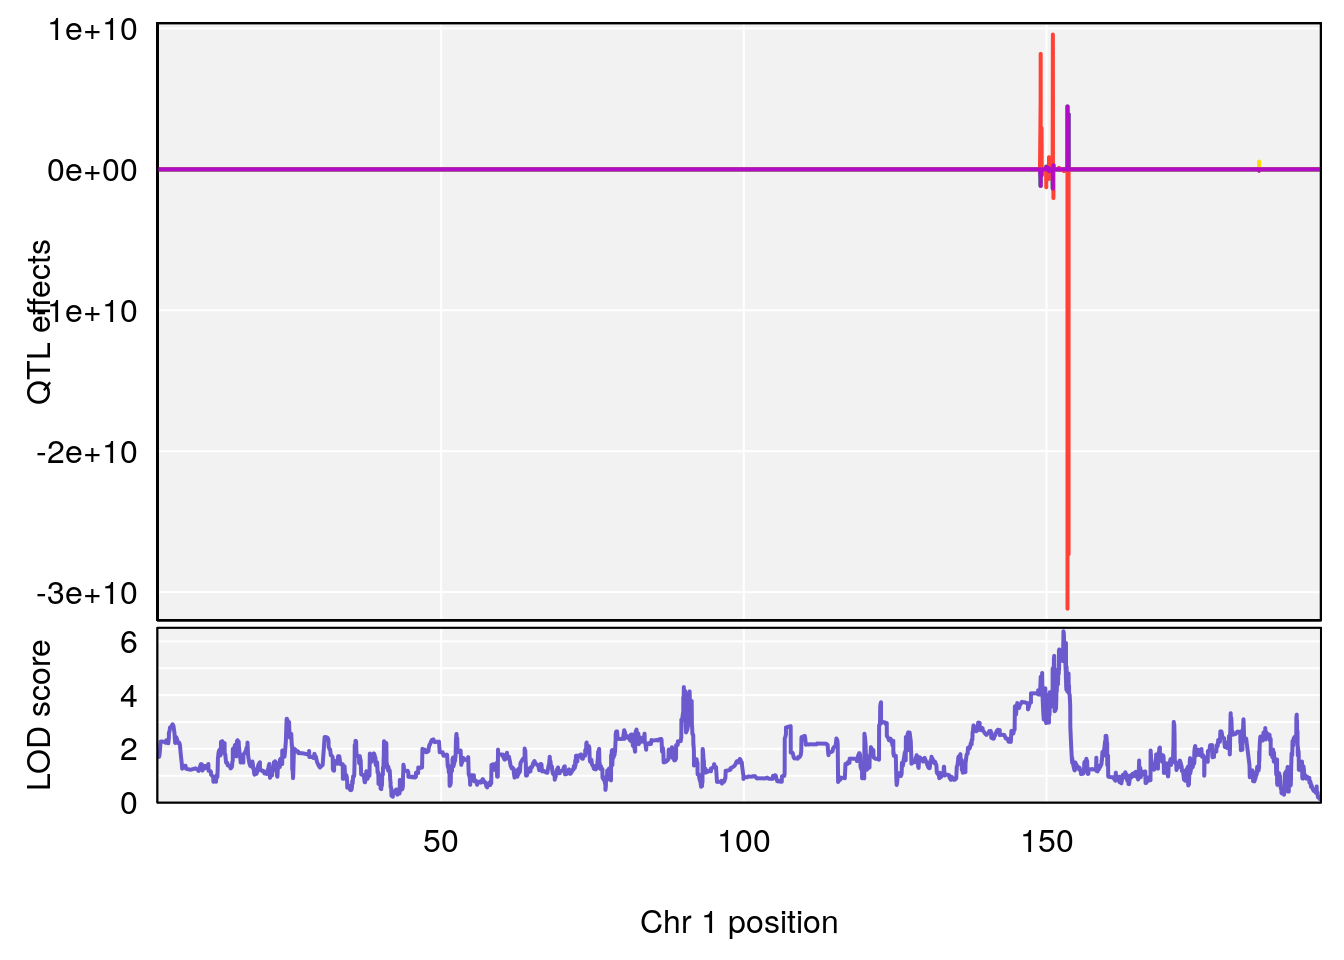
| Version | Author | Date |
|---|---|---|
| 0971ef2 | xhyuo | 2022-07-05 |
| Version | Author | Date |
|---|---|---|
| 0971ef2 | xhyuo | 2022-07-05 |
| Version | Author | Date |
|---|---|---|
| 0971ef2 | xhyuo | 2022-07-05 |
# [1] 2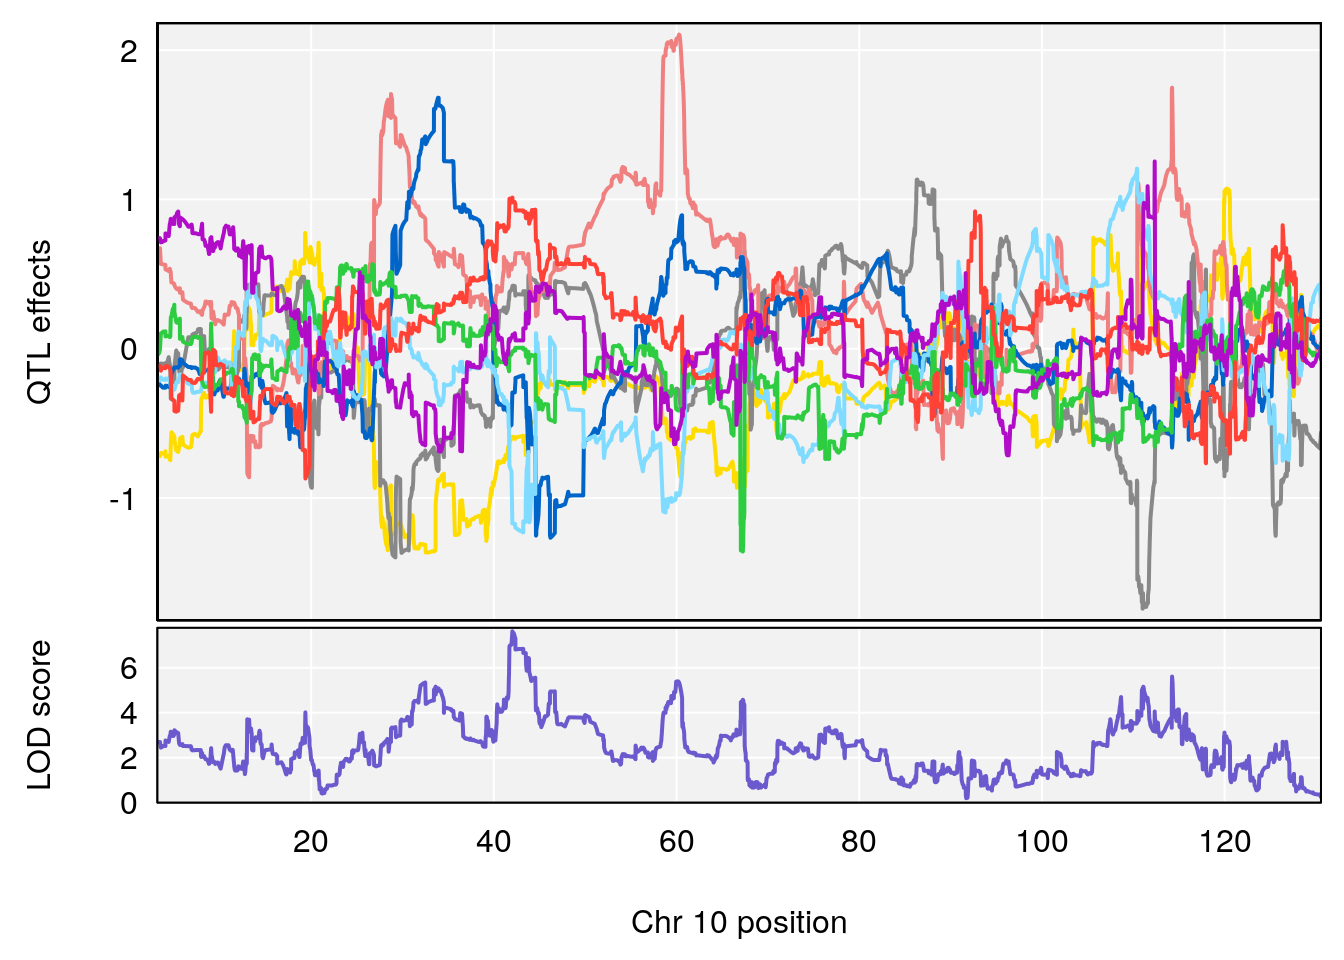
| Version | Author | Date |
|---|---|---|
| 0971ef2 | xhyuo | 2022-07-05 |
| Version | Author | Date |
|---|---|---|
| 0971ef2 | xhyuo | 2022-07-05 |
| Version | Author | Date |
|---|---|---|
| 0971ef2 | xhyuo | 2022-07-05 |
# [1] "Time.to.Threshold.Recovery.Hr"
# [1] "Time.to.Projected.Recovery.Hr"
# lodindex lodcolumn chr pos lod ci_lo ci_hi
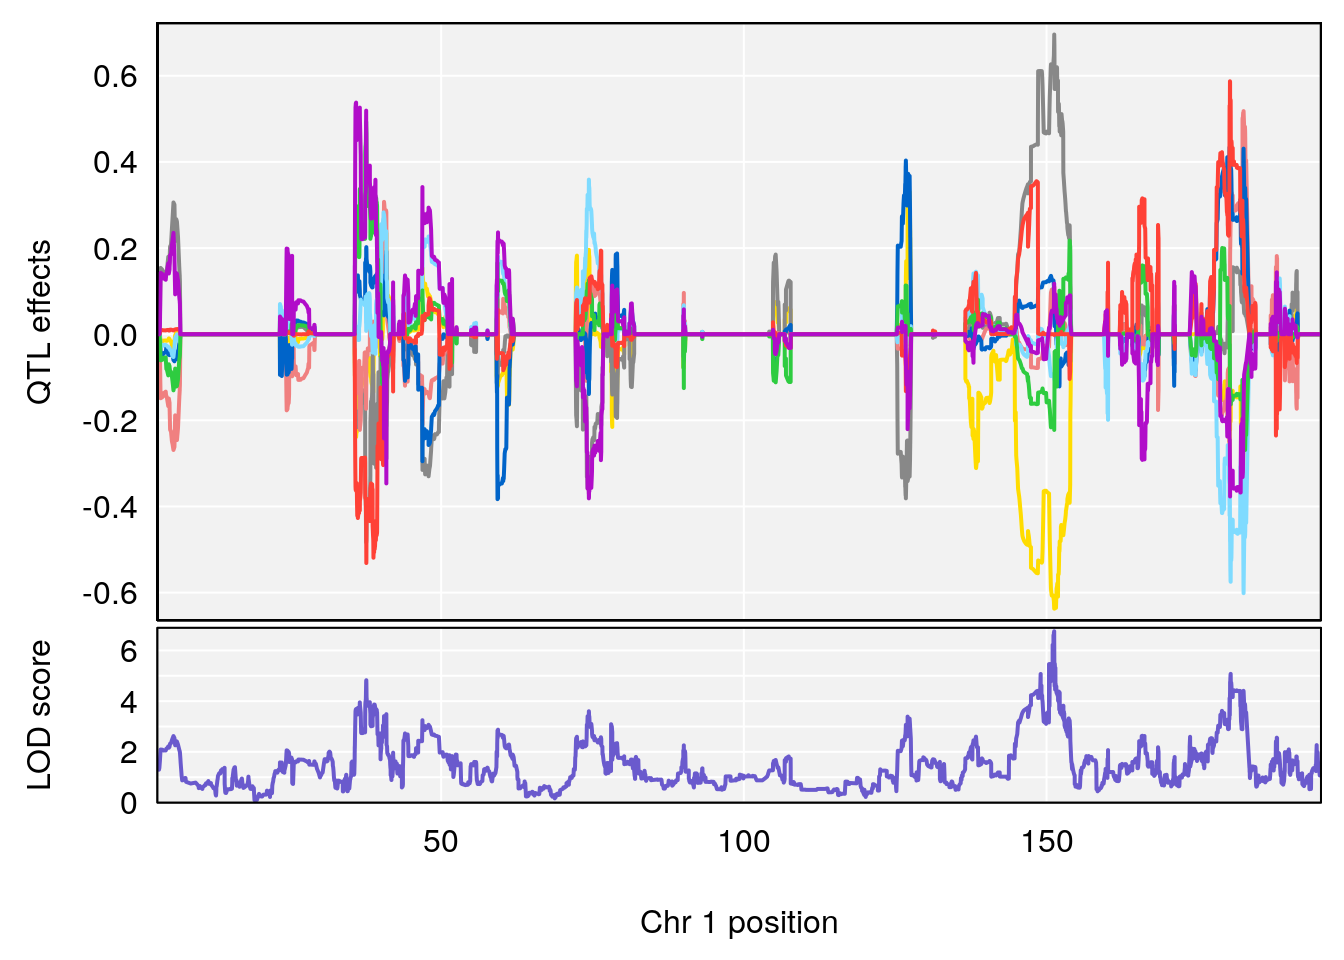
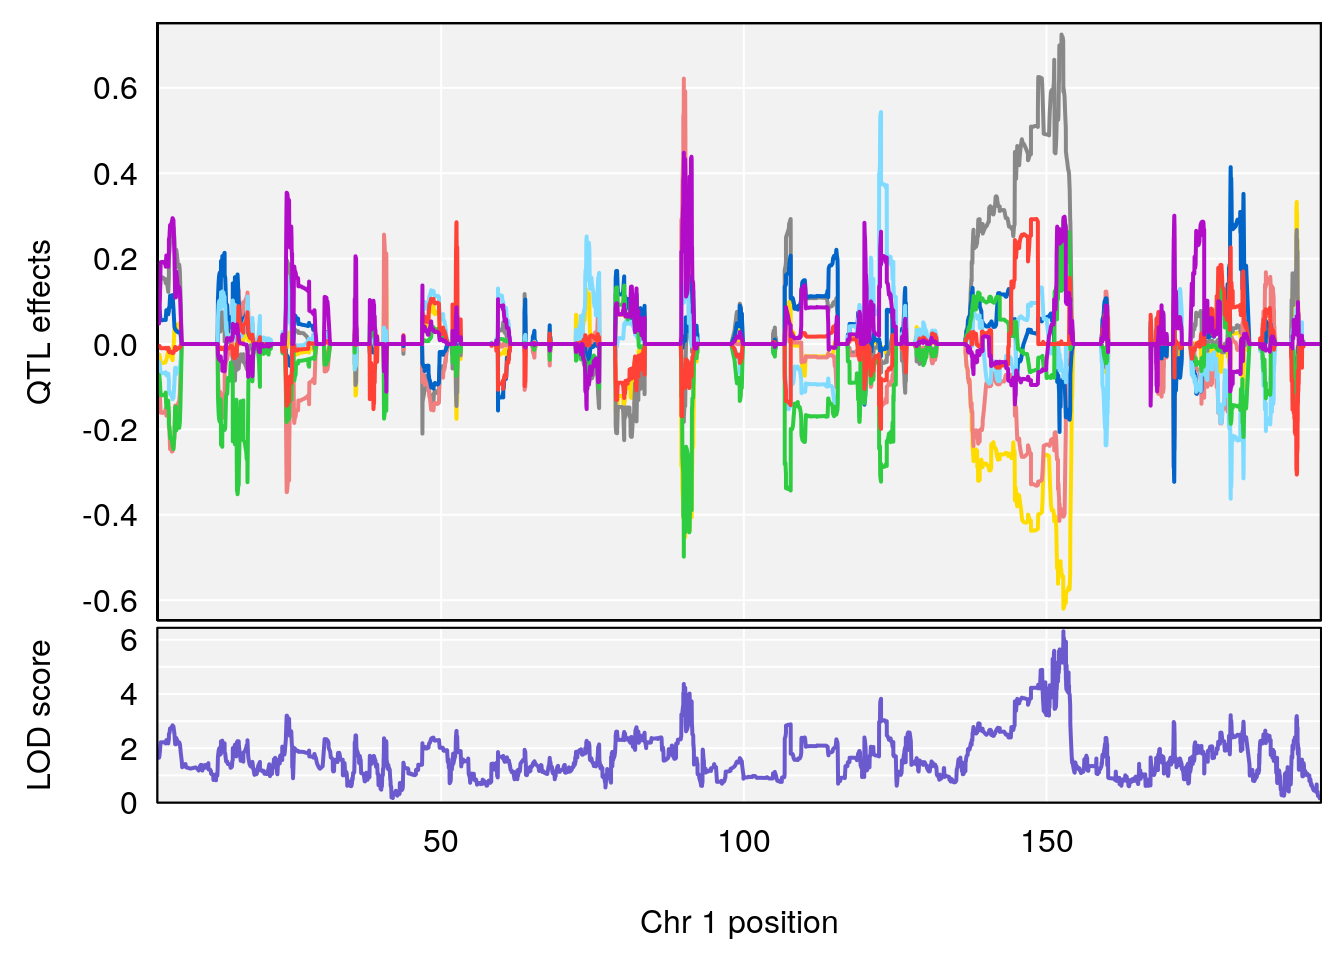
# 1 1 pheno1 1 151.2661 6.756996 150.4074 151.4769
# [1] 1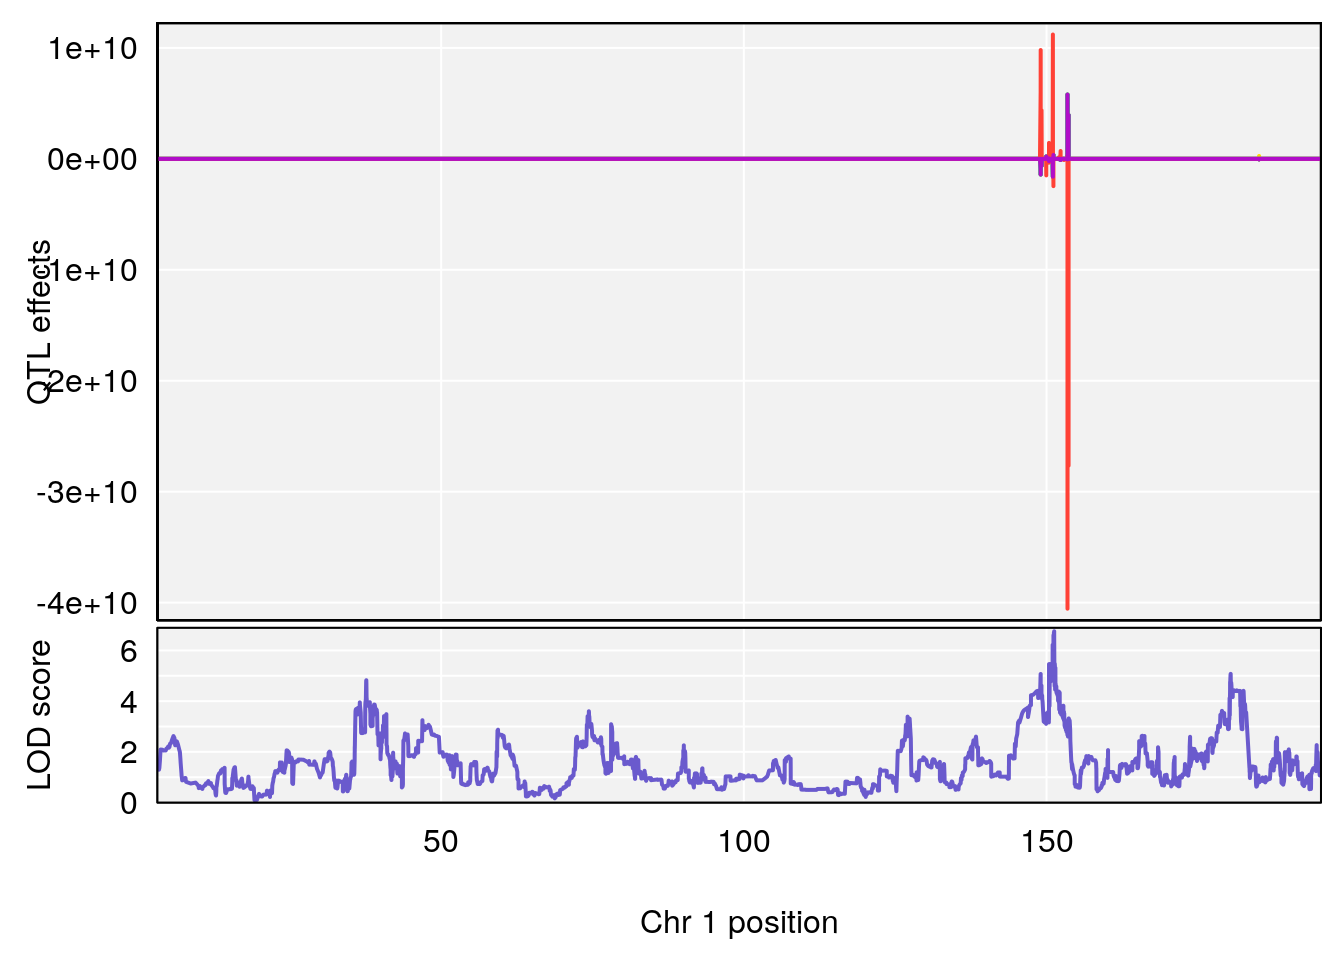
| Version | Author | Date |
|---|---|---|
| 0971ef2 | xhyuo | 2022-07-05 |
| Version | Author | Date |
|---|---|---|
| 0971ef2 | xhyuo | 2022-07-05 |
| Version | Author | Date |
|---|---|---|
| 0971ef2 | xhyuo | 2022-07-05 |
# [1] "Start.of.Recovery.Hr"
#   lodindex lodcolumn chr       pos      lod     ci_lo     ci_hi
# 1        1    pheno1   1 152.78955 6.310882 149.02638 153.36692
# 2        1    pheno1  10  42.16135 7.694886  41.66399  43.86722
# 3        1    pheno1  15  93.60493 6.059735  88.73612  93.88737
# [1] 1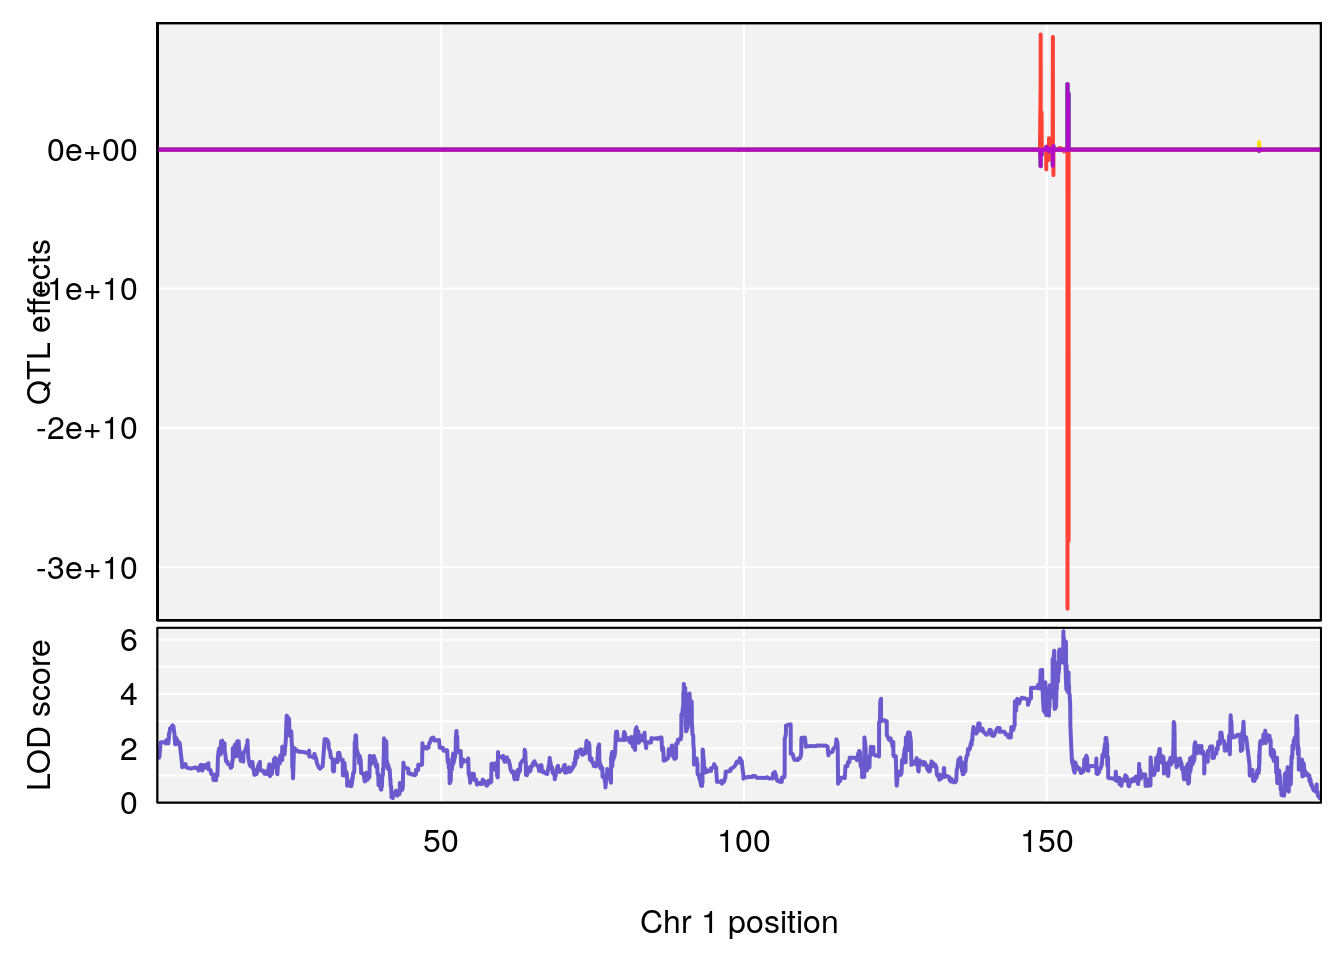
| Version | Author | Date |
|---|---|---|
| 0971ef2 | xhyuo | 2022-07-05 |
| Version | Author | Date |
|---|---|---|
| 0971ef2 | xhyuo | 2022-07-05 |
| Version | Author | Date |
|---|---|---|
| 0971ef2 | xhyuo | 2022-07-05 |
# [1] 2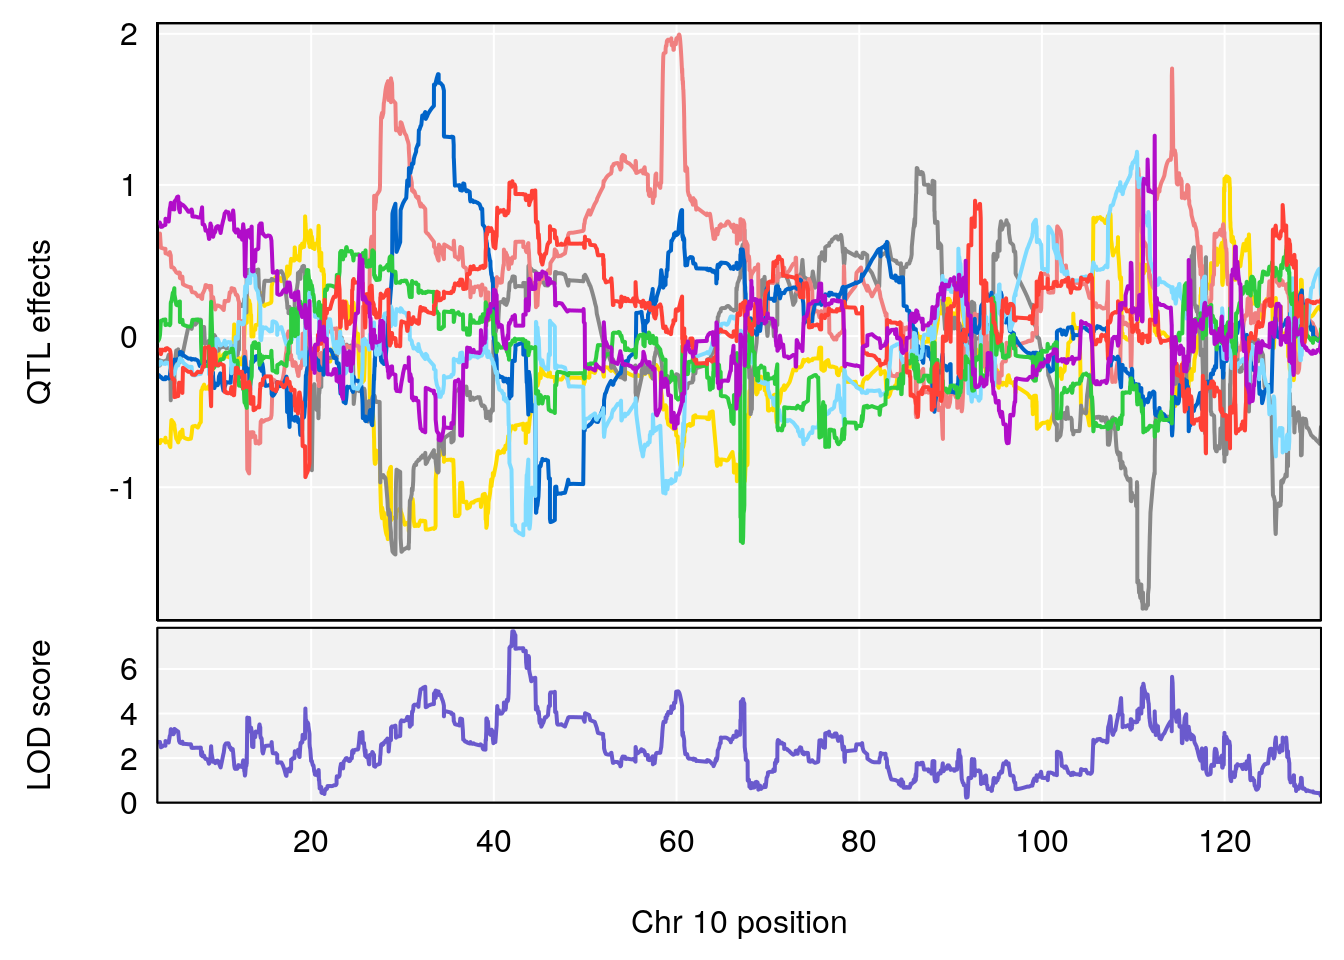
| Version | Author | Date |
|---|---|---|
| 0971ef2 | xhyuo | 2022-07-05 |
| Version | Author | Date |
|---|---|---|
| 0971ef2 | xhyuo | 2022-07-05 |
| Version | Author | Date |
|---|---|---|
| 0971ef2 | xhyuo | 2022-07-05 |
# [1] 3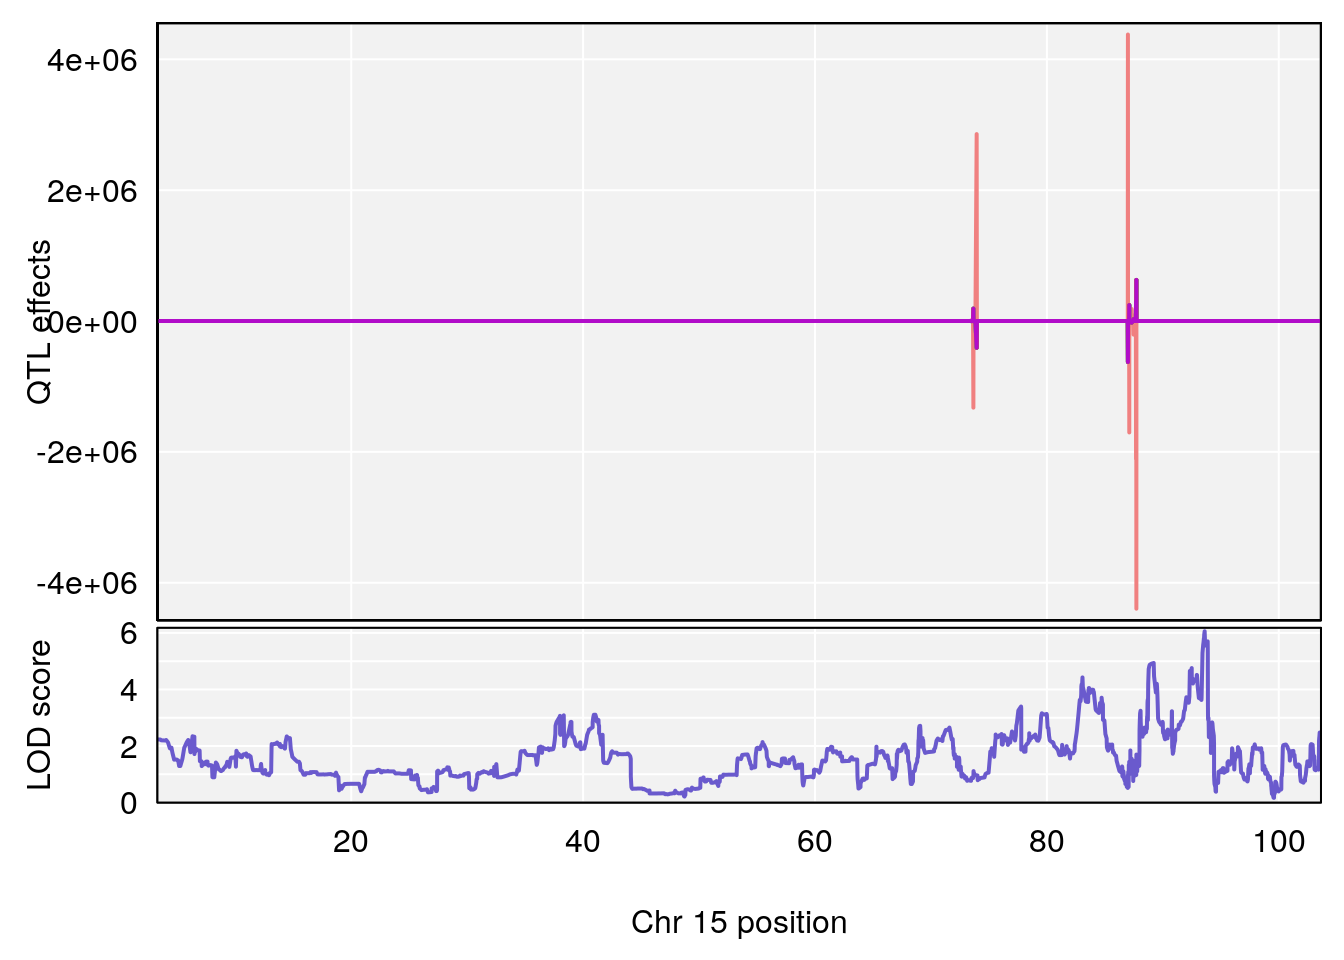
| Version | Author | Date |
|---|---|---|
| 0971ef2 | xhyuo | 2022-07-05 |
| Version | Author | Date |
|---|---|---|
| 0971ef2 | xhyuo | 2022-07-05 |
| Version | Author | Date |
|---|---|---|
| 0971ef2 | xhyuo | 2022-07-05 |
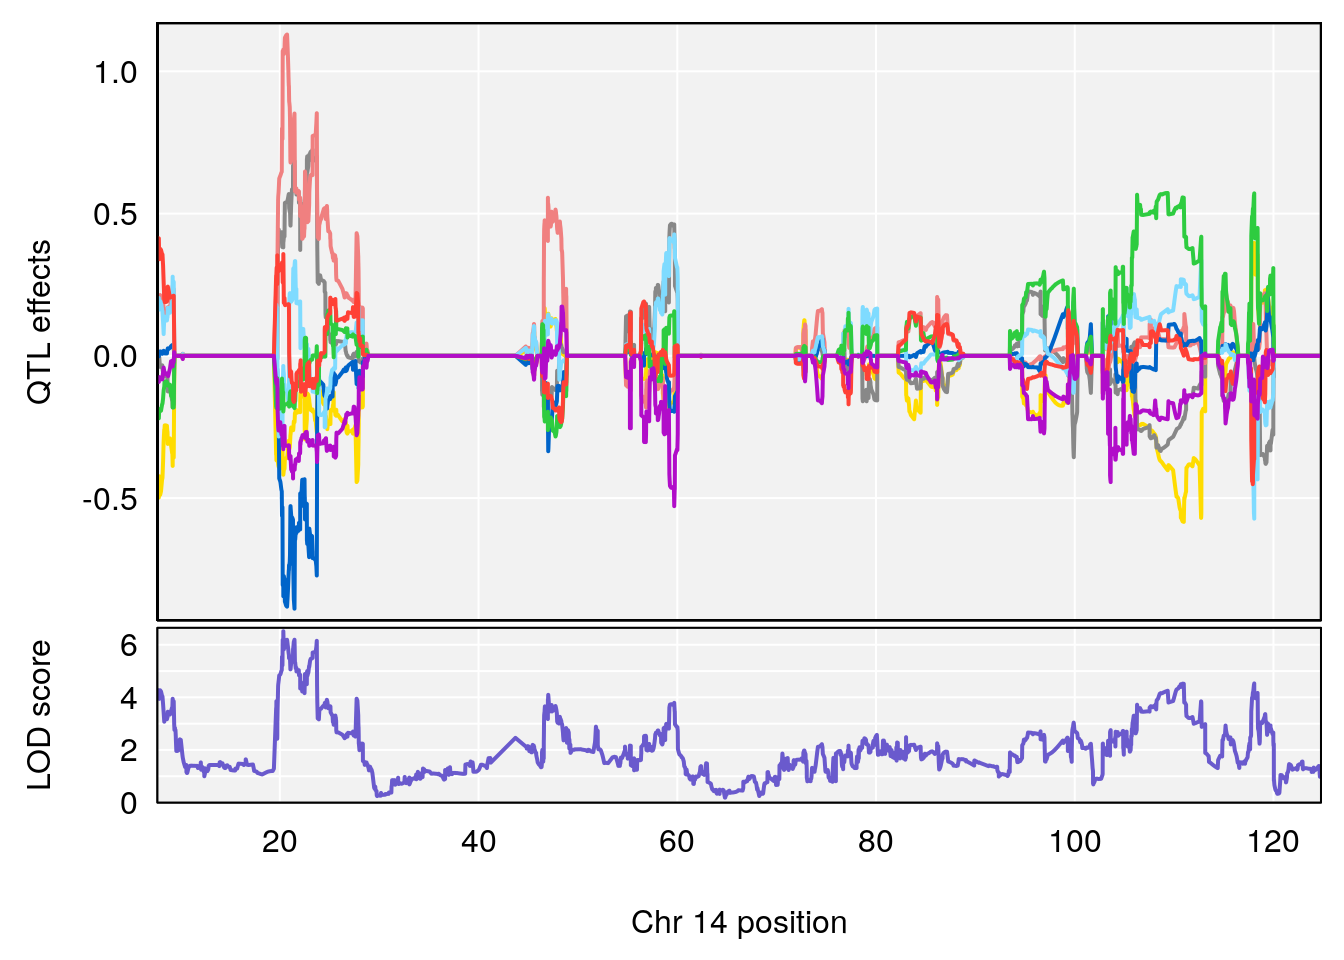
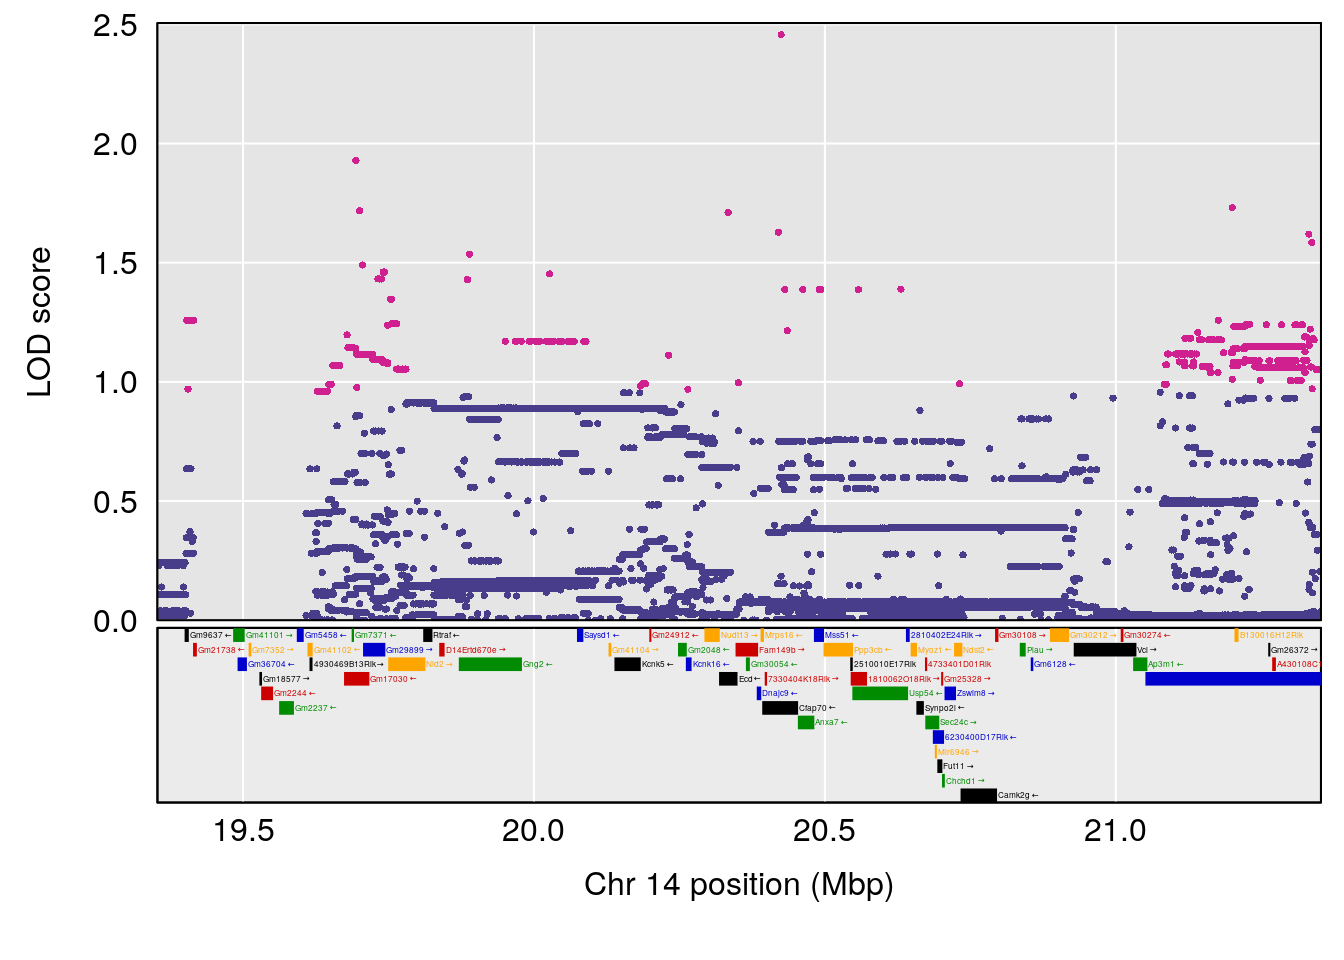
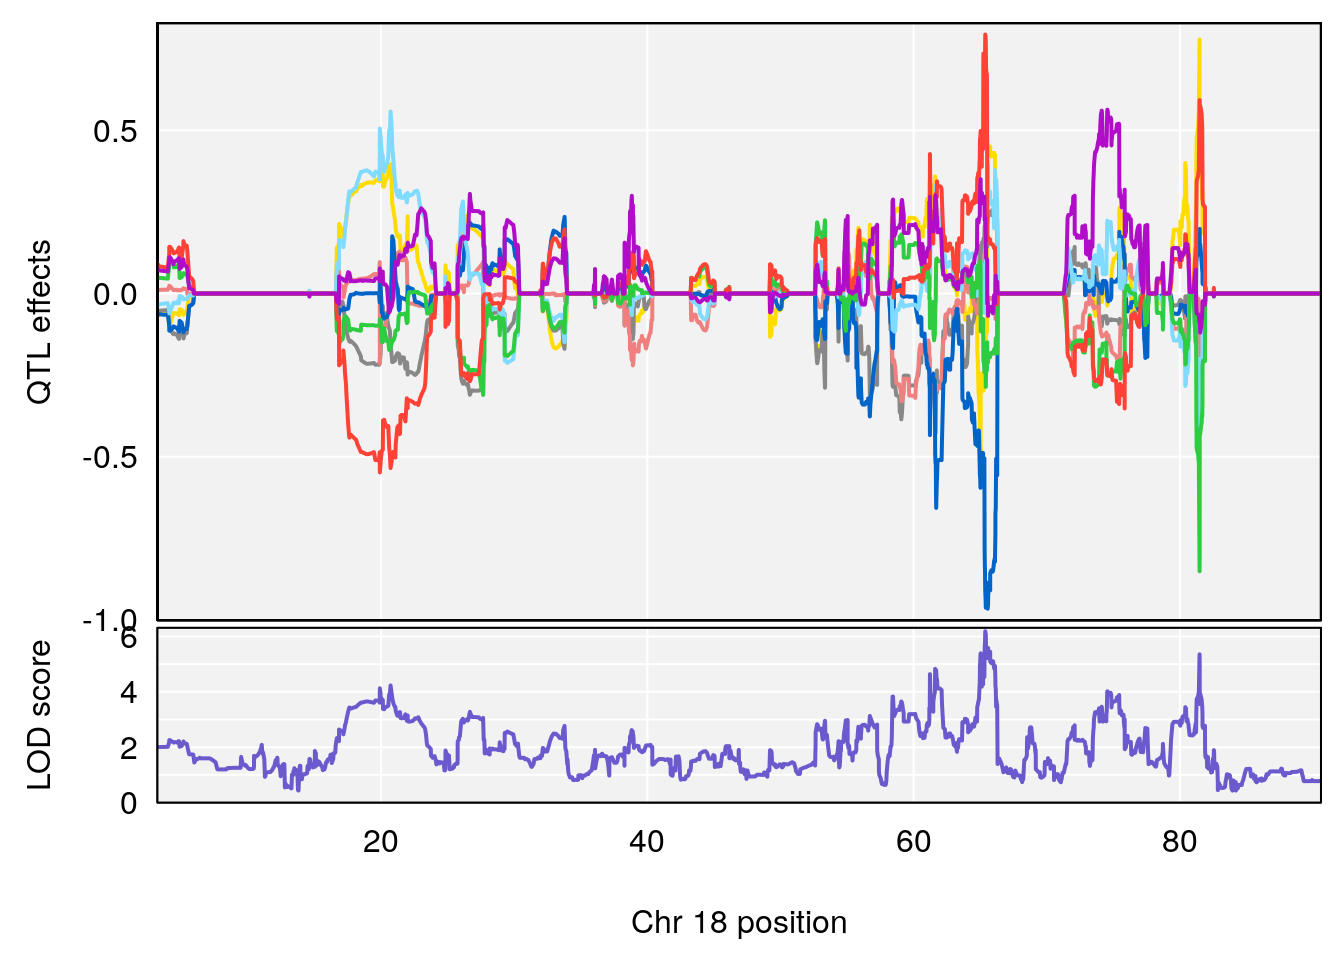
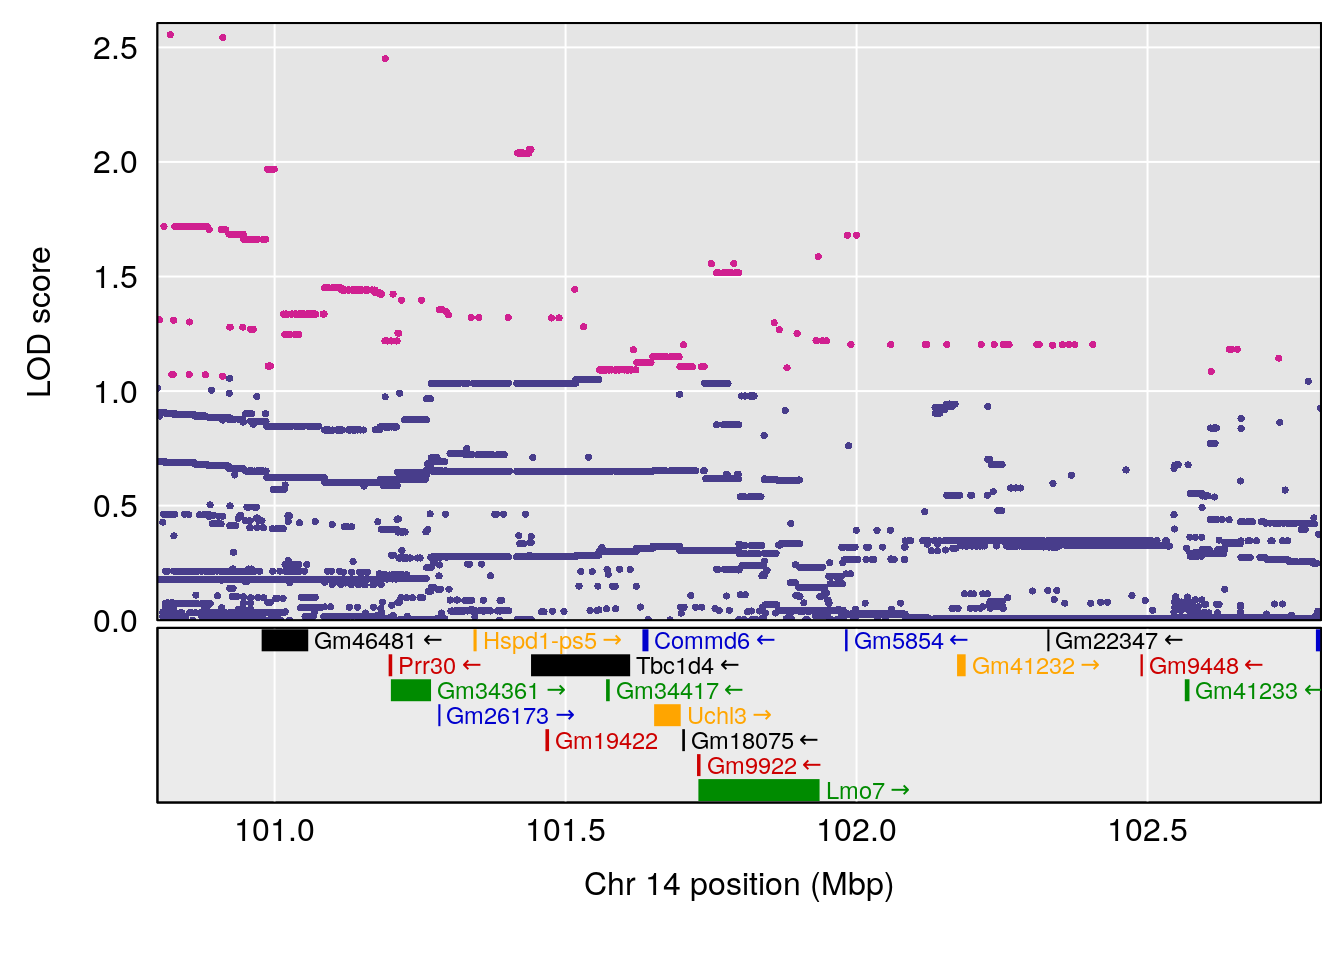
# [1] "RR.Recovery.Rate.Hr"
#   lodindex lodcolumn chr      pos      lod    ci_lo    ci_hi
# 1        1    pheno1  14 20.35257 6.513019 20.15234 23.74698
# 2        1    pheno1  18 65.37854 6.187039 61.59291 81.48908
# [1] 1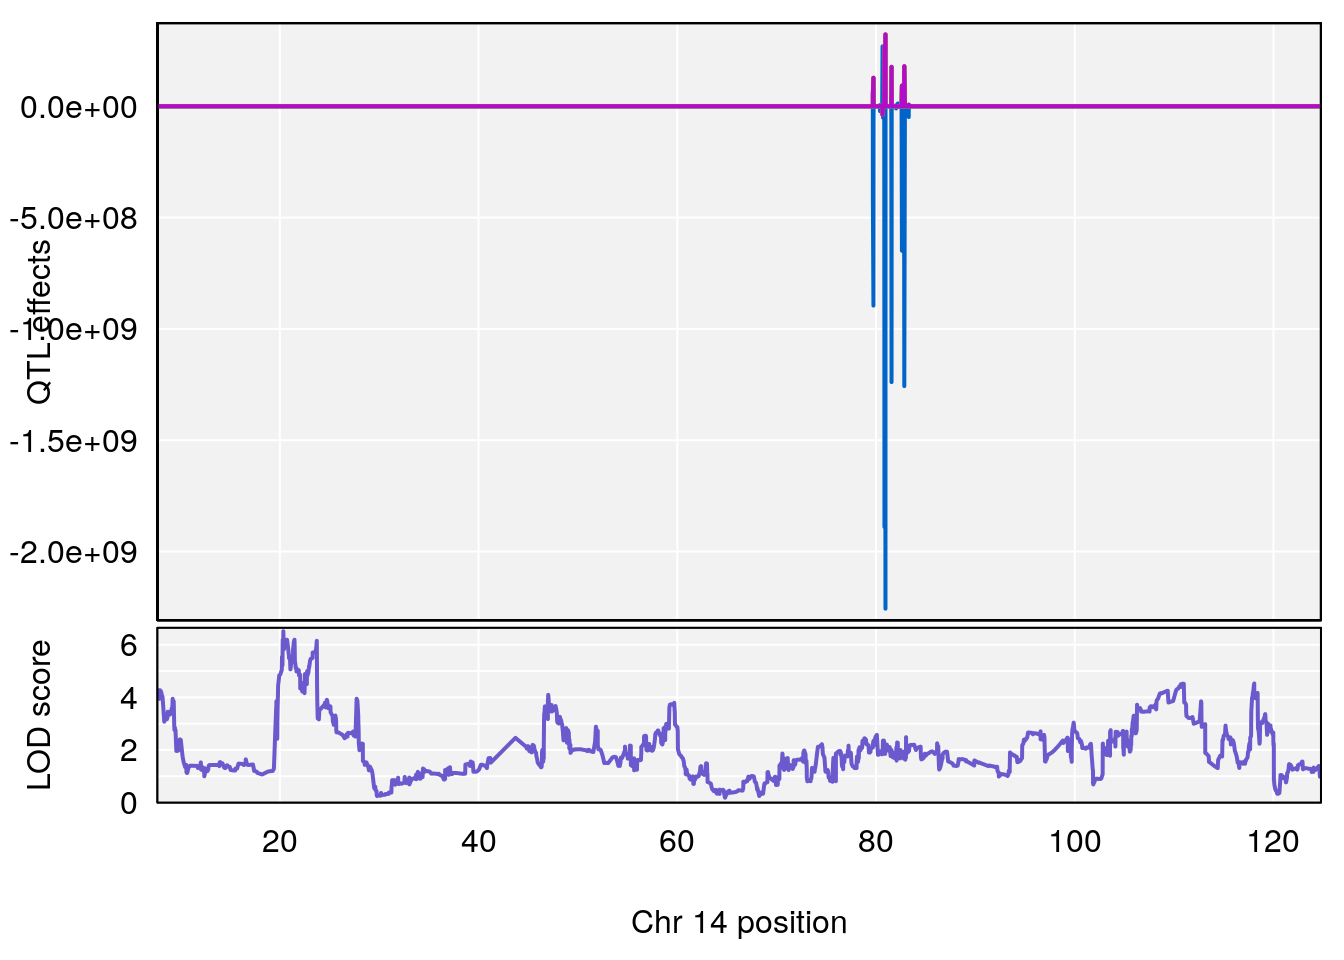
| Version | Author | Date |
|---|---|---|
| 0971ef2 | xhyuo | 2022-07-05 |
| Version | Author | Date |
|---|---|---|
| 0971ef2 | xhyuo | 2022-07-05 |
| Version | Author | Date |
|---|---|---|
| 0971ef2 | xhyuo | 2022-07-05 |
# [1] 2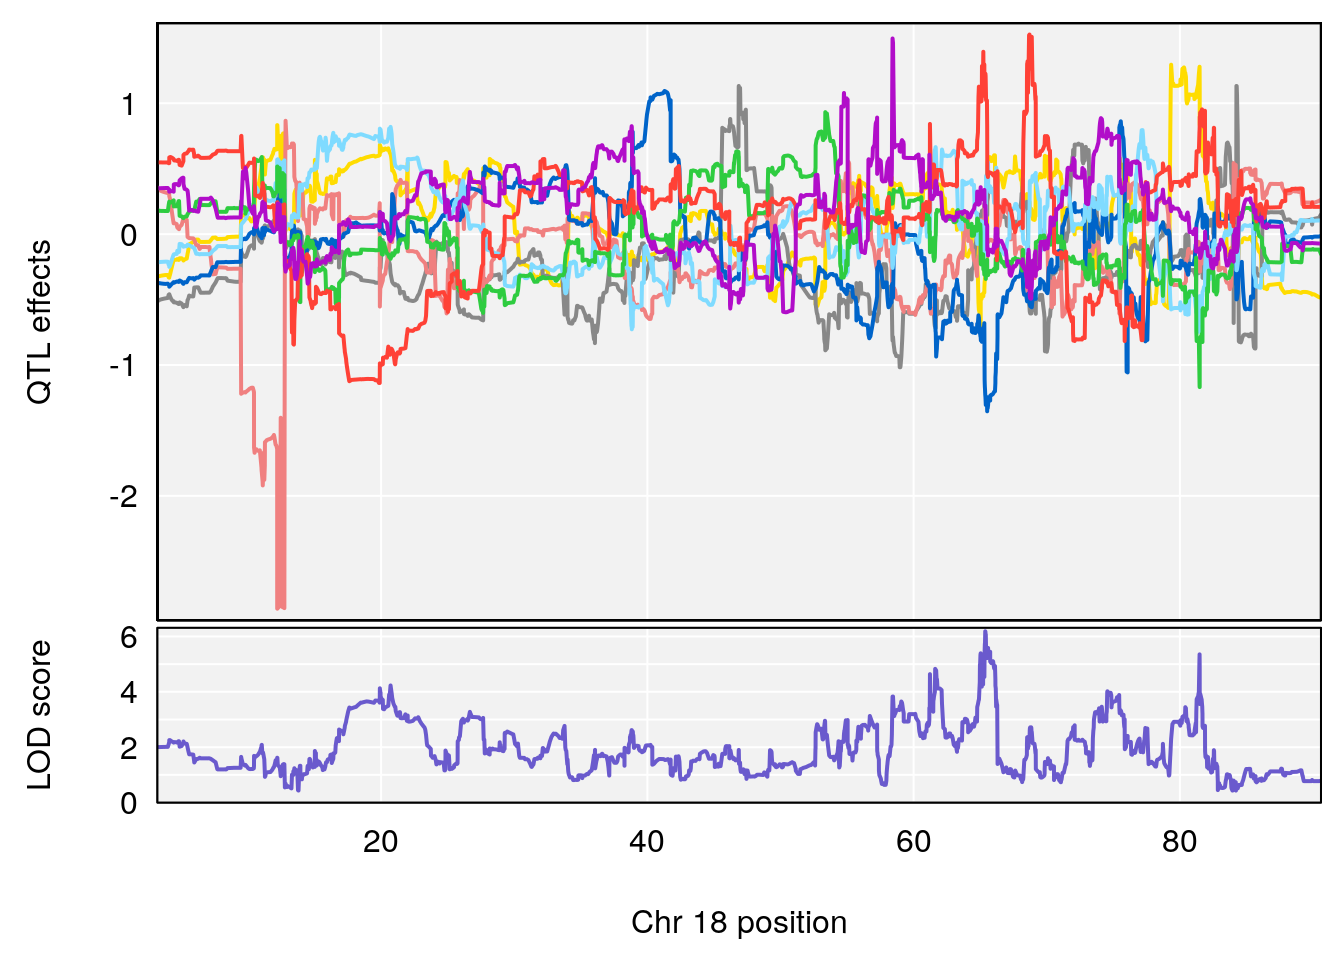
| Version | Author | Date |
|---|---|---|
| 0971ef2 | xhyuo | 2022-07-05 |
| Version | Author | Date |
|---|---|---|
| 0971ef2 | xhyuo | 2022-07-05 |
| Version | Author | Date |
|---|---|---|
| 0971ef2 | xhyuo | 2022-07-05 |
# [1] "Min.Depression.BR"
#   lodindex lodcolumn chr      pos      lod    ci_lo    ci_hi
# 1        1    pheno1   9 103.0304 6.065324 38.64793 103.0599
# [1] 1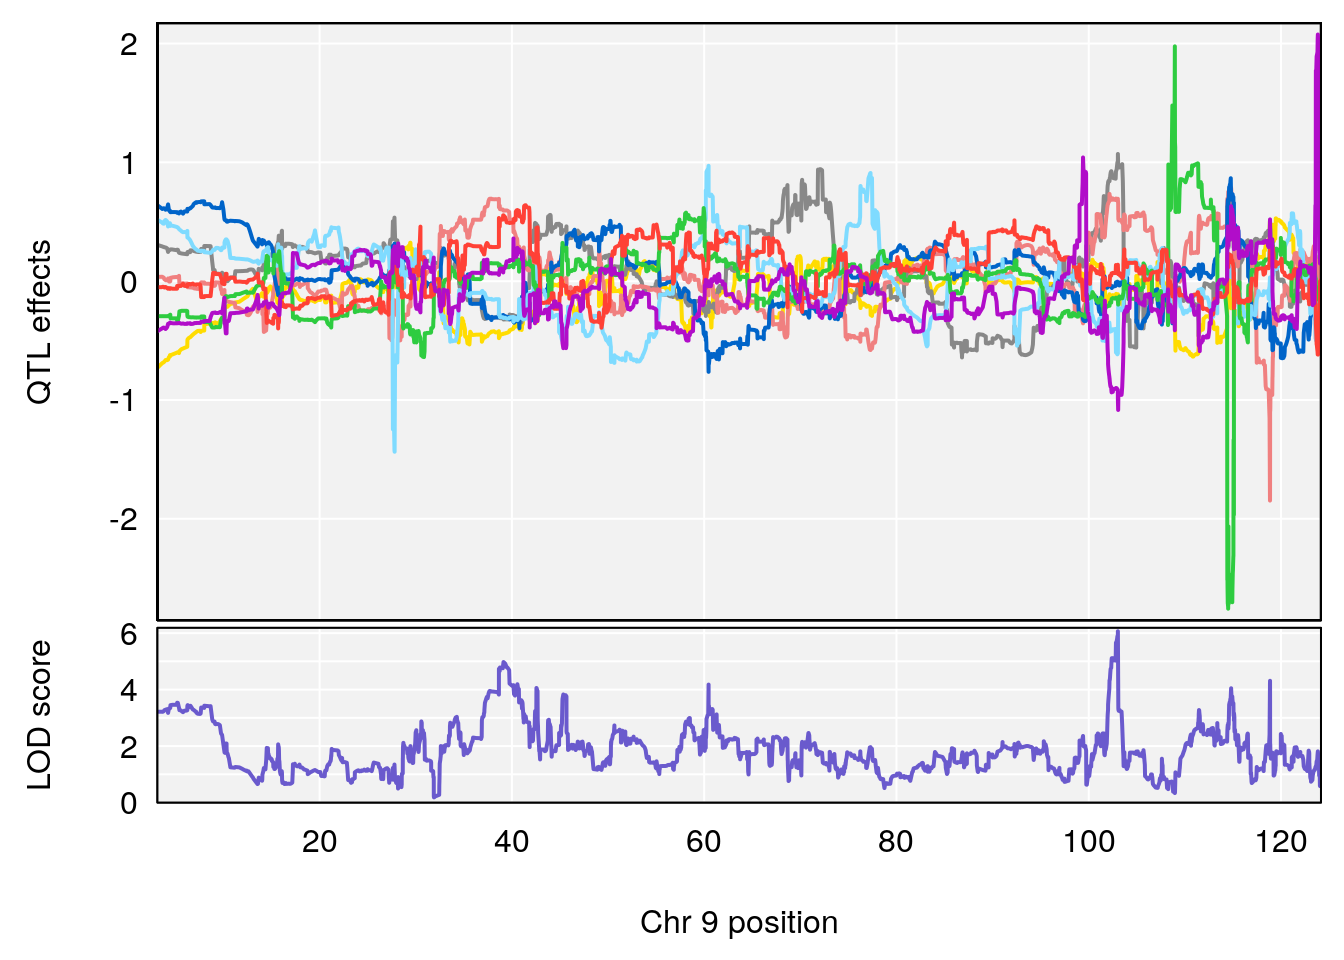
| Version | Author | Date |
|---|---|---|
| 0971ef2 | xhyuo | 2022-07-05 |
| Version | Author | Date |
|---|---|---|
| 0971ef2 | xhyuo | 2022-07-05 |
| Version | Author | Date |
|---|---|---|
| 0971ef2 | xhyuo | 2022-07-05 |
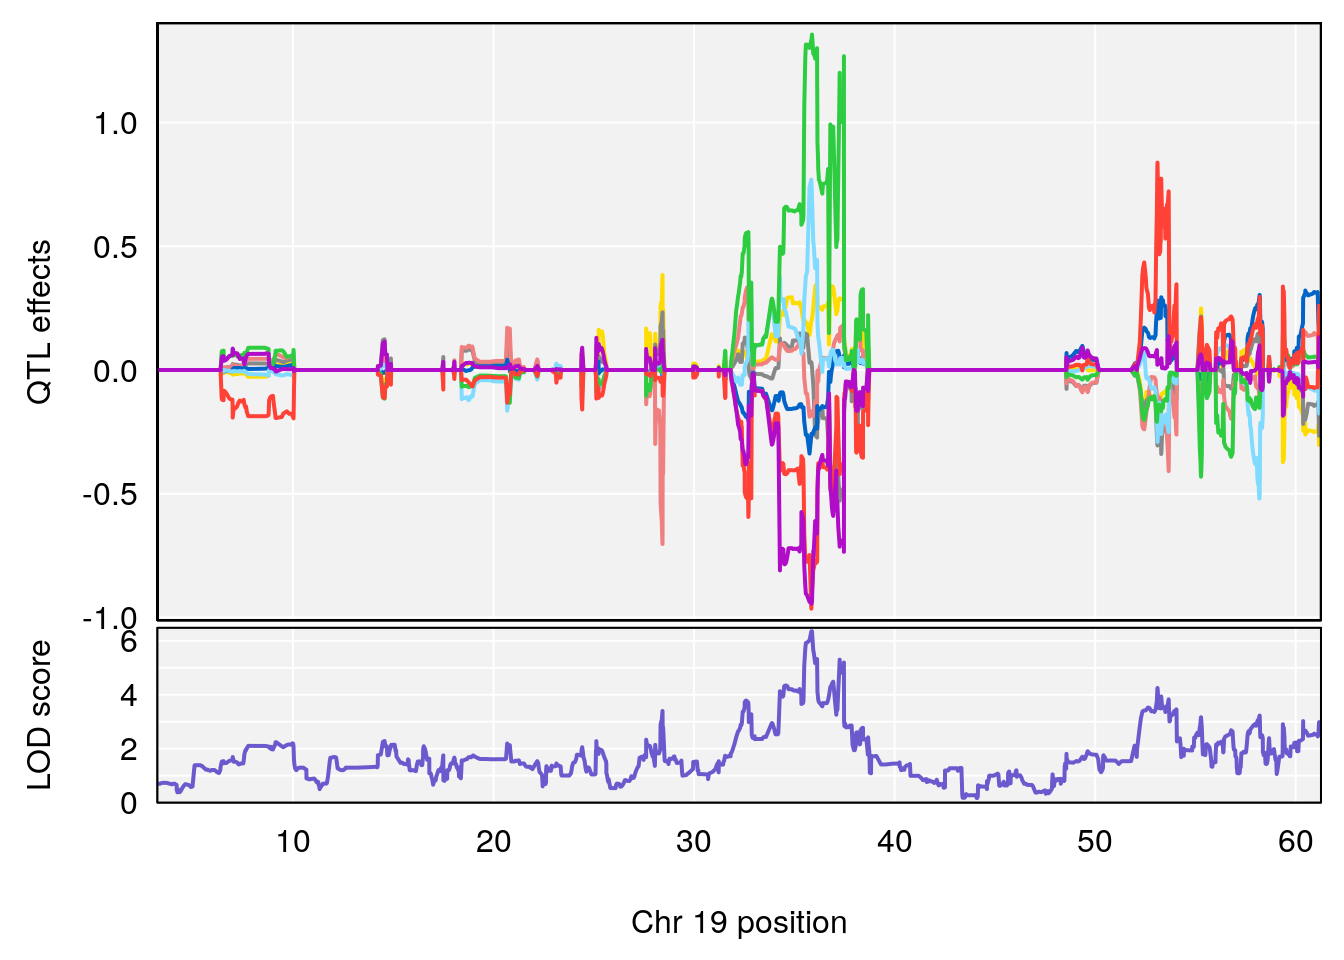
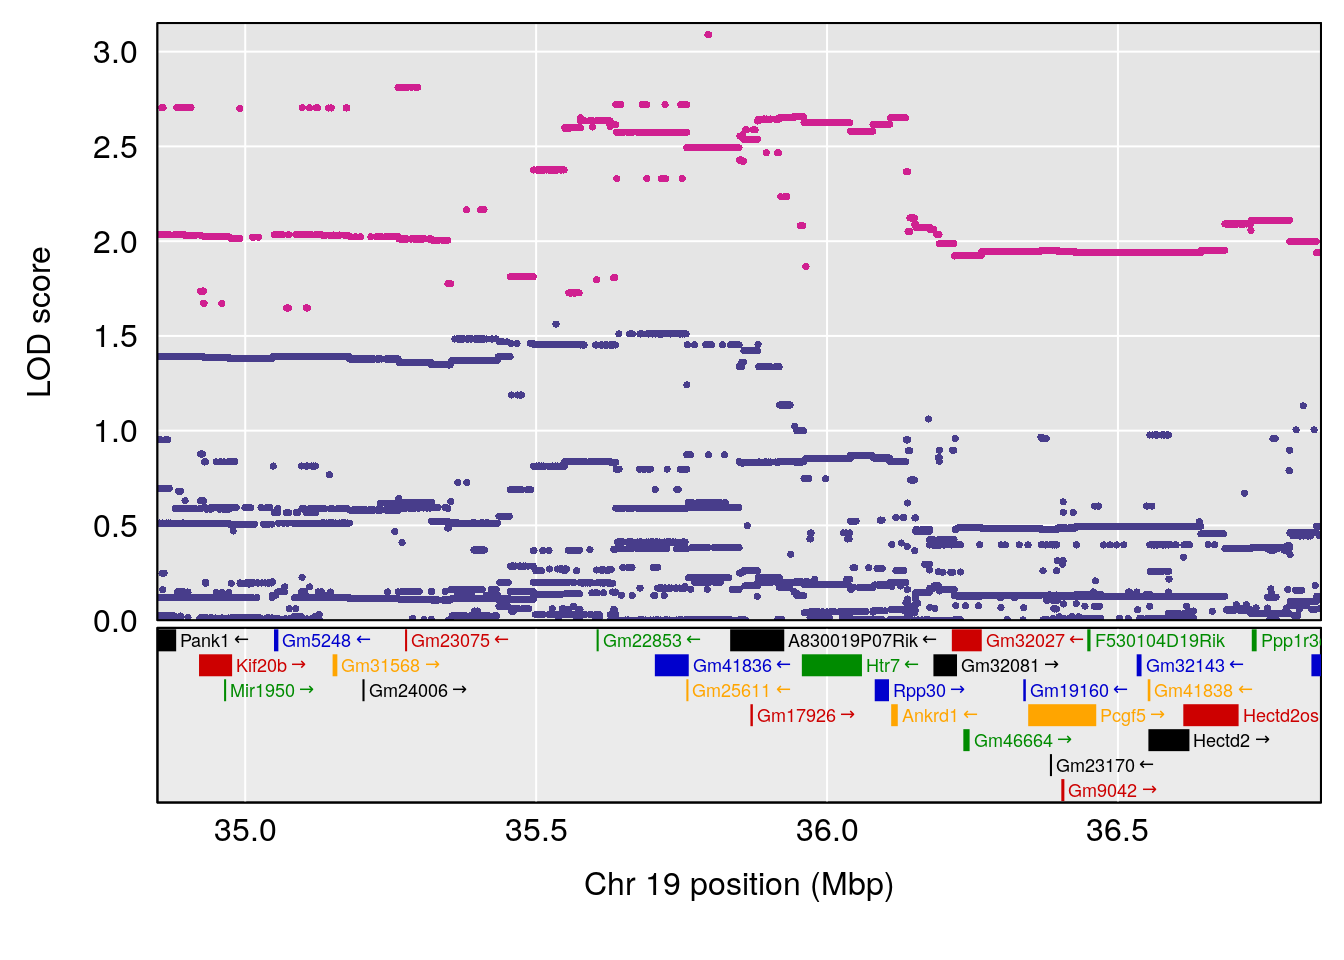
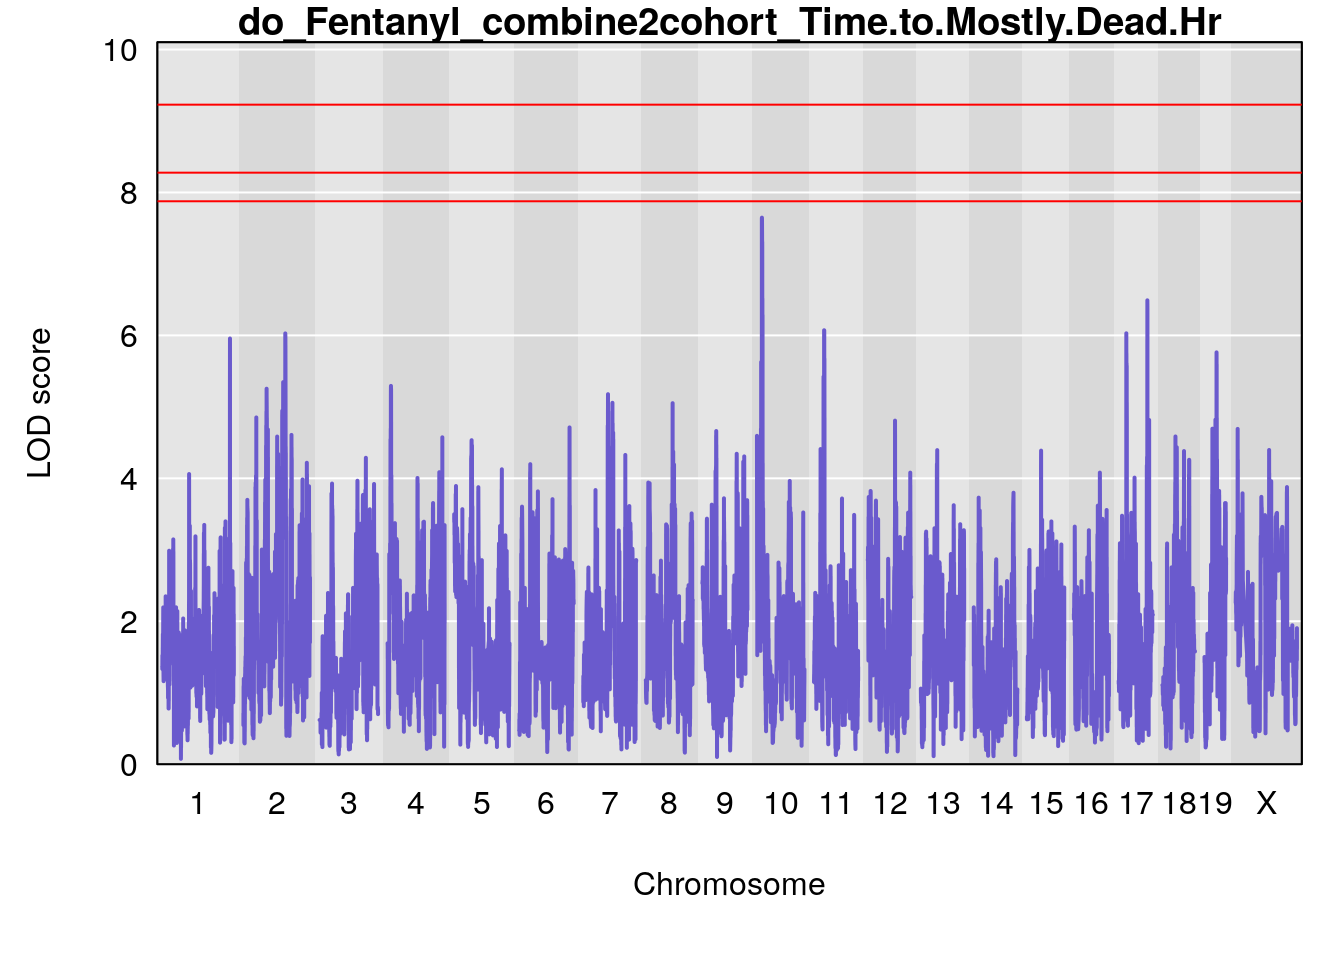
# [1] "Time.to.Mostly.Dead.Hr"
#   lodindex lodcolumn chr      pos      lod   ci_lo    ci_hi
# 1        1    pheno1  19 35.84901 6.359785 35.4551 37.47958
# [1] 1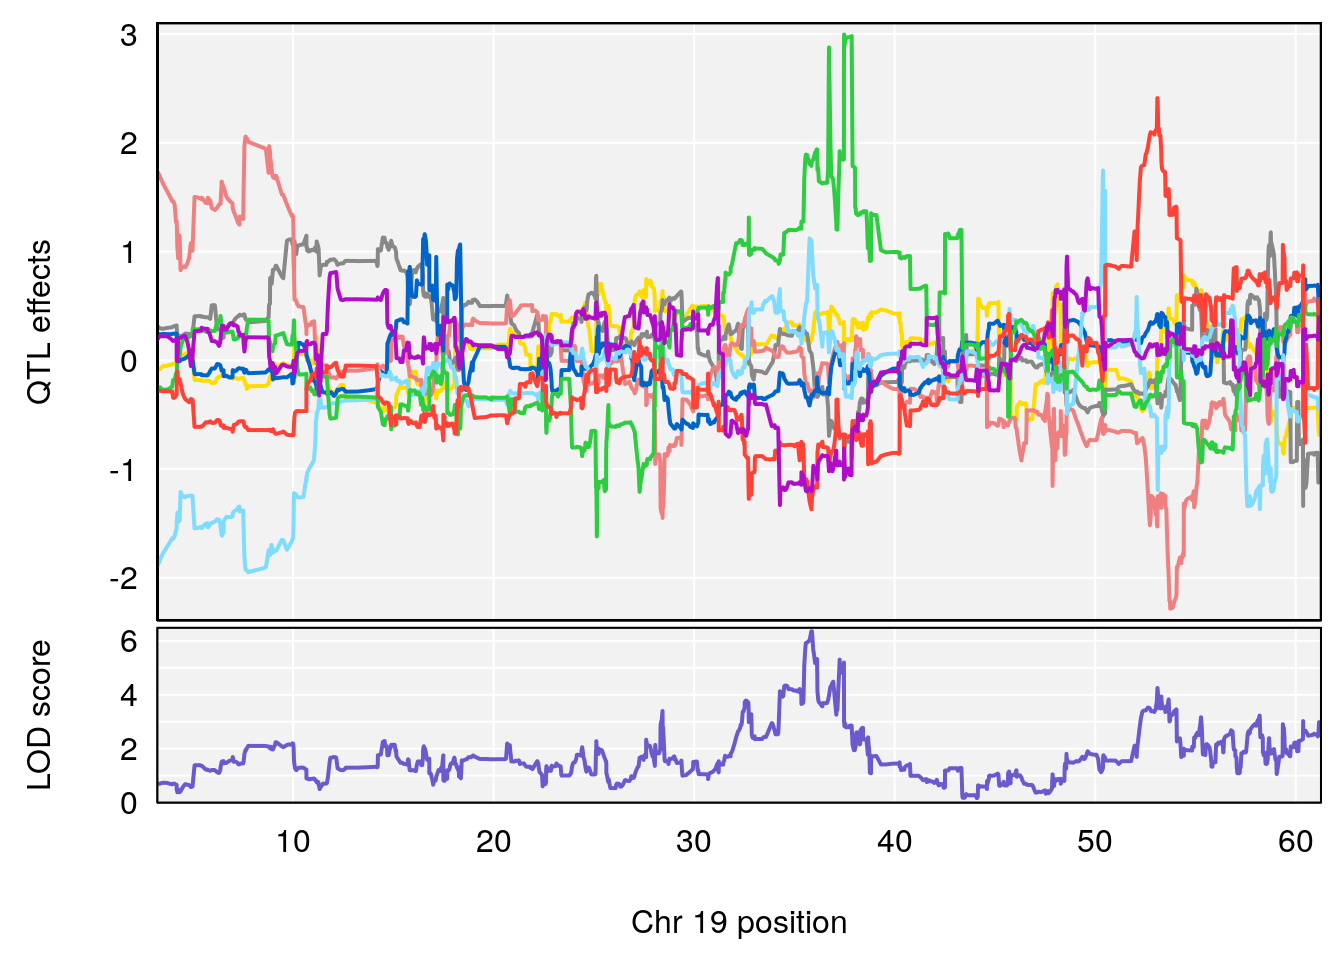
| Version | Author | Date |
|---|---|---|
| 0971ef2 | xhyuo | 2022-07-05 |
| Version | Author | Date |
|---|---|---|
| 0971ef2 | xhyuo | 2022-07-05 |
| Version | Author | Date |
|---|---|---|
| 0971ef2 | xhyuo | 2022-07-05 |
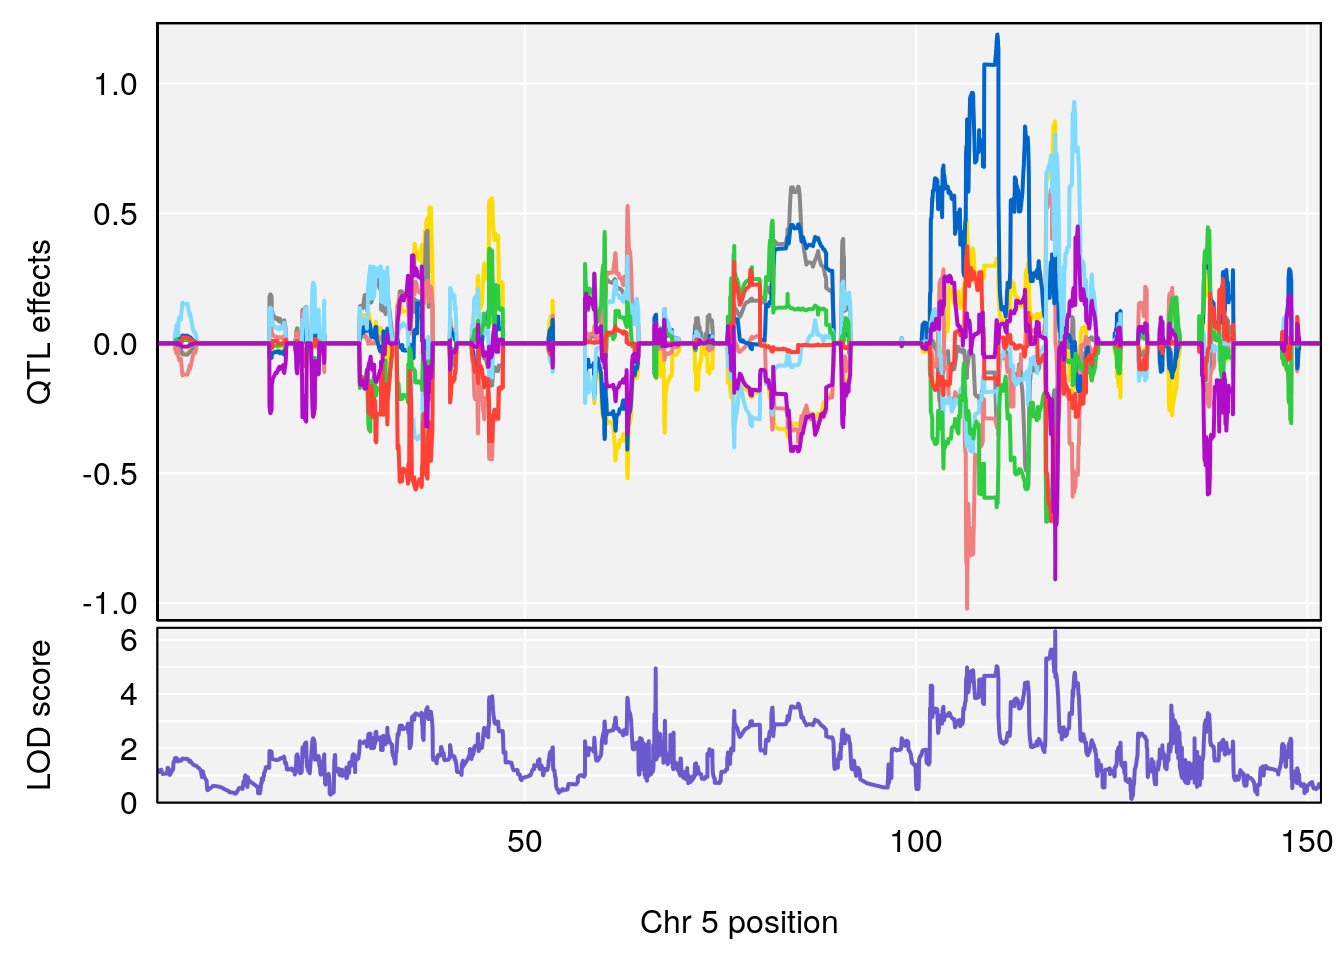
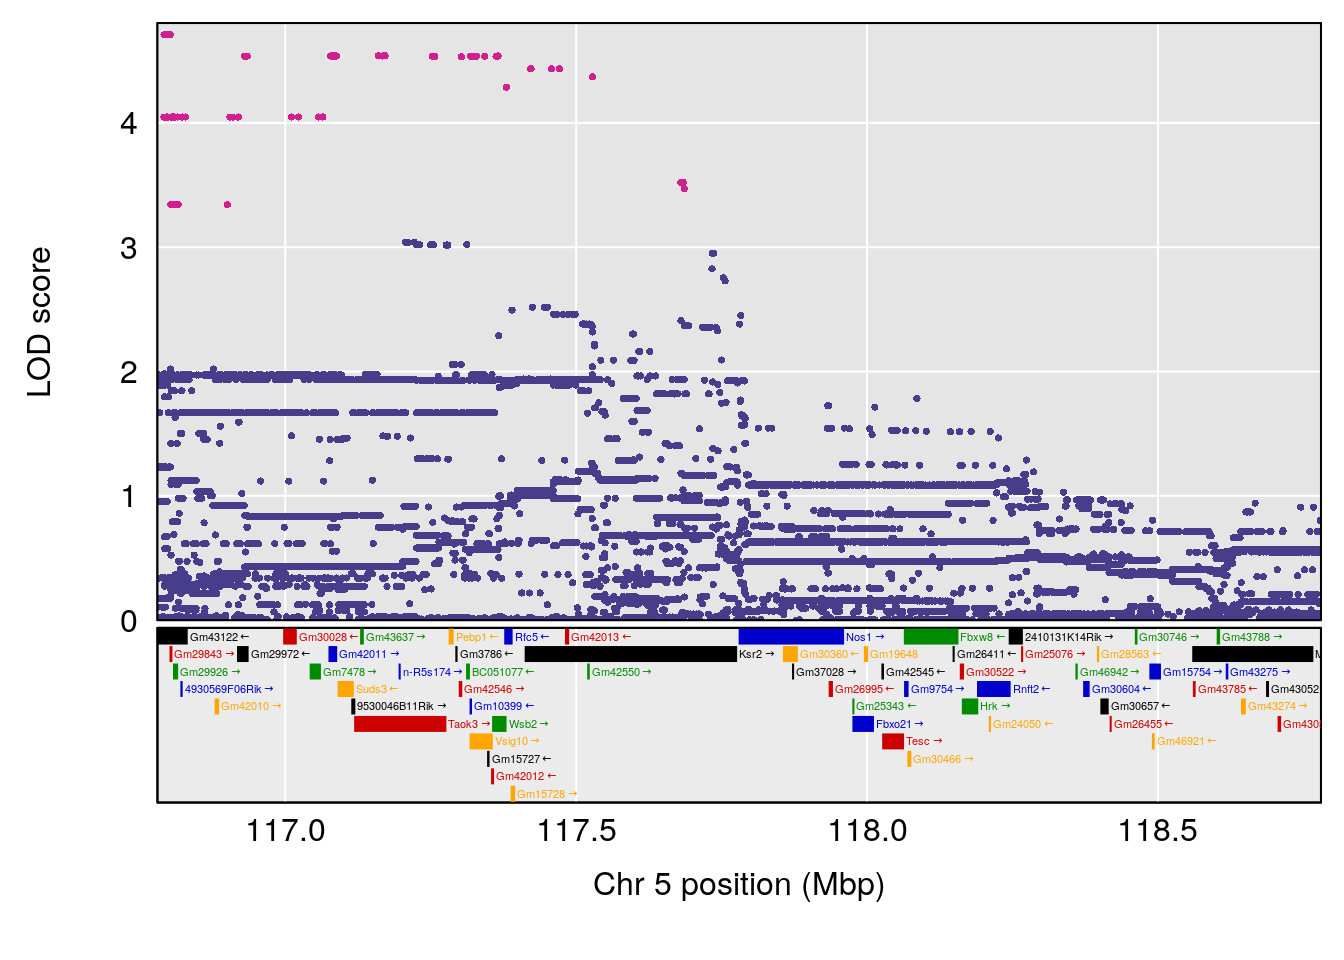
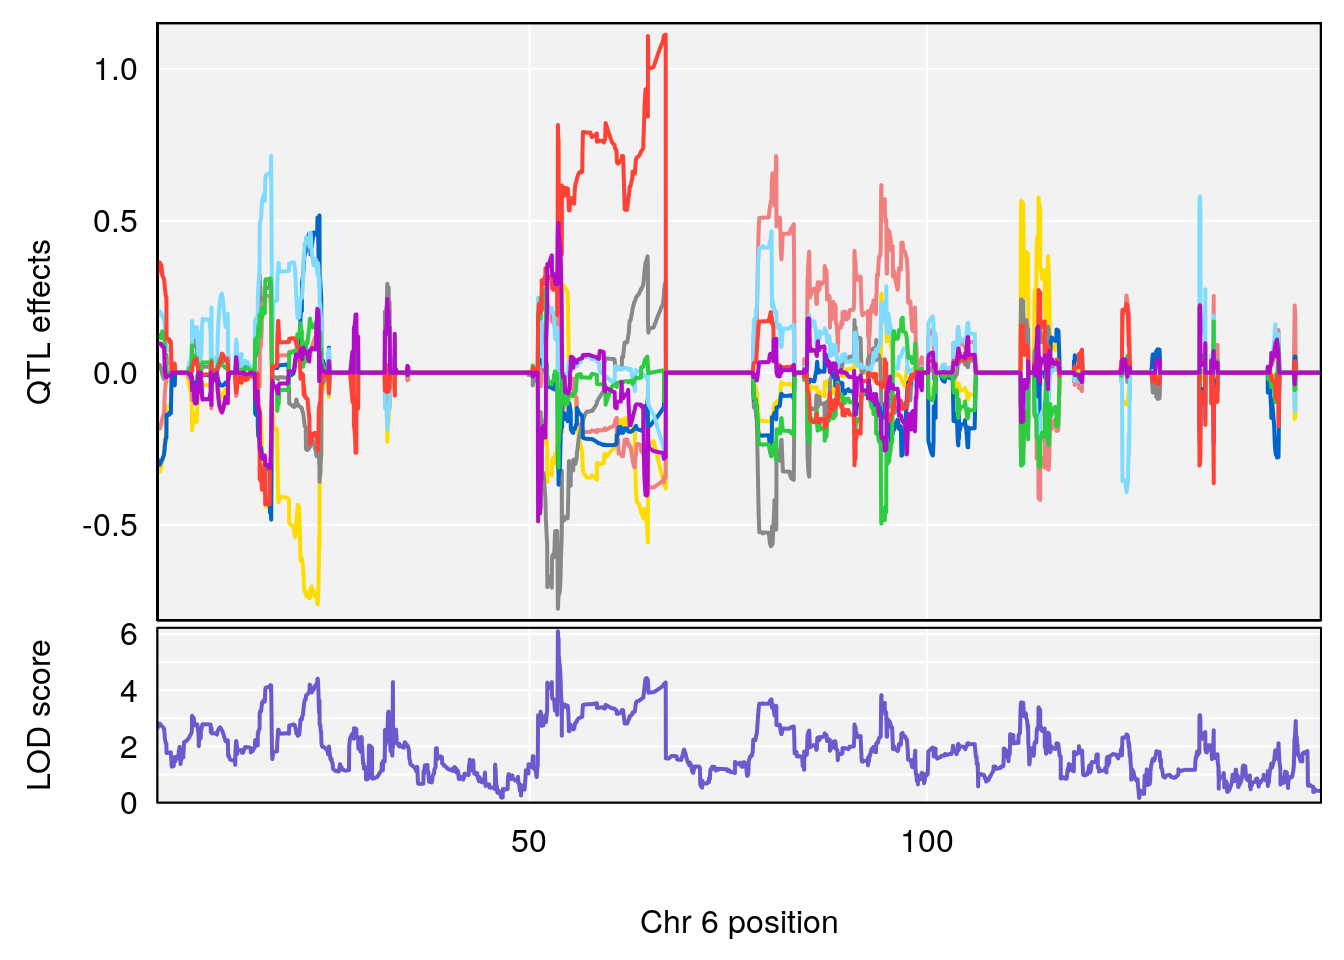
# [1] "Time.to.Recovery.Hr"
#   lodindex lodcolumn chr      pos      lod    ci_lo     ci_hi
# 1        1    pheno1   5 117.7803 6.310941 66.67504 117.79601
# 2        1    pheno1   6  53.5762 6.096846 53.51503  53.91867
# [1] 1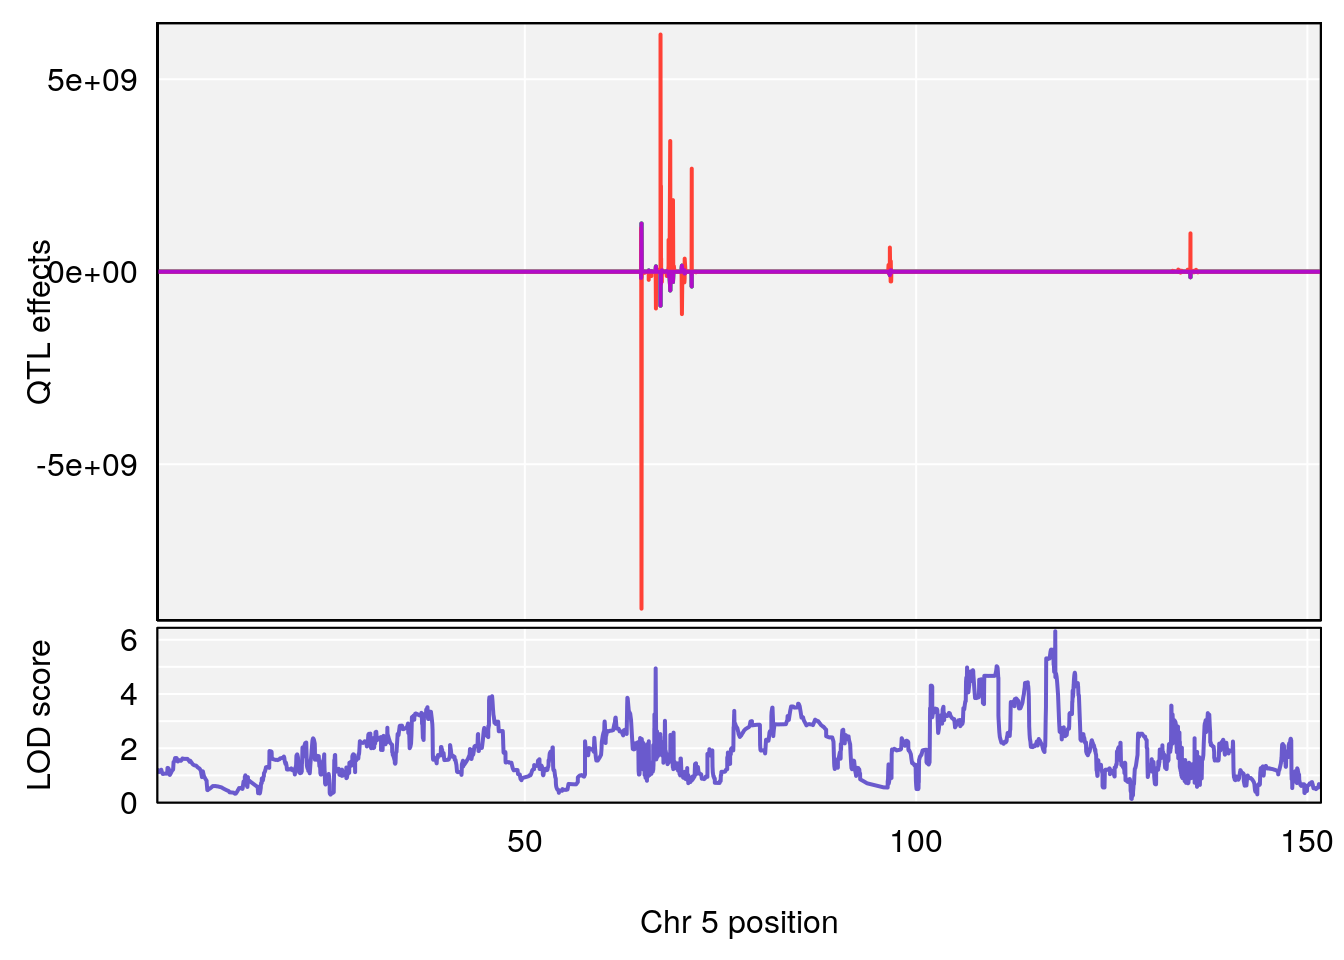
| Version | Author | Date |
|---|---|---|
| 0971ef2 | xhyuo | 2022-07-05 |
| Version | Author | Date |
|---|---|---|
| 0971ef2 | xhyuo | 2022-07-05 |
| Version | Author | Date |
|---|---|---|
| 0971ef2 | xhyuo | 2022-07-05 |
# [1] 2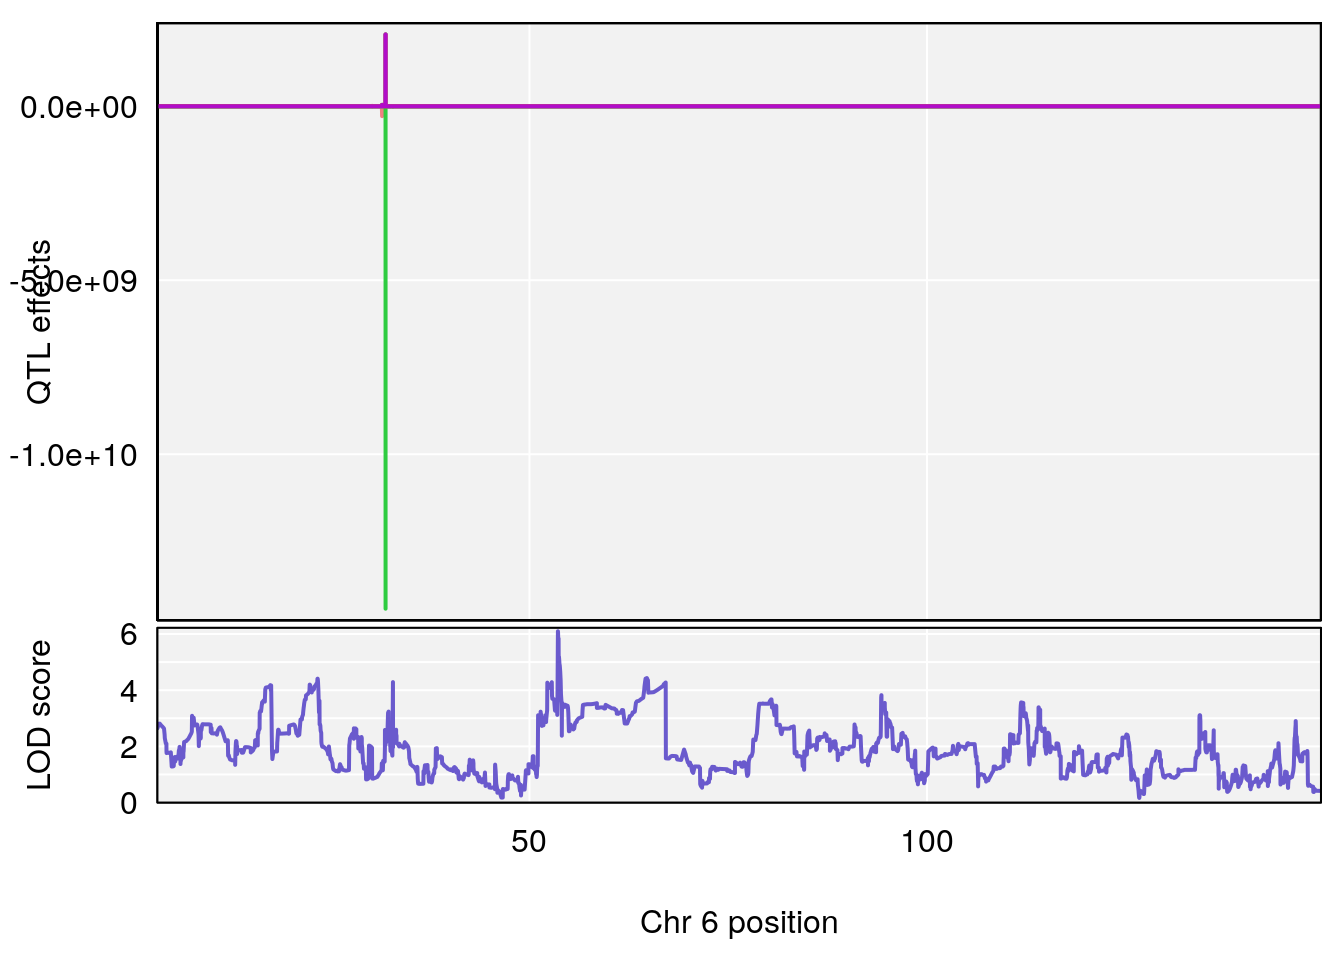
| Version | Author | Date |
|---|---|---|
| 0971ef2 | xhyuo | 2022-07-05 |
| Version | Author | Date |
|---|---|---|
| 0971ef2 | xhyuo | 2022-07-05 |
| Version | Author | Date |
|---|---|---|
| 0971ef2 | xhyuo | 2022-07-05 |
# [1] "Status_bin"
# lodindex lodcolumn chr pos lod ci_lo ci_hi
# 1 1 pheno1 1 150.38336 6.177322 40.80906 185.20043
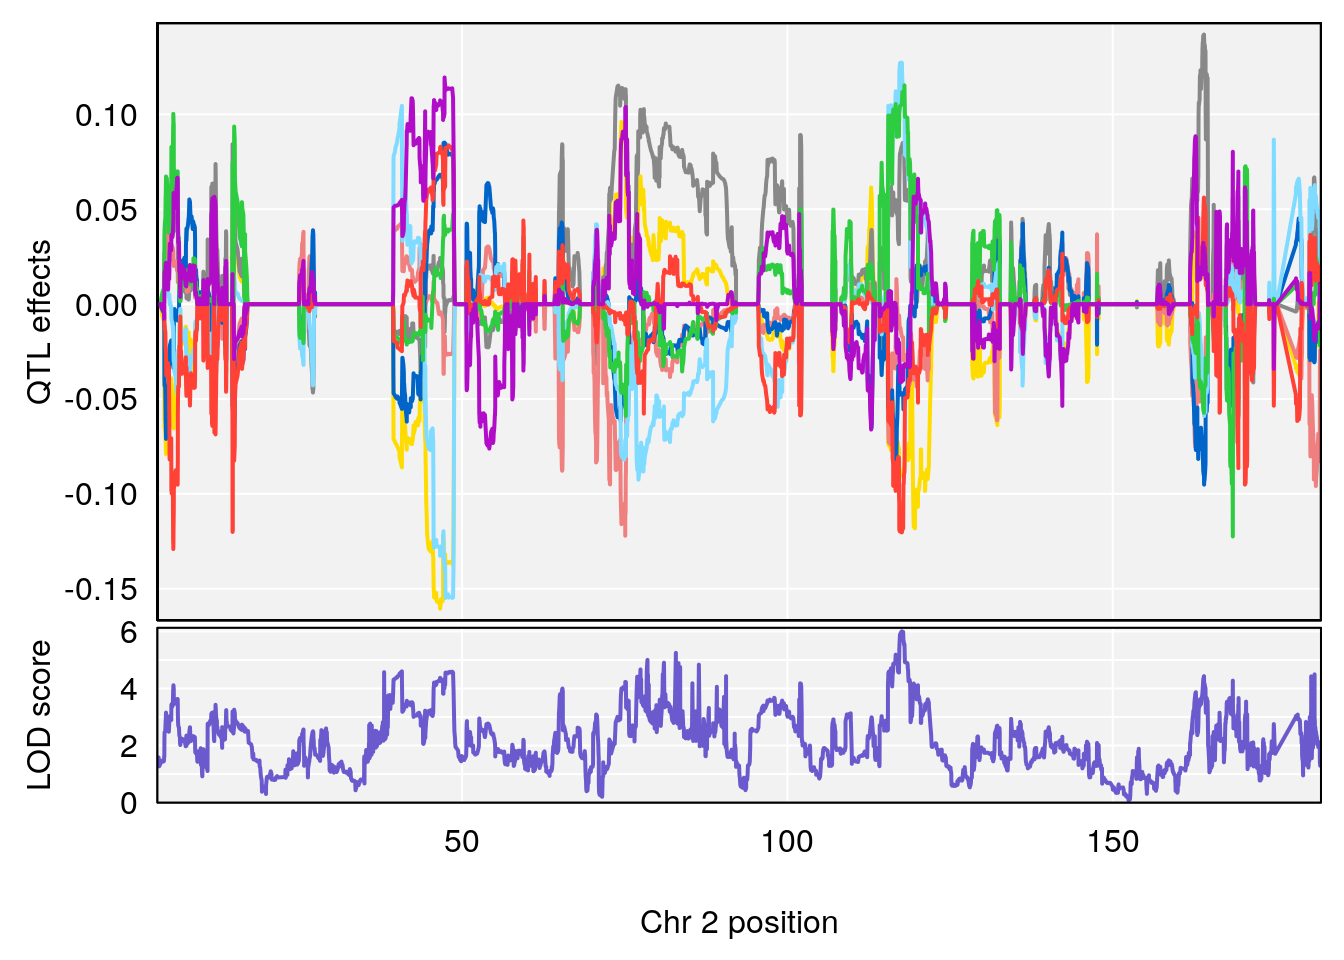
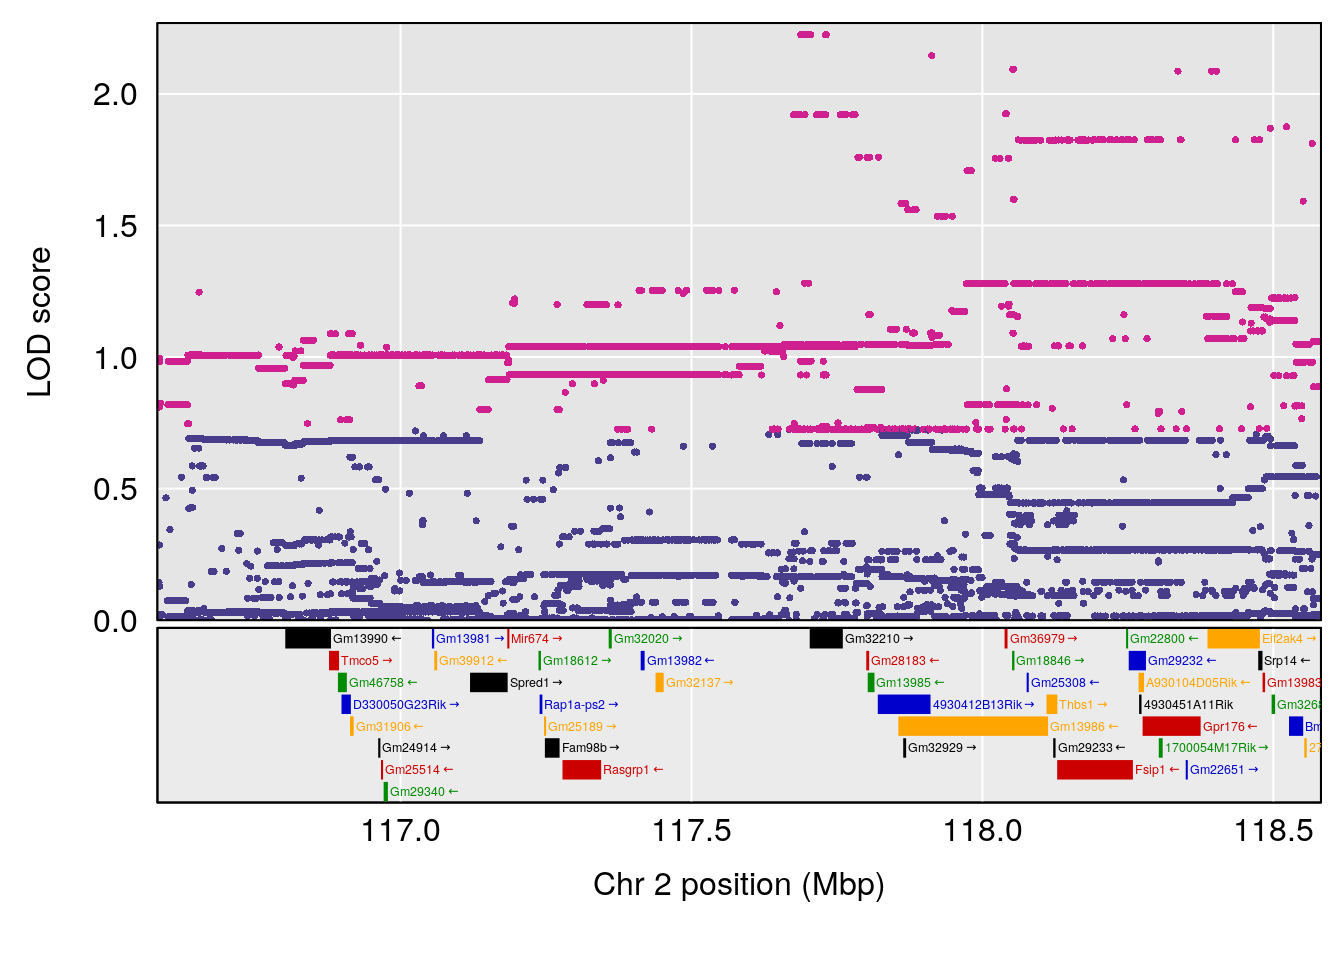
# 2 1 pheno1 2 117.58205 6.005846 37.99636 118.56768
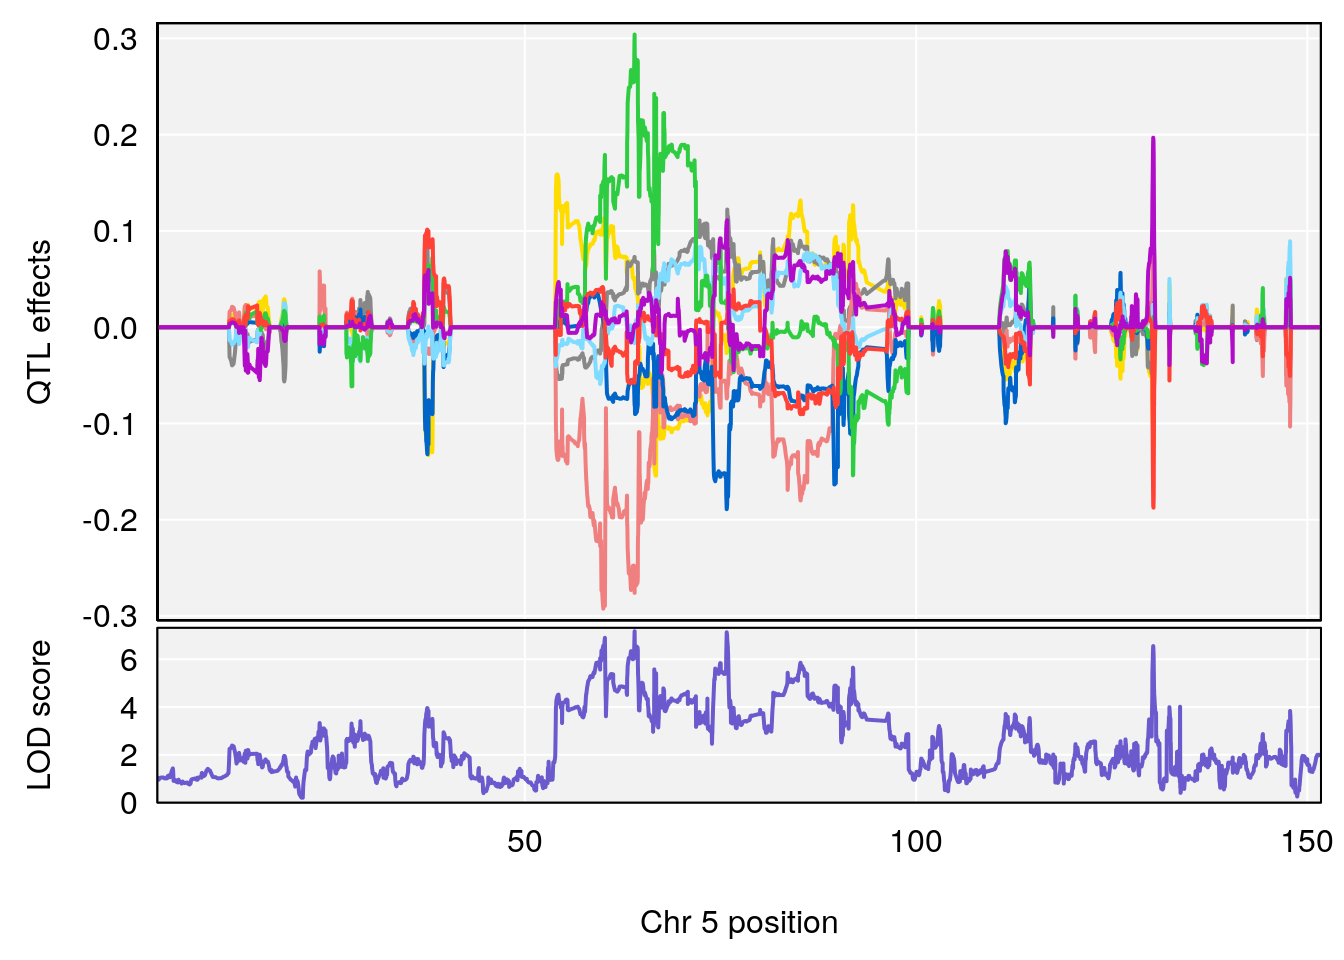
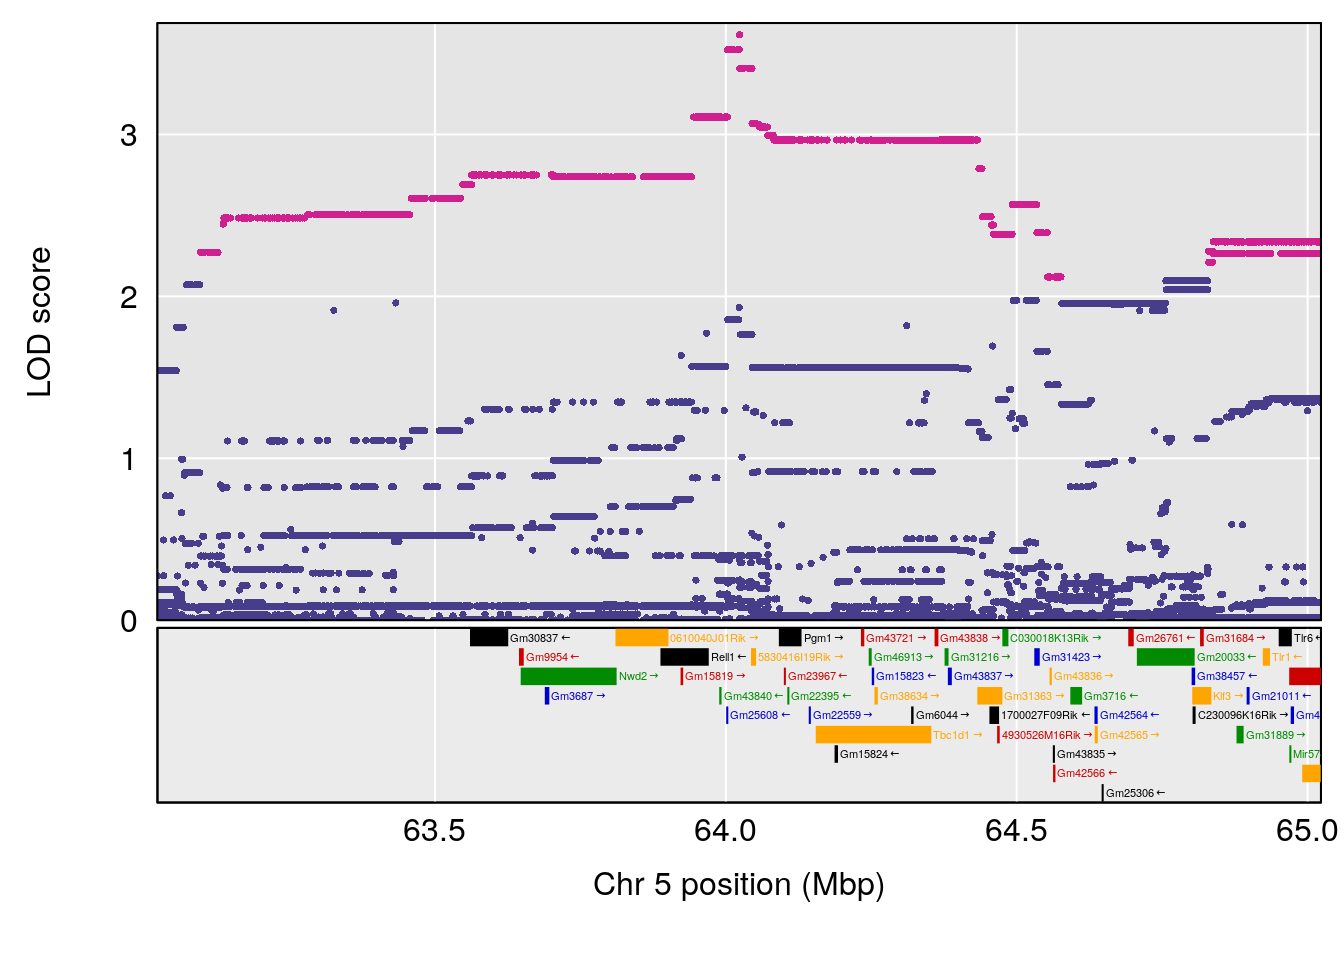
# 3 1 pheno1 5 64.02294 7.173261 59.01797 130.37092
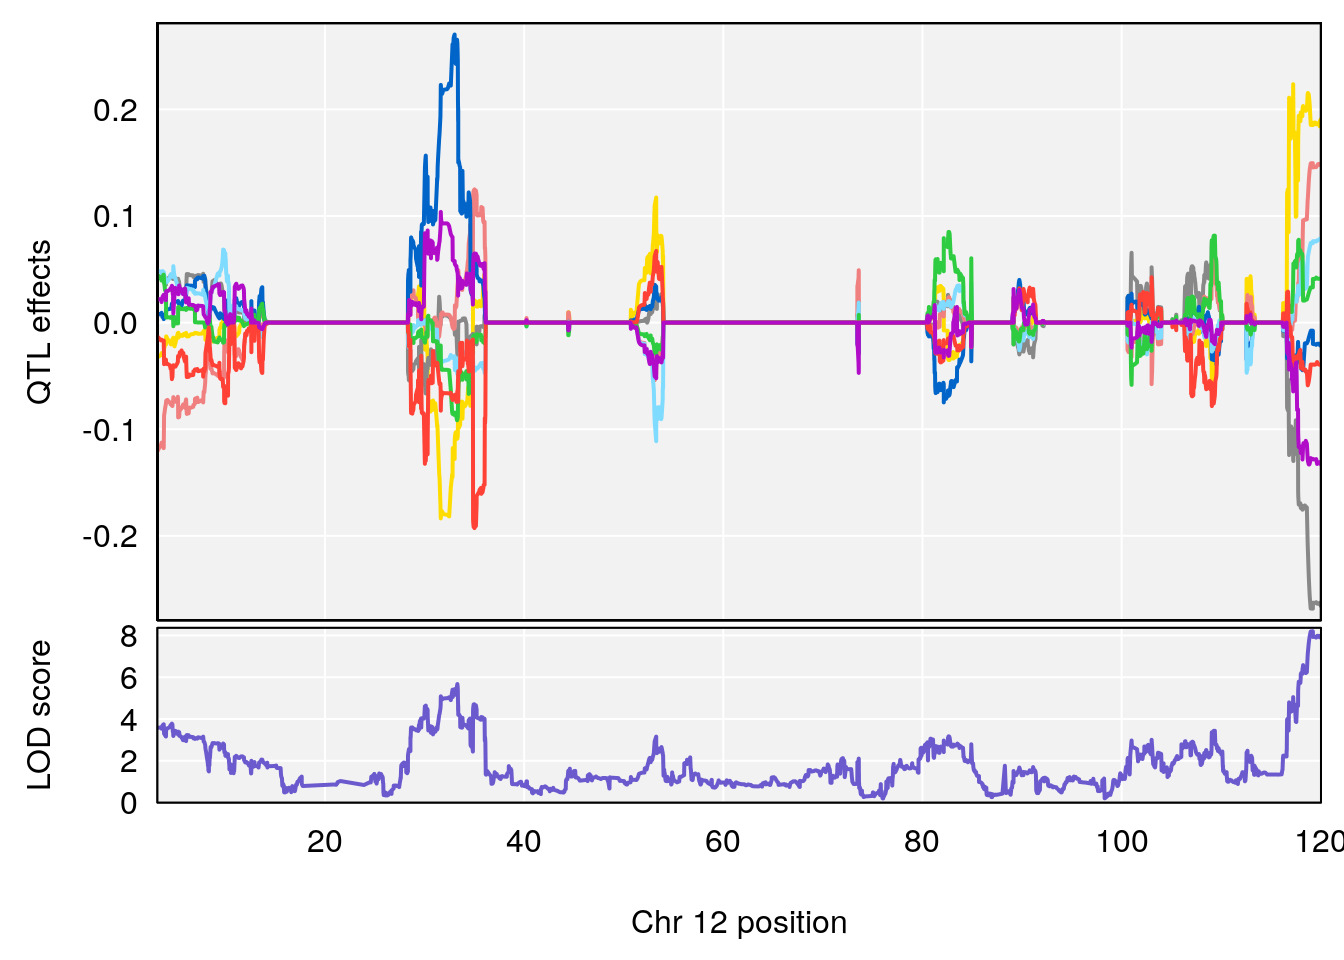
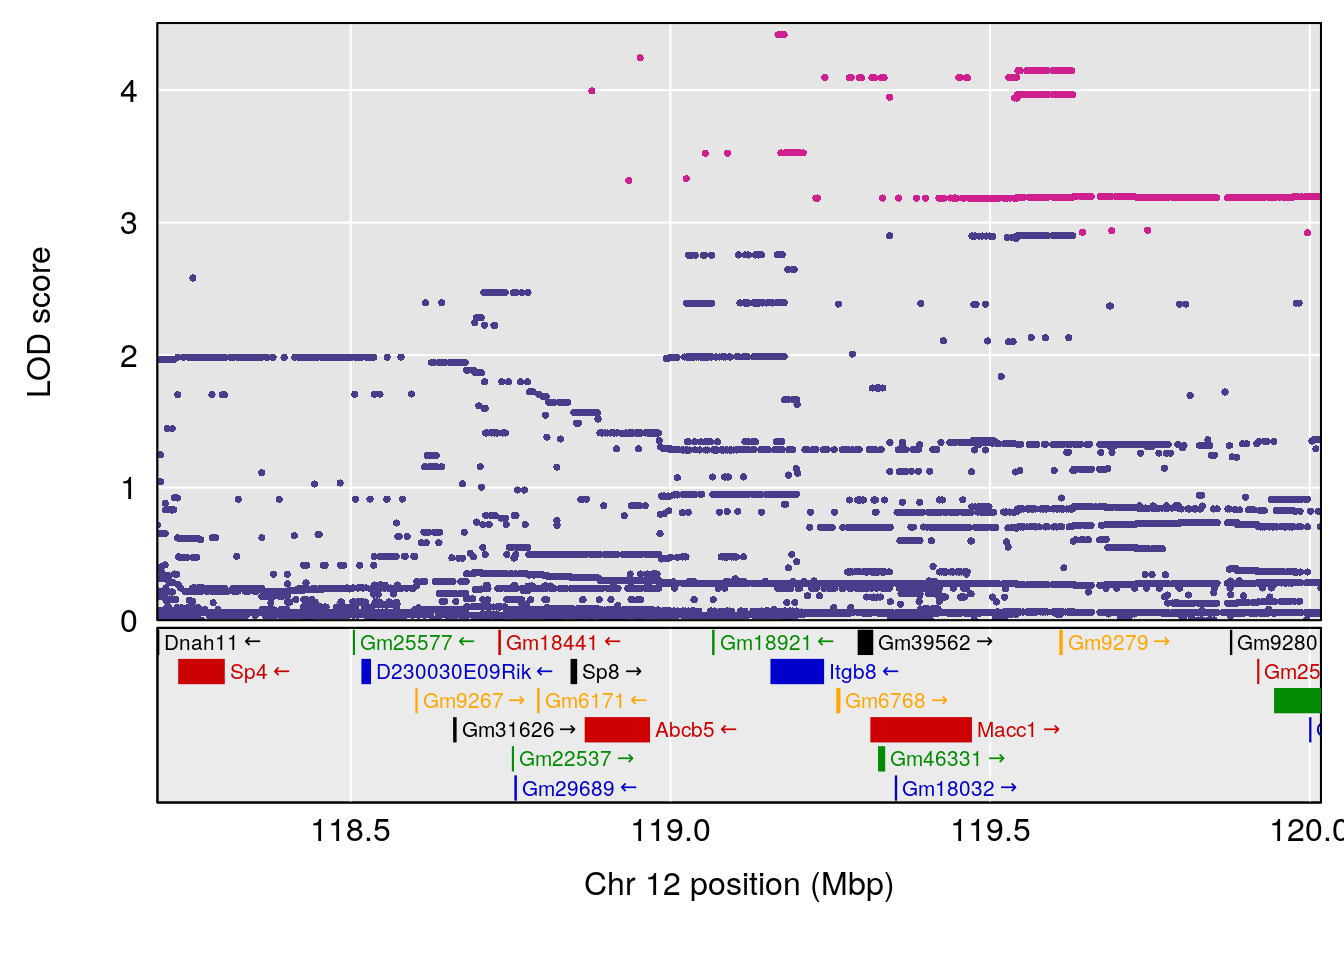
# 4 1 pheno1 12 119.19756 8.201177 118.59974 120.01743
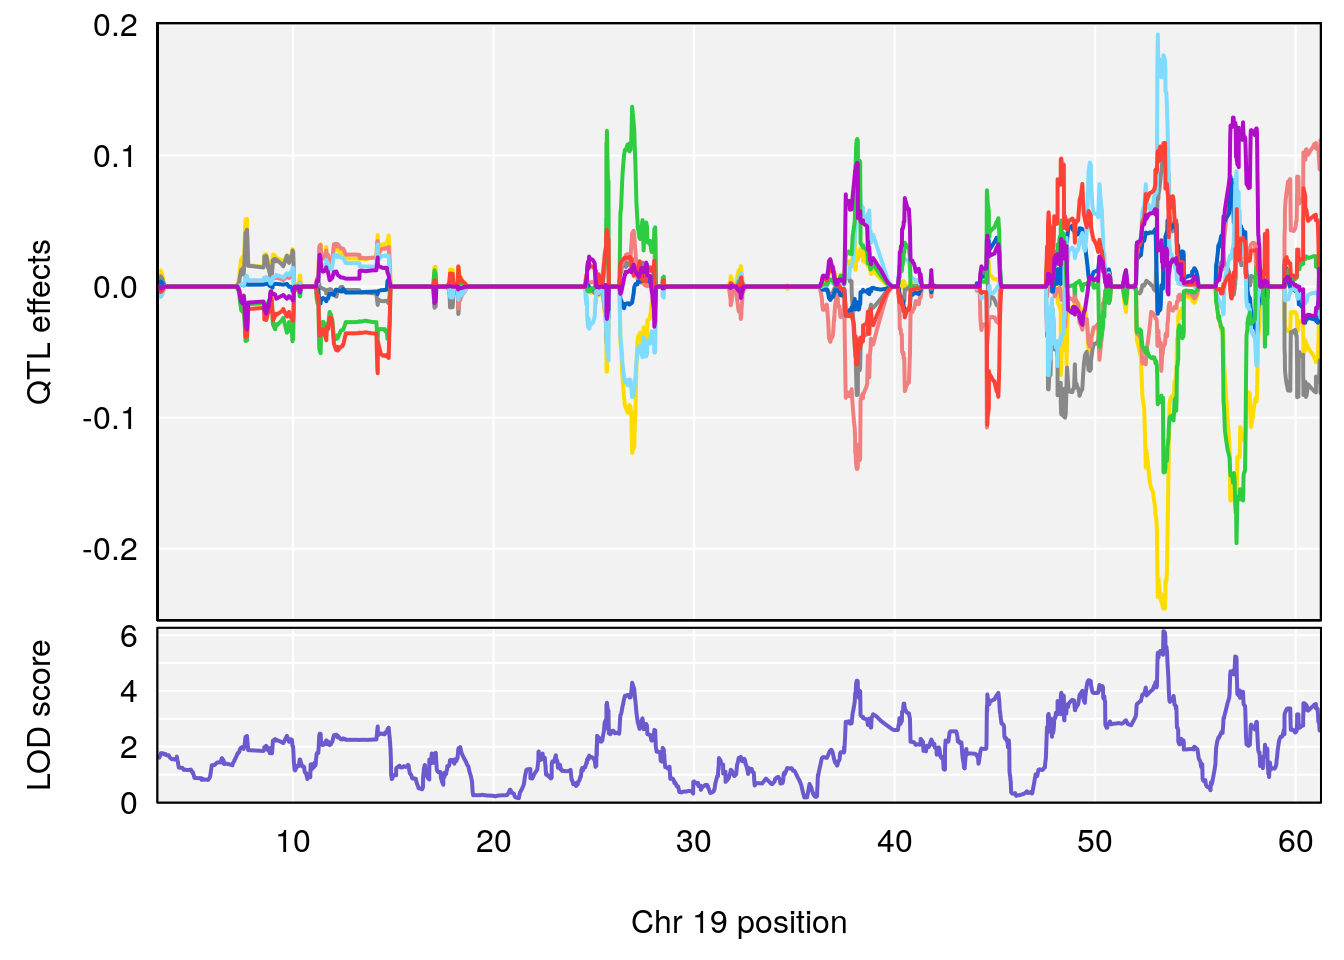
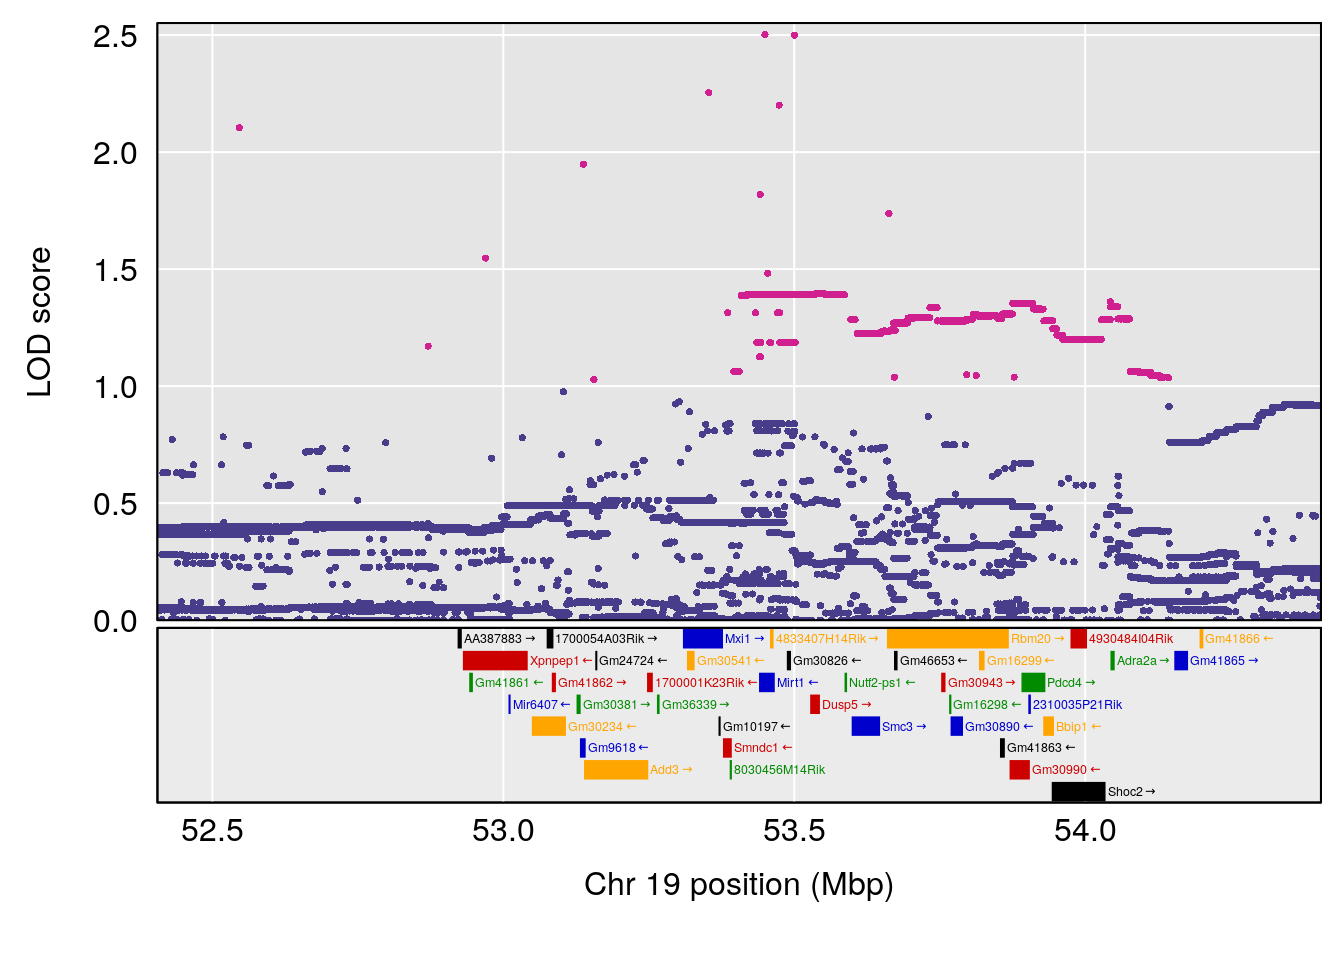
# 5 1 pheno1 19 53.40556 6.139452 53.08070 57.06435
# [1] 1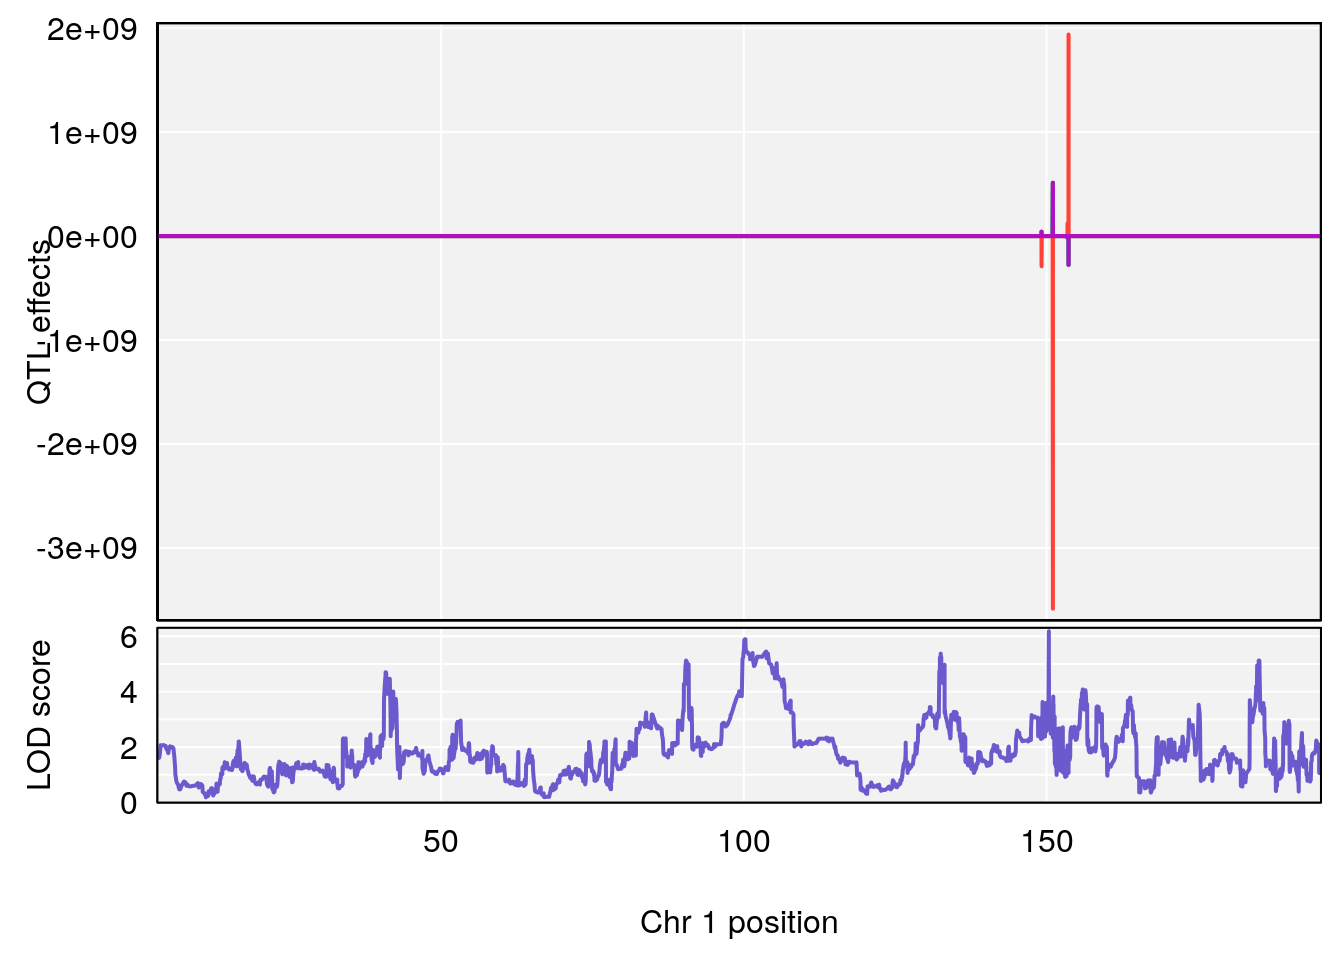
| Version | Author | Date |
|---|---|---|
| 0971ef2 | xhyuo | 2022-07-05 |
| Version | Author | Date |
|---|---|---|
| 0971ef2 | xhyuo | 2022-07-05 |
| Version | Author | Date |
|---|---|---|
| 0971ef2 | xhyuo | 2022-07-05 |
# [1] 2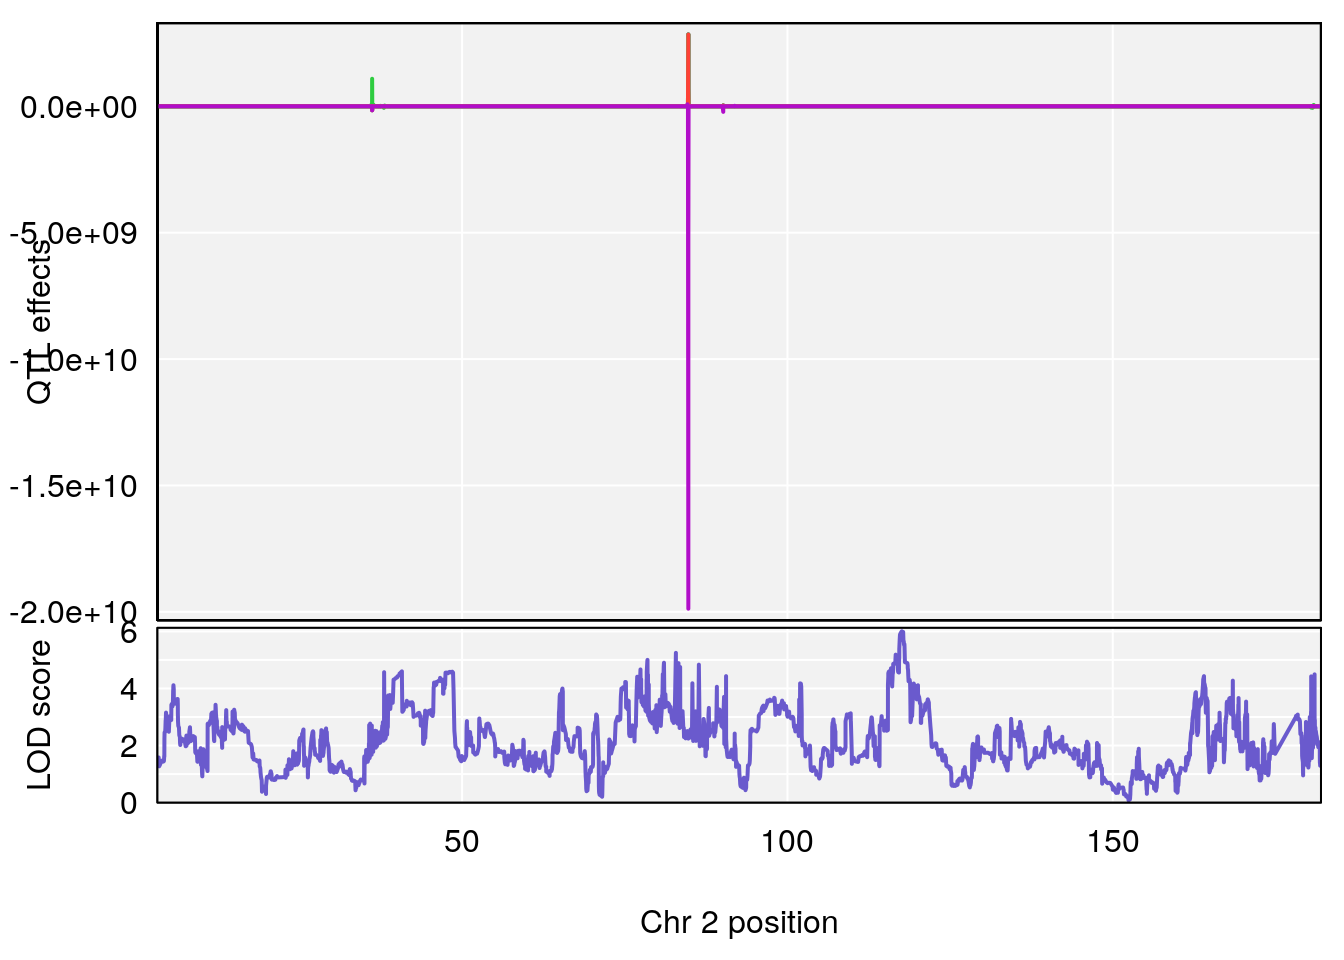
| Version | Author | Date |
|---|---|---|
| 0971ef2 | xhyuo | 2022-07-05 |
| Version | Author | Date |
|---|---|---|
| 0971ef2 | xhyuo | 2022-07-05 |
| Version | Author | Date |
|---|---|---|
| 0971ef2 | xhyuo | 2022-07-05 |
# [1] 3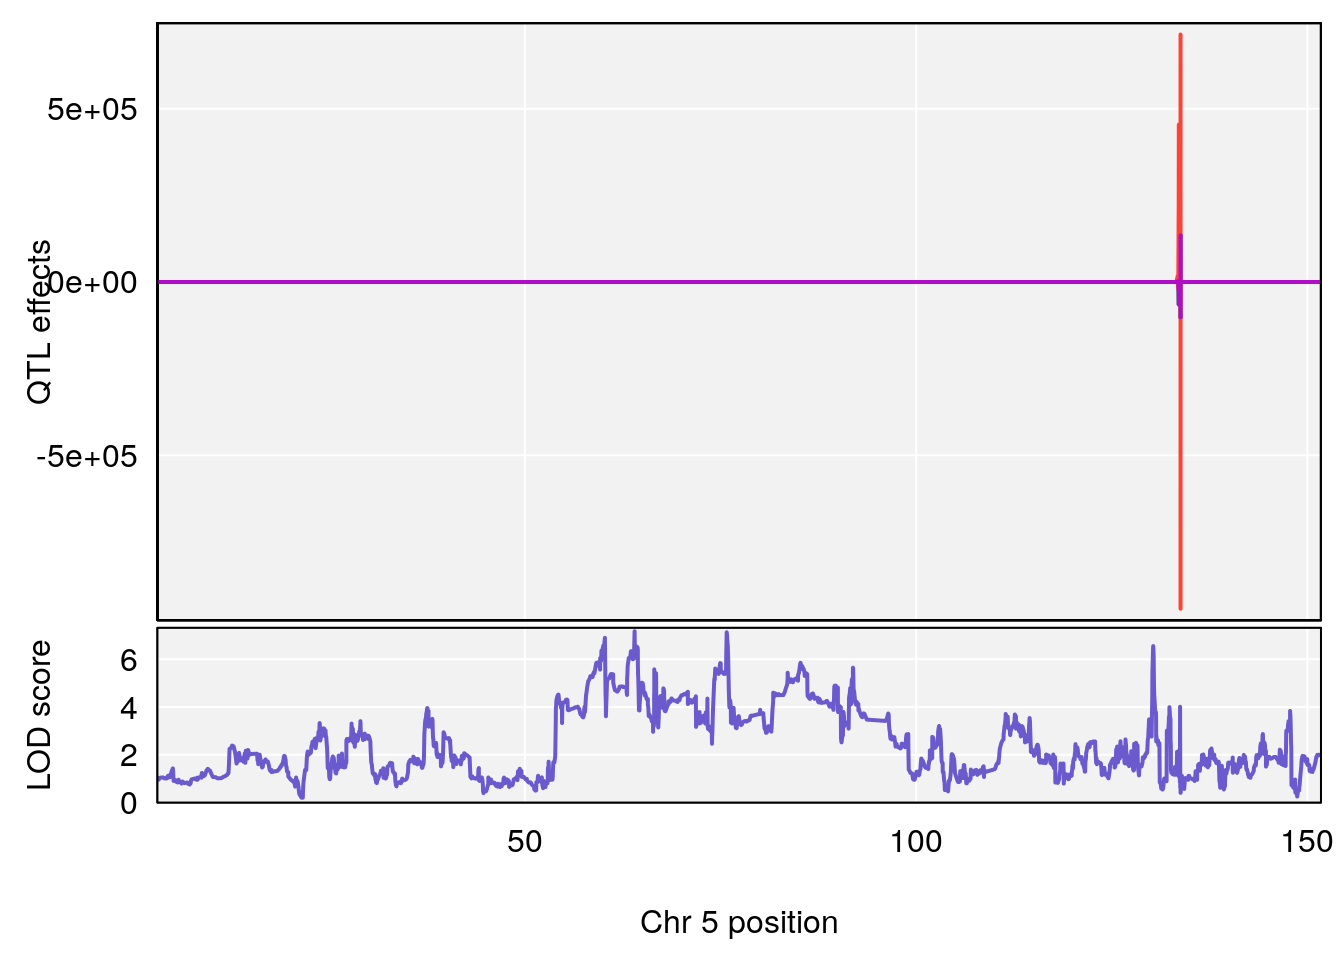
| Version | Author | Date |
|---|---|---|
| 0971ef2 | xhyuo | 2022-07-05 |
| Version | Author | Date |
|---|---|---|
| 0971ef2 | xhyuo | 2022-07-05 |
| Version | Author | Date |
|---|---|---|
| 0971ef2 | xhyuo | 2022-07-05 |
# [1] 4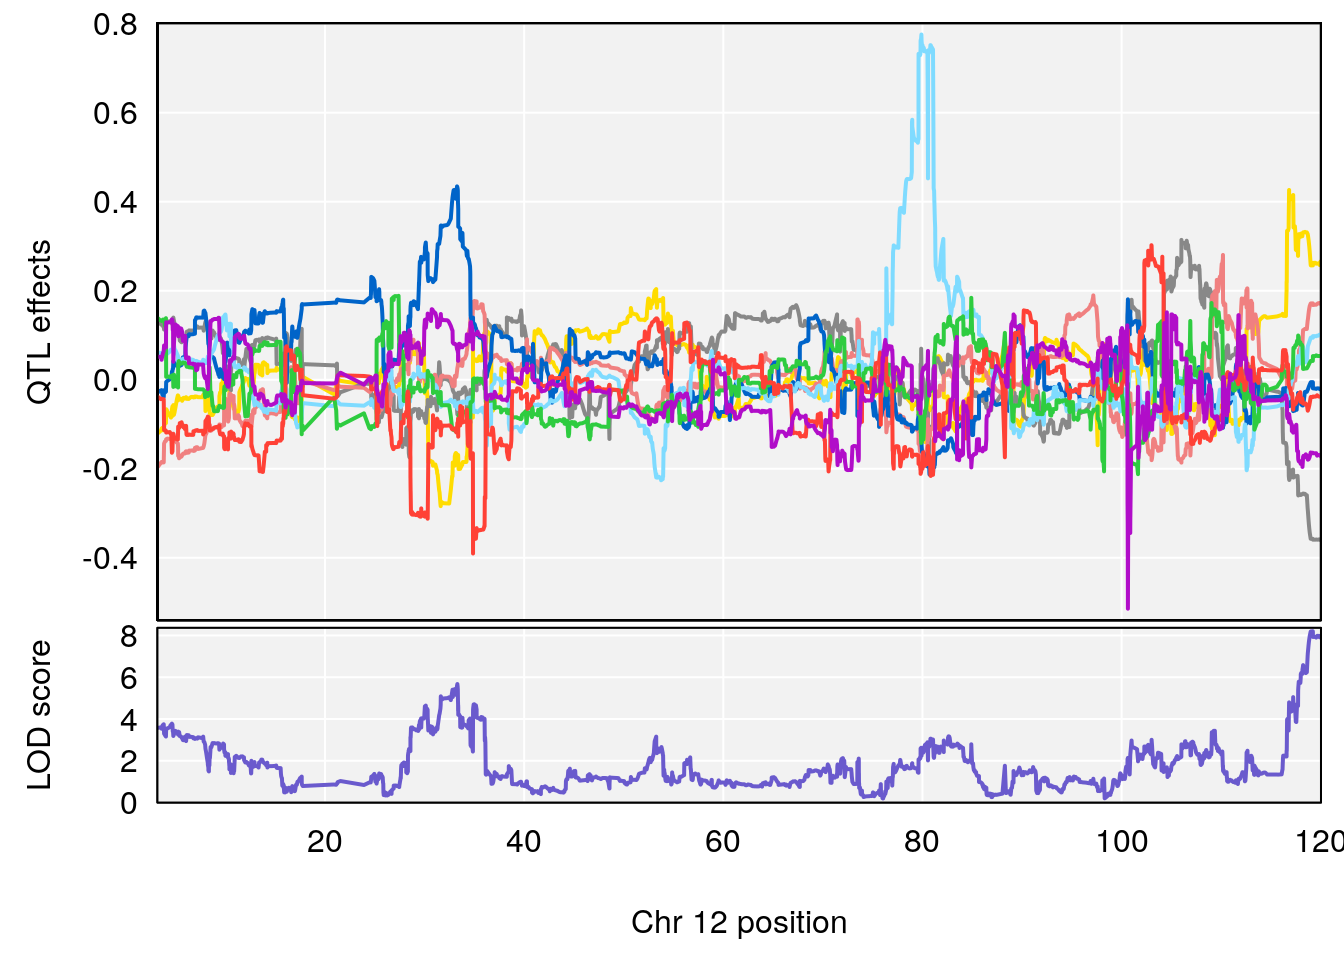
| Version | Author | Date |
|---|---|---|
| 0971ef2 | xhyuo | 2022-07-05 |
| Version | Author | Date |
|---|---|---|
| 0971ef2 | xhyuo | 2022-07-05 |
| Version | Author | Date |
|---|---|---|
| 0971ef2 | xhyuo | 2022-07-05 |
# [1] 5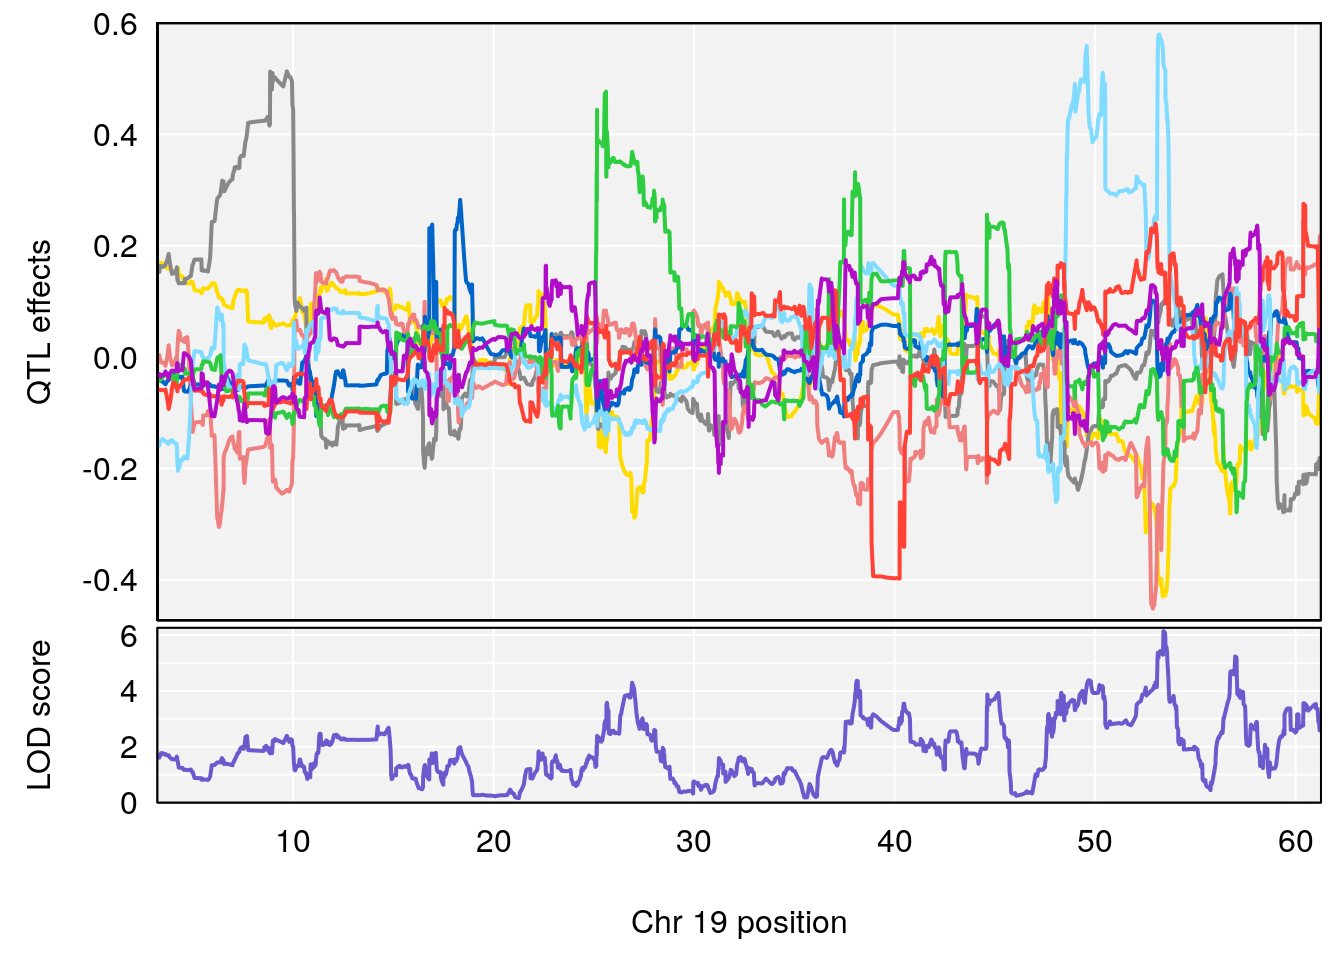
| Version | Author | Date |
|---|---|---|
| 0971ef2 | xhyuo | 2022-07-05 |
| Version | Author | Date |
|---|---|---|
| 0971ef2 | xhyuo | 2022-07-05 |
| Version | Author | Date |
|---|---|---|
| 0971ef2 | xhyuo | 2022-07-05 |
#save peaks coeff plot
for(i in names(qtl.out)){
  print(i)
  peaks <- find_peaks(qtl.out[[i]], map=pmap, threshold=6, drop=1.5)
  if(nrow(peaks) > 0){
      fname <- paste("output/do_Fentanyl_combine2cohort_", str_replace_all(i, "[[:punct:]]", "") ,"_coefplot.pdf",sep="")
      pdf(file = fname, width = 16, height =8)
      for(p in 1:dim(peaks)[1]) {
        print(p)
        chr <-peaks[p,3]
        #coeff plot
        par(mar=c(4.1, 4.1, 0.6, 0.6))
        plot_coefCC(coef_c1[[i]][[p]], pmap[chr], scan1_output=qtl.out[[i]], bgcolor="gray95", legend=NULL)
        plot(out_snps[[i]][[p]]$lod, out_snps[[i]][[p]]$snpinfo, drop_hilit=1.5, genes=out_genes[[i]][[p]])
        }
      dev.off()
  }
}
# [1] "Time.to.Dead.Hr"
# [1] 1
# [1] 2
# [1] 3
# [1] "RR.Depression.Rate.Hr"
# [1] "Time.to.Steady.RR.Depression.Hr"
# [1] "Min.Depression.RR"
# [1] 1
# [1] 2
# [1] "Mean.Depression.BR"
# [1] 1
# [1] 2
# [1] 3
# [1] "SteadyState.Depression.Duration.Hr"
# [1] 1
# [1] 2
# [1] "Time.to.Threshold.Recovery.Hr"
# [1] "Time.to.Projected.Recovery.Hr"
# [1] 1
# [1] "Start.of.Recovery.Hr"
# [1] 1
# [1] 2
# [1] 3
# [1] "RR.Recovery.Rate.Hr"
# [1] 1
# [1] 2
# [1] "Min.Depression.BR"
# [1] 1
# [1] "Time.to.Mostly.Dead.Hr"
# [1] 1
# [1] "Time.to.Recovery.Hr"
# [1] 1
# [1] 2
# [1] "Status_bin"
# [1] 1
# [1] 2
# [1] 3
# [1] 4
# [1] 5

#save peaks coeff blup plot
for(i in names(qtl.out)){
  print(i)
  peaks <- find_peaks(qtl.out[[i]], map=pmap, threshold=6, drop=1.5)
  if(nrow(peaks) > 0) {
      fname <- paste("output/do_Fentanyl_combine2cohort_", str_replace_all(i, "[[:punct:]]", "") ,"_coefplot_blup.pdf",sep="")
      pdf(file = fname, width = 16, height =8)
      for(p in 1:dim(peaks)[1]) {
        print(p)
        chr <-peaks[p,3]
        #coeff plot
        par(mar=c(4.1, 4.1, 0.6, 0.6))
        plot_coefCC(coef_c2[[i]][[p]], pmap[chr], scan1_output=qtl.out[[i]], bgcolor="gray95", legend=NULL)
        plot(out_snps[[i]][[p]]$lod, out_snps[[i]][[p]]$snpinfo, drop_hilit=1.5, genes=out_genes[[i]][[p]])
        }
      dev.off()
    }
}
# [1] "Time.to.Dead.Hr"
# [1] 1
# [1] 2
# [1] 3
# [1] "RR.Depression.Rate.Hr"
# [1] "Time.to.Steady.RR.Depression.Hr"
# [1] "Min.Depression.RR"
# [1] 1
# [1] 2
# [1] "Mean.Depression.BR"
# [1] 1
# [1] 2
# [1] 3
# [1] "SteadyState.Depression.Duration.Hr"
# [1] 1
# [1] 2
# [1] "Time.to.Threshold.Recovery.Hr"
# [1] "Time.to.Projected.Recovery.Hr"
# [1] 1
# [1] "Start.of.Recovery.Hr"
# [1] 1
# [1] 2
# [1] 3
# [1] "RR.Recovery.Rate.Hr"
# [1] 1
# [1] 2
# [1] "Min.Depression.BR"
# [1] 1
# [1] "Time.to.Mostly.Dead.Hr"
# [1] 1
# [1] "Time.to.Recovery.Hr"
# [1] 1
# [1] 2
# [1] "Status_bin"
# [1] 1
# [1] 2
# [1] 3
# [1] 4
# [1] 5
heritability
#plot heritability by qtl2 array --------------
herit <- data.frame(Phenotype = names(unlist(qtl.hsq)),
                    Heritability = round(unlist(qtl.hsq),3))
herit <- herit %>%
  arrange(desc(Heritability))
herit$Phenotype <- factor(herit$Phenotype, levels = herit$Phenotype)
#histgram
p2 <- ggplot(data=herit, aes(x=Phenotype, y=Heritability)) + #, fill=Domain, color = Domain)) +
  geom_bar(stat="identity", fill = "blue", color = "blue", show.legend = FALSE) +
  scale_y_continuous(breaks=seq(0.0, 1.0, 0.1)) +
  geom_text(aes(label = Heritability, y = Heritability + 0.005), position = position_dodge(0.9),vjust = 0) +
  theme(axis.text.x = element_text(angle = 90, hjust = 1)) +
  ggtitle("DO do_Fentanyl_combine2cohort Heritability by qtl2 array")
p2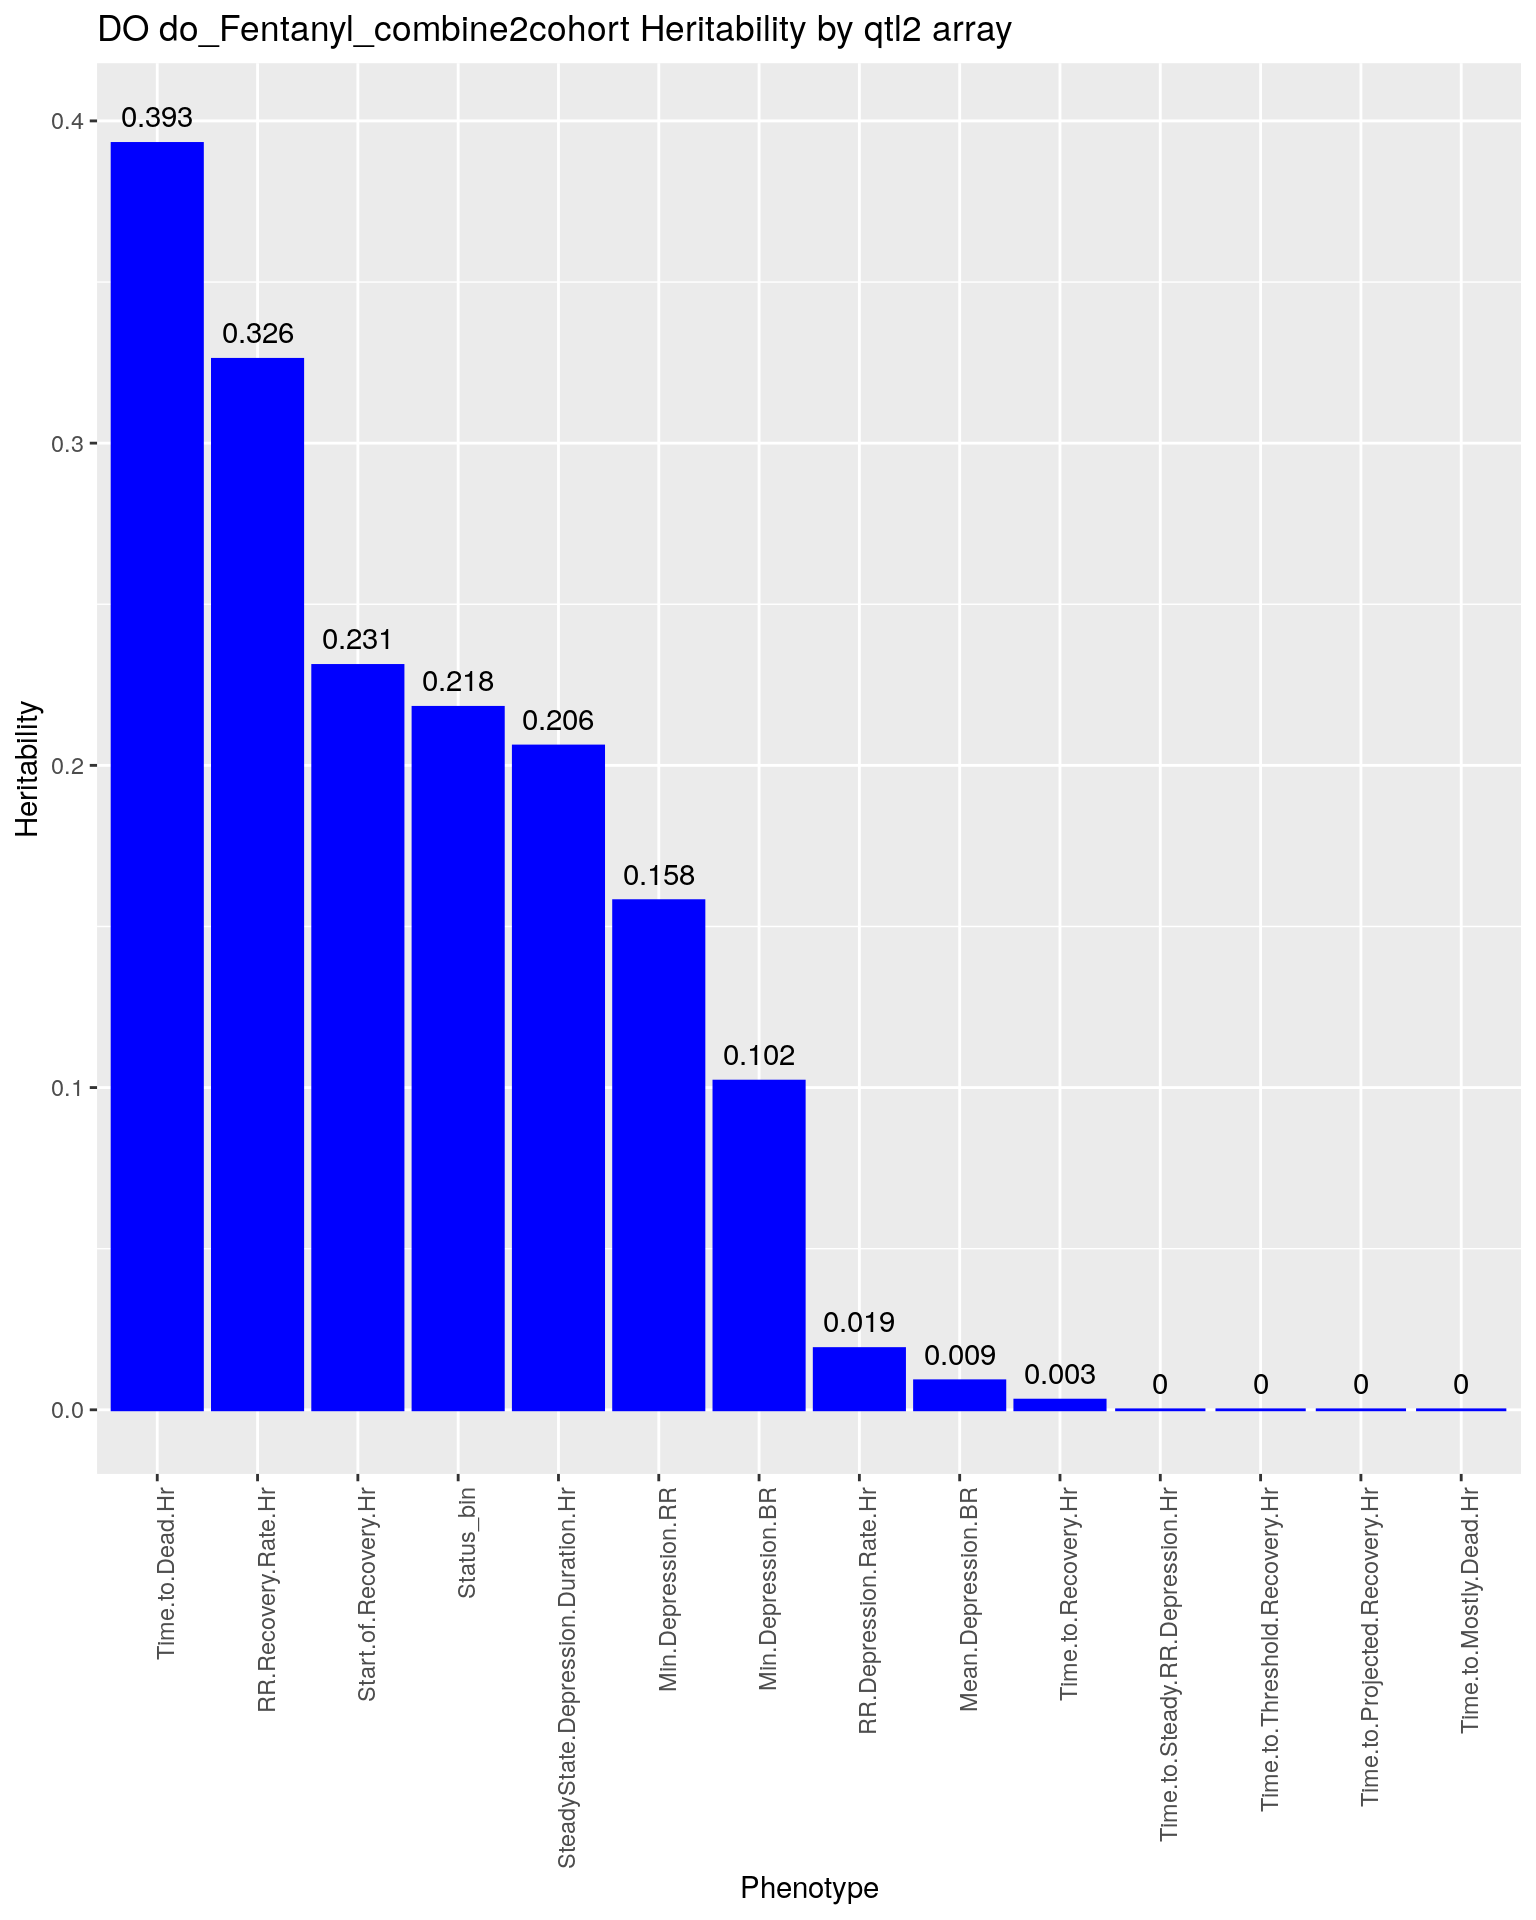
#plot heritability by GCTA
h <- read.csv("data/FinalReport/GCTA/DO_Fentanyl_combining2Cohort/DO_Fentanyl_combining2Cohort_heritability_by_GCTA.csv", header = TRUE)
h <- h %>%
  arrange(desc(Heritability))
h$Phenotype <- factor(h$Phenotype, levels = h$Phenotype)
h$Heritability <- round(h$Heritability,2)
#histgram
pdf(file = paste0("data/FinalReport/GCTA/DO_Fentanyl_combining2Cohort/DO_Fentanyl_combining2Cohort","_heritability_by_GCTA.pdf"), height = 10, width = 10)
p3<-ggplot(data=h, aes(x=Phenotype, y=Heritability)) + #, fill=Domain, color = Domain)) +
  geom_bar(stat="identity", fill = "blue", color = "blue", show.legend = FALSE) +
  scale_y_continuous(breaks=seq(0.0, 1.0, 0.1)) +
  geom_text(aes(label = Heritability, y = Heritability + 0.005), position = position_dodge(0.9),vjust = 0) +
  theme(axis.text.x = element_text(angle = 90, hjust = 1)) +
  ggtitle("Heritability by GCTA")
p3
dev.off()
# png
#   2
# png
#   2
p3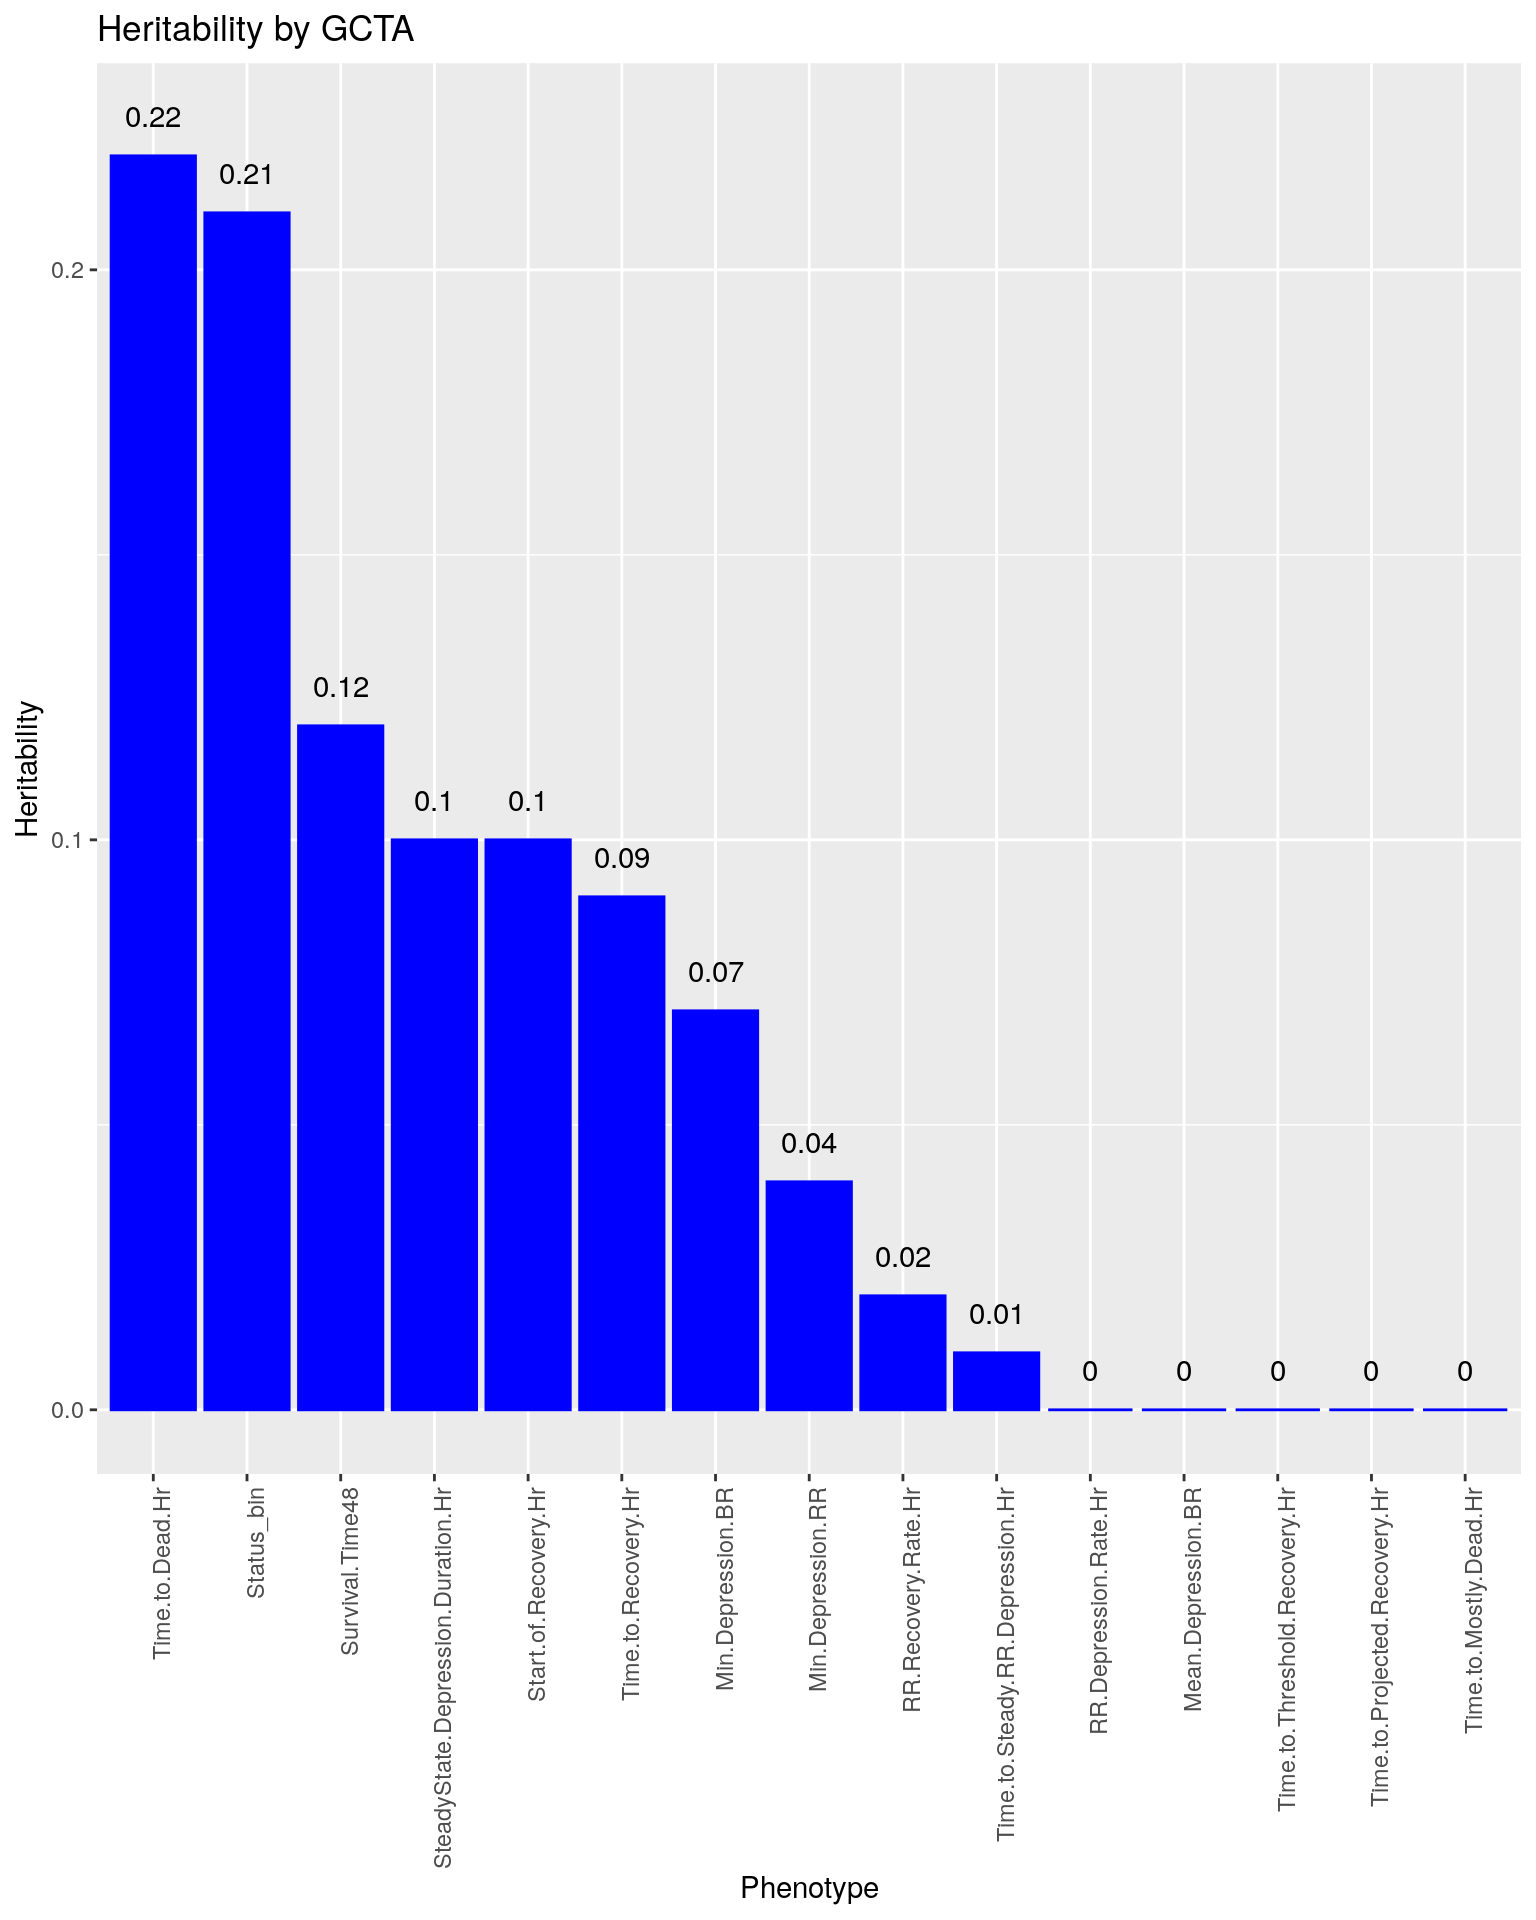
Plot qtl mapping on array male
load("output/Fentanyl/qtl.fentanyl.combine2cohort.out.male.RData")
#pmap and gmap
chr.names <- c("1","2","3","4","5","6","7","8","9","10","11","12","13","14","15","16","17","18","19", "X")
gmap <- list()
pmap <- list()
for (chr in chr.names){
  gmap[[chr]] <-  gm$gmap[[chr]]
  pmap[[chr]] <-  gm$pmap[[chr]]
}
attr(gmap, "is_x_chr") <- structure(c(rep(FALSE,19),TRUE), names=1:20)
attr(pmap, "is_x_chr") <- structure(c(rep(FALSE,19),TRUE), names=1:20)

#genome-wide plot
for(i in names(qtl.out)){
  par(mar=c(5.1, 4.1, 1.1, 1.1))
  ymx <- maxlod(qtl.out[[i]]) # overall maximum LOD score
  plot(qtl.out[[i]], map=pmap, lodcolumn=1, col="slateblue", ylim=c(0, max(sapply(qtl.out, maxlod)) +2))
  abline(h=summary(qtl.operm[[i]], alpha=c(0.10, 0.05, 0.01))[[1]], col="red")
  abline(h=summary(qtl.operm[[i]], alpha=c(0.10, 0.05, 0.01))[[2]], col="red")
  abline(h=summary(qtl.operm[[i]], alpha=c(0.10, 0.05, 0.01))[[3]], col="red")
  title(main = paste0("do_Fentanyl_combine2cohort_",i))
}
| Version | Author | Date |
|---|---|---|
| 8611541 | xhyuo | 2023-02-21 |
| Version | Author | Date |
|---|---|---|
| 8611541 | xhyuo | 2023-02-21 |
| Version | Author | Date |
|---|---|---|
| 8611541 | xhyuo | 2023-02-21 |
| Version | Author | Date |
|---|---|---|
| 8611541 | xhyuo | 2023-02-21 |
| Version | Author | Date |
|---|---|---|
| 8611541 | xhyuo | 2023-02-21 |

| Version | Author | Date |
|---|---|---|
| 8611541 | xhyuo | 2023-02-21 |
| Version | Author | Date |
|---|---|---|
| 8611541 | xhyuo | 2023-02-21 |
| Version | Author | Date |
|---|---|---|
| 8611541 | xhyuo | 2023-02-21 |

| Version | Author | Date |
|---|---|---|
| 8611541 | xhyuo | 2023-02-21 |
| Version | Author | Date |
|---|---|---|
| 8611541 | xhyuo | 2023-02-21 |

| Version | Author | Date |
|---|---|---|
| 8611541 | xhyuo | 2023-02-21 |

| Version | Author | Date |
|---|---|---|
| 8611541 | xhyuo | 2023-02-21 |
| Version | Author | Date |
|---|---|---|
| 8611541 | xhyuo | 2023-02-21 |
| Version | Author | Date |
|---|---|---|
| 8611541 | xhyuo | 2023-02-21 |
#peaks coeff plot
for(i in names(qtl.out)){
print(i)
peaks <- find_peaks(qtl.out[[i]], map=pmap, threshold=6, drop=1.5)
if(nrow(peaks) > 0) {
print(peaks)
for(p in 1:dim(peaks)[1]) {
print(p)
chr <-peaks[p,3]
#coeff plot
par(mar=c(4.1, 4.1, 0.6, 0.6))
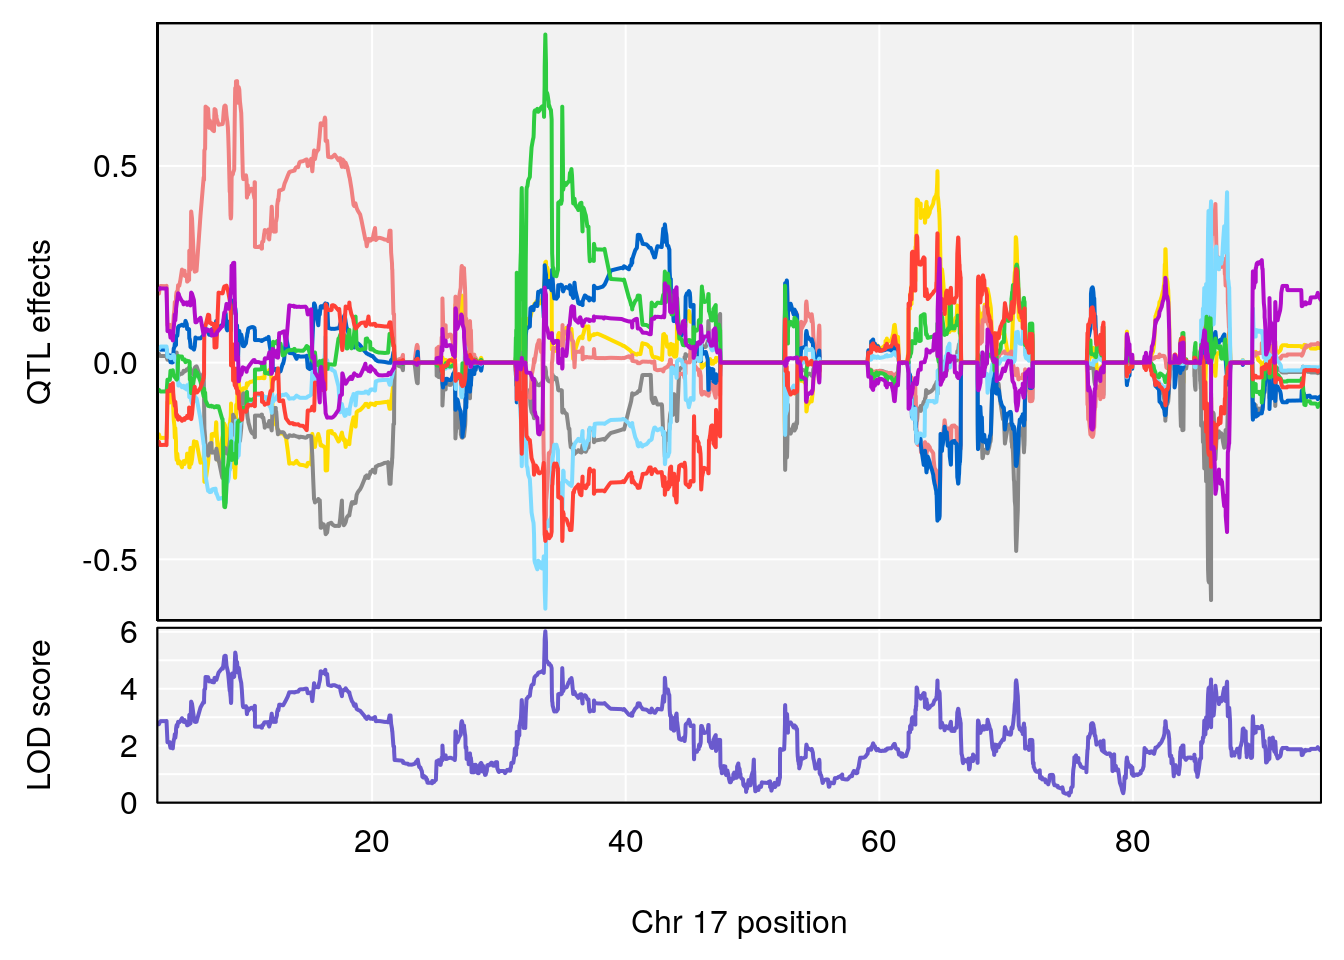
plot_coefCC(coef_c1[[i]][[p]], pmap[chr], scan1_output=qtl.out[[i]], bgcolor="gray95", legend=NULL)
plot_coefCC(coef_c2[[i]][[p]], pmap[chr], scan1_output=qtl.out[[i]], bgcolor="gray95", legend=NULL)
plot(out_snps[[i]][[p]]$lod, out_snps[[i]][[p]]$snpinfo, drop_hilit=1.5, genes=out_genes[[i]][[p]])
}
}
}
# [1] "Time.to.Dead.Hr"
# lodindex lodcolumn chr pos lod ci_lo ci_hi
# 1 1 pheno1 2 132.62489 6.124096 50.81340 173.86901
# 2 1 pheno1 10 99.92521 6.492863 99.28182 105.40417
# 3 1 pheno1 17 23.96788 6.725145 21.59514 25.08344
# [1] 1
| Version | Author | Date |
|---|---|---|
| 8611541 | xhyuo | 2023-02-21 |

| Version | Author | Date |
|---|---|---|
| 8611541 | xhyuo | 2023-02-21 |
| Version | Author | Date |
|---|---|---|
| 8611541 | xhyuo | 2023-02-21 |
# [1] 2
| Version | Author | Date |
|---|---|---|
| 8611541 | xhyuo | 2023-02-21 |

| Version | Author | Date |
|---|---|---|
| 8611541 | xhyuo | 2023-02-21 |

| Version | Author | Date |
|---|---|---|
| 8611541 | xhyuo | 2023-02-21 |
# [1] 3
| Version | Author | Date |
|---|---|---|
| 8611541 | xhyuo | 2023-02-21 |
| Version | Author | Date |
|---|---|---|
| 8611541 | xhyuo | 2023-02-21 |
| Version | Author | Date |
|---|---|---|
| 8611541 | xhyuo | 2023-02-21 |
# [1] "RR.Depression.Rate.Hr"
# [1] "Time.to.Steady.RR.Depression.Hr"
#   lodindex lodcolumn chr      pos      lod    ci_lo    ci_hi
# 1        1    pheno1  17 33.66364 6.021735 7.725897 35.02144
# [1] 1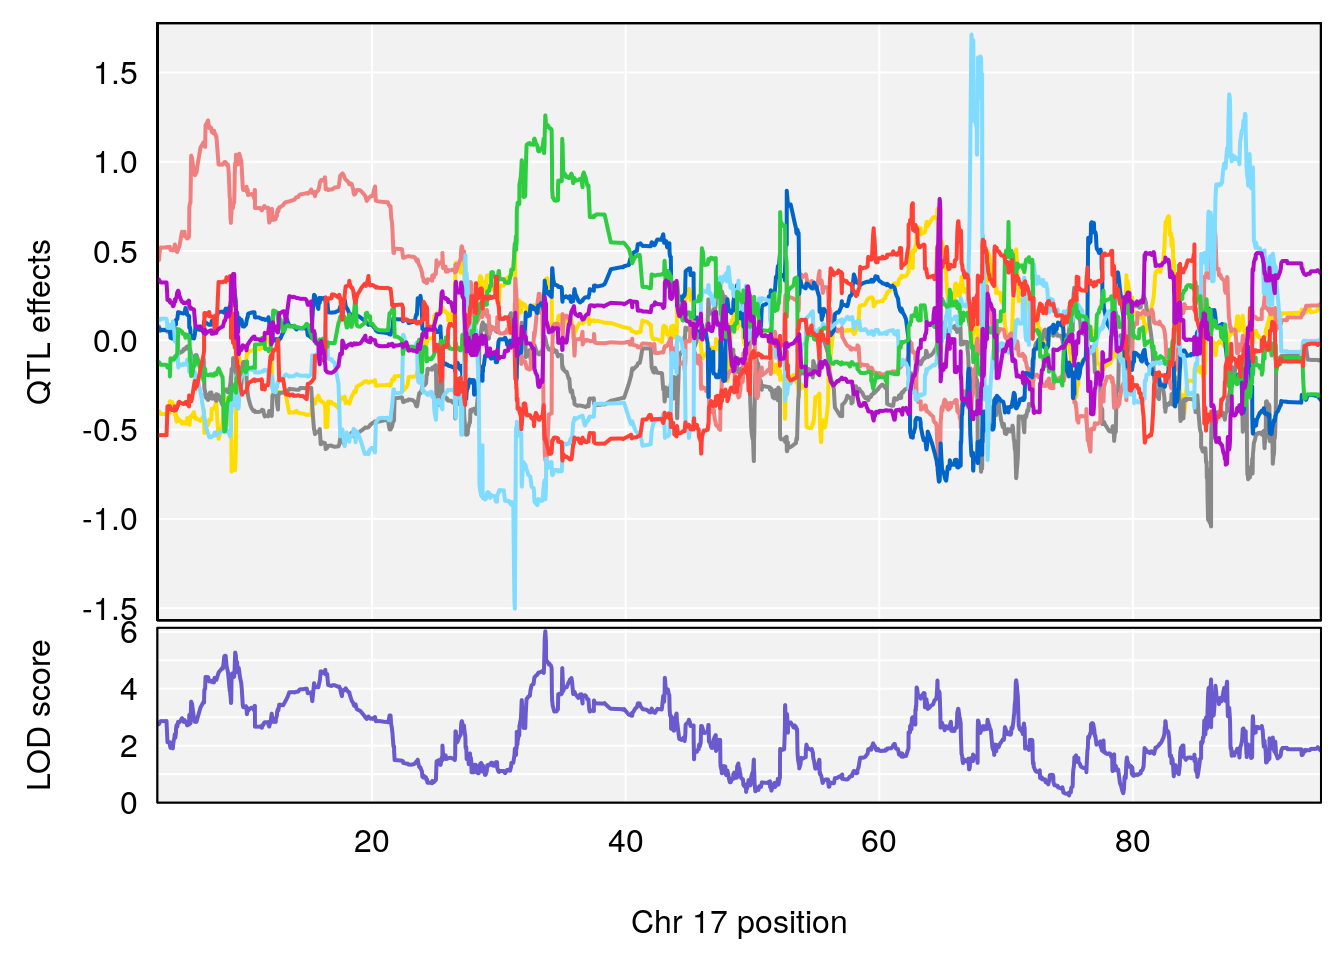
| Version | Author | Date |
|---|---|---|
| 8611541 | xhyuo | 2023-02-21 |
| Version | Author | Date |
|---|---|---|
| 8611541 | xhyuo | 2023-02-21 |

| Version | Author | Date |
|---|---|---|
| 8611541 | xhyuo | 2023-02-21 |
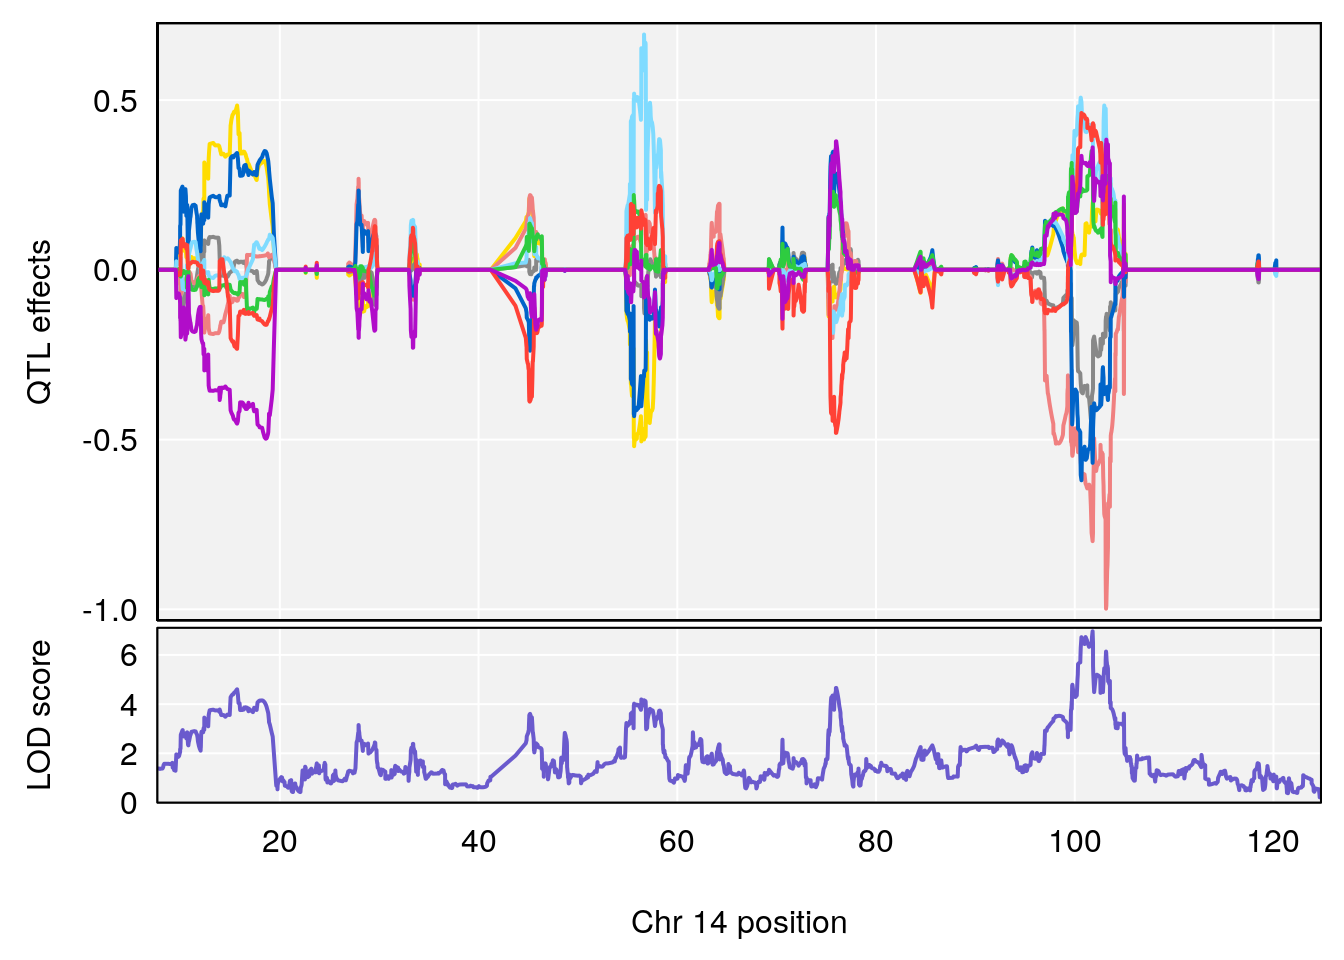
# [1] "Min.Depression.RR"
#   lodindex lodcolumn chr     pos      lod    ci_lo    ci_hi
# 1        1    pheno1  14 101.798 6.961191 100.3058 103.3399
# [1] 1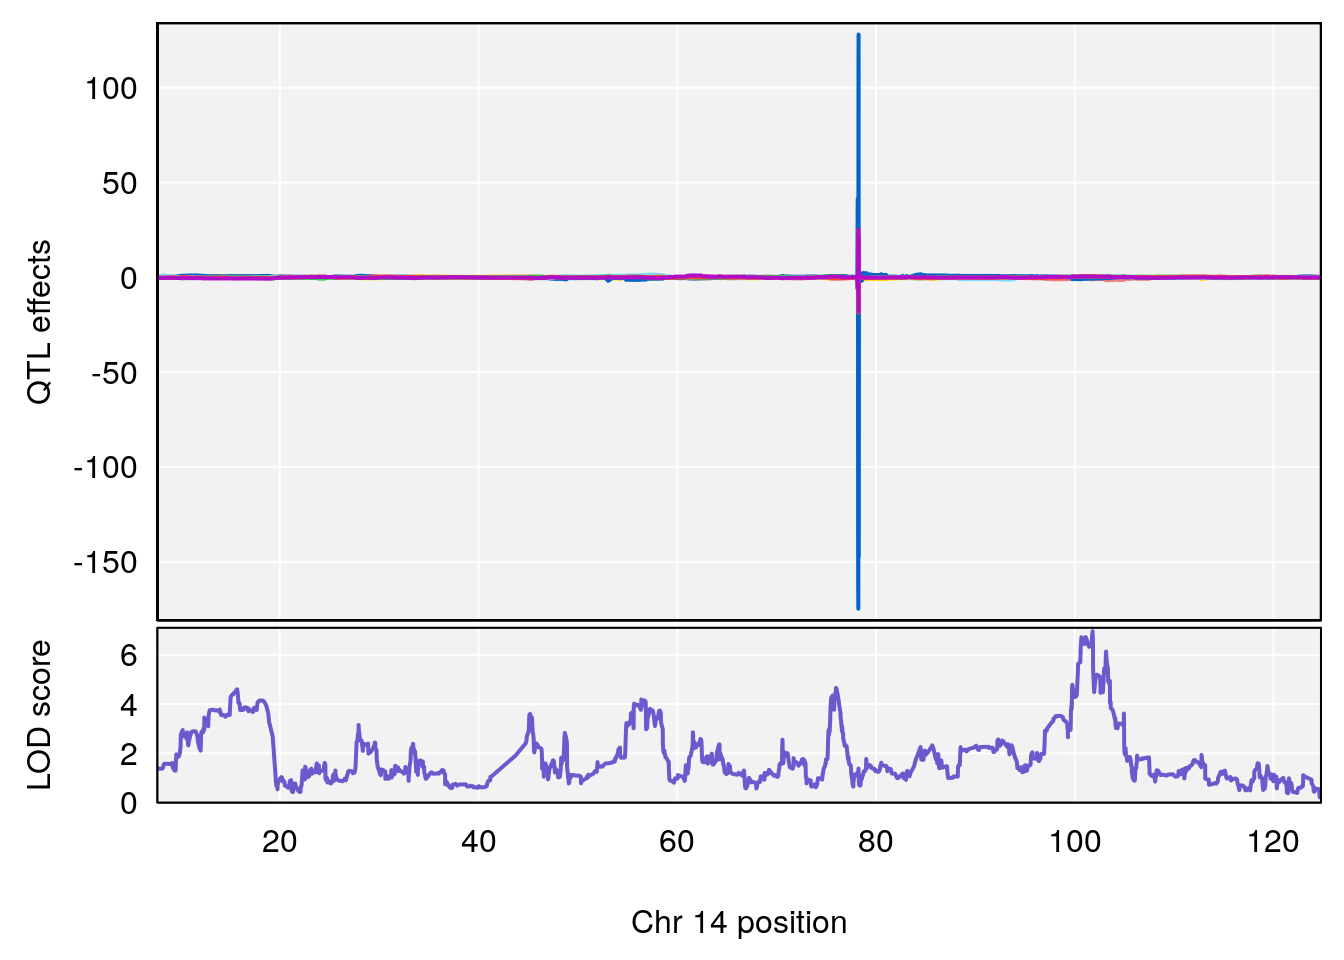
| Version | Author | Date |
|---|---|---|
| 8611541 | xhyuo | 2023-02-21 |
| Version | Author | Date |
|---|---|---|
| 8611541 | xhyuo | 2023-02-21 |

| Version | Author | Date |
|---|---|---|
| 8611541 | xhyuo | 2023-02-21 |
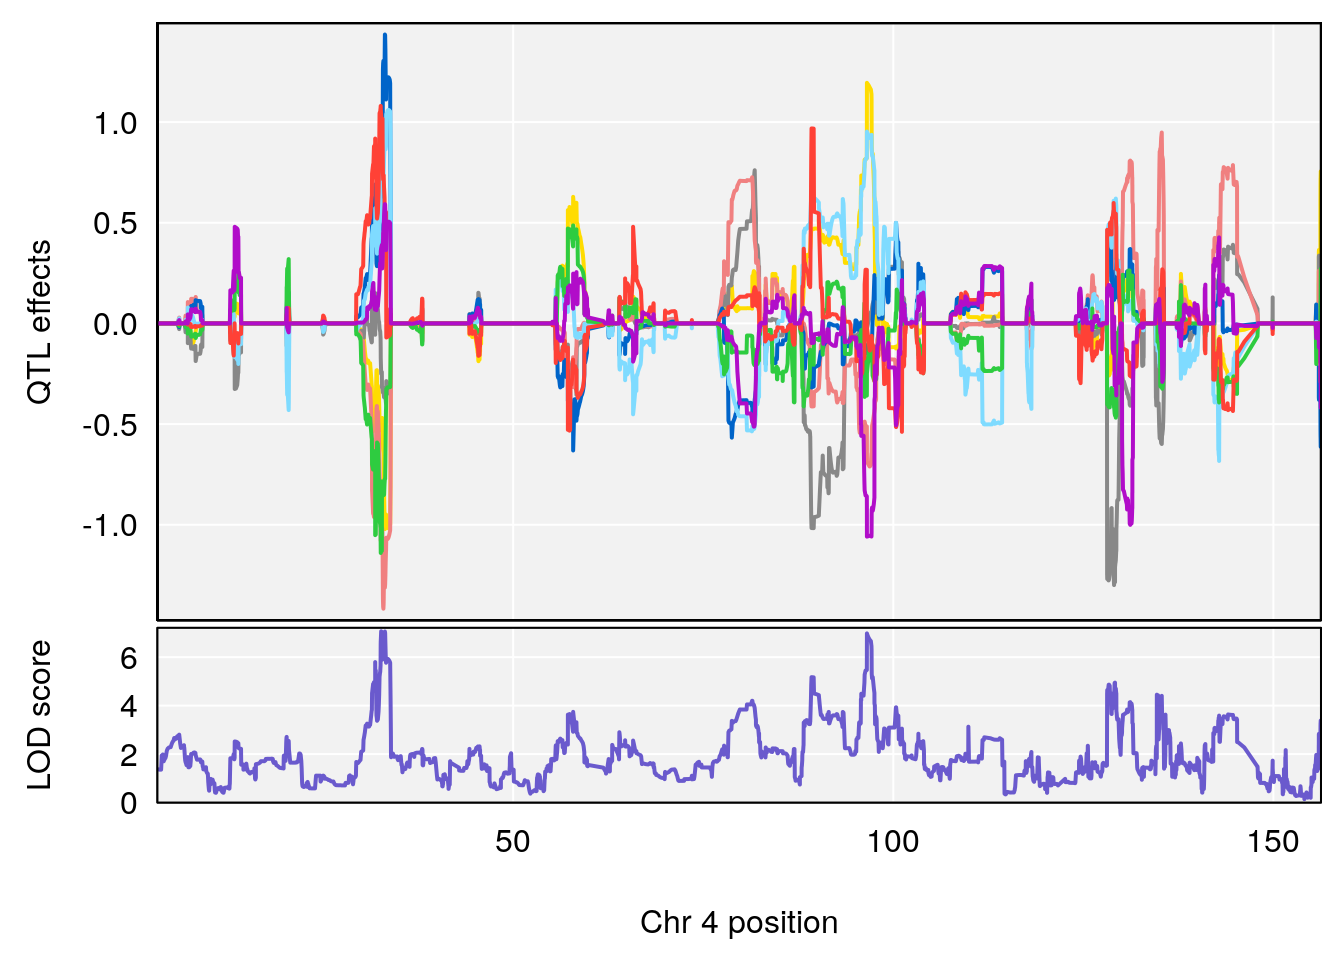
# [1] "Mean.Depression.BR"
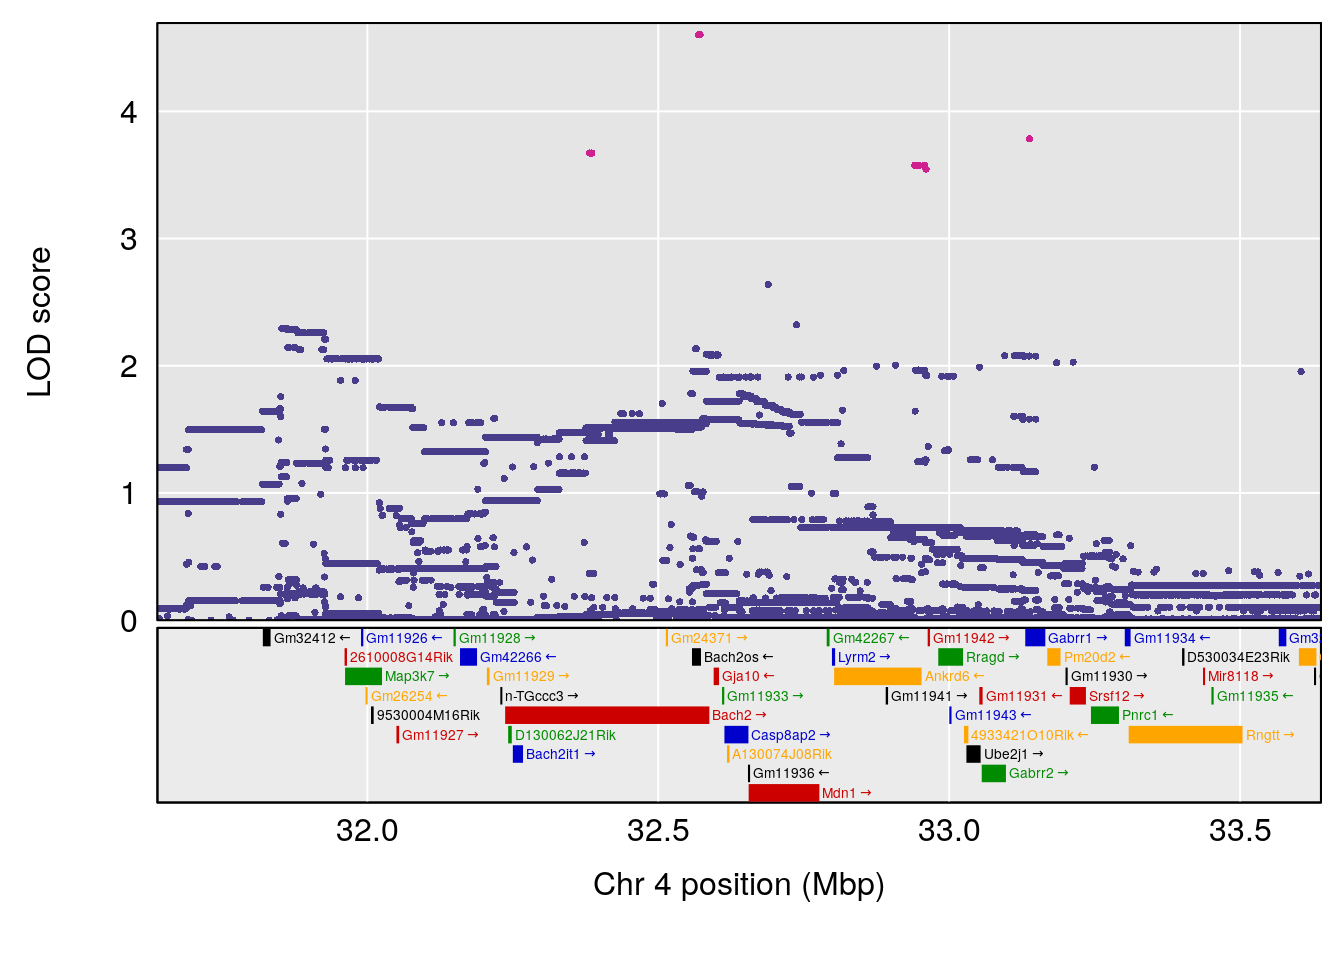
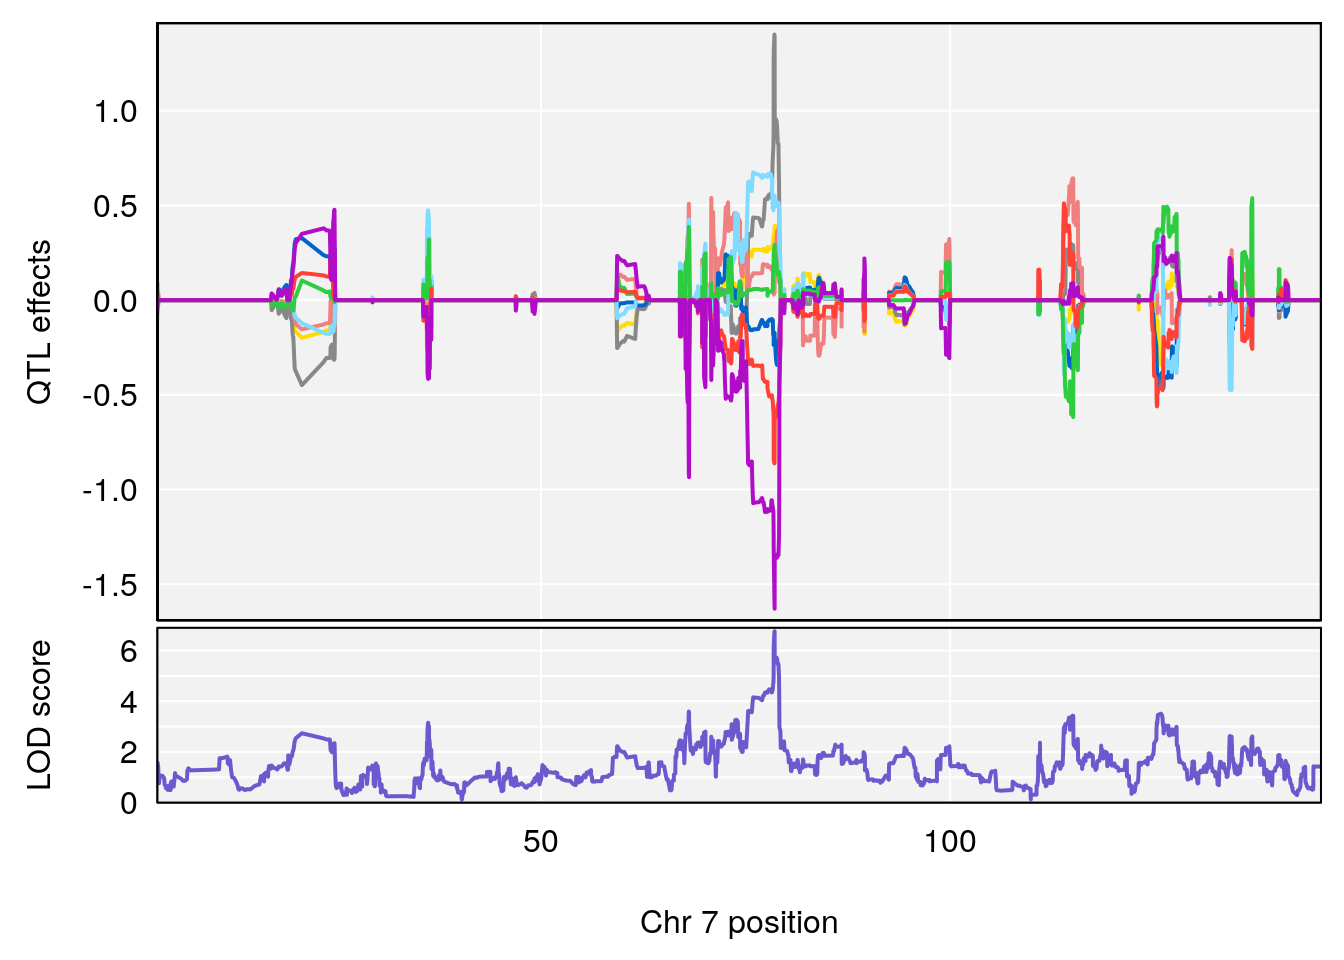
# [1] "SteadyState.Depression.Duration.Hr"
# lodindex lodcolumn chr pos lod ci_lo ci_hi
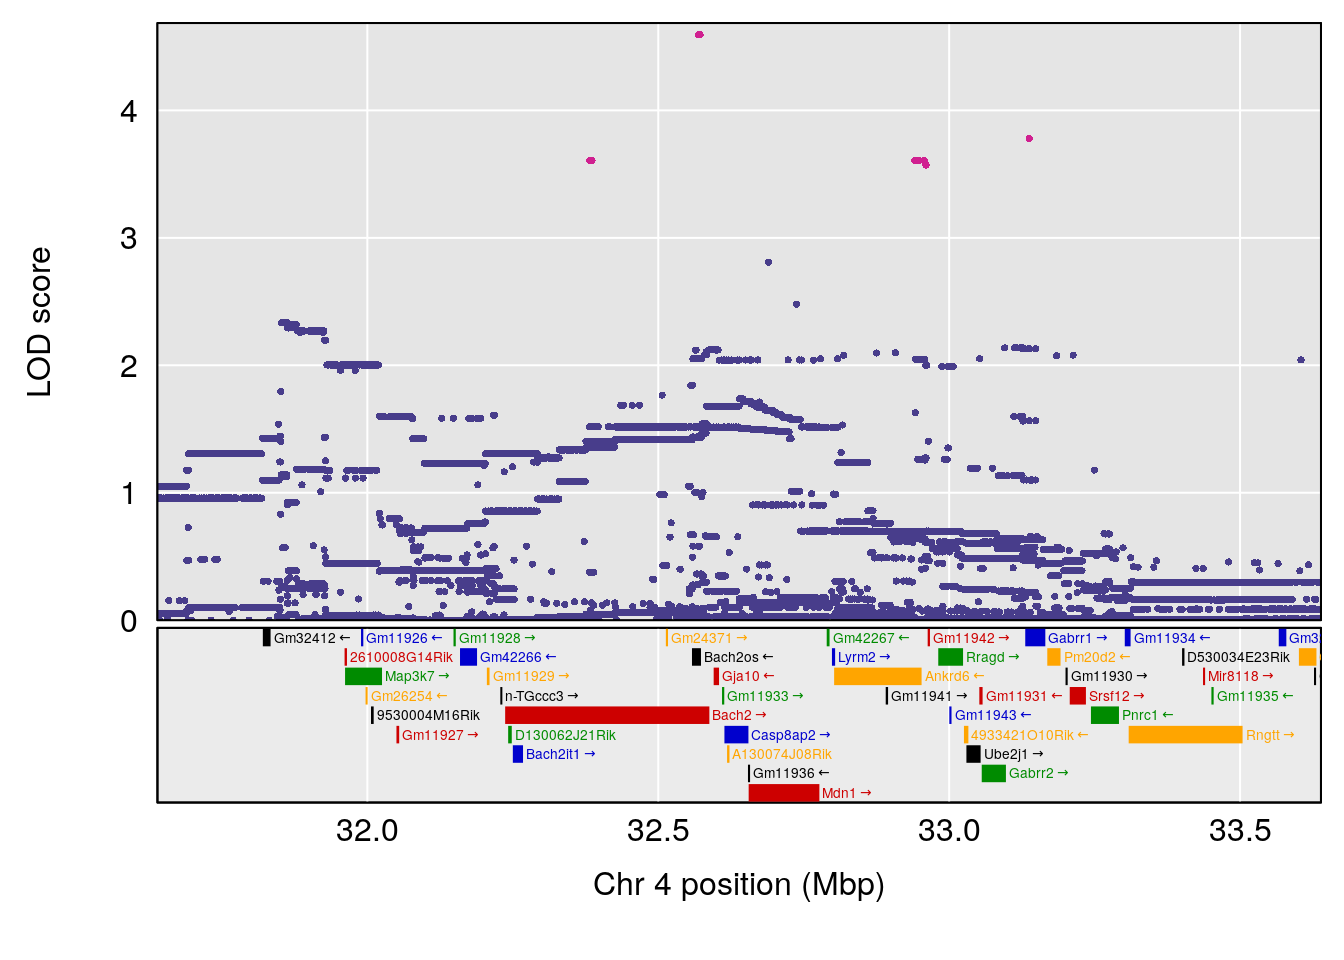
# 1 1 pheno1 4 32.63908 7.066593 31.85079 97.16594
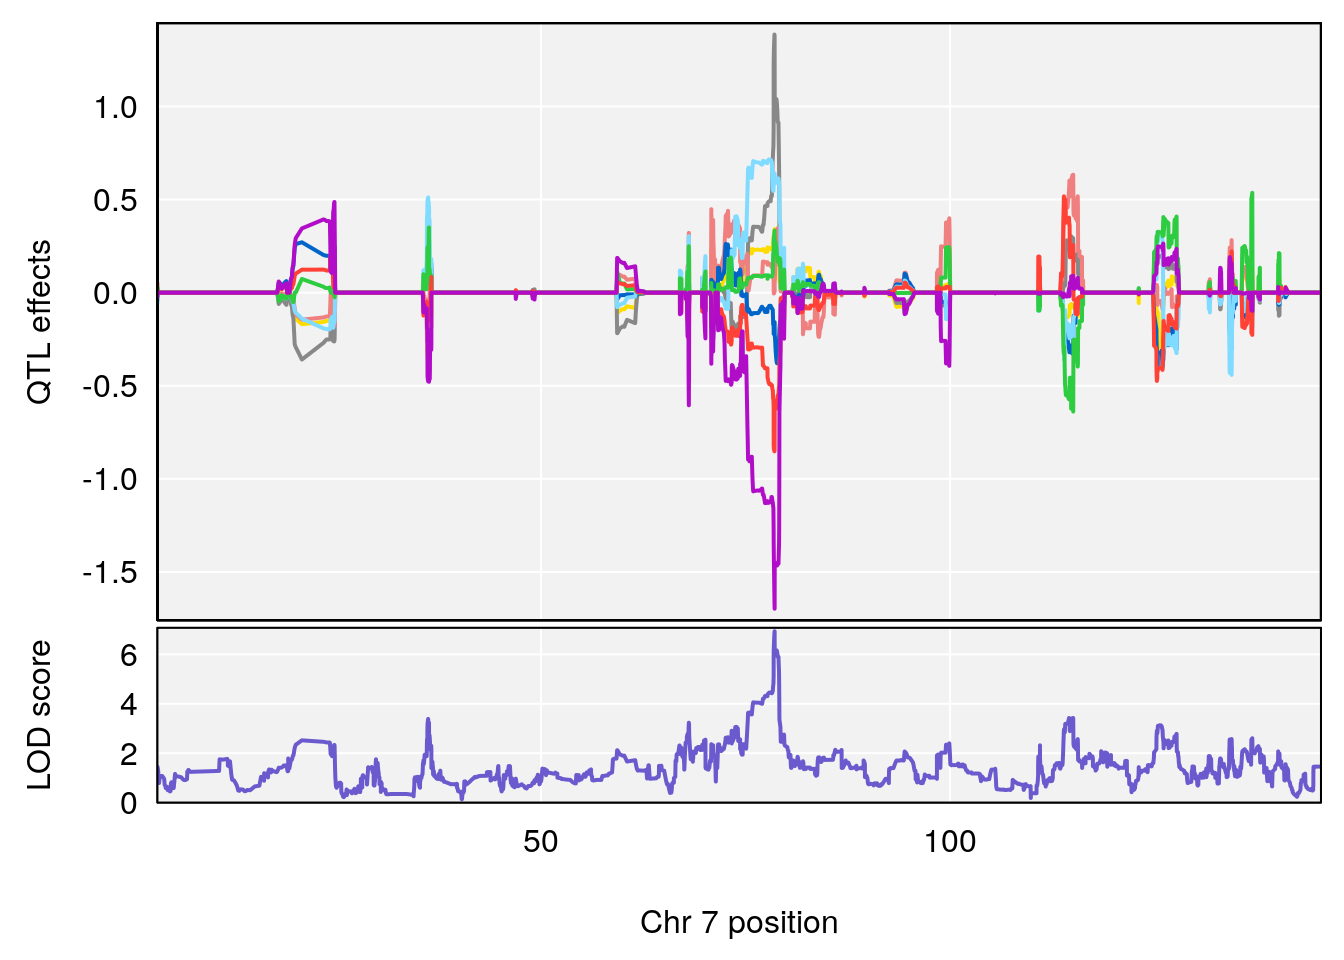
# 2 1 pheno1 7 78.55130 6.765506 78.43609 79.07406
# 3 1 pheno1 15 82.95976 6.039949 82.61311 84.16285
# [1] 1
| Version | Author | Date |
|---|---|---|
| 8611541 | xhyuo | 2023-02-21 |
| Version | Author | Date |
|---|---|---|
| 8611541 | xhyuo | 2023-02-21 |

| Version | Author | Date |
|---|---|---|
| 8611541 | xhyuo | 2023-02-21 |
# [1] 2
| Version | Author | Date |
|---|---|---|
| 8611541 | xhyuo | 2023-02-21 |

| Version | Author | Date |
|---|---|---|
| 8611541 | xhyuo | 2023-02-21 |

| Version | Author | Date |
|---|---|---|
| 8611541 | xhyuo | 2023-02-21 |
# [1] 3
| Version | Author | Date |
|---|---|---|
| 8611541 | xhyuo | 2023-02-21 |

| Version | Author | Date |
|---|---|---|
| 8611541 | xhyuo | 2023-02-21 |

| Version | Author | Date |
|---|---|---|
| 8611541 | xhyuo | 2023-02-21 |
# [1] "Time.to.Threshold.Recovery.Hr"
#   lodindex lodcolumn chr      pos      lod    ci_lo    ci_hi
# 1        1    pheno1  10 60.61789 6.163288 59.50257 61.79358
# [1] 1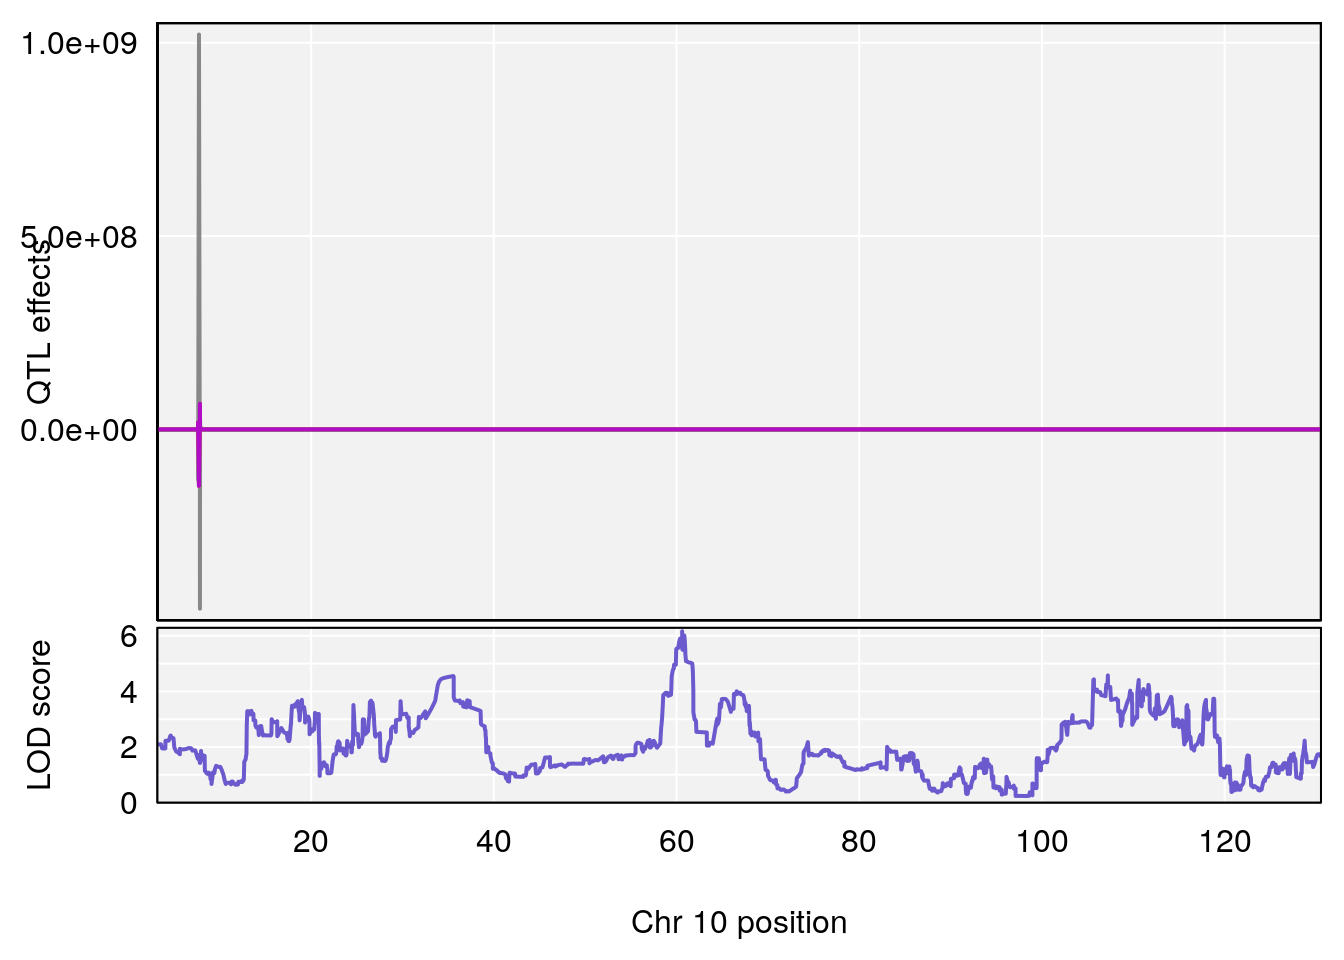
| Version | Author | Date |
|---|---|---|
| 8611541 | xhyuo | 2023-02-21 |
| Version | Author | Date |
|---|---|---|
| 8611541 | xhyuo | 2023-02-21 |

| Version | Author | Date |
|---|---|---|
| 8611541 | xhyuo | 2023-02-21 |
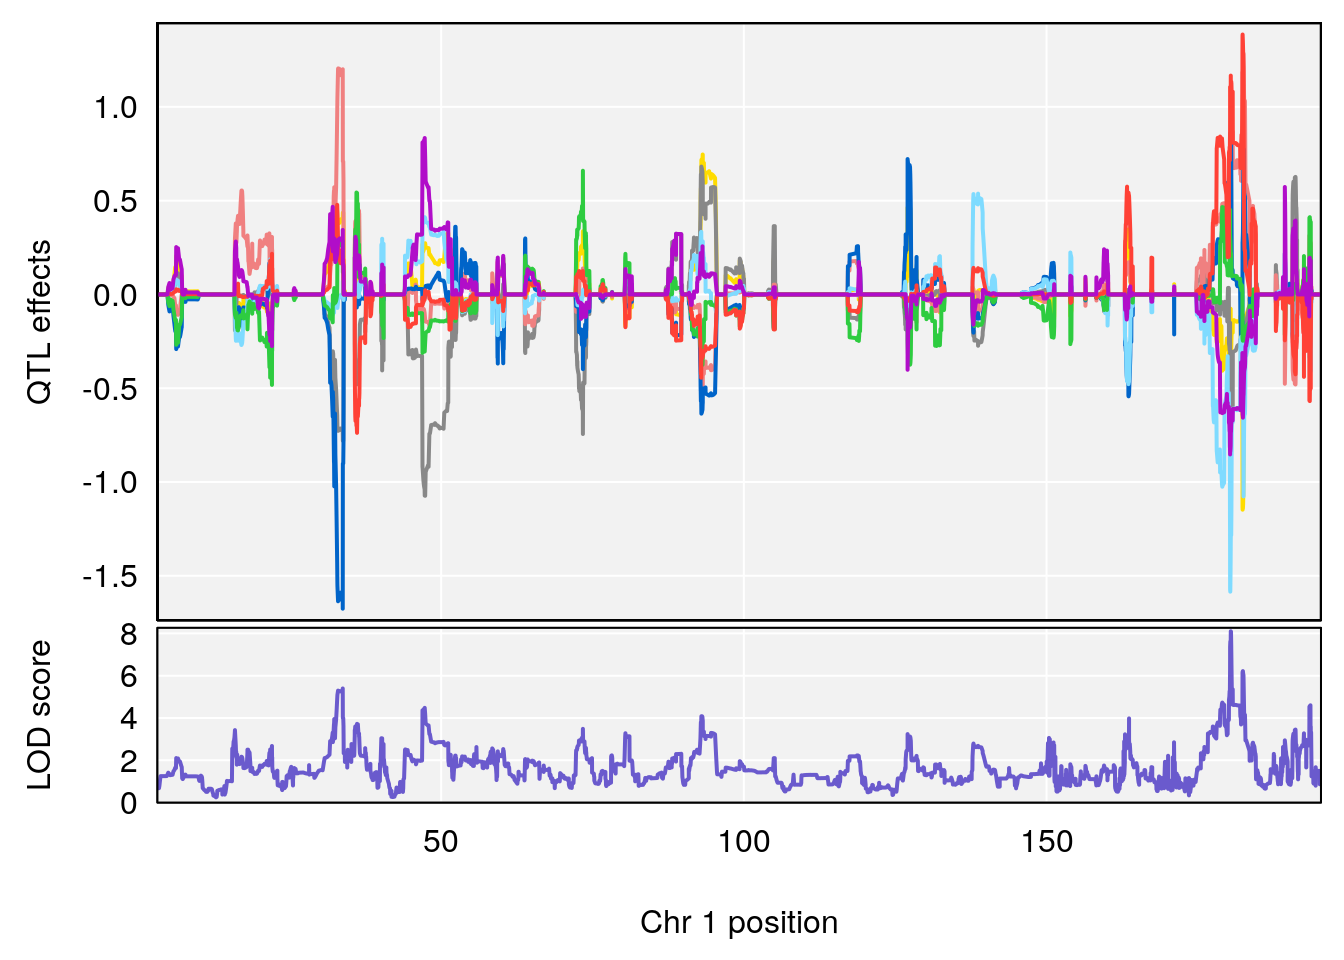
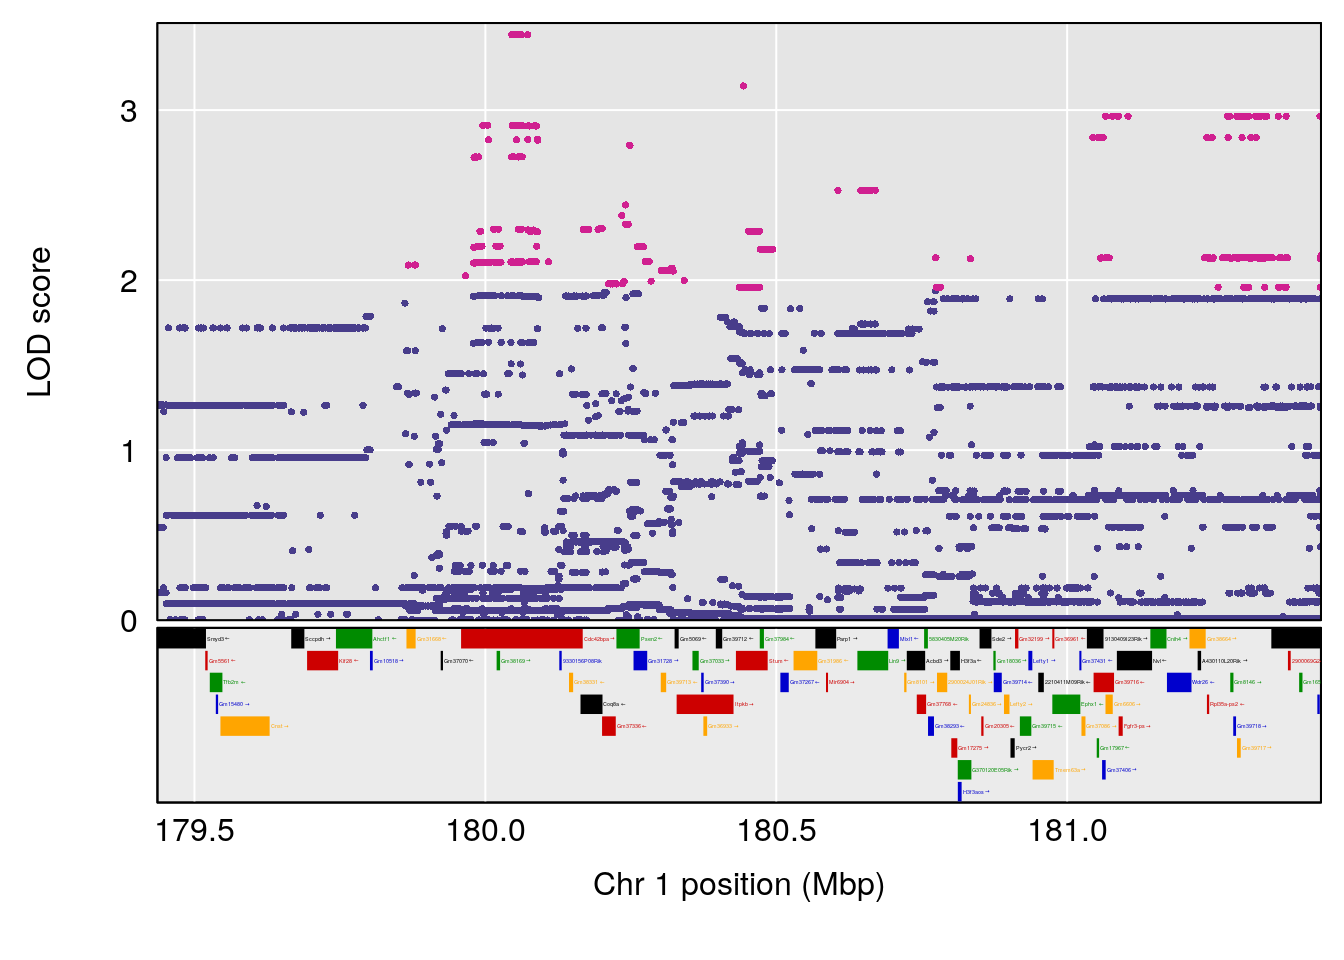
# [1] "Time.to.Projected.Recovery.Hr"
#   lodindex lodcolumn chr      pos      lod    ci_lo    ci_hi
# 1        1    pheno1   1 180.4362 8.101813 180.3185 180.5471
# [1] 1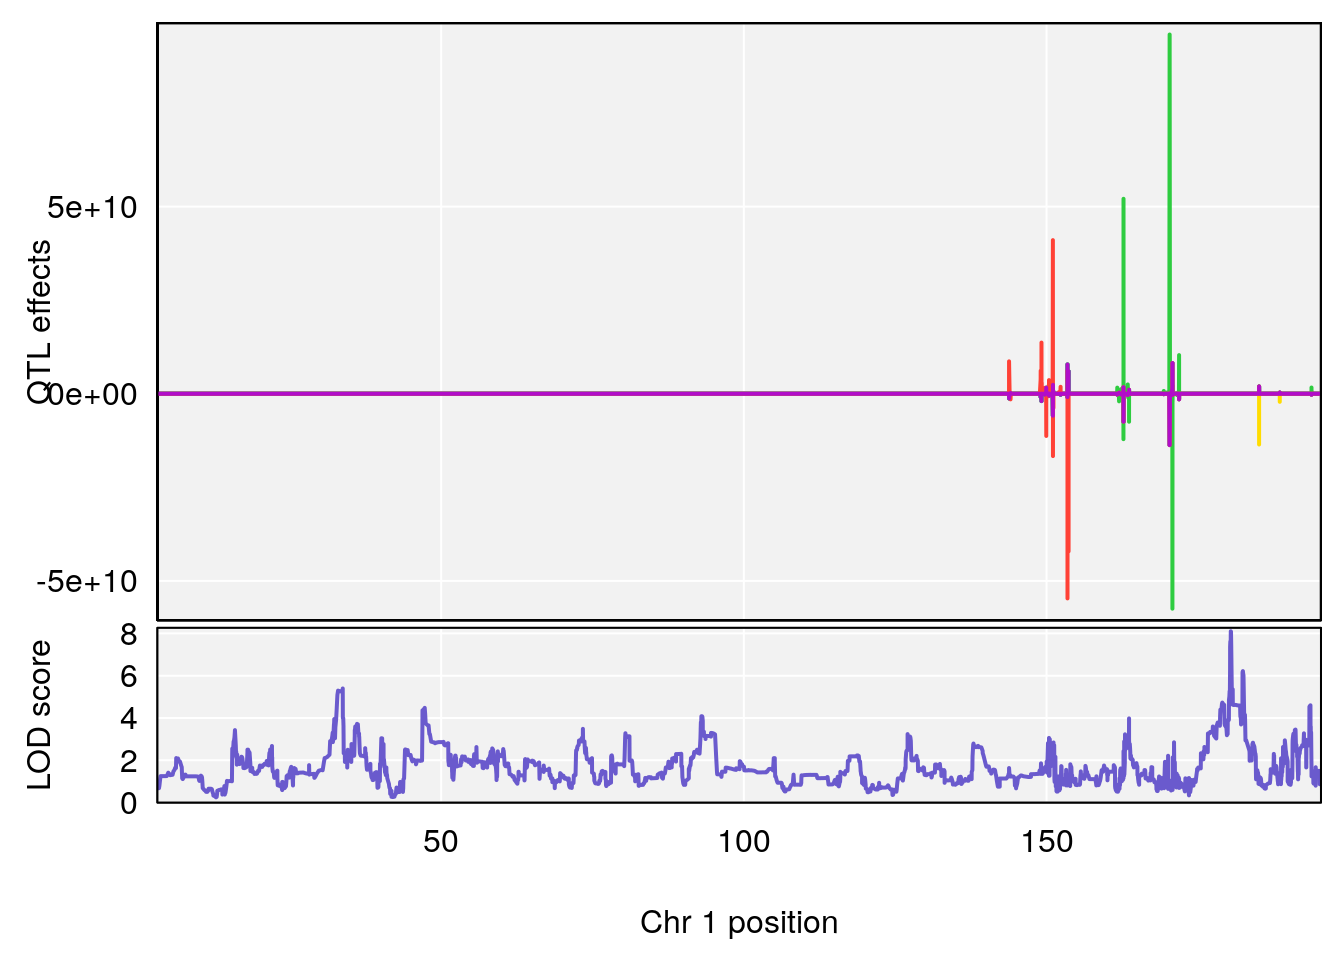
| Version | Author | Date |
|---|---|---|
| 8611541 | xhyuo | 2023-02-21 |
| Version | Author | Date |
|---|---|---|
| 8611541 | xhyuo | 2023-02-21 |
| Version | Author | Date |
|---|---|---|
| 8611541 | xhyuo | 2023-02-21 |
# [1] "Start.of.Recovery.Hr"
#   lodindex lodcolumn chr      pos      lod    ci_lo    ci_hi
# 1        1    pheno1   4 32.63908 7.105498 31.85079 97.15470
# 2        1    pheno1   7 78.55130 6.935599 78.43609 79.07697
# 3        1    pheno1  15 82.95976 6.085487 76.08766 84.17742
# [1] 1
| Version | Author | Date |
|---|---|---|
| 8611541 | xhyuo | 2023-02-21 |
| Version | Author | Date |
|---|---|---|
| 8611541 | xhyuo | 2023-02-21 |

| Version | Author | Date |
|---|---|---|
| 8611541 | xhyuo | 2023-02-21 |
# [1] 2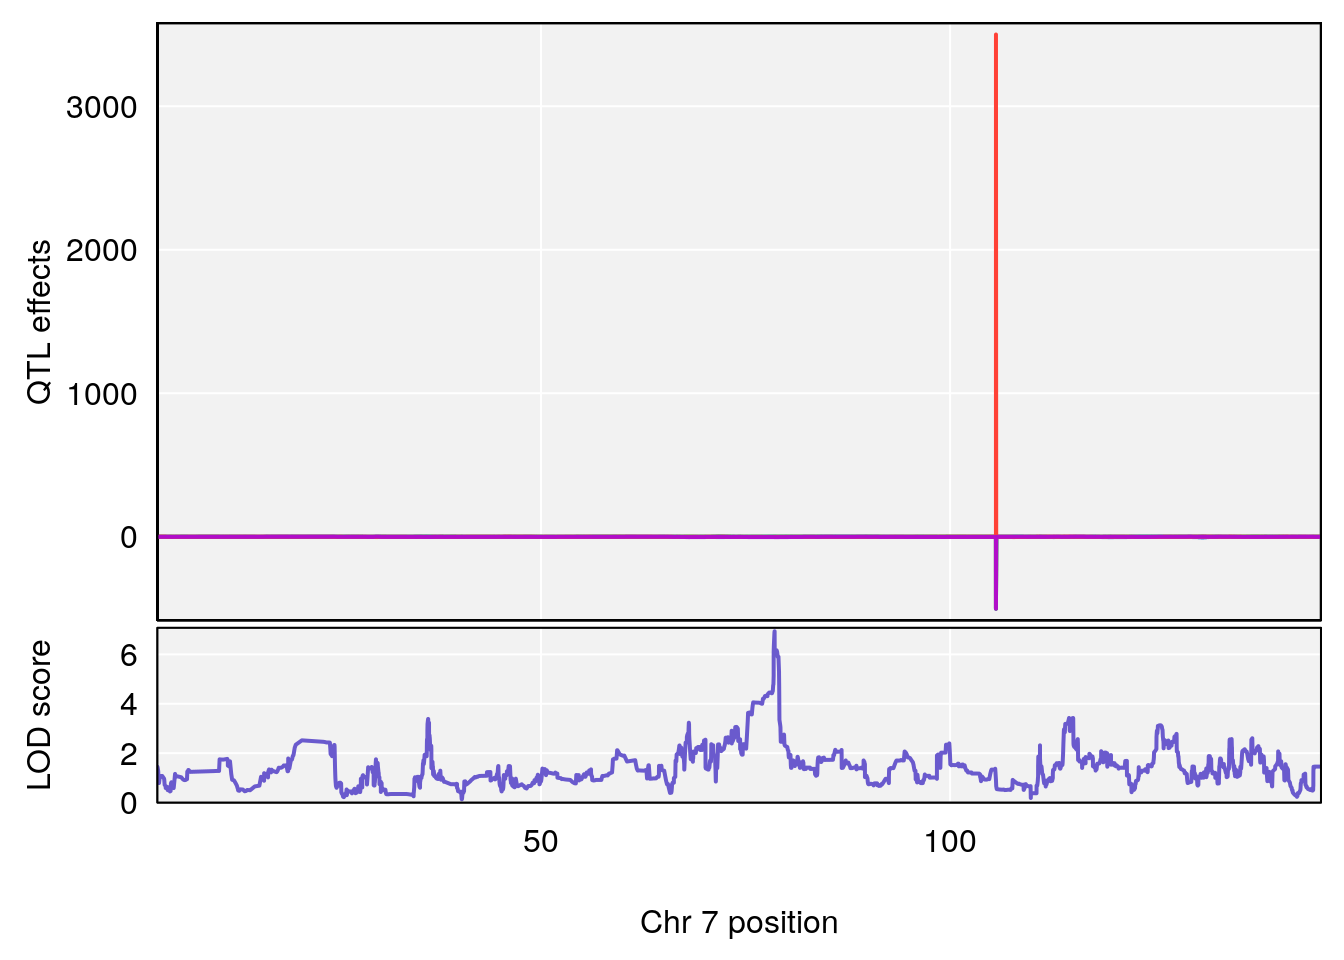
| Version | Author | Date |
|---|---|---|
| 8611541 | xhyuo | 2023-02-21 |

| Version | Author | Date |
|---|---|---|
| 8611541 | xhyuo | 2023-02-21 |
| Version | Author | Date |
|---|---|---|
| 8611541 | xhyuo | 2023-02-21 |
# [1] 3
| Version | Author | Date |
|---|---|---|
| 8611541 | xhyuo | 2023-02-21 |
| Version | Author | Date |
|---|---|---|
| 8611541 | xhyuo | 2023-02-21 |

| Version | Author | Date |
|---|---|---|
| 8611541 | xhyuo | 2023-02-21 |
# [1] "RR.Recovery.Rate.Hr"
#   lodindex lodcolumn chr       pos      lod     ci_lo     ci_hi
# 1        1    pheno1   3 152.71526 6.057558 151.92564 153.04206
# 2        1    pheno1  12  82.52881 6.219487  46.37269  82.84506
# [1] 1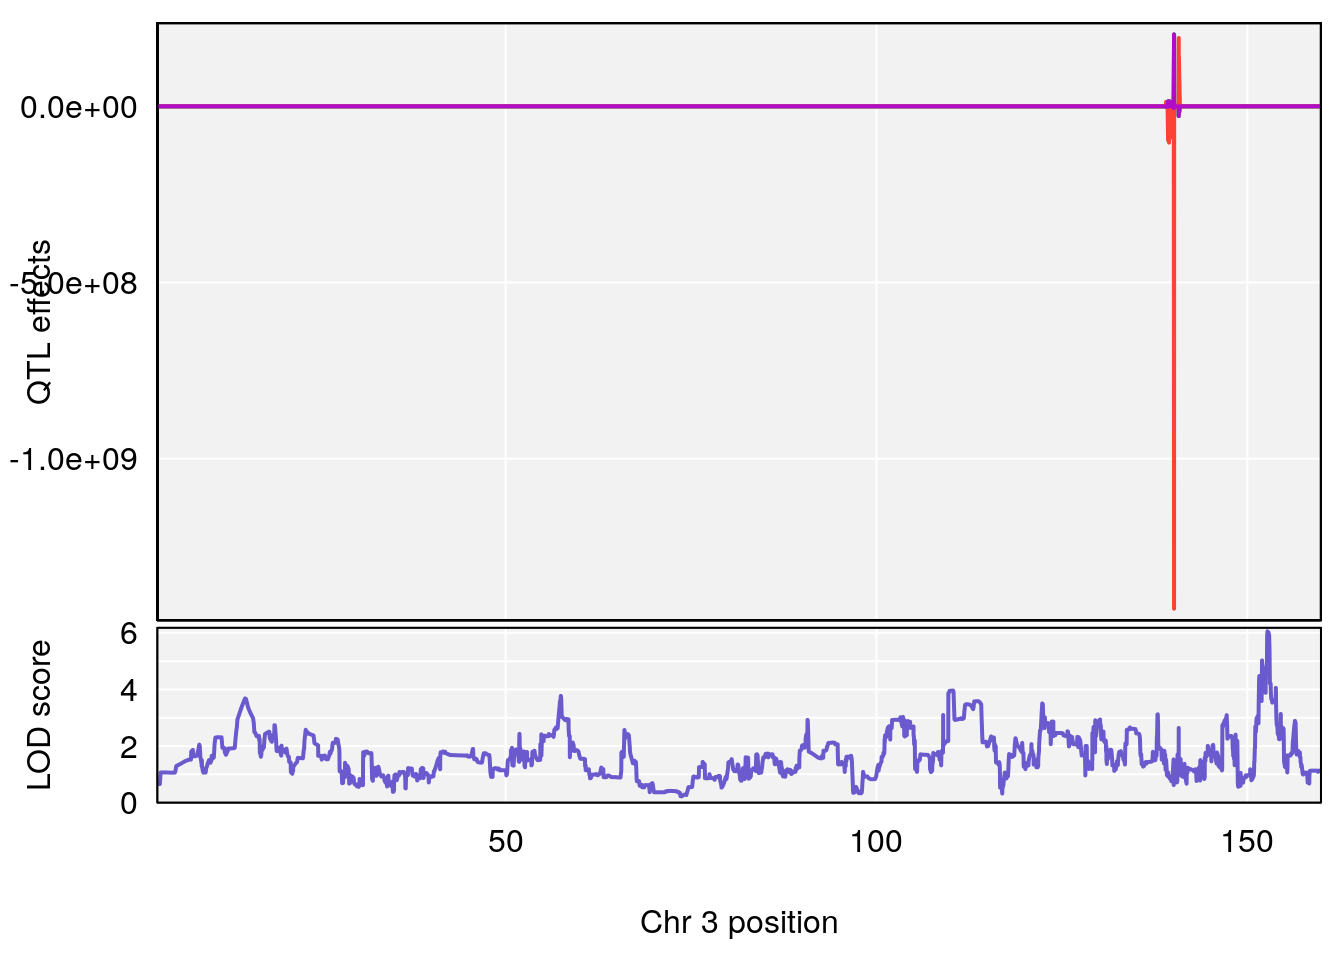
| Version | Author | Date |
|---|---|---|
| 8611541 | xhyuo | 2023-02-21 |
| Version | Author | Date |
|---|---|---|
| 8611541 | xhyuo | 2023-02-21 |

| Version | Author | Date |
|---|---|---|
| 8611541 | xhyuo | 2023-02-21 |
# [1] 2
| Version | Author | Date |
|---|---|---|
| 8611541 | xhyuo | 2023-02-21 |
| Version | Author | Date |
|---|---|---|
| 8611541 | xhyuo | 2023-02-21 |
| Version | Author | Date |
|---|---|---|
| 8611541 | xhyuo | 2023-02-21 |
# [1] "Min.Depression.BR"
#   lodindex lodcolumn chr      pos      lod    ci_lo    ci_hi
# 1        1    pheno1   6 124.4987 6.882637 122.7691 125.5986
# [1] 1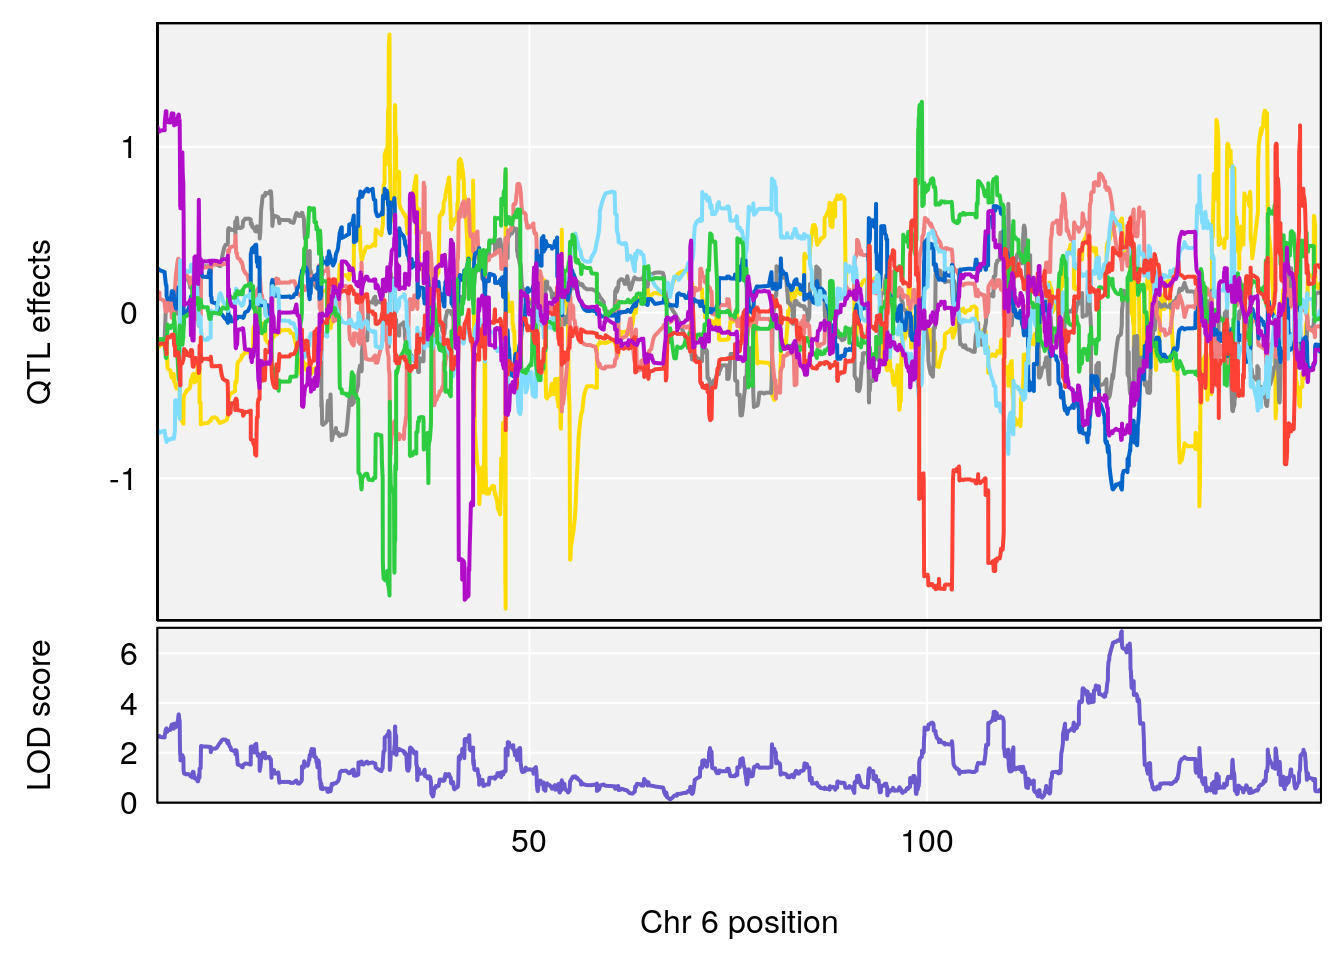
| Version | Author | Date |
|---|---|---|
| 8611541 | xhyuo | 2023-02-21 |
| Version | Author | Date |
|---|---|---|
| 8611541 | xhyuo | 2023-02-21 |
| Version | Author | Date |
|---|---|---|
| 8611541 | xhyuo | 2023-02-21 |
# [1] "Time.to.Mostly.Dead.Hr"
#   lodindex lodcolumn chr       pos      lod    ci_lo     ci_hi
# 1        1    pheno1   2 115.56002 6.027351 37.81483 132.19814
# 2        1    pheno1  10  16.47363 7.647309 16.28585  18.20019
# 3        1    pheno1  11  30.45329 6.071616 28.81595  31.56268
# 4        1    pheno1  17  80.09690 6.490398 23.55316  80.36008
# [1] 1
| Version | Author | Date |
|---|---|---|
| 8611541 | xhyuo | 2023-02-21 |

| Version | Author | Date |
|---|---|---|
| 8611541 | xhyuo | 2023-02-21 |
| Version | Author | Date |
|---|---|---|
| 8611541 | xhyuo | 2023-02-21 |
# [1] 2
| Version | Author | Date |
|---|---|---|
| 8611541 | xhyuo | 2023-02-21 |

| Version | Author | Date |
|---|---|---|
| 8611541 | xhyuo | 2023-02-21 |

| Version | Author | Date |
|---|---|---|
| 8611541 | xhyuo | 2023-02-21 |
# [1] 3
| Version | Author | Date |
|---|---|---|
| 8611541 | xhyuo | 2023-02-21 |

| Version | Author | Date |
|---|---|---|
| 8611541 | xhyuo | 2023-02-21 |

| Version | Author | Date |
|---|---|---|
| 8611541 | xhyuo | 2023-02-21 |
# [1] 4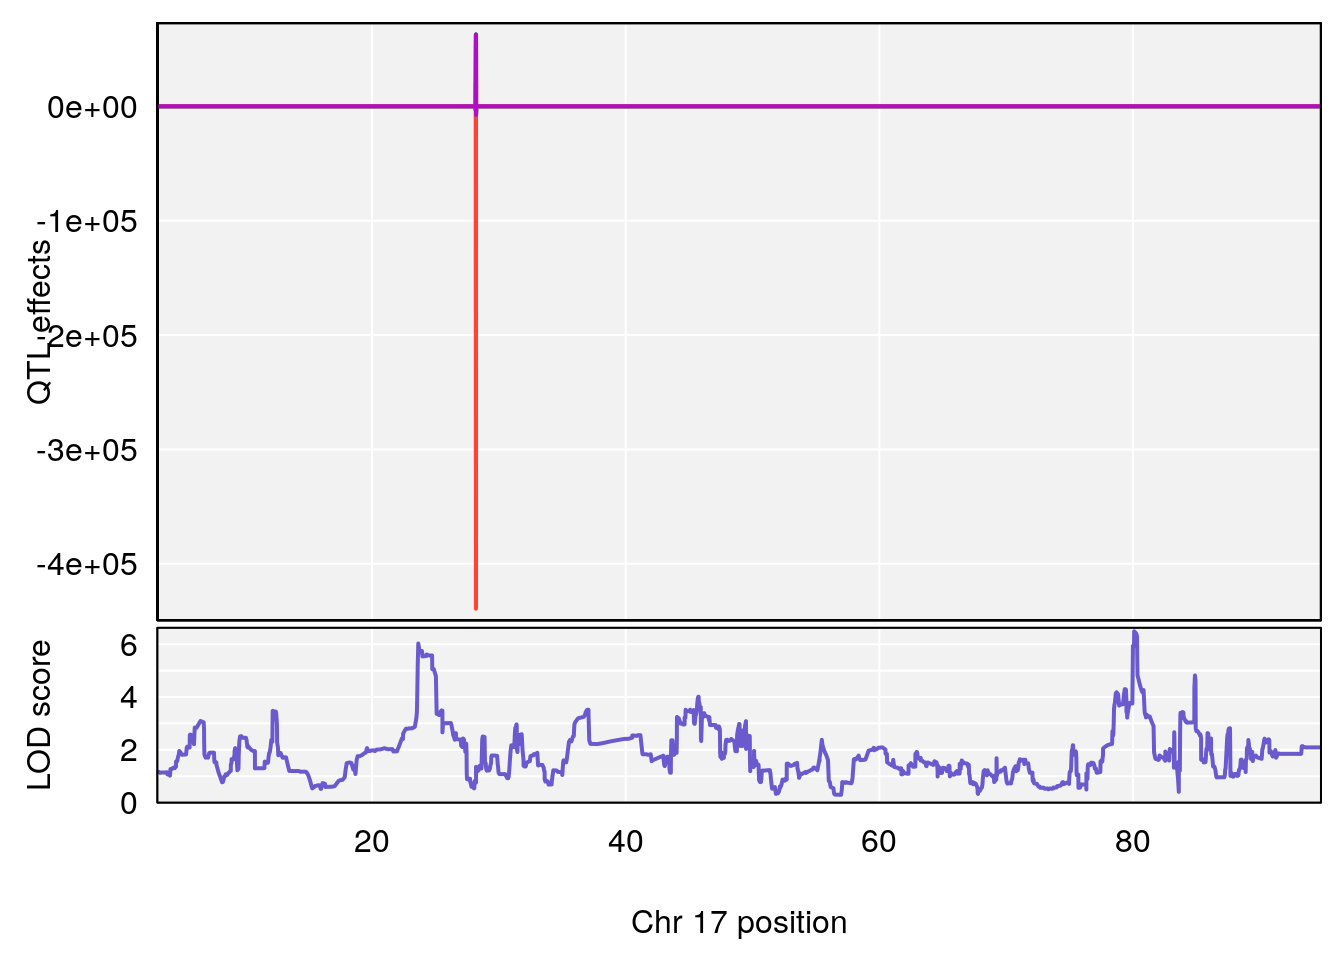
| Version | Author | Date |
|---|---|---|
| 8611541 | xhyuo | 2023-02-21 |

| Version | Author | Date |
|---|---|---|
| 8611541 | xhyuo | 2023-02-21 |

| Version | Author | Date |
|---|---|---|
| 8611541 | xhyuo | 2023-02-21 |
# [1] "Time.to.Recovery.Hr"
#   lodindex lodcolumn chr       pos      lod    ci_lo     ci_hi
# 1        1    pheno1   3 148.59948 6.440788 53.60570 148.61250
# 2        1    pheno1   4  22.26230 6.109573 17.41576 137.08866
# 3        1    pheno1  10  70.01089 7.242967 68.18103  70.90480
# 4        1    pheno1  14  80.19357 6.242259 79.67940  80.21217
# 5        1    pheno1  18  23.93757 6.888692 22.73513  24.98189
# [1] 1
| Version | Author | Date |
|---|---|---|
| 8611541 | xhyuo | 2023-02-21 |
| Version | Author | Date |
|---|---|---|
| 8611541 | xhyuo | 2023-02-21 |

| Version | Author | Date |
|---|---|---|
| 8611541 | xhyuo | 2023-02-21 |
# [1] 2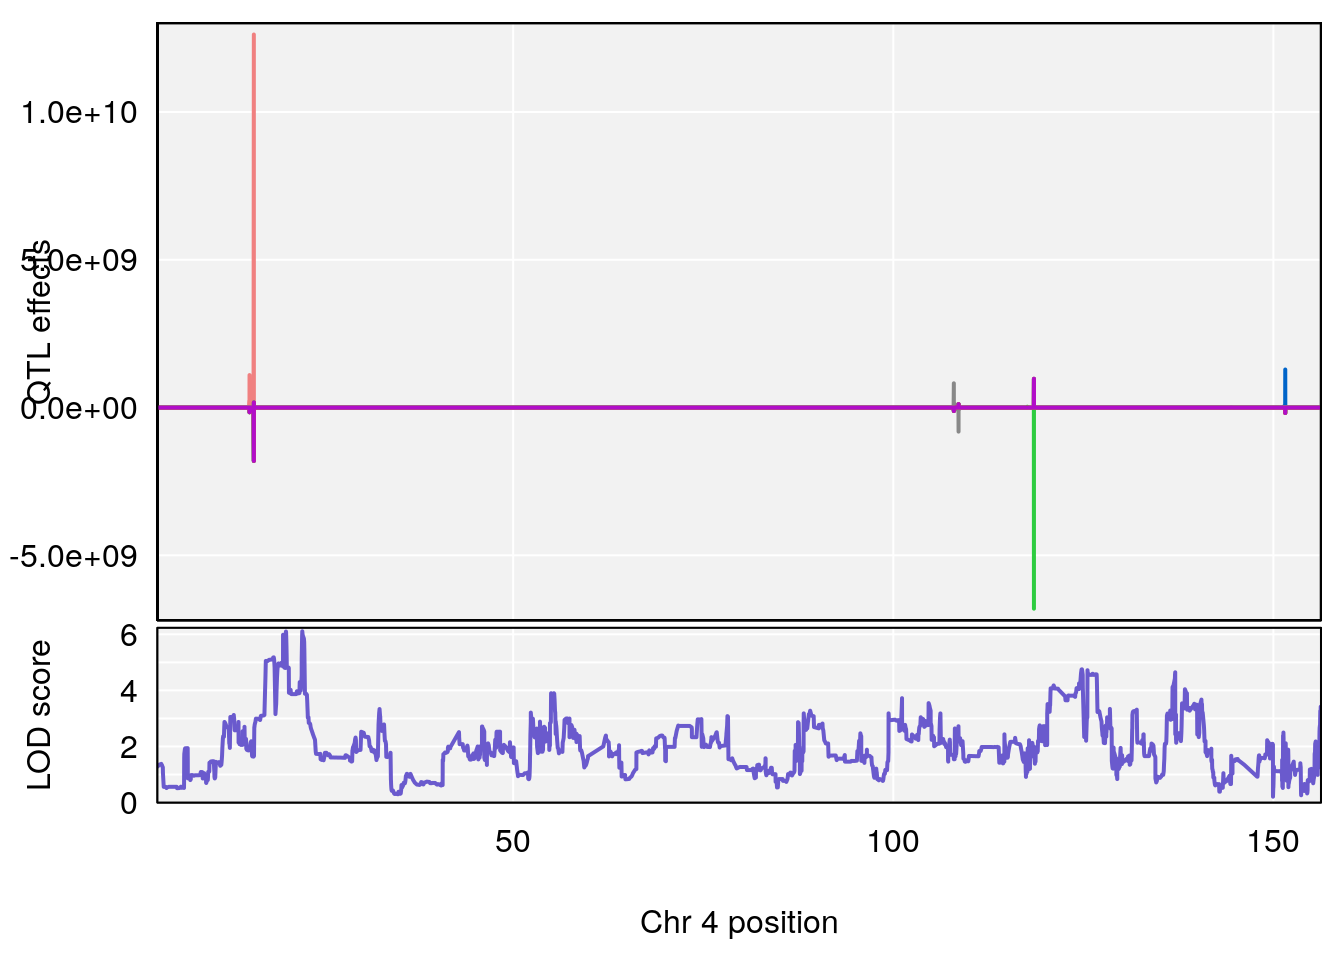
| Version | Author | Date |
|---|---|---|
| 8611541 | xhyuo | 2023-02-21 |
| Version | Author | Date |
|---|---|---|
| 8611541 | xhyuo | 2023-02-21 |
| Version | Author | Date |
|---|---|---|
| 8611541 | xhyuo | 2023-02-21 |
# [1] 3
| Version | Author | Date |
|---|---|---|
| 8611541 | xhyuo | 2023-02-21 |
| Version | Author | Date |
|---|---|---|
| 8611541 | xhyuo | 2023-02-21 |

| Version | Author | Date |
|---|---|---|
| 8611541 | xhyuo | 2023-02-21 |
# [1] 4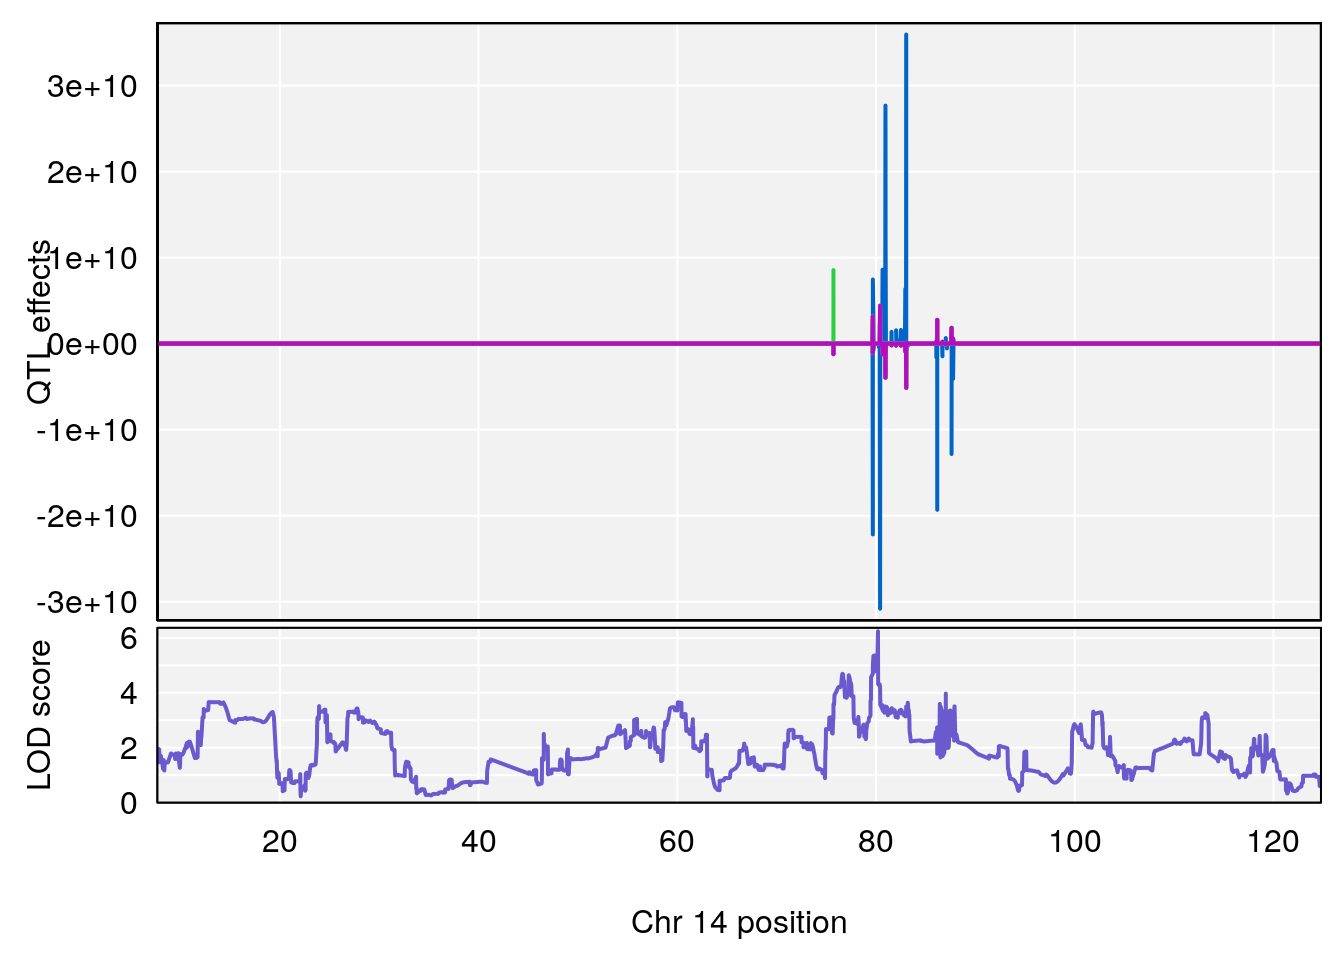
| Version | Author | Date |
|---|---|---|
| 8611541 | xhyuo | 2023-02-21 |
| Version | Author | Date |
|---|---|---|
| 8611541 | xhyuo | 2023-02-21 |
| Version | Author | Date |
|---|---|---|
| 8611541 | xhyuo | 2023-02-21 |
# [1] 5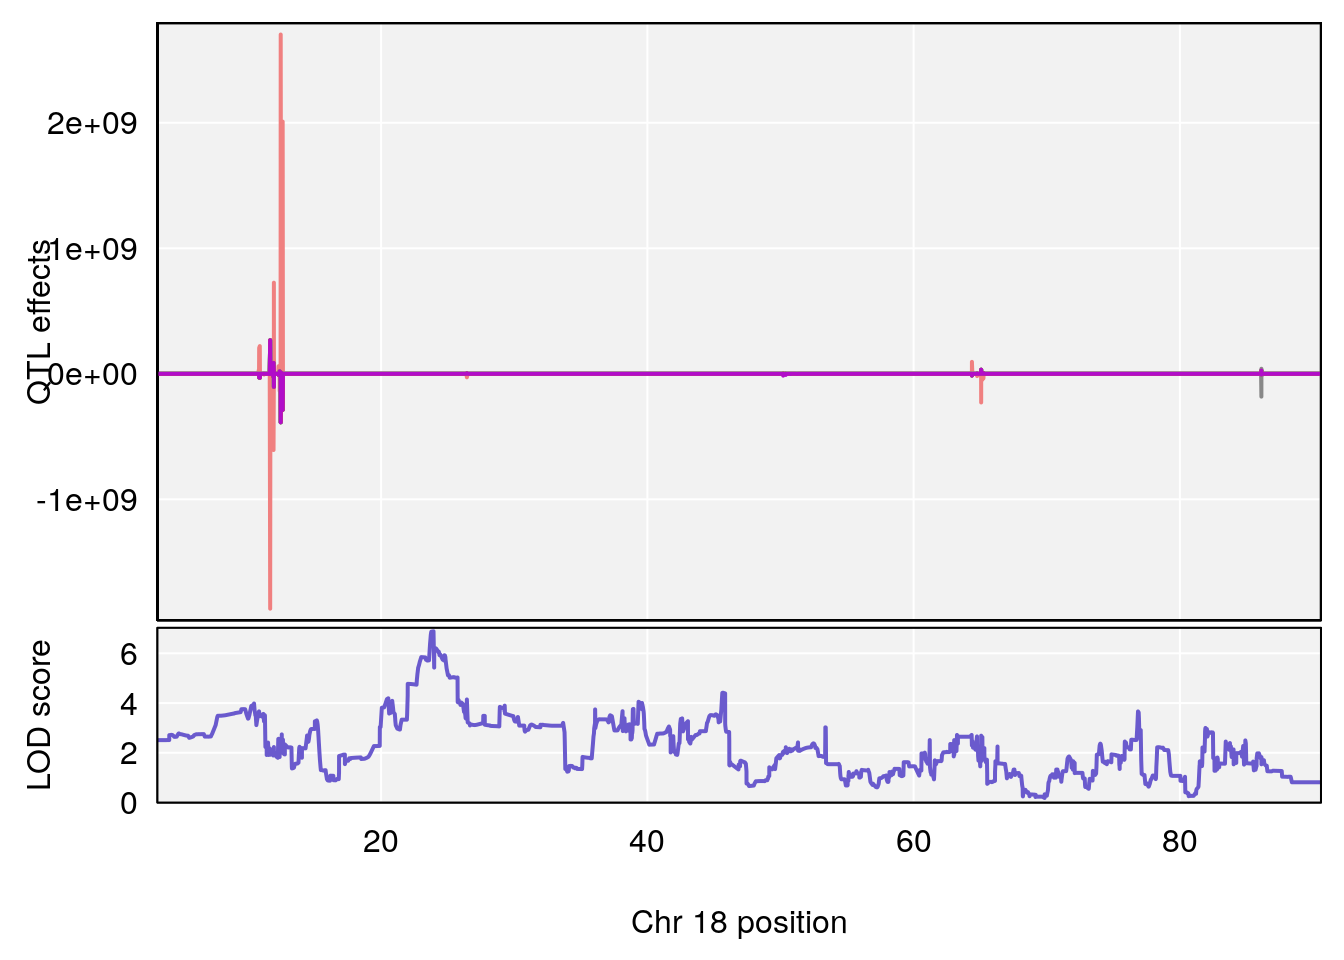
| Version | Author | Date |
|---|---|---|
| 8611541 | xhyuo | 2023-02-21 |

| Version | Author | Date |
|---|---|---|
| 8611541 | xhyuo | 2023-02-21 |

| Version | Author | Date |
|---|---|---|
| 8611541 | xhyuo | 2023-02-21 |
# [1] "Status_bin"
#   lodindex lodcolumn chr       pos      lod    ci_lo     ci_hi
# 1        1    pheno1   1 185.11874 6.058648 41.25093 185.84088
# 2        1    pheno1  15  94.25093 7.334412 92.19023  94.31234
# 3        1    pheno1  18  16.19240 6.685013 15.31898  20.05685
# 4        1    pheno1  19  49.78637 6.595691 45.70921  53.50149
# [1] 1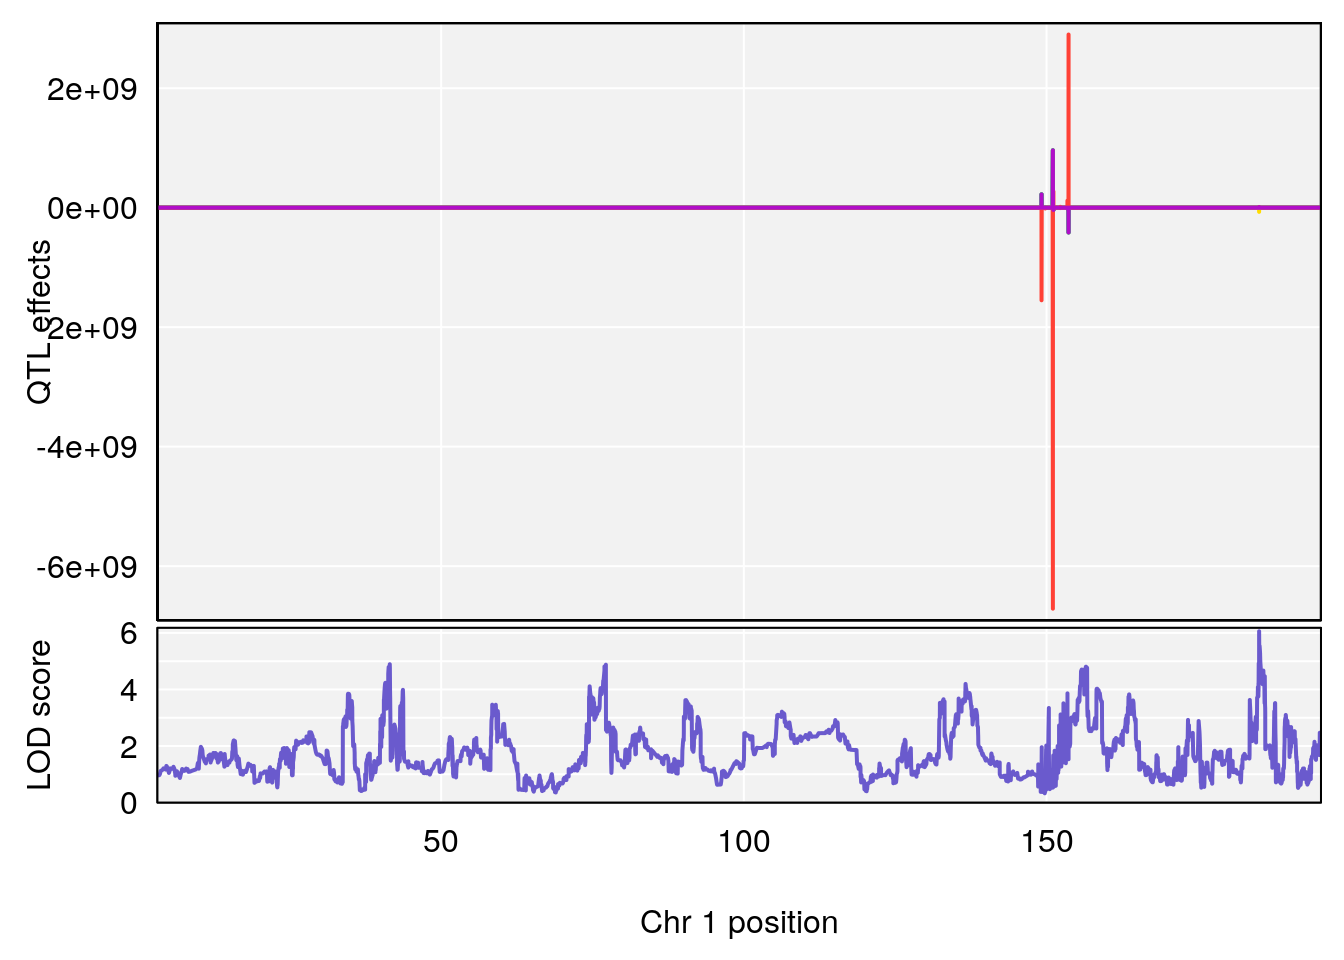
| Version | Author | Date |
|---|---|---|
| 8611541 | xhyuo | 2023-02-21 |

| Version | Author | Date |
|---|---|---|
| 8611541 | xhyuo | 2023-02-21 |
| Version | Author | Date |
|---|---|---|
| 8611541 | xhyuo | 2023-02-21 |
# [1] 2
| Version | Author | Date |
|---|---|---|
| 8611541 | xhyuo | 2023-02-21 |

| Version | Author | Date |
|---|---|---|
| 8611541 | xhyuo | 2023-02-21 |

| Version | Author | Date |
|---|---|---|
| 8611541 | xhyuo | 2023-02-21 |
# [1] 3
| Version | Author | Date |
|---|---|---|
| 8611541 | xhyuo | 2023-02-21 |

| Version | Author | Date |
|---|---|---|
| 8611541 | xhyuo | 2023-02-21 |

| Version | Author | Date |
|---|---|---|
| 8611541 | xhyuo | 2023-02-21 |
# [1] 4
| Version | Author | Date |
|---|---|---|
| 8611541 | xhyuo | 2023-02-21 |

| Version | Author | Date |
|---|---|---|
| 8611541 | xhyuo | 2023-02-21 |

| Version | Author | Date |
|---|---|---|
| 8611541 | xhyuo | 2023-02-21 |
Plot qtl mapping on array female
load("output/Fentanyl/qtl.fentanyl.combine2cohort.out.male.RData")
#pmap and gmap
chr.names <- c("1","2","3","4","5","6","7","8","9","10","11","12","13","14","15","16","17","18","19", "X")
gmap <- list()
pmap <- list()
for (chr in chr.names){
  gmap[[chr]] <-  gm$gmap[[chr]]
  pmap[[chr]] <-  gm$pmap[[chr]]
}
attr(gmap, "is_x_chr") <- structure(c(rep(FALSE,19),TRUE), names=1:20)
attr(pmap, "is_x_chr") <- structure(c(rep(FALSE,19),TRUE), names=1:20)

#genome-wide plot
for(i in names(qtl.out)){
  par(mar=c(5.1, 4.1, 1.1, 1.1))
  ymx <- maxlod(qtl.out[[i]]) # overall maximum LOD score
  plot(qtl.out[[i]], map=pmap, lodcolumn=1, col="slateblue", ylim=c(0, max(sapply(qtl.out, maxlod)) +2))
  abline(h=summary(qtl.operm[[i]], alpha=c(0.10, 0.05, 0.01))[[1]], col="red")
  abline(h=summary(qtl.operm[[i]], alpha=c(0.10, 0.05, 0.01))[[2]], col="red")
  abline(h=summary(qtl.operm[[i]], alpha=c(0.10, 0.05, 0.01))[[3]], col="red")
  title(main = paste0("do_Fentanyl_combine2cohort_",i))
}
| Version | Author | Date |
|---|---|---|
| 8611541 | xhyuo | 2023-02-21 |

| Version | Author | Date |
|---|---|---|
| 8611541 | xhyuo | 2023-02-21 |

| Version | Author | Date |
|---|---|---|
| 8611541 | xhyuo | 2023-02-21 |

| Version | Author | Date |
|---|---|---|
| 8611541 | xhyuo | 2023-02-21 |

| Version | Author | Date |
|---|---|---|
| 8611541 | xhyuo | 2023-02-21 |
| Version | Author | Date |
|---|---|---|
| 8611541 | xhyuo | 2023-02-21 |

| Version | Author | Date |
|---|---|---|
| 8611541 | xhyuo | 2023-02-21 |

| Version | Author | Date |
|---|---|---|
| 8611541 | xhyuo | 2023-02-21 |
| Version | Author | Date |
|---|---|---|
| 8611541 | xhyuo | 2023-02-21 |

| Version | Author | Date |
|---|---|---|
| 8611541 | xhyuo | 2023-02-21 |
| Version | Author | Date |
|---|---|---|
| 8611541 | xhyuo | 2023-02-21 |
| Version | Author | Date |
|---|---|---|
| 8611541 | xhyuo | 2023-02-21 |

| Version | Author | Date |
|---|---|---|
| 8611541 | xhyuo | 2023-02-21 |

| Version | Author | Date |
|---|---|---|
| 8611541 | xhyuo | 2023-02-21 |
#peaks coeff plot
for(i in names(qtl.out)){
  print(i)
  peaks <- find_peaks(qtl.out[[i]], map=pmap, threshold=6, drop=1.5)
  if(nrow(peaks) > 0) {
    print(peaks)
    for(p in 1:dim(peaks)[1]) {
    print(p)
    chr <-peaks[p,3]
    #coeff plot
    par(mar=c(4.1, 4.1, 0.6, 0.6))
    plot_coefCC(coef_c1[[i]][[p]], pmap[chr], scan1_output=qtl.out[[i]], bgcolor="gray95", legend=NULL)
    plot_coefCC(coef_c2[[i]][[p]], pmap[chr], scan1_output=qtl.out[[i]], bgcolor="gray95", legend=NULL)
    plot(out_snps[[i]][[p]]$lod, out_snps[[i]][[p]]$snpinfo, drop_hilit=1.5, genes=out_genes[[i]][[p]])
    }
  }
}
# [1] "Time.to.Dead.Hr"
#   lodindex lodcolumn chr       pos      lod    ci_lo     ci_hi
# 1        1    pheno1   2 132.62489 6.124096 50.81340 173.86901
# 2        1    pheno1  10  99.92521 6.492863 99.28182 105.40417
# 3        1    pheno1  17  23.96788 6.725145 21.59514  25.08344
# [1] 1
| Version | Author | Date |
|---|---|---|
| 8611541 | xhyuo | 2023-02-21 |
| Version | Author | Date |
|---|---|---|
| 8611541 | xhyuo | 2023-02-21 |

| Version | Author | Date |
|---|---|---|
| 8611541 | xhyuo | 2023-02-21 |
# [1] 2
| Version | Author | Date |
|---|---|---|
| 8611541 | xhyuo | 2023-02-21 |
| Version | Author | Date |
|---|---|---|
| 8611541 | xhyuo | 2023-02-21 |
| Version | Author | Date |
|---|---|---|
| 8611541 | xhyuo | 2023-02-21 |
# [1] 3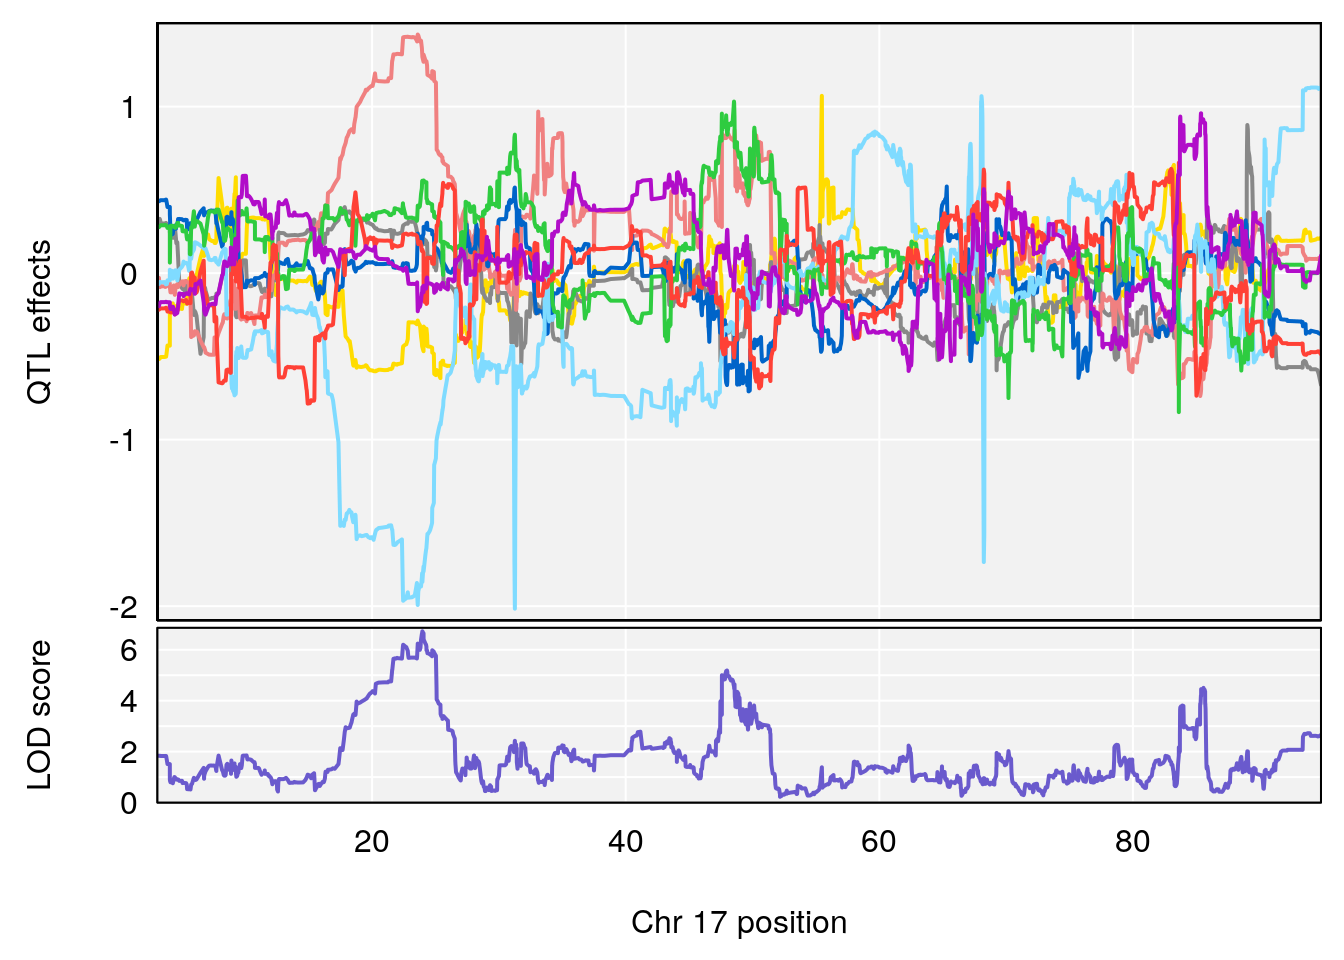
| Version | Author | Date |
|---|---|---|
| 8611541 | xhyuo | 2023-02-21 |

| Version | Author | Date |
|---|---|---|
| 8611541 | xhyuo | 2023-02-21 |

| Version | Author | Date |
|---|---|---|
| 8611541 | xhyuo | 2023-02-21 |
# [1] "RR.Depression.Rate.Hr"
# [1] "Time.to.Steady.RR.Depression.Hr"
#   lodindex lodcolumn chr      pos      lod    ci_lo    ci_hi
# 1        1    pheno1  17 33.66364 6.021735 7.725897 35.02144
# [1] 1
| Version | Author | Date |
|---|---|---|
| 8611541 | xhyuo | 2023-02-21 |

| Version | Author | Date |
|---|---|---|
| 8611541 | xhyuo | 2023-02-21 |
| Version | Author | Date |
|---|---|---|
| 8611541 | xhyuo | 2023-02-21 |
# [1] "Min.Depression.RR"
#   lodindex lodcolumn chr     pos      lod    ci_lo    ci_hi
# 1        1    pheno1  14 101.798 6.961191 100.3058 103.3399
# [1] 1
| Version | Author | Date |
|---|---|---|
| 8611541 | xhyuo | 2023-02-21 |

| Version | Author | Date |
|---|---|---|
| 8611541 | xhyuo | 2023-02-21 |
| Version | Author | Date |
|---|---|---|
| 8611541 | xhyuo | 2023-02-21 |
# [1] "Mean.Depression.BR"
# [1] "SteadyState.Depression.Duration.Hr"
#   lodindex lodcolumn chr      pos      lod    ci_lo    ci_hi
# 1        1    pheno1   4 32.63908 7.066593 31.85079 97.16594
# 2        1    pheno1   7 78.55130 6.765506 78.43609 79.07406
# 3        1    pheno1  15 82.95976 6.039949 82.61311 84.16285
# [1] 1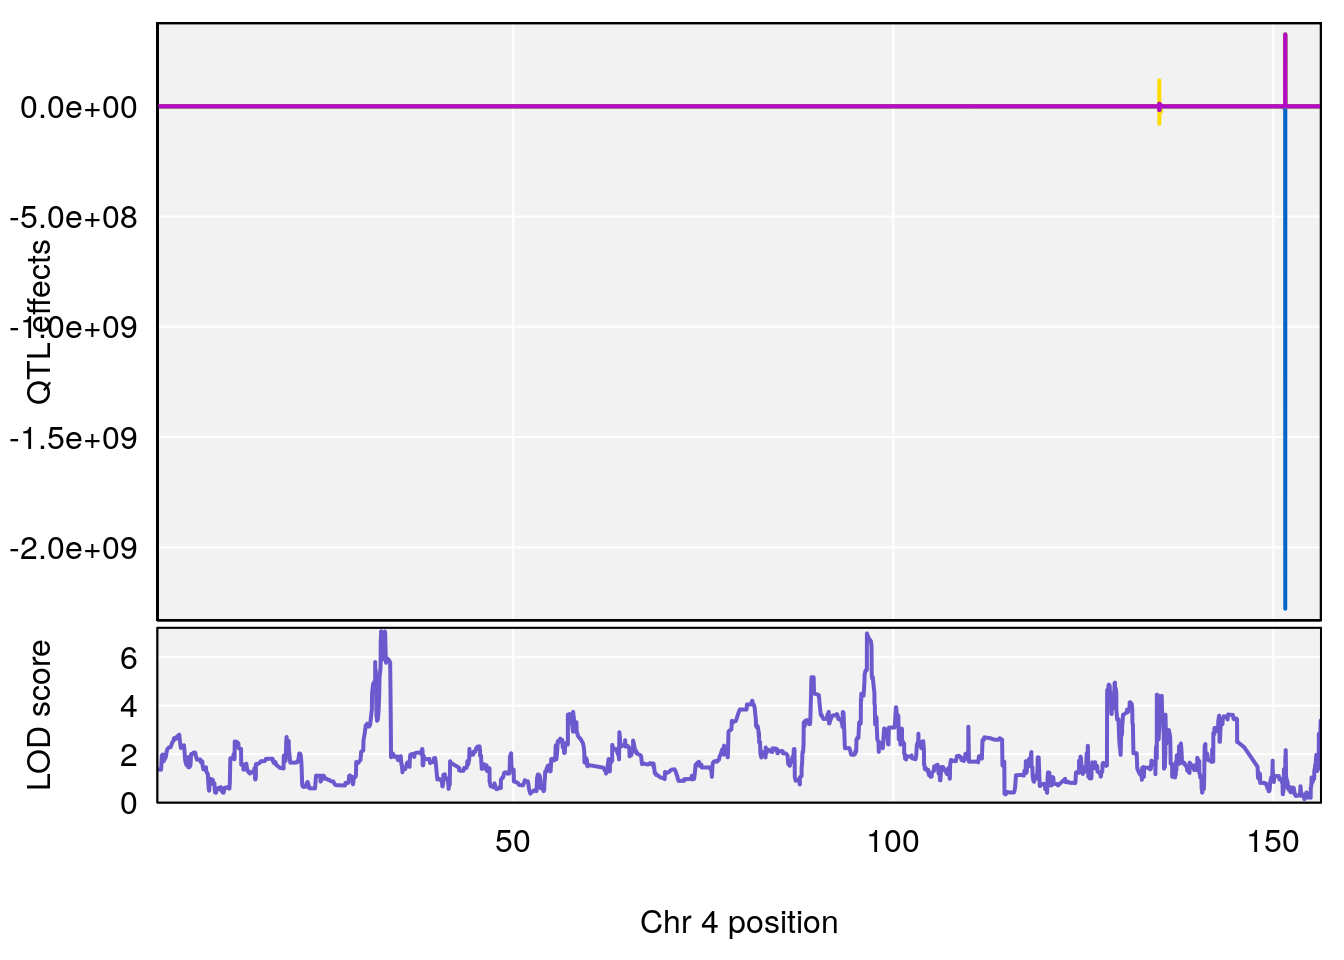
| Version | Author | Date |
|---|---|---|
| 8611541 | xhyuo | 2023-02-21 |

| Version | Author | Date |
|---|---|---|
| 8611541 | xhyuo | 2023-02-21 |
| Version | Author | Date |
|---|---|---|
| 8611541 | xhyuo | 2023-02-21 |
# [1] 2
| Version | Author | Date |
|---|---|---|
| 8611541 | xhyuo | 2023-02-21 |
| Version | Author | Date |
|---|---|---|
| 8611541 | xhyuo | 2023-02-21 |
| Version | Author | Date |
|---|---|---|
| 8611541 | xhyuo | 2023-02-21 |
# [1] 3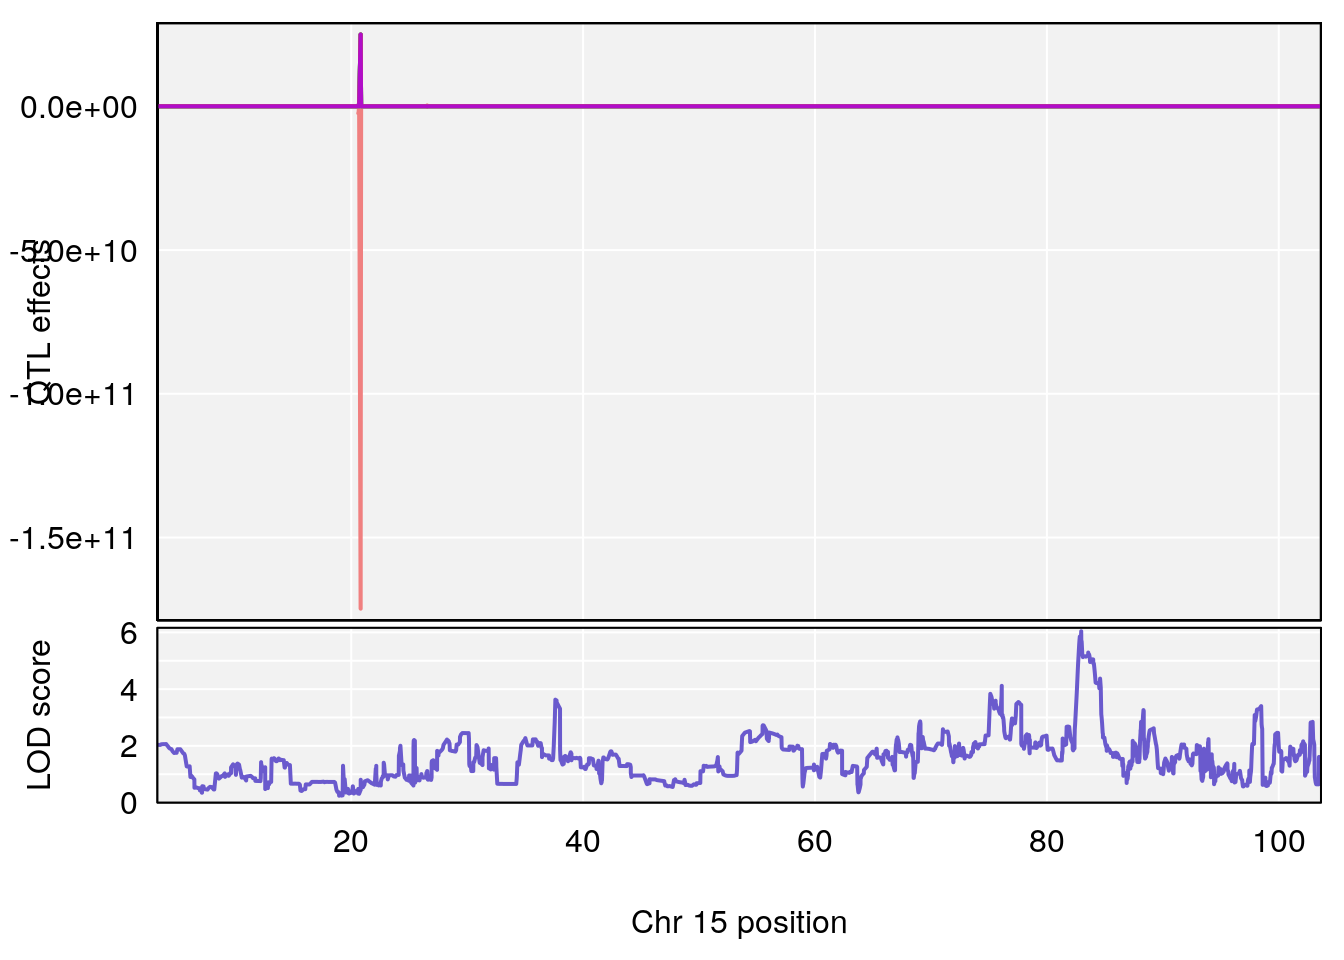
| Version | Author | Date |
|---|---|---|
| 8611541 | xhyuo | 2023-02-21 |
| Version | Author | Date |
|---|---|---|
| 8611541 | xhyuo | 2023-02-21 |
| Version | Author | Date |
|---|---|---|
| 8611541 | xhyuo | 2023-02-21 |
# [1] "Time.to.Threshold.Recovery.Hr"
#   lodindex lodcolumn chr      pos      lod    ci_lo    ci_hi
# 1        1    pheno1  10 60.61789 6.163288 59.50257 61.79358
# [1] 1
| Version | Author | Date |
|---|---|---|
| 8611541 | xhyuo | 2023-02-21 |

| Version | Author | Date |
|---|---|---|
| 8611541 | xhyuo | 2023-02-21 |
| Version | Author | Date |
|---|---|---|
| 8611541 | xhyuo | 2023-02-21 |
# [1] "Time.to.Projected.Recovery.Hr"
#   lodindex lodcolumn chr      pos      lod    ci_lo    ci_hi
# 1        1    pheno1   1 180.4362 8.101813 180.3185 180.5471
# [1] 1
| Version | Author | Date |
|---|---|---|
| 8611541 | xhyuo | 2023-02-21 |

| Version | Author | Date |
|---|---|---|
| 8611541 | xhyuo | 2023-02-21 |

| Version | Author | Date |
|---|---|---|
| 8611541 | xhyuo | 2023-02-21 |
# [1] "Start.of.Recovery.Hr"
#   lodindex lodcolumn chr      pos      lod    ci_lo    ci_hi
# 1        1    pheno1   4 32.63908 7.105498 31.85079 97.15470
# 2        1    pheno1   7 78.55130 6.935599 78.43609 79.07697
# 3        1    pheno1  15 82.95976 6.085487 76.08766 84.17742
# [1] 1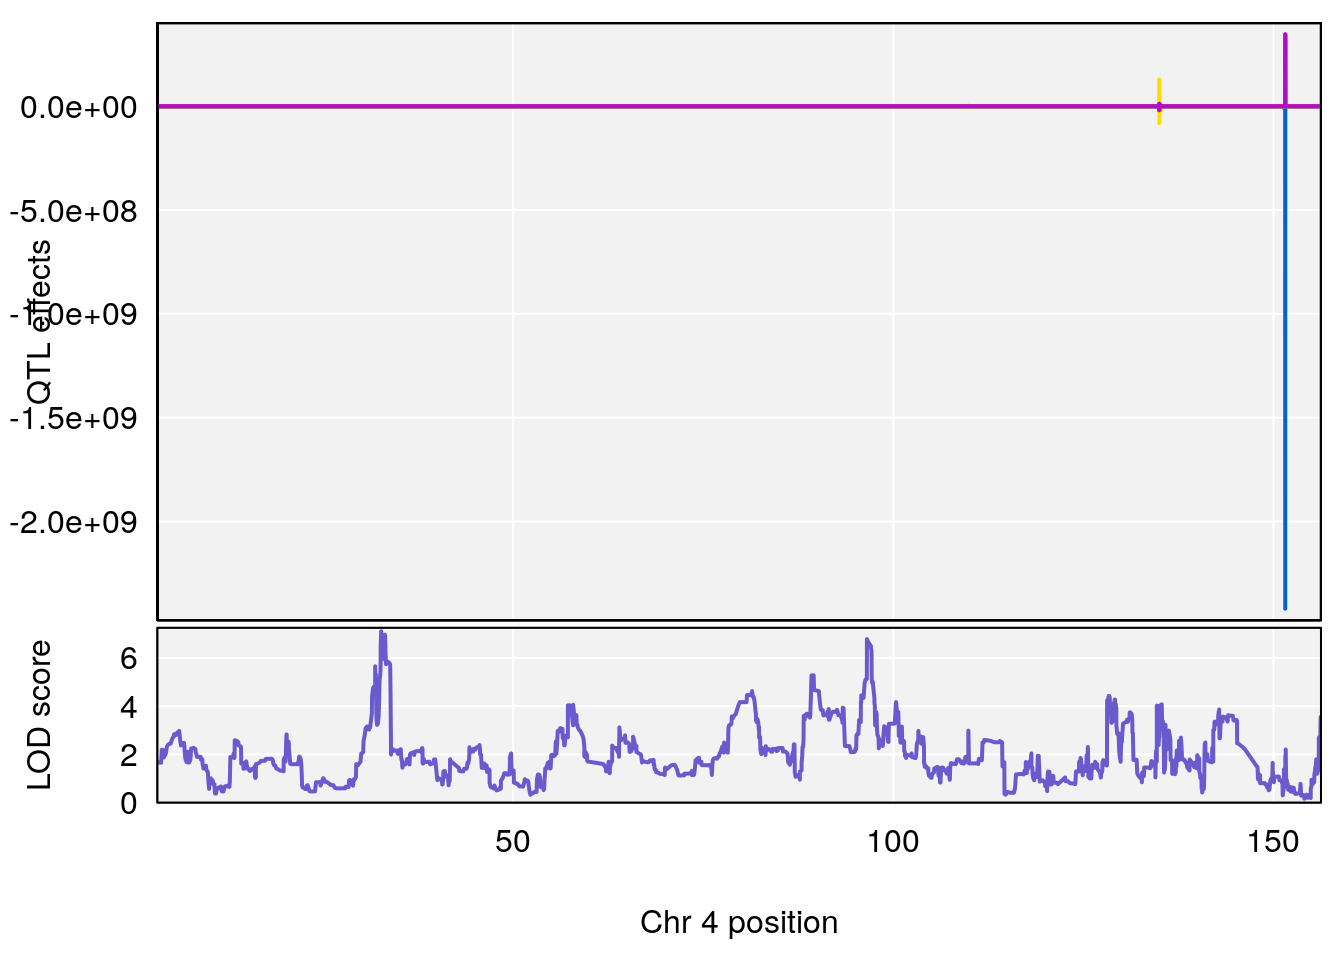
| Version | Author | Date |
|---|---|---|
| 8611541 | xhyuo | 2023-02-21 |

| Version | Author | Date |
|---|---|---|
| 8611541 | xhyuo | 2023-02-21 |
| Version | Author | Date |
|---|---|---|
| 8611541 | xhyuo | 2023-02-21 |
# [1] 2
| Version | Author | Date |
|---|---|---|
| 8611541 | xhyuo | 2023-02-21 |
| Version | Author | Date |
|---|---|---|
| 8611541 | xhyuo | 2023-02-21 |

| Version | Author | Date |
|---|---|---|
| 8611541 | xhyuo | 2023-02-21 |
# [1] 3
| Version | Author | Date |
|---|---|---|
| 8611541 | xhyuo | 2023-02-21 |

| Version | Author | Date |
|---|---|---|
| 8611541 | xhyuo | 2023-02-21 |
| Version | Author | Date |
|---|---|---|
| 8611541 | xhyuo | 2023-02-21 |
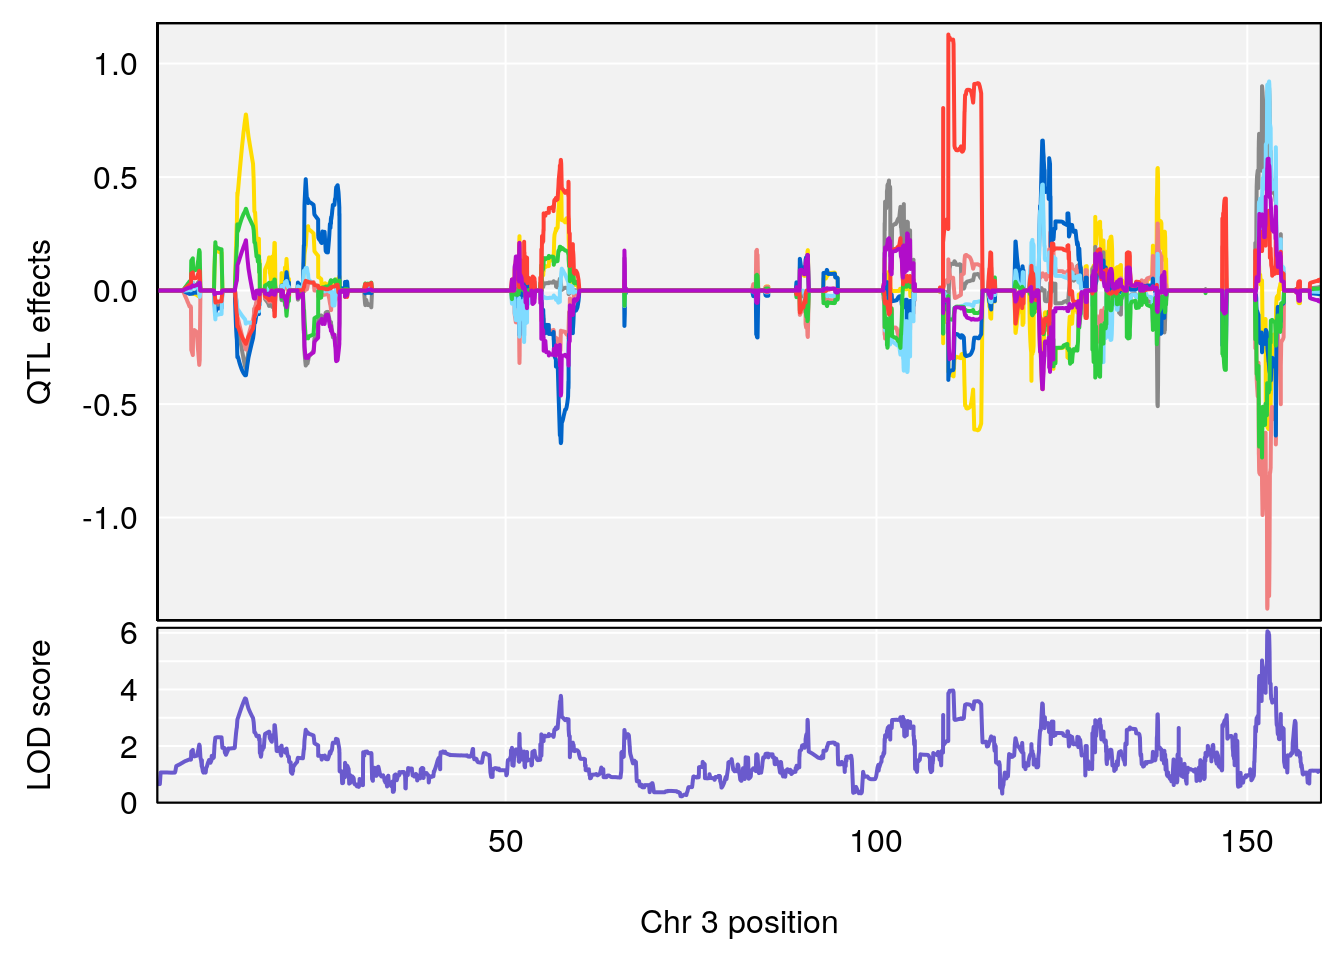
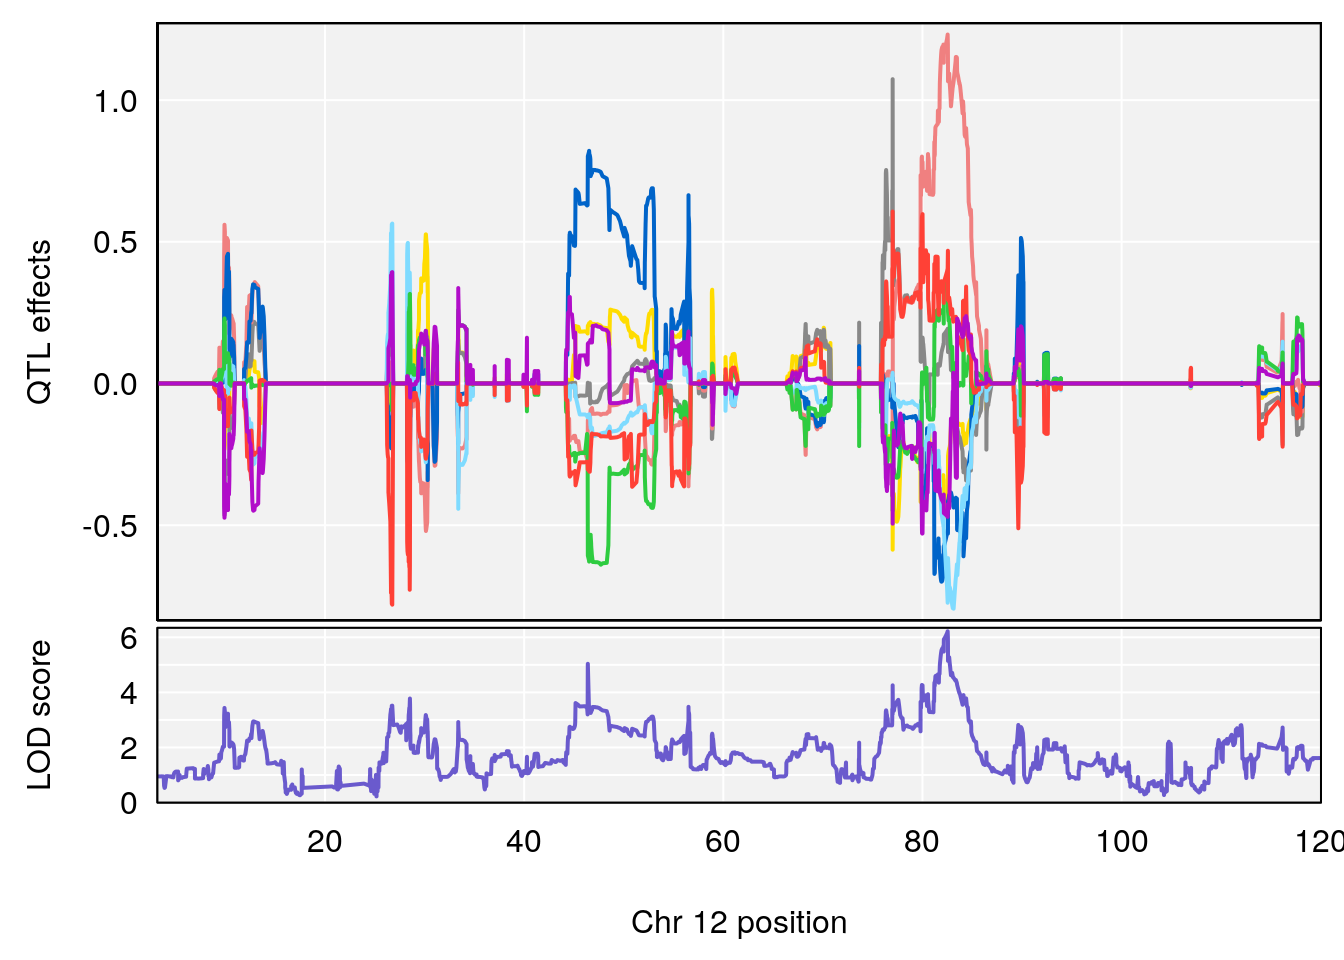
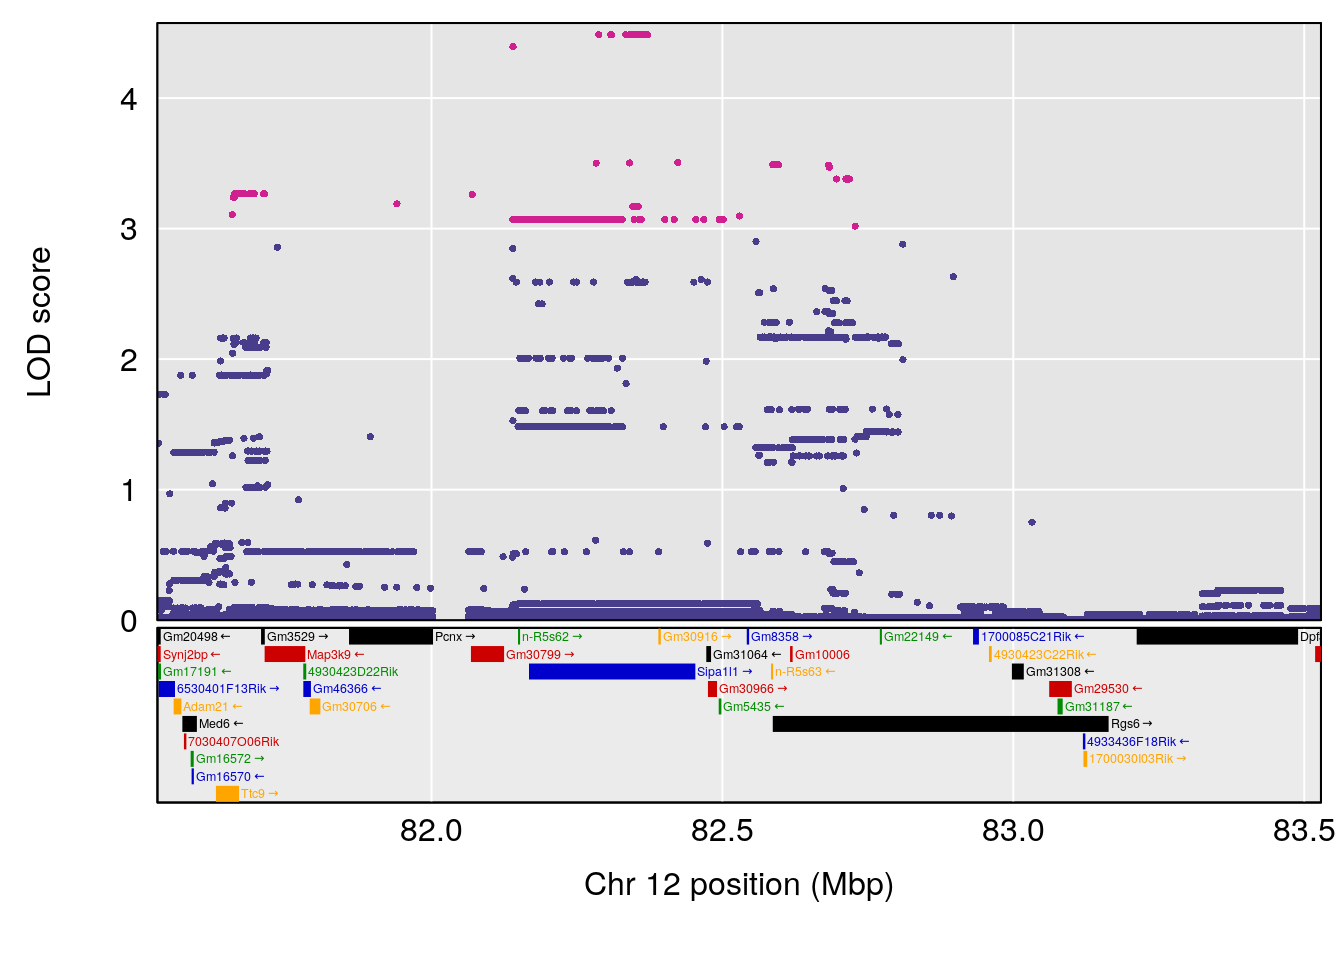
# [1] "RR.Recovery.Rate.Hr"
#   lodindex lodcolumn chr       pos      lod     ci_lo     ci_hi
# 1        1    pheno1   3 152.71526 6.057558 151.92564 153.04206
# 2        1    pheno1  12  82.52881 6.219487  46.37269  82.84506
# [1] 1
| Version | Author | Date |
|---|---|---|
| 8611541 | xhyuo | 2023-02-21 |

| Version | Author | Date |
|---|---|---|
| 8611541 | xhyuo | 2023-02-21 |
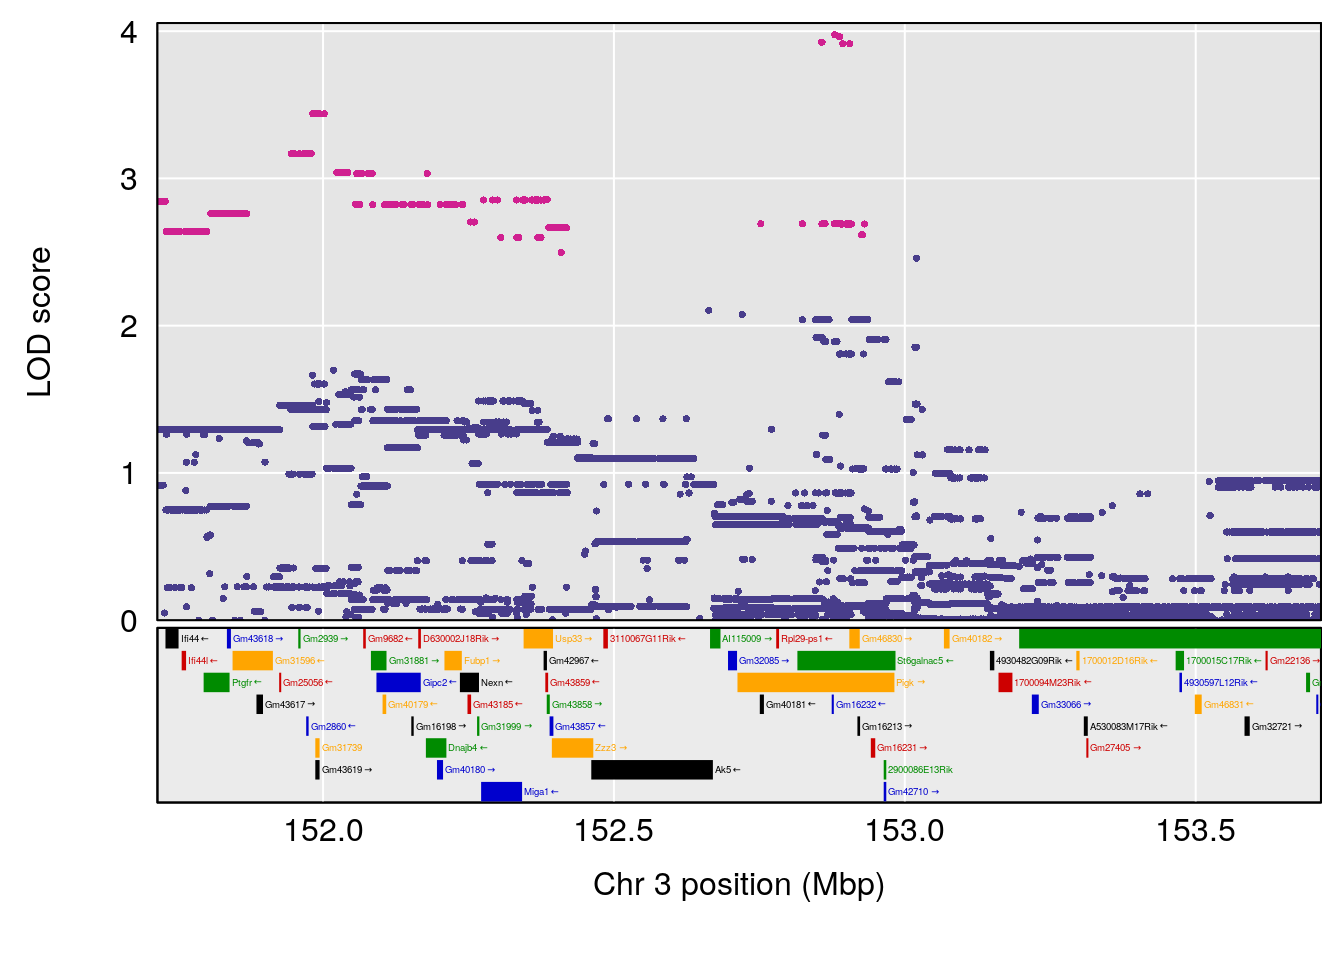
| Version | Author | Date |
|---|---|---|
| 8611541 | xhyuo | 2023-02-21 |
# [1] 2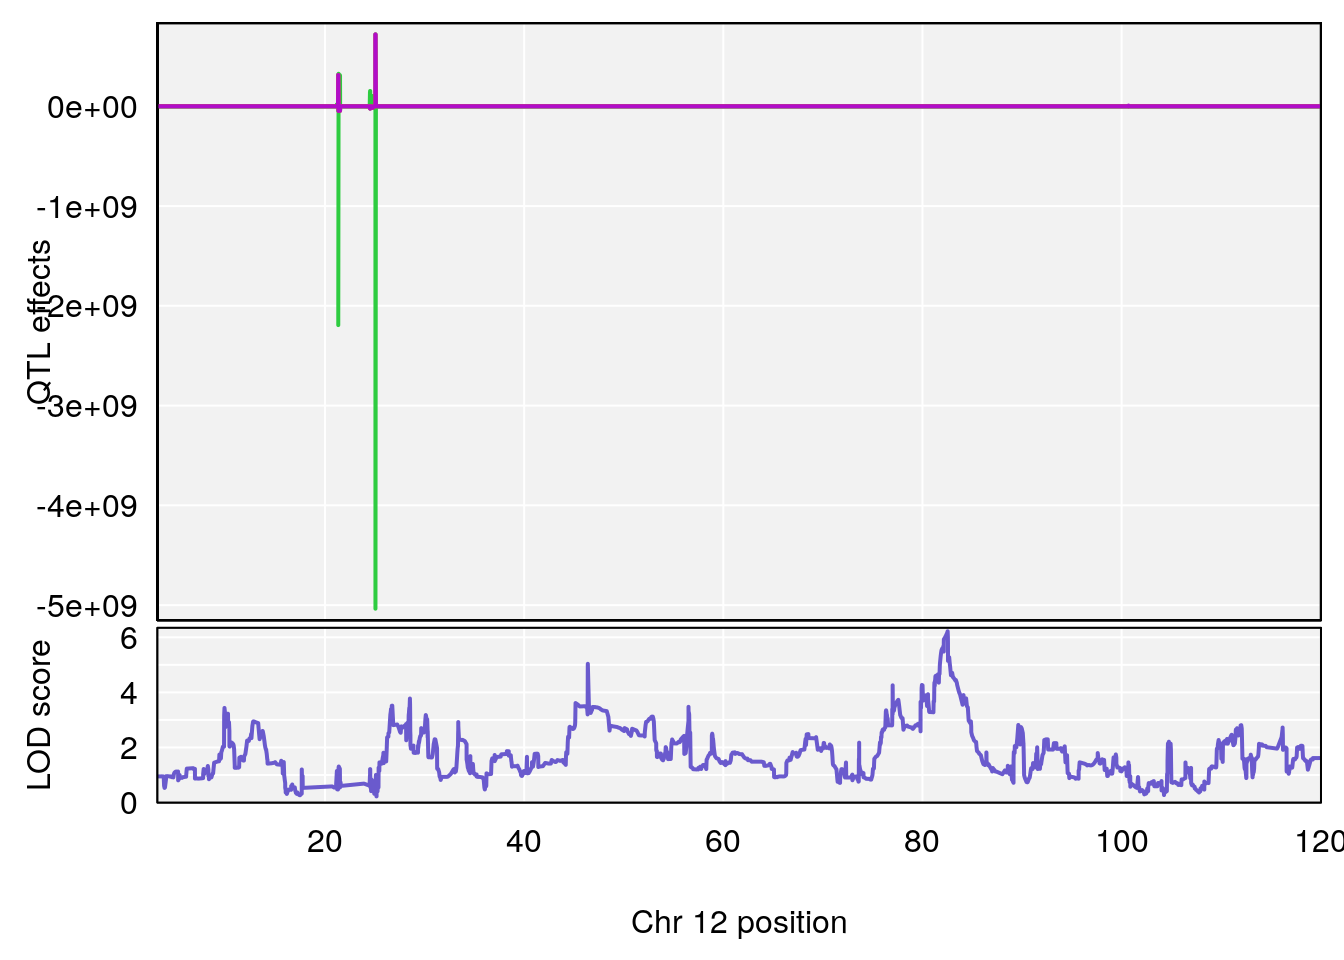
| Version | Author | Date |
|---|---|---|
| 8611541 | xhyuo | 2023-02-21 |

| Version | Author | Date |
|---|---|---|
| 8611541 | xhyuo | 2023-02-21 |

| Version | Author | Date |
|---|---|---|
| 8611541 | xhyuo | 2023-02-21 |
# [1] "Min.Depression.BR"
#   lodindex lodcolumn chr      pos      lod    ci_lo    ci_hi
# 1        1    pheno1   6 124.4987 6.882637 122.7691 125.5986
# [1] 1
| Version | Author | Date |
|---|---|---|
| 8611541 | xhyuo | 2023-02-21 |

| Version | Author | Date |
|---|---|---|
| 8611541 | xhyuo | 2023-02-21 |

| Version | Author | Date |
|---|---|---|
| 8611541 | xhyuo | 2023-02-21 |
# [1] "Time.to.Mostly.Dead.Hr"
#   lodindex lodcolumn chr       pos      lod    ci_lo     ci_hi
# 1        1    pheno1   2 115.56002 6.027351 37.81483 132.19814
# 2        1    pheno1  10  16.47363 7.647309 16.28585  18.20019
# 3        1    pheno1  11  30.45329 6.071616 28.81595  31.56268
# 4        1    pheno1  17  80.09690 6.490398 23.55316  80.36008
# [1] 1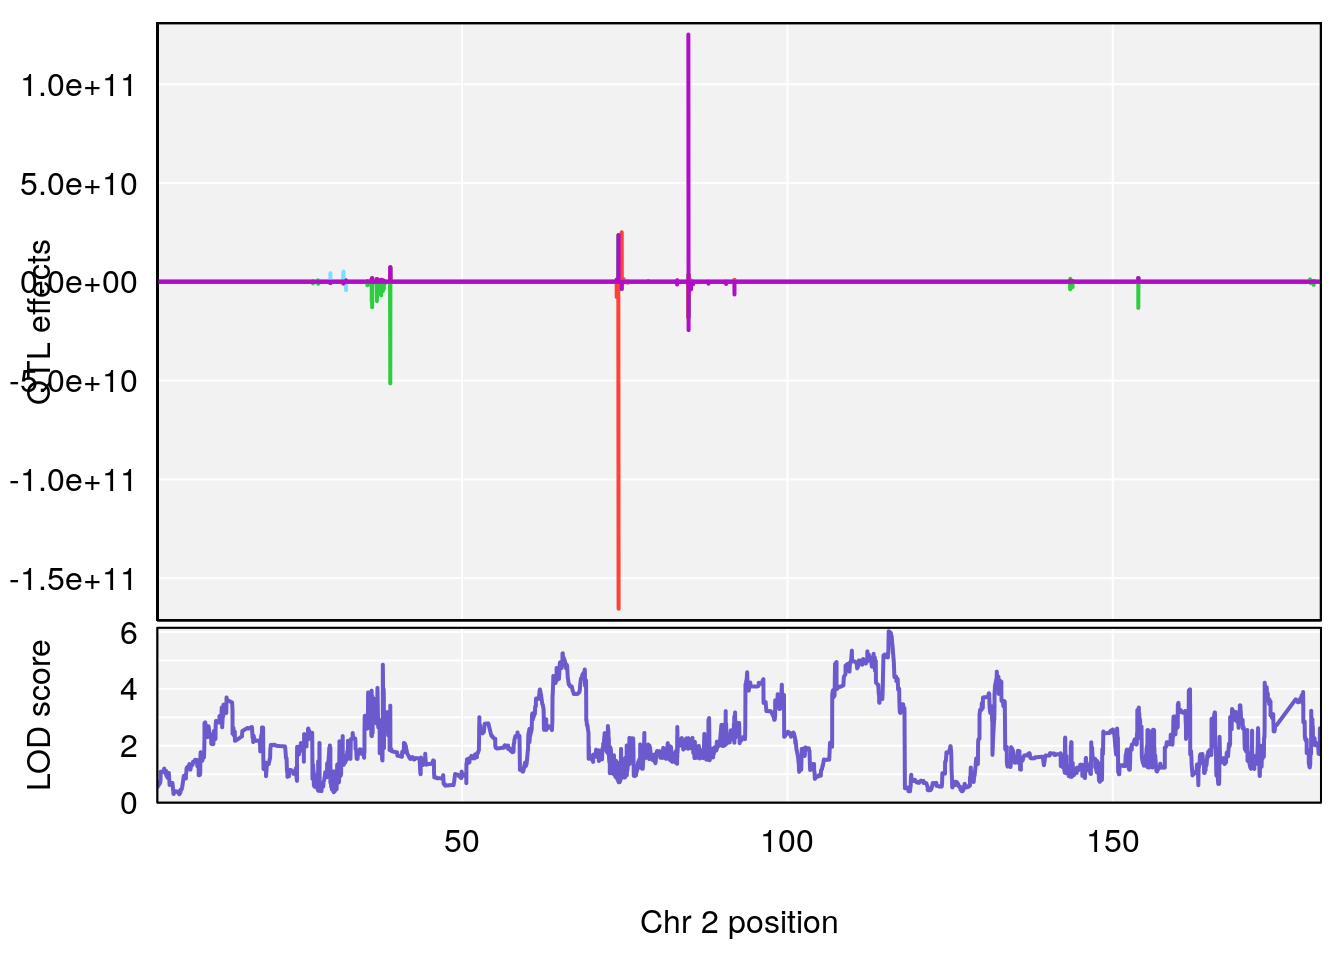
| Version | Author | Date |
|---|---|---|
| 8611541 | xhyuo | 2023-02-21 |
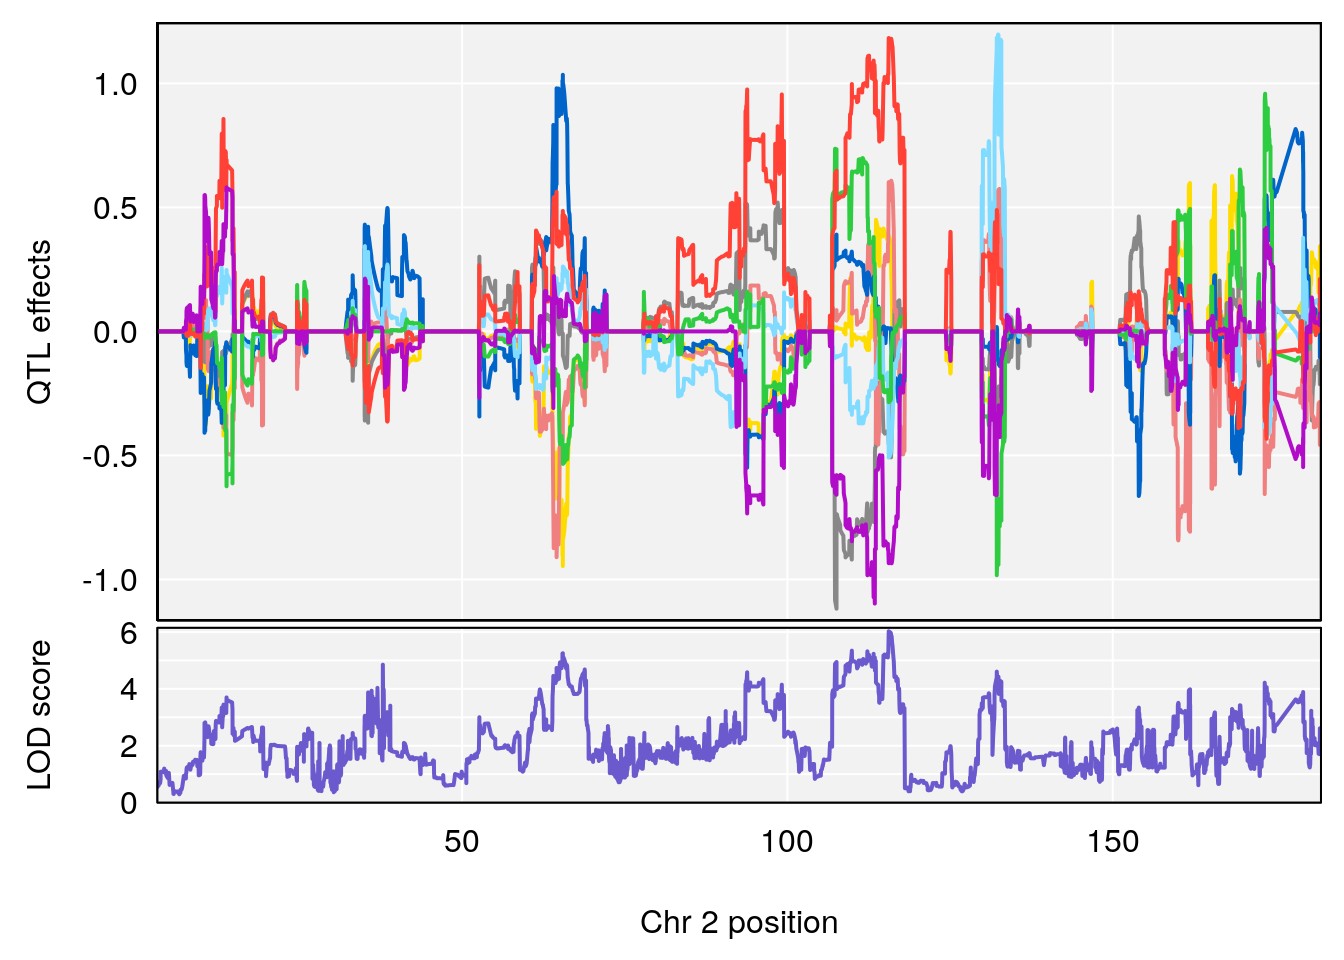
| Version | Author | Date |
|---|---|---|
| 8611541 | xhyuo | 2023-02-21 |

| Version | Author | Date |
|---|---|---|
| 8611541 | xhyuo | 2023-02-21 |
# [1] 2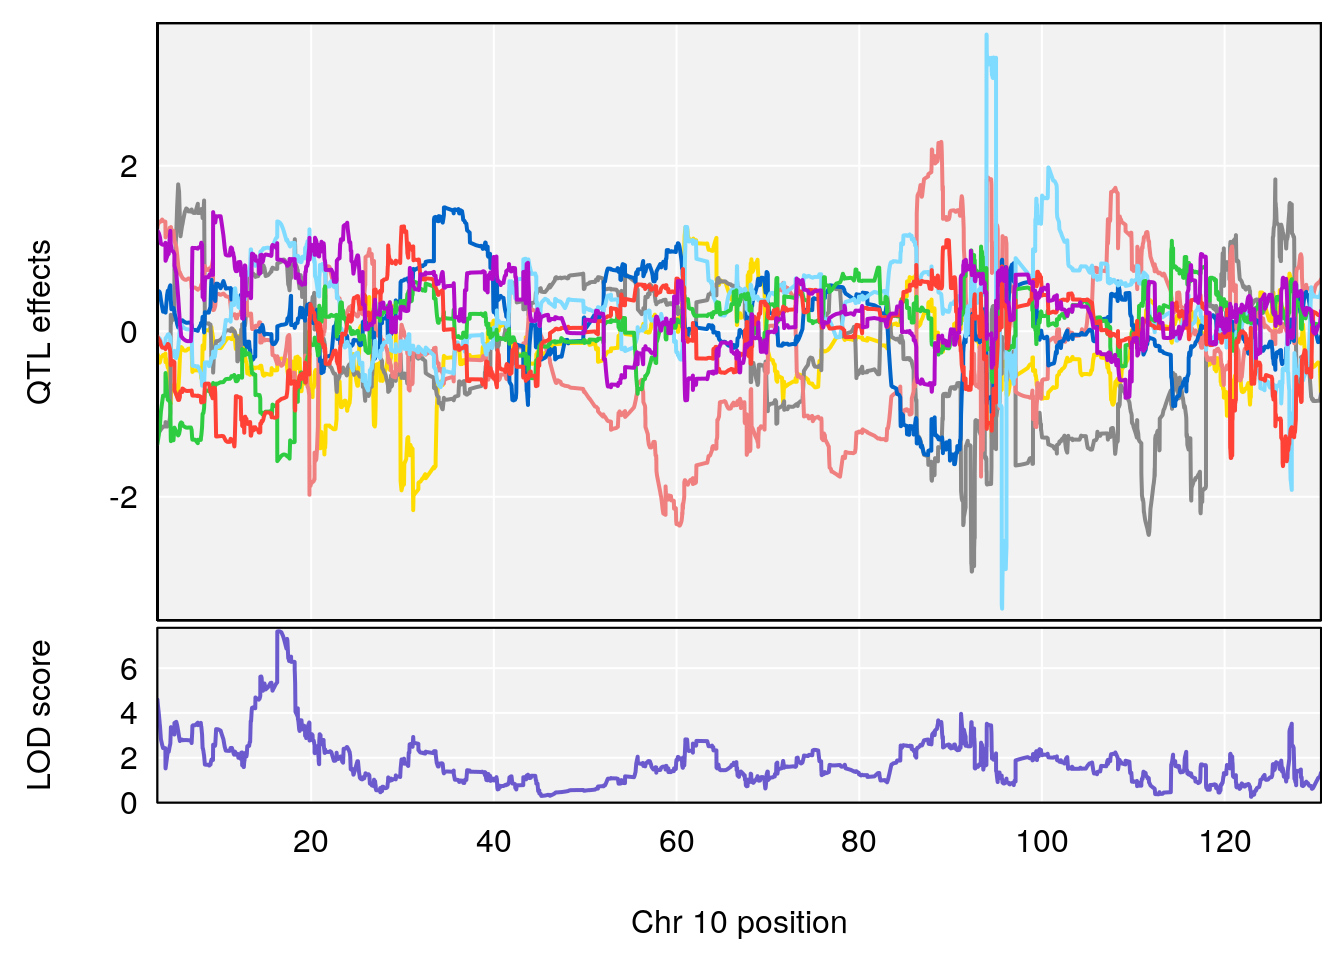
| Version | Author | Date |
|---|---|---|
| 8611541 | xhyuo | 2023-02-21 |
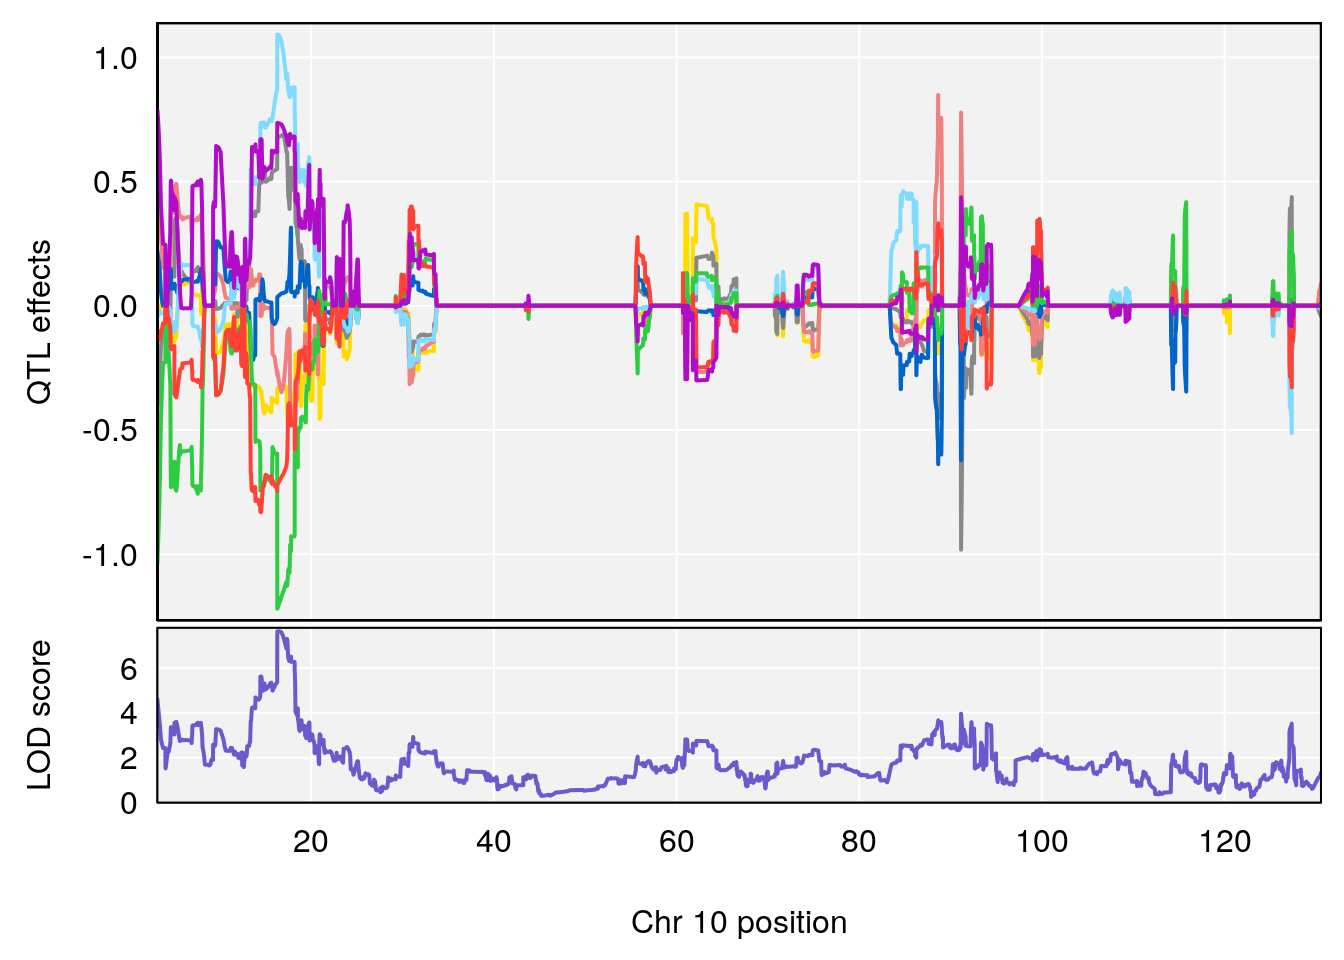
| Version | Author | Date |
|---|---|---|
| 8611541 | xhyuo | 2023-02-21 |
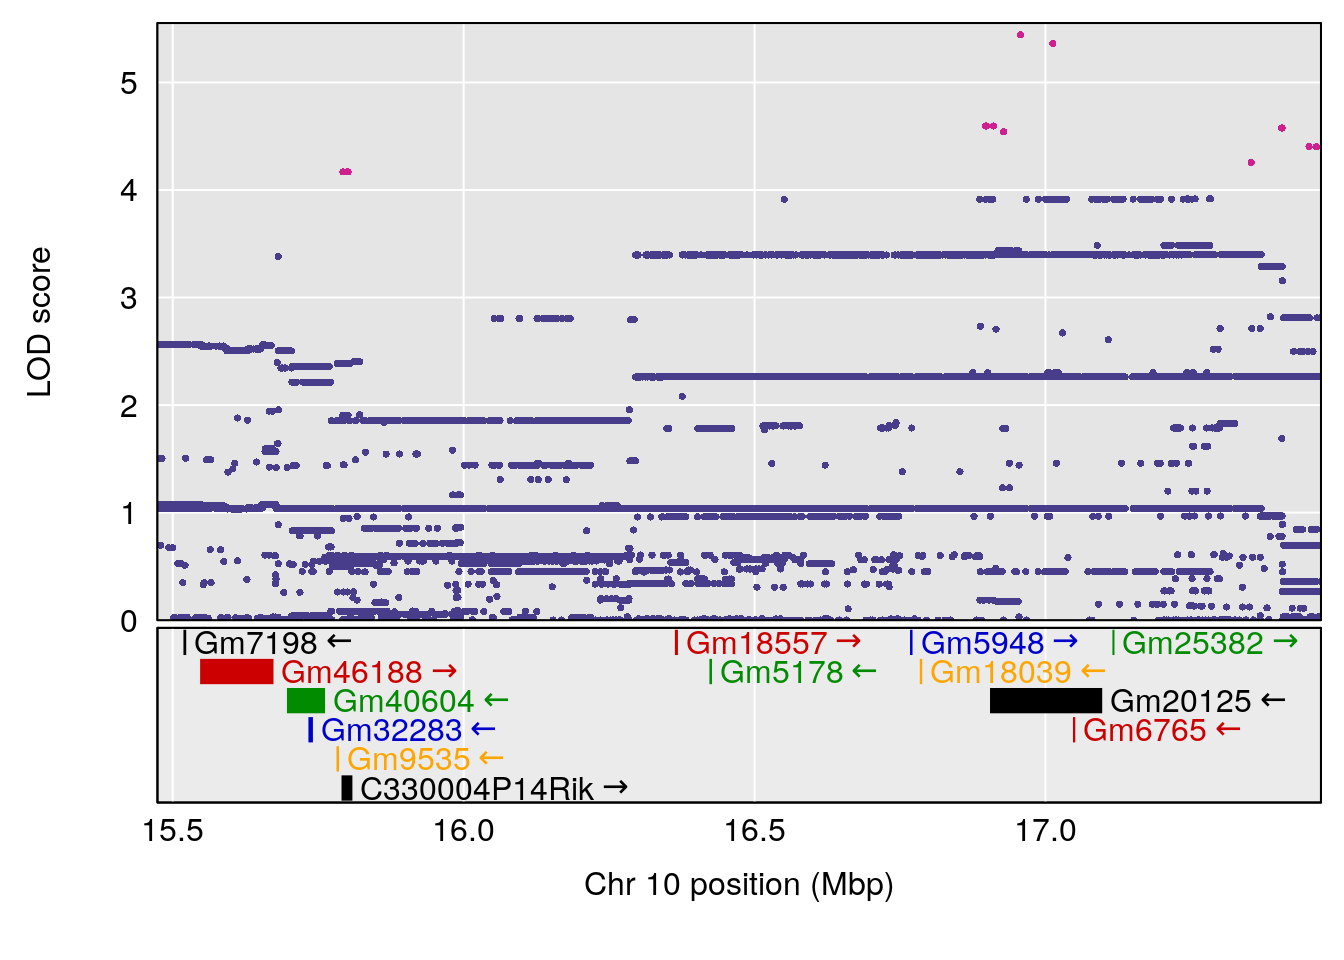
| Version | Author | Date |
|---|---|---|
| 8611541 | xhyuo | 2023-02-21 |
# [1] 3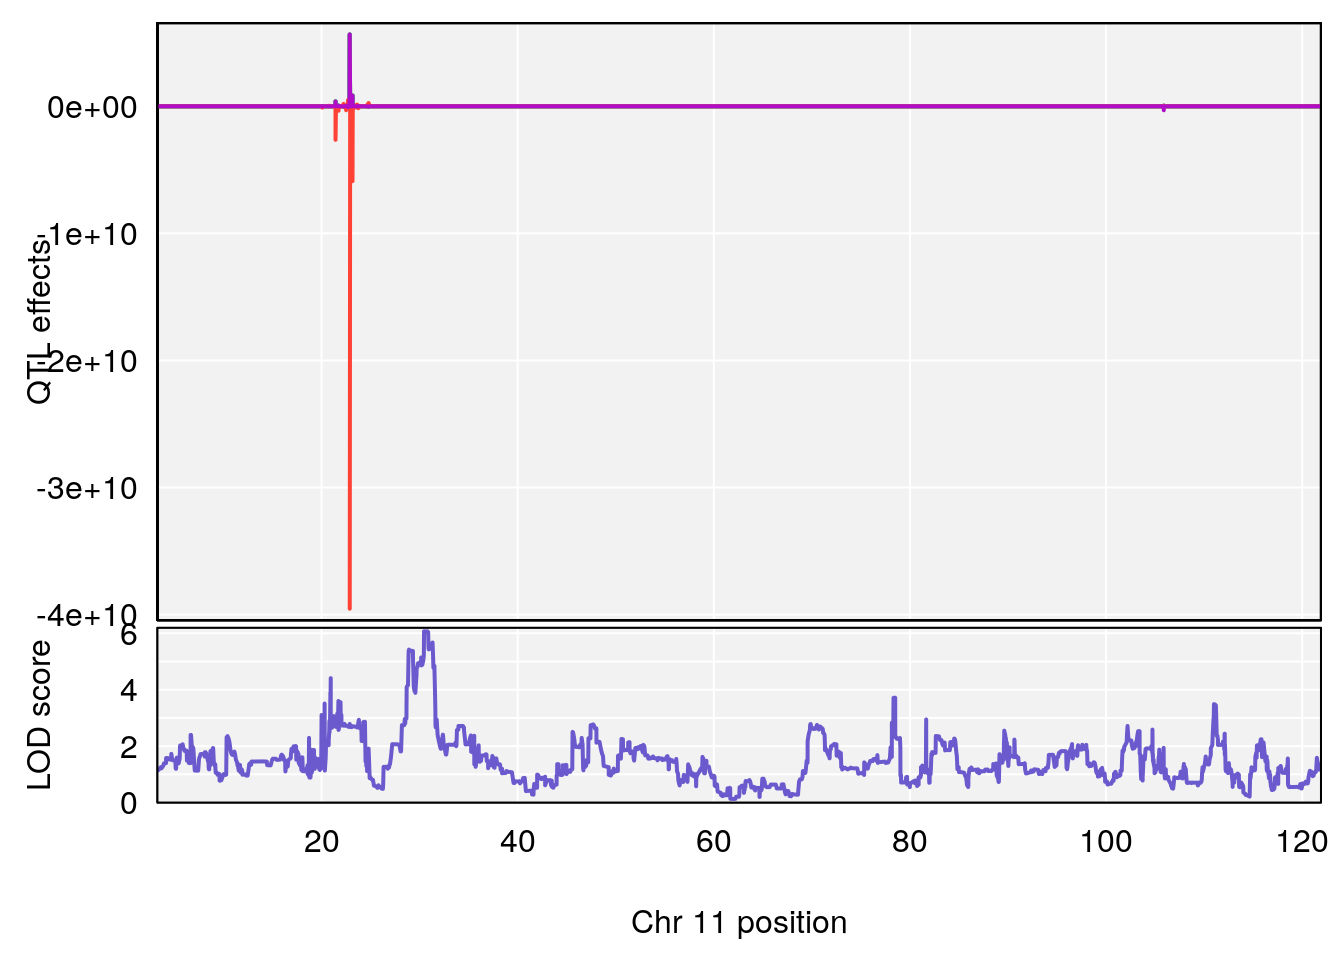
| Version | Author | Date |
|---|---|---|
| 8611541 | xhyuo | 2023-02-21 |
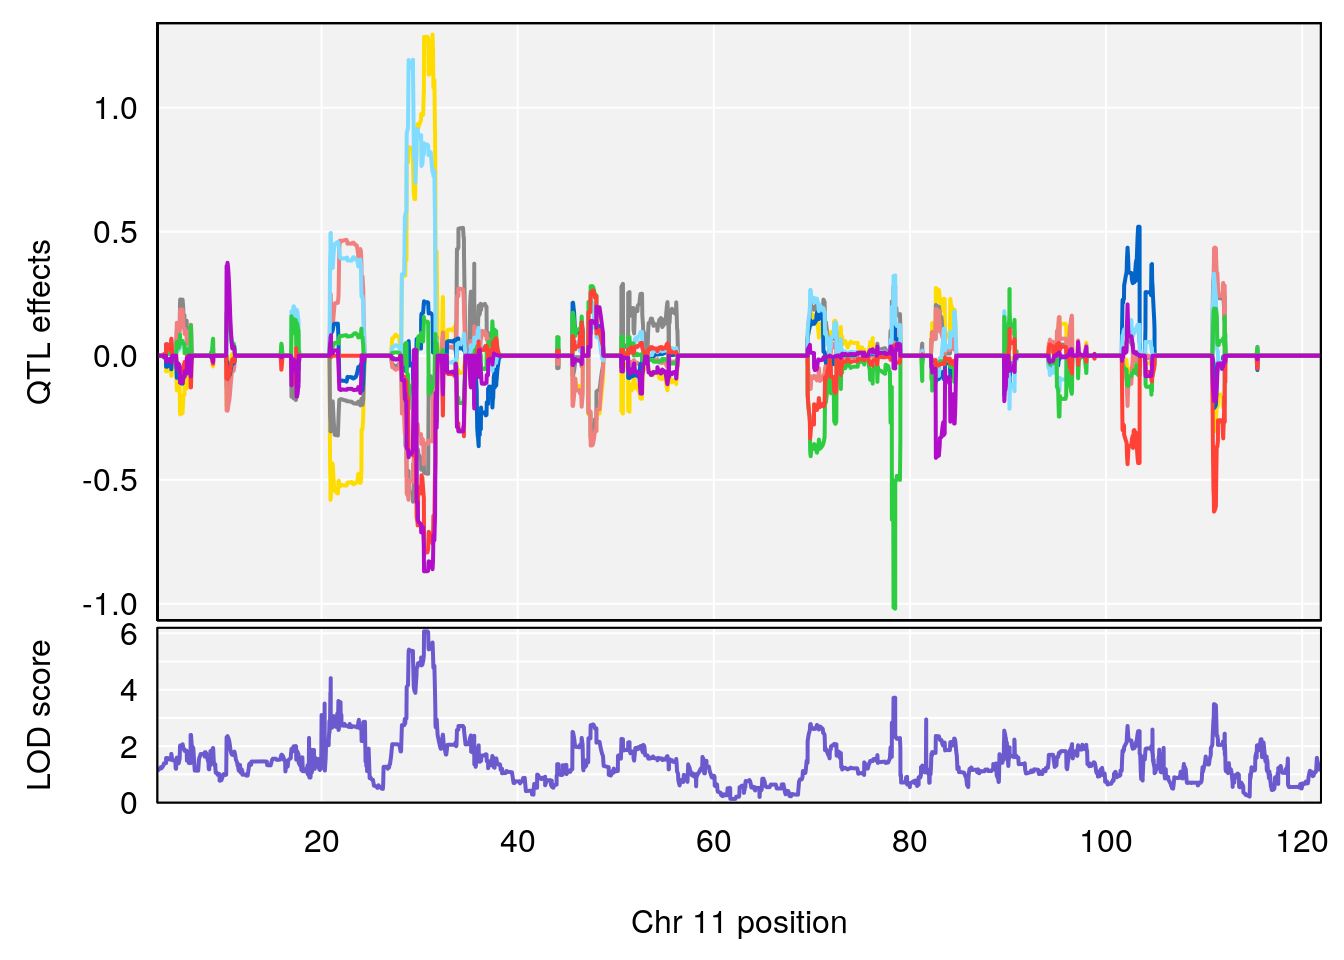
| Version | Author | Date |
|---|---|---|
| 8611541 | xhyuo | 2023-02-21 |
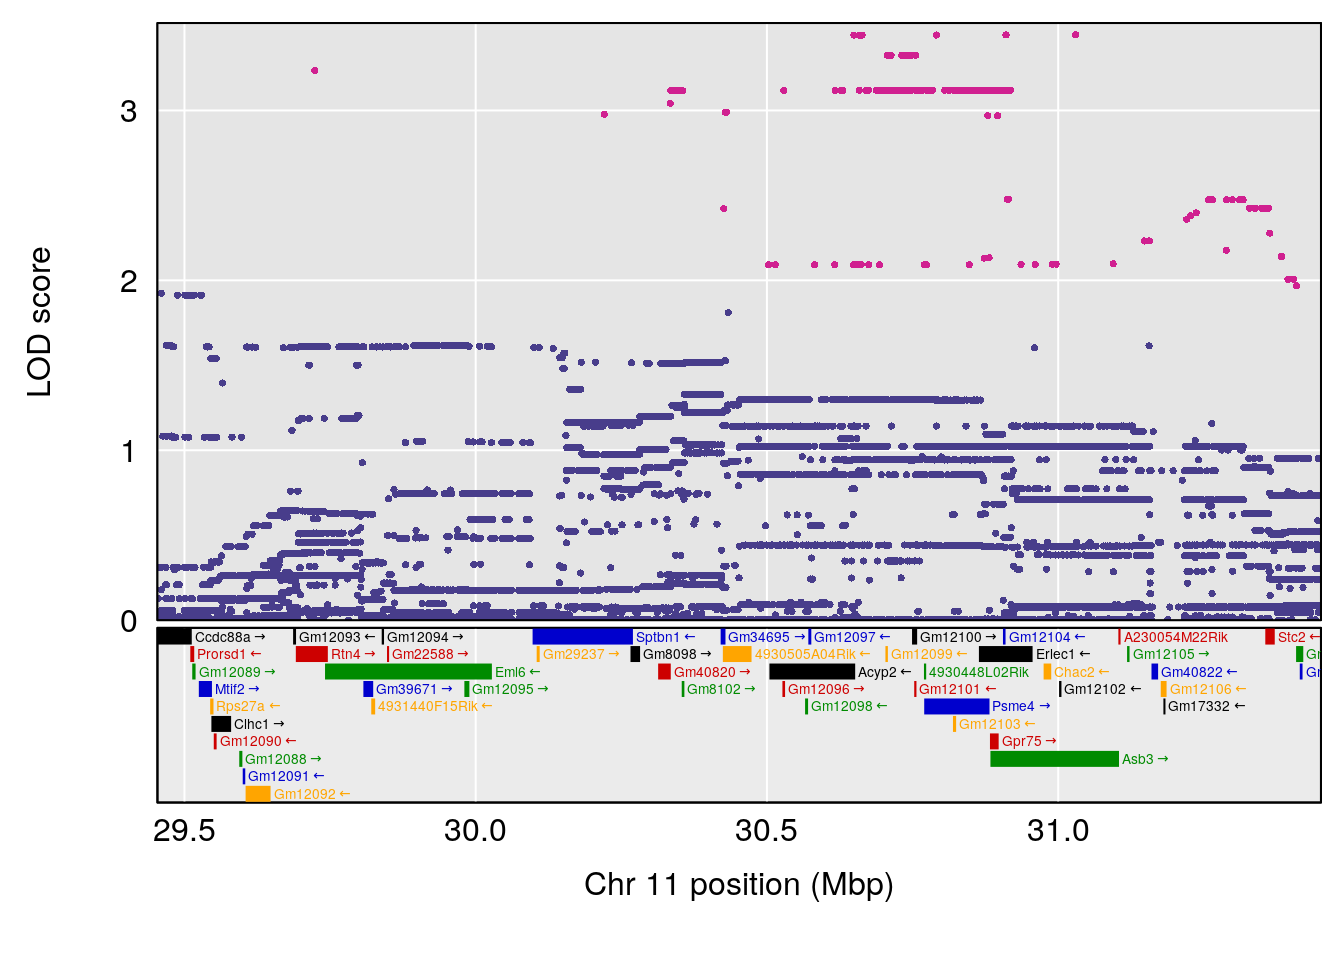
| Version | Author | Date |
|---|---|---|
| 8611541 | xhyuo | 2023-02-21 |
# [1] 4
| Version | Author | Date |
|---|---|---|
| 8611541 | xhyuo | 2023-02-21 |
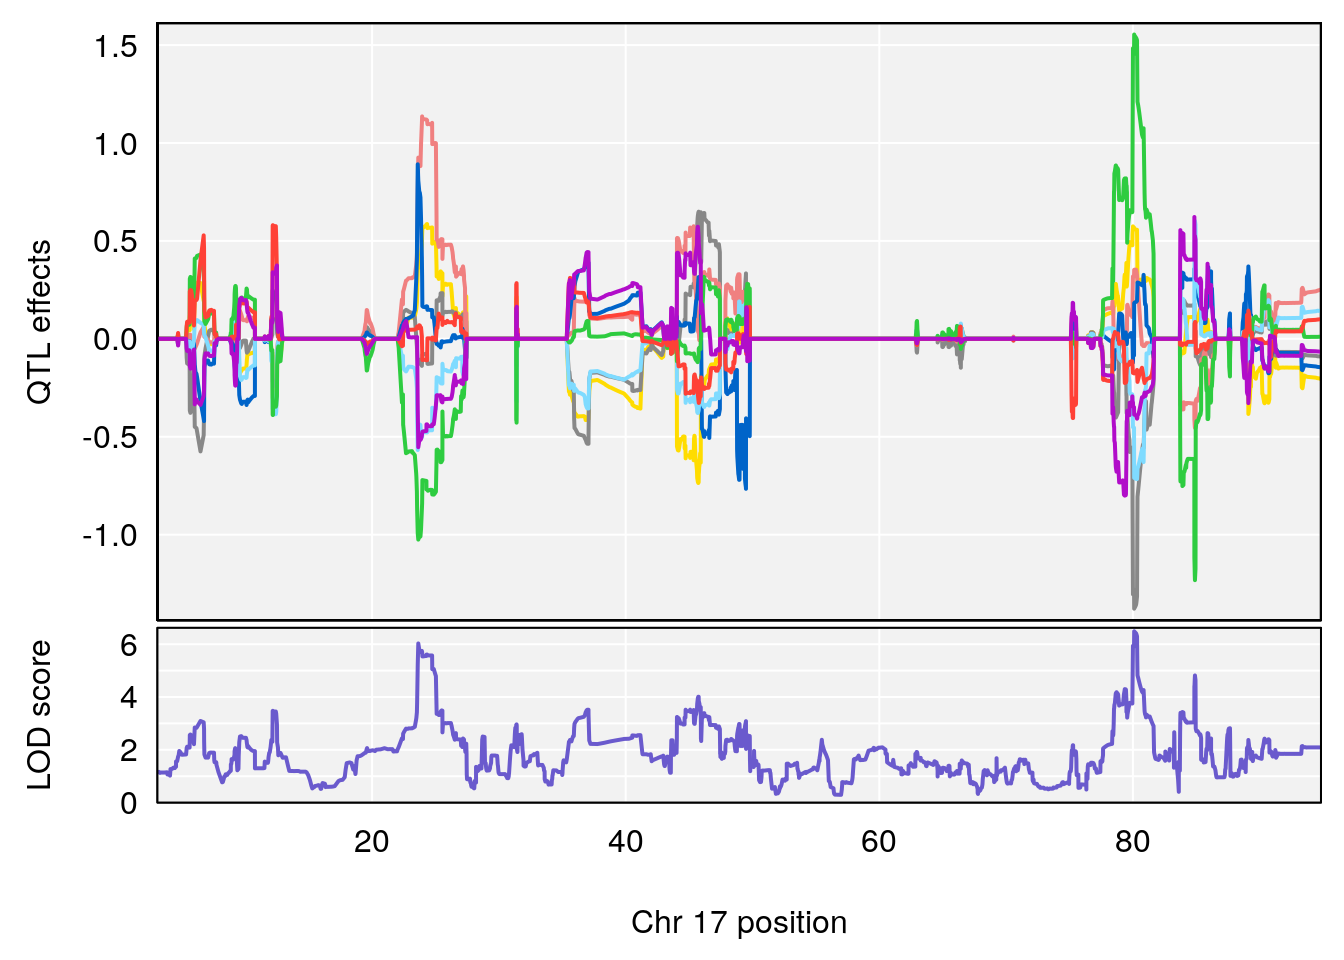
| Version | Author | Date |
|---|---|---|
| 8611541 | xhyuo | 2023-02-21 |
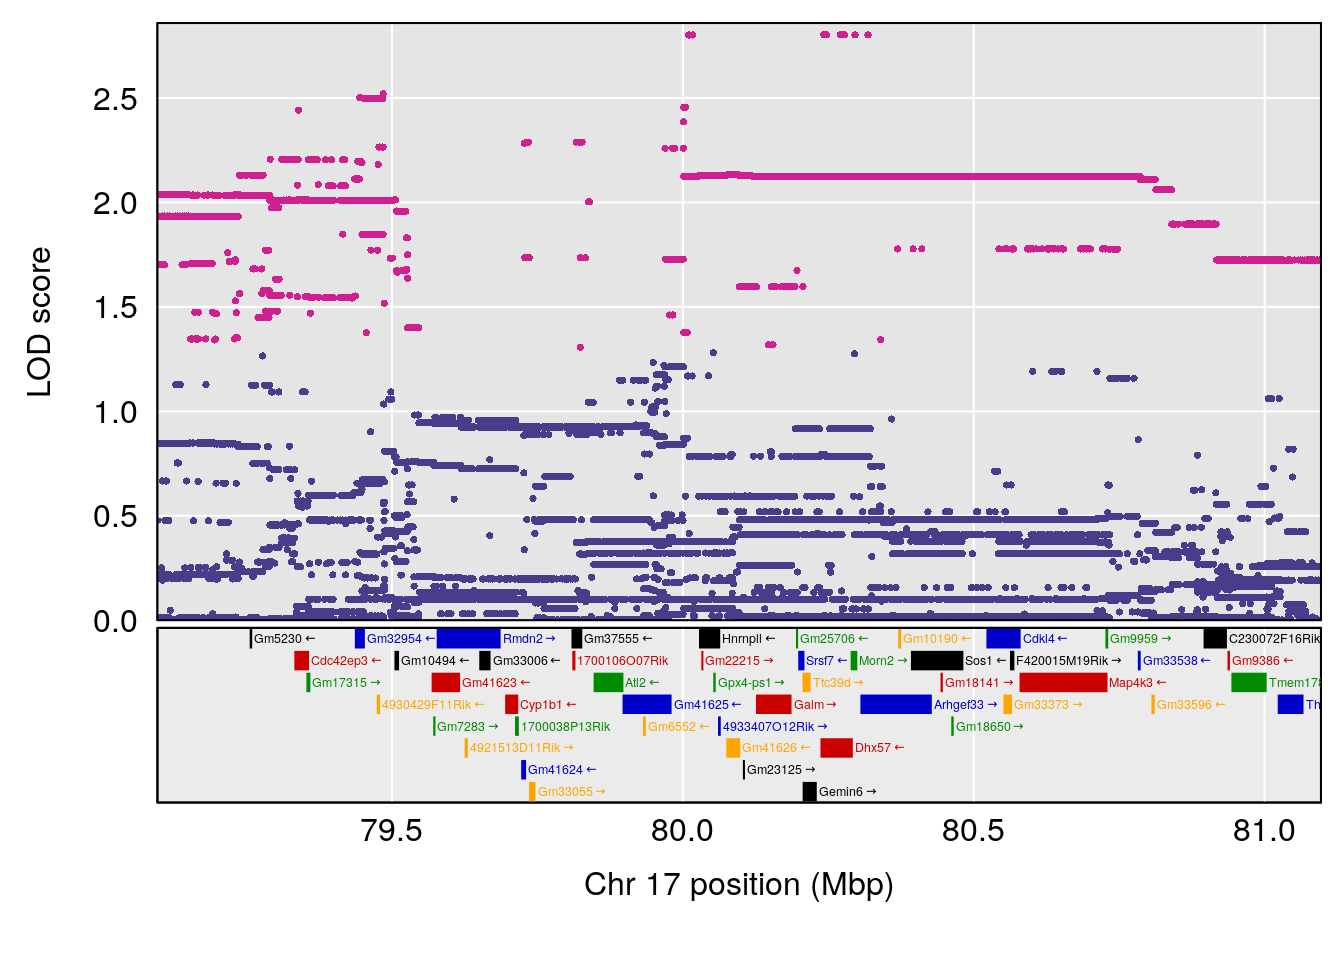
| Version | Author | Date |
|---|---|---|
| 8611541 | xhyuo | 2023-02-21 |
# [1] "Time.to.Recovery.Hr"
#   lodindex lodcolumn chr       pos      lod    ci_lo     ci_hi
# 1        1    pheno1   3 148.59948 6.440788 53.60570 148.61250
# 2        1    pheno1   4  22.26230 6.109573 17.41576 137.08866
# 3        1    pheno1  10  70.01089 7.242967 68.18103  70.90480
# 4        1    pheno1  14  80.19357 6.242259 79.67940  80.21217
# 5        1    pheno1  18  23.93757 6.888692 22.73513  24.98189
# [1] 1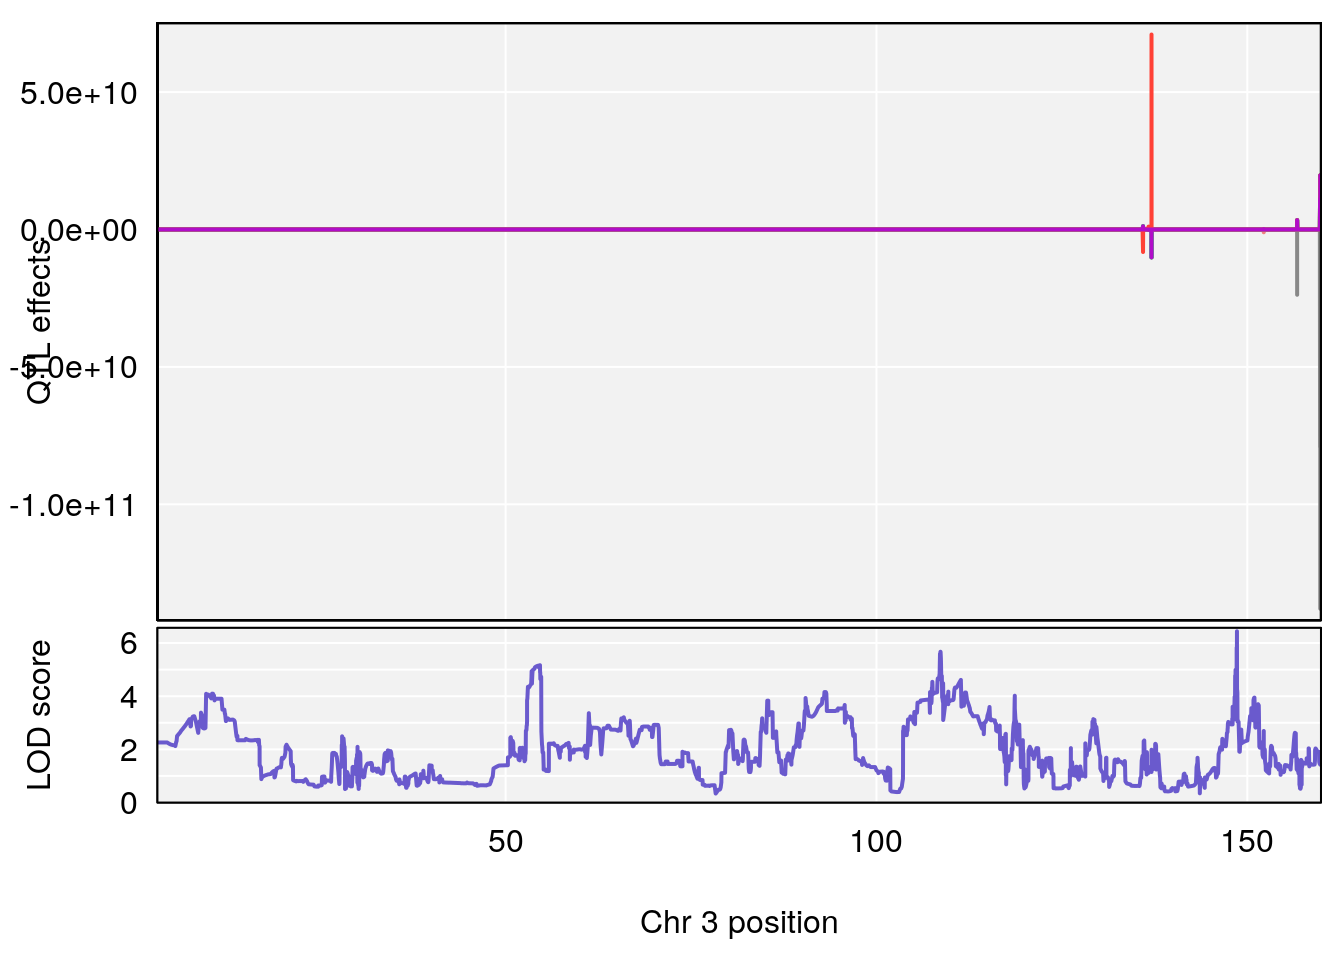
| Version | Author | Date |
|---|---|---|
| 8611541 | xhyuo | 2023-02-21 |

| Version | Author | Date |
|---|---|---|
| 8611541 | xhyuo | 2023-02-21 |
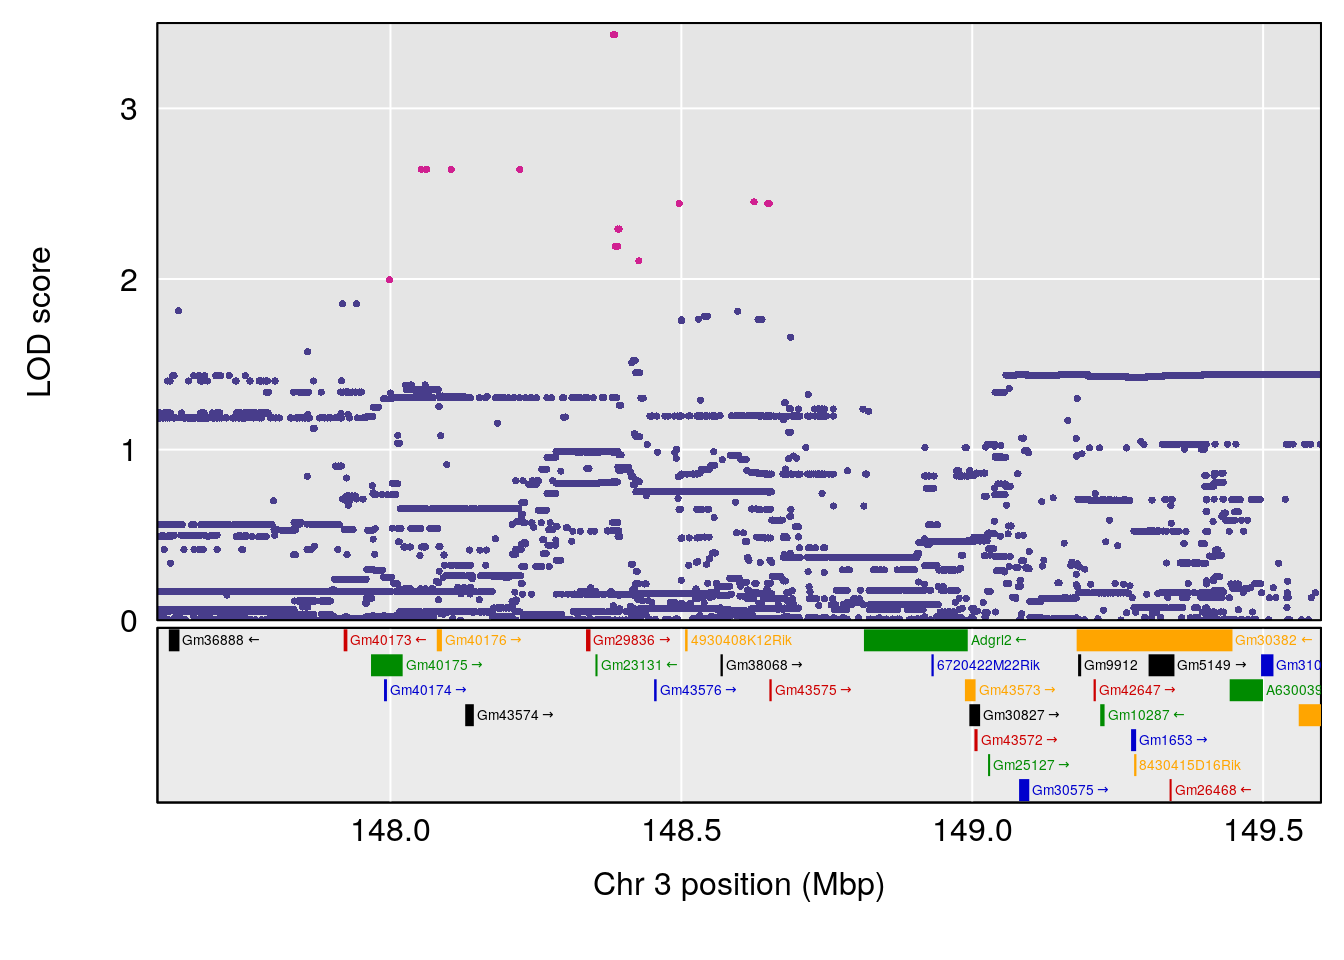
| Version | Author | Date |
|---|---|---|
| 8611541 | xhyuo | 2023-02-21 |
# [1] 2
| Version | Author | Date |
|---|---|---|
| 8611541 | xhyuo | 2023-02-21 |

| Version | Author | Date |
|---|---|---|
| 8611541 | xhyuo | 2023-02-21 |

| Version | Author | Date |
|---|---|---|
| 8611541 | xhyuo | 2023-02-21 |
# [1] 3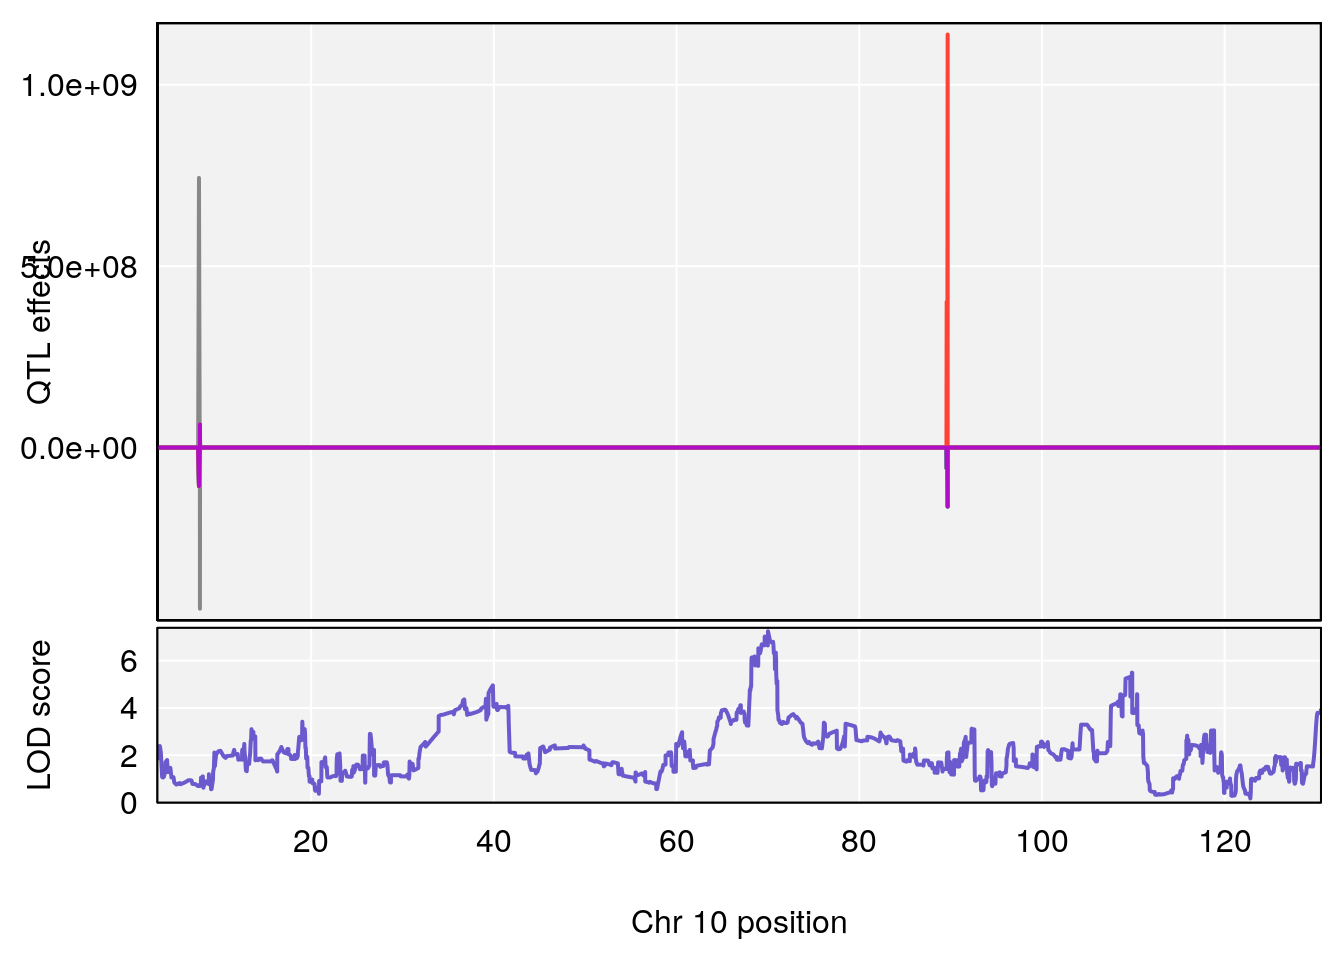
| Version | Author | Date |
|---|---|---|
| 8611541 | xhyuo | 2023-02-21 |

| Version | Author | Date |
|---|---|---|
| 8611541 | xhyuo | 2023-02-21 |
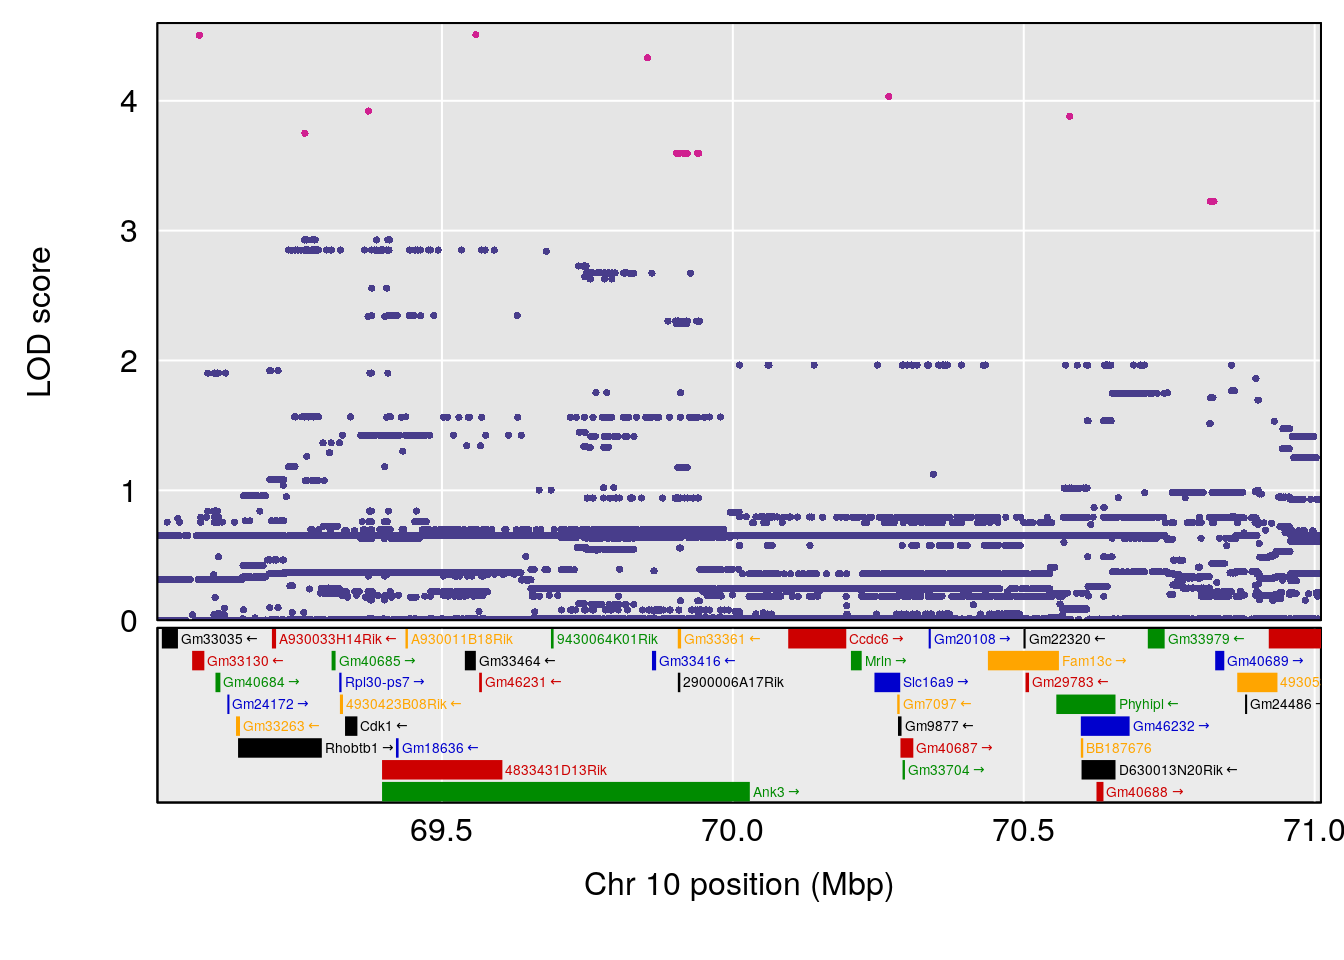
| Version | Author | Date |
|---|---|---|
| 8611541 | xhyuo | 2023-02-21 |
# [1] 4
| Version | Author | Date |
|---|---|---|
| 8611541 | xhyuo | 2023-02-21 |

| Version | Author | Date |
|---|---|---|
| 8611541 | xhyuo | 2023-02-21 |

| Version | Author | Date |
|---|---|---|
| 8611541 | xhyuo | 2023-02-21 |
# [1] 5
| Version | Author | Date |
|---|---|---|
| 8611541 | xhyuo | 2023-02-21 |
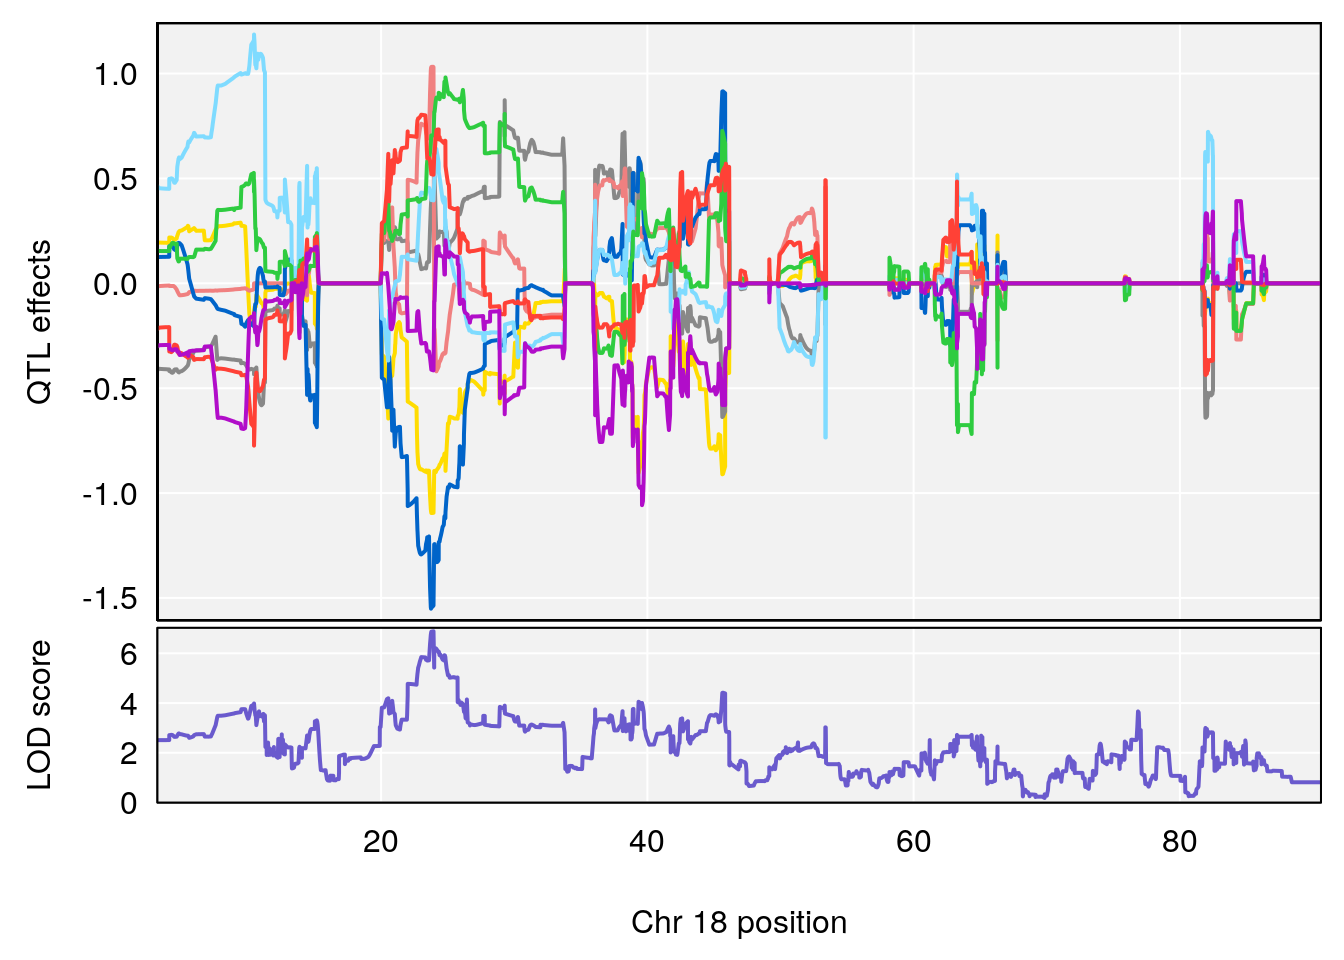
| Version | Author | Date |
|---|---|---|
| 8611541 | xhyuo | 2023-02-21 |
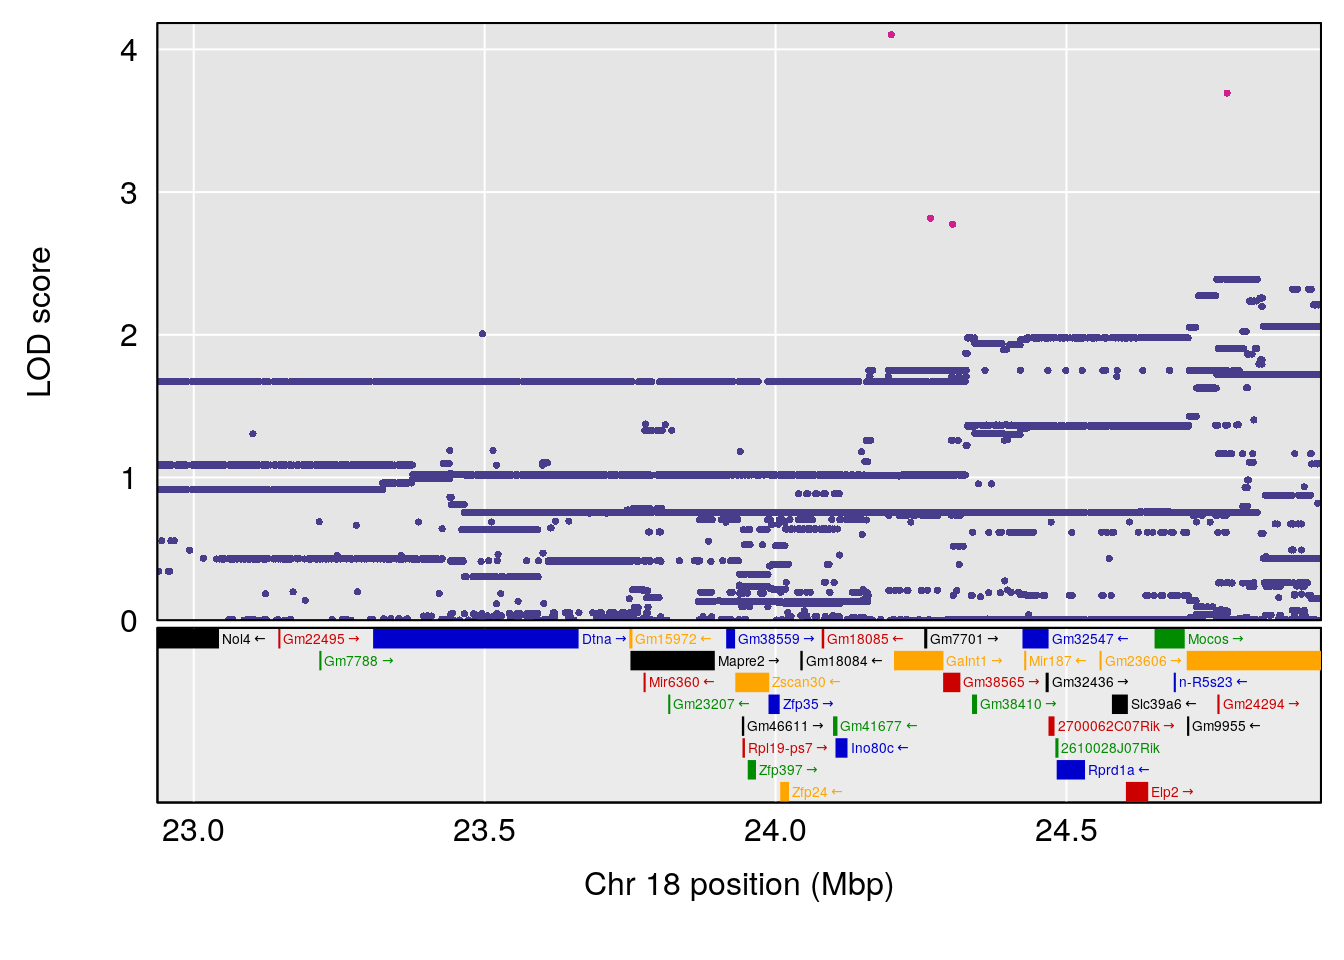
| Version | Author | Date |
|---|---|---|
| 8611541 | xhyuo | 2023-02-21 |
# [1] "Status_bin"
#   lodindex lodcolumn chr       pos      lod    ci_lo     ci_hi
# 1        1    pheno1   1 185.11874 6.058648 41.25093 185.84088
# 2        1    pheno1  15  94.25093 7.334412 92.19023  94.31234
# 3        1    pheno1  18  16.19240 6.685013 15.31898  20.05685
# 4        1    pheno1  19  49.78637 6.595691 45.70921  53.50149
# [1] 1
| Version | Author | Date |
|---|---|---|
| 8611541 | xhyuo | 2023-02-21 |
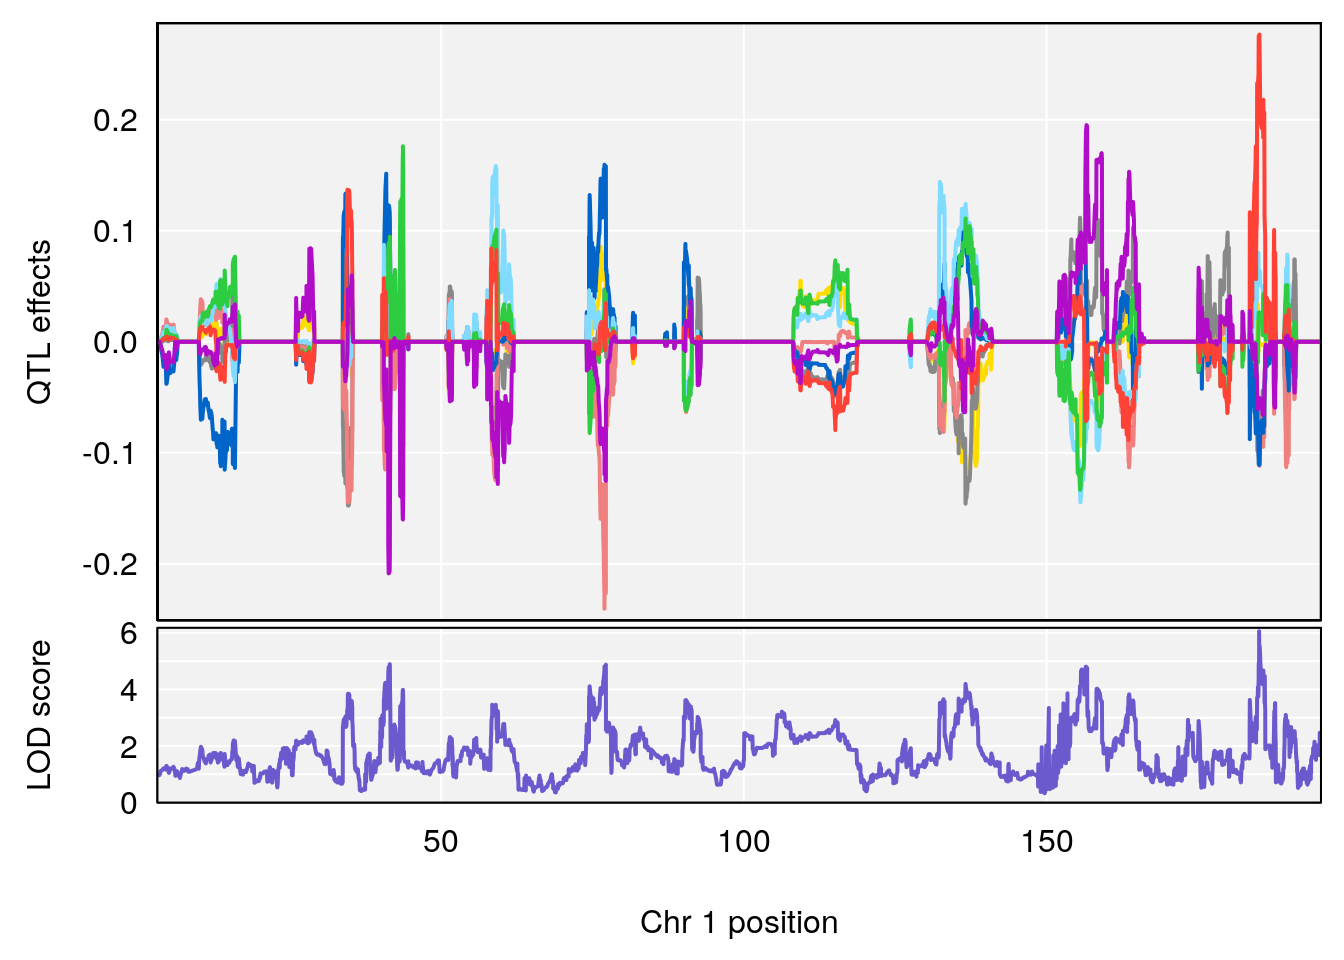
| Version | Author | Date |
|---|---|---|
| 8611541 | xhyuo | 2023-02-21 |

| Version | Author | Date |
|---|---|---|
| 8611541 | xhyuo | 2023-02-21 |
# [1] 2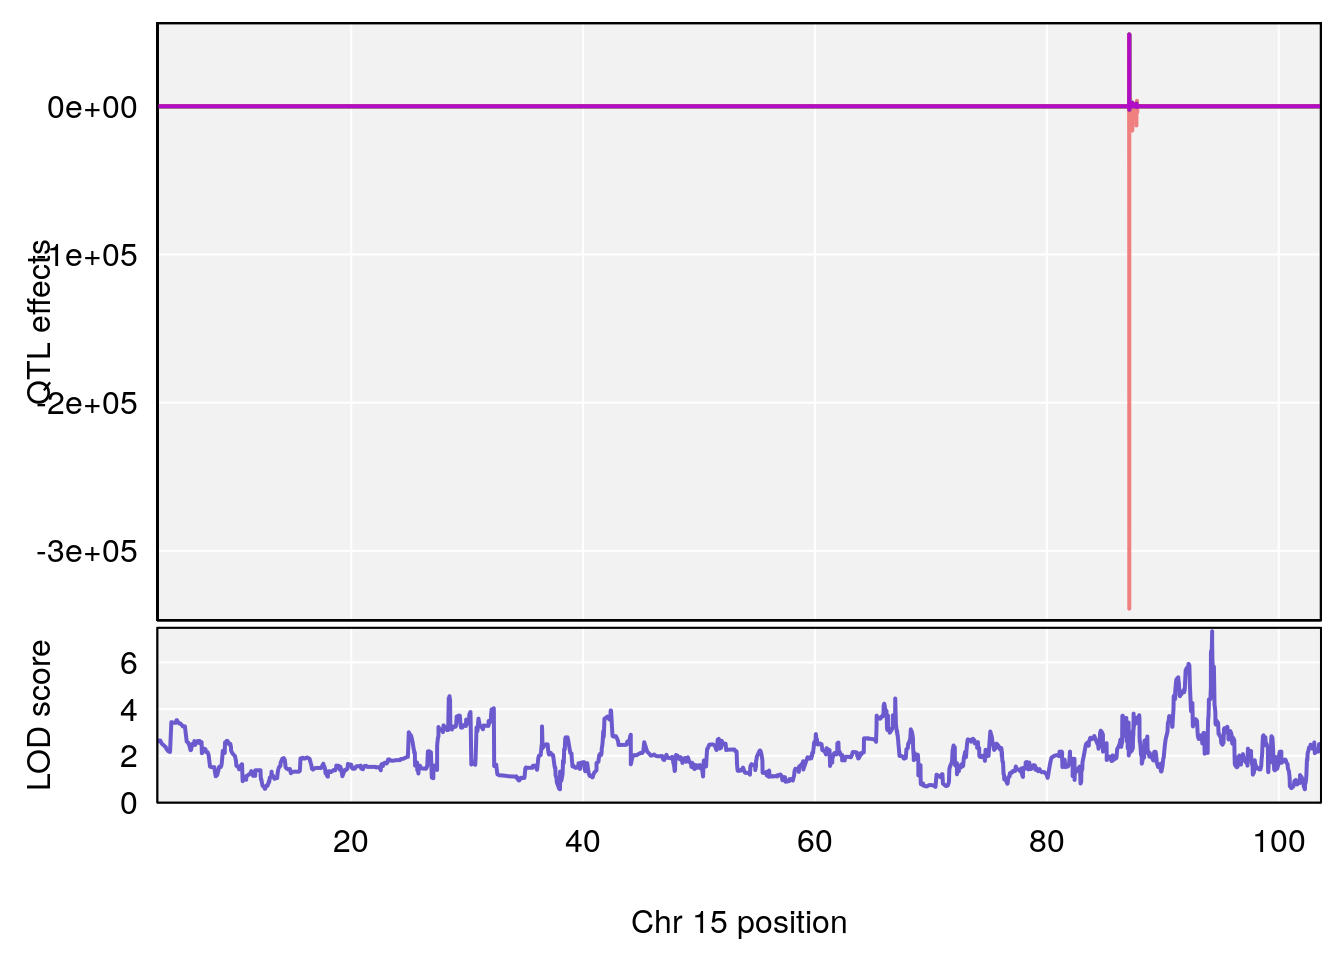
| Version | Author | Date |
|---|---|---|
| 8611541 | xhyuo | 2023-02-21 |
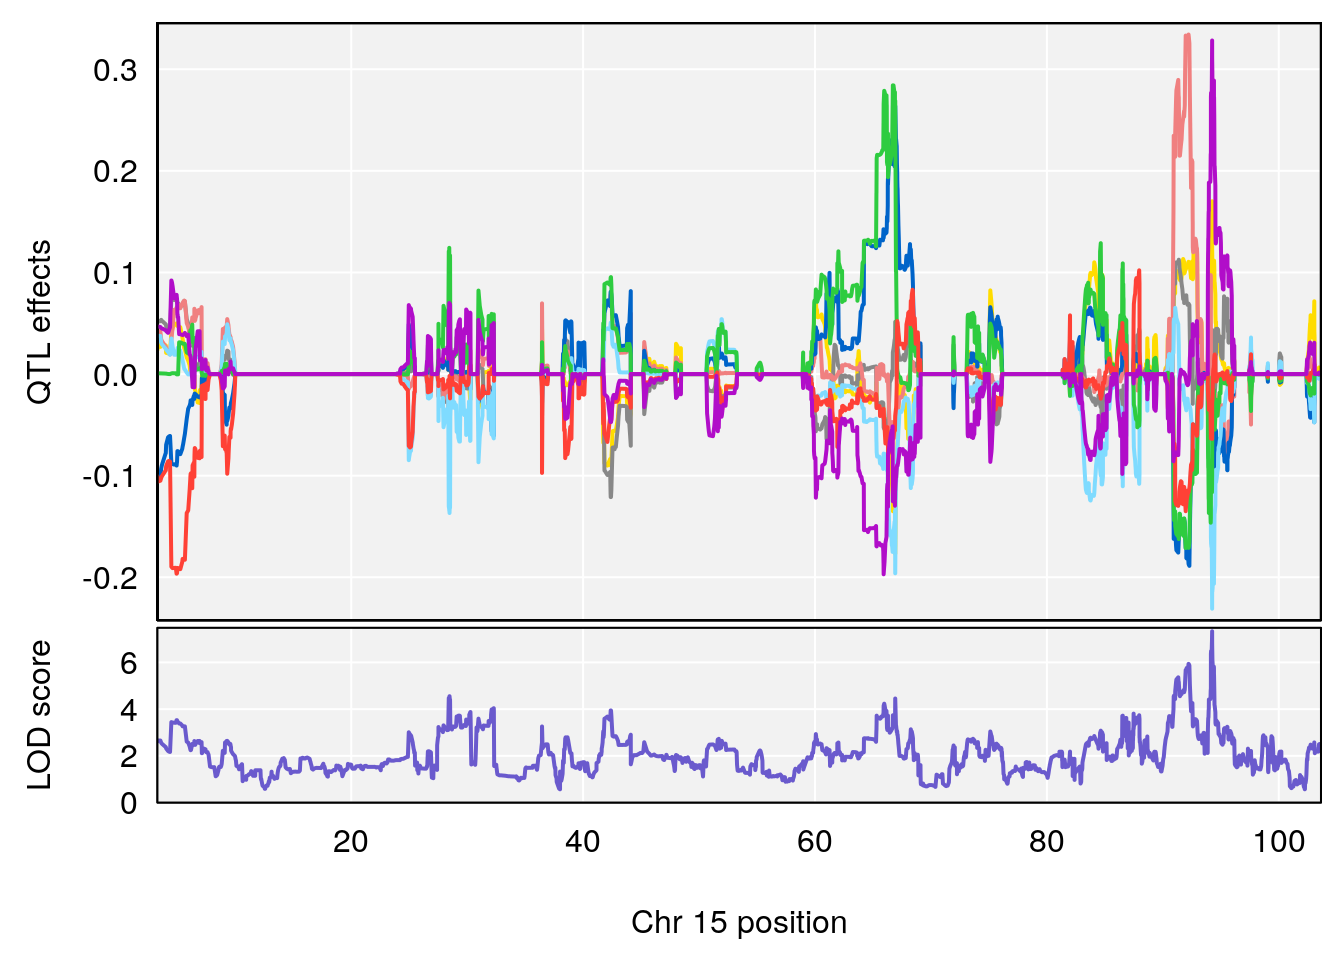
| Version | Author | Date |
|---|---|---|
| 8611541 | xhyuo | 2023-02-21 |
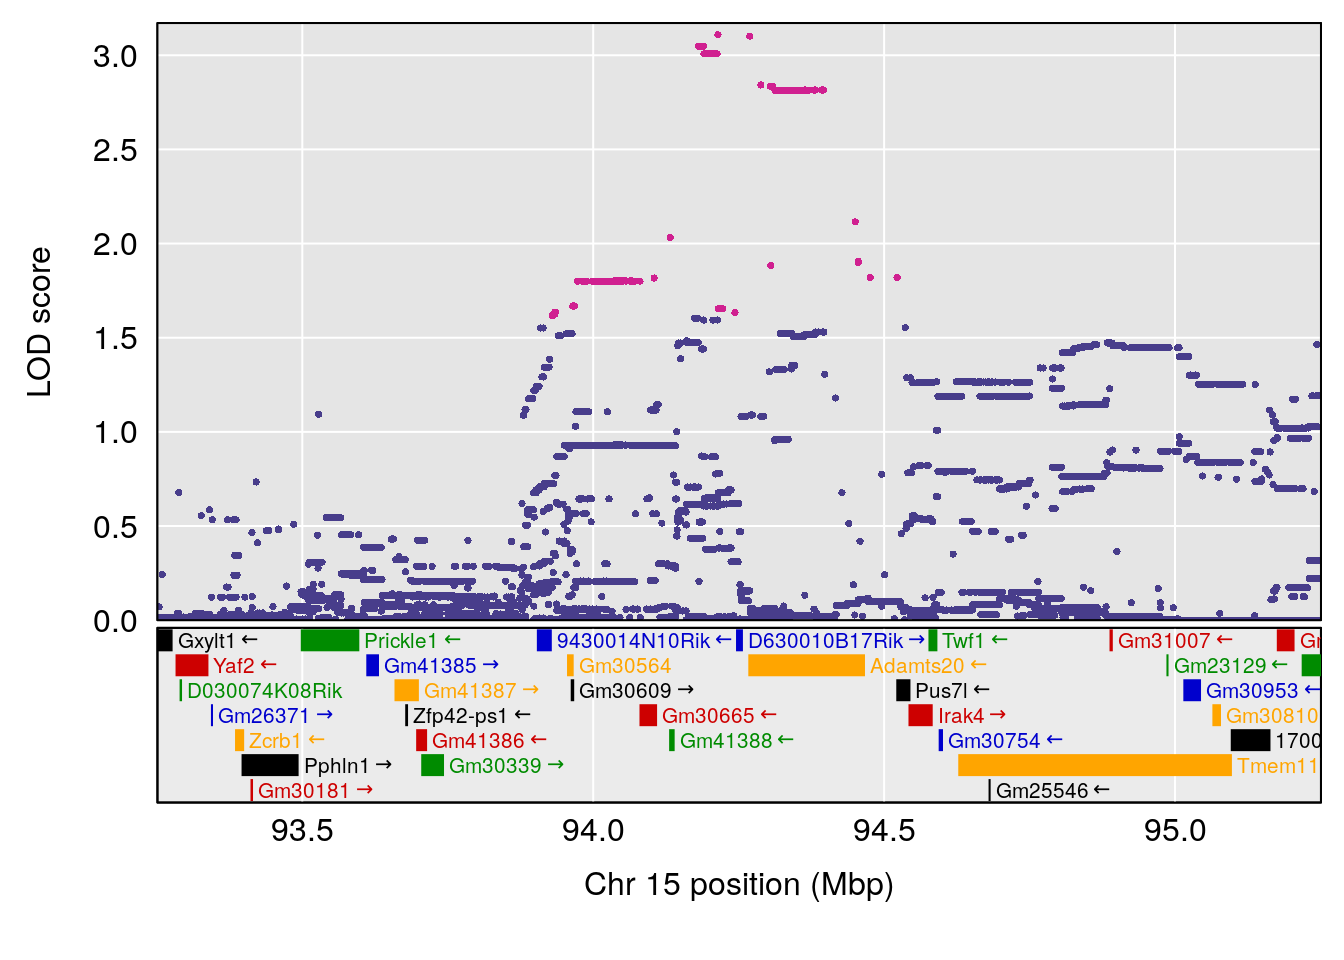
| Version | Author | Date |
|---|---|---|
| 8611541 | xhyuo | 2023-02-21 |
# [1] 3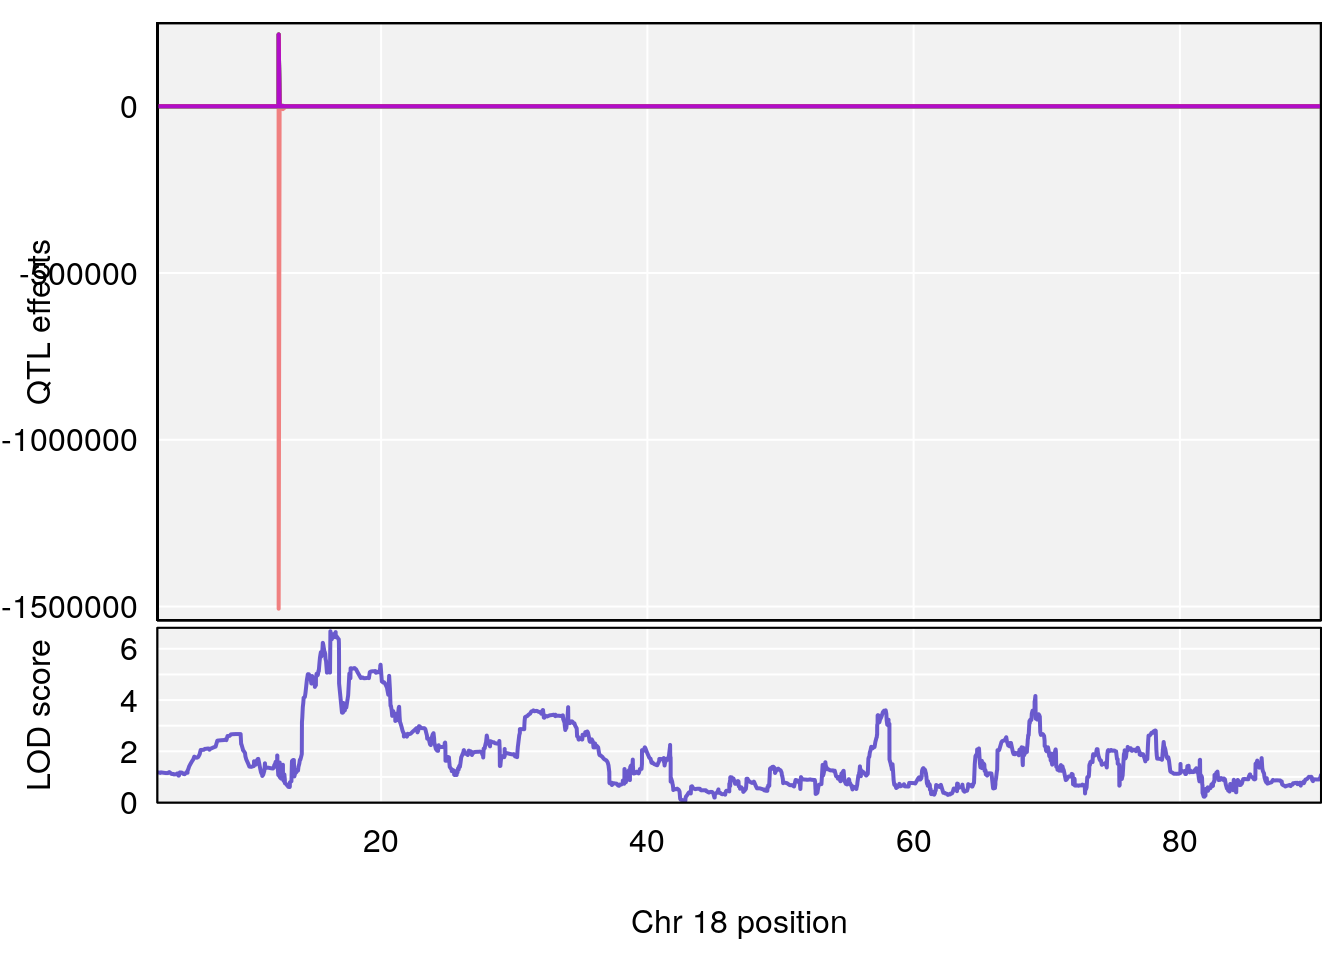
| Version | Author | Date |
|---|---|---|
| 8611541 | xhyuo | 2023-02-21 |
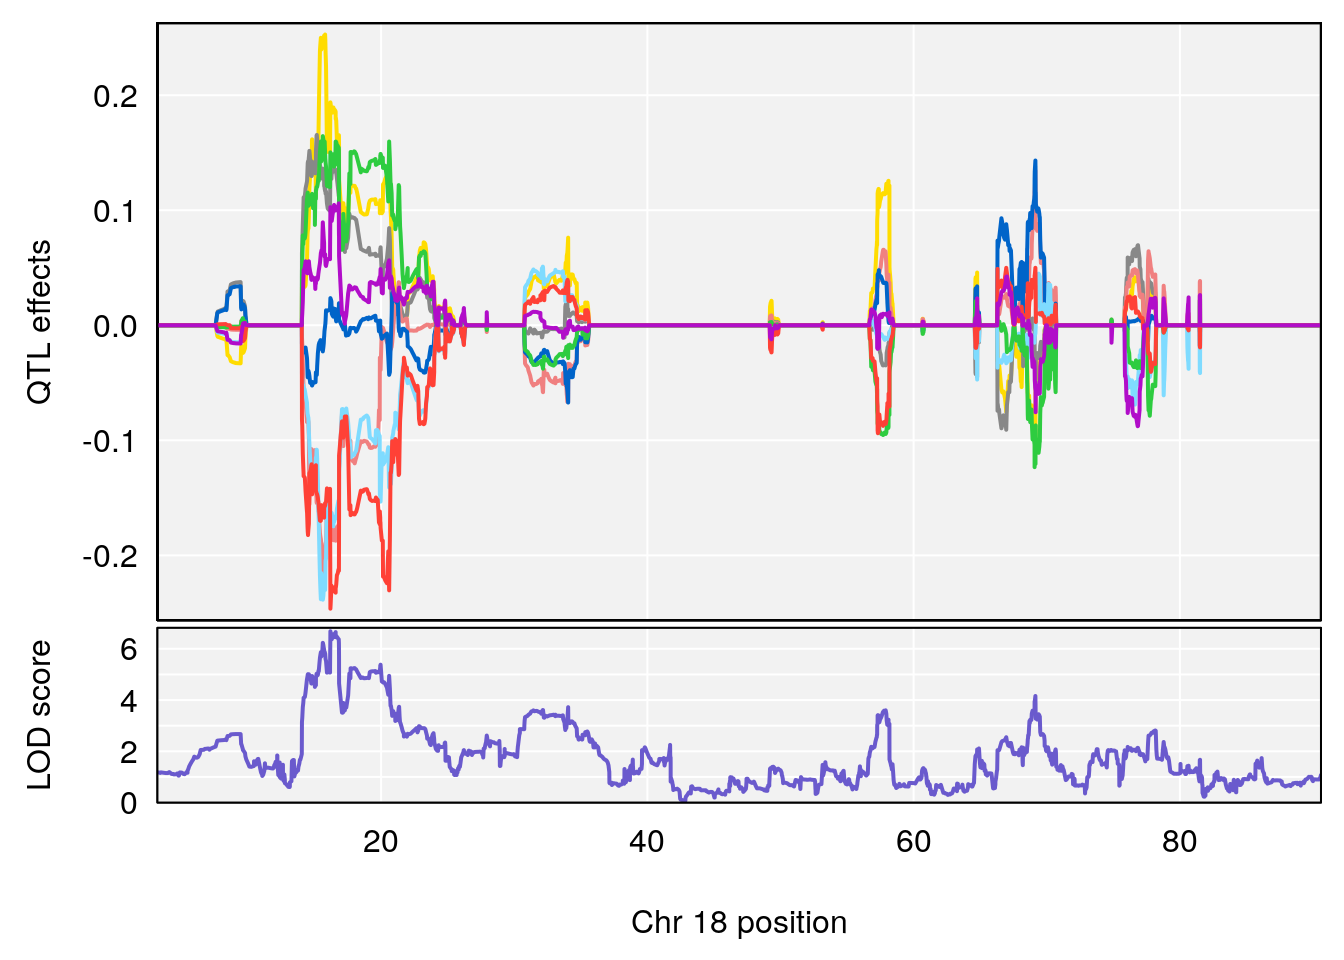
| Version | Author | Date |
|---|---|---|
| 8611541 | xhyuo | 2023-02-21 |
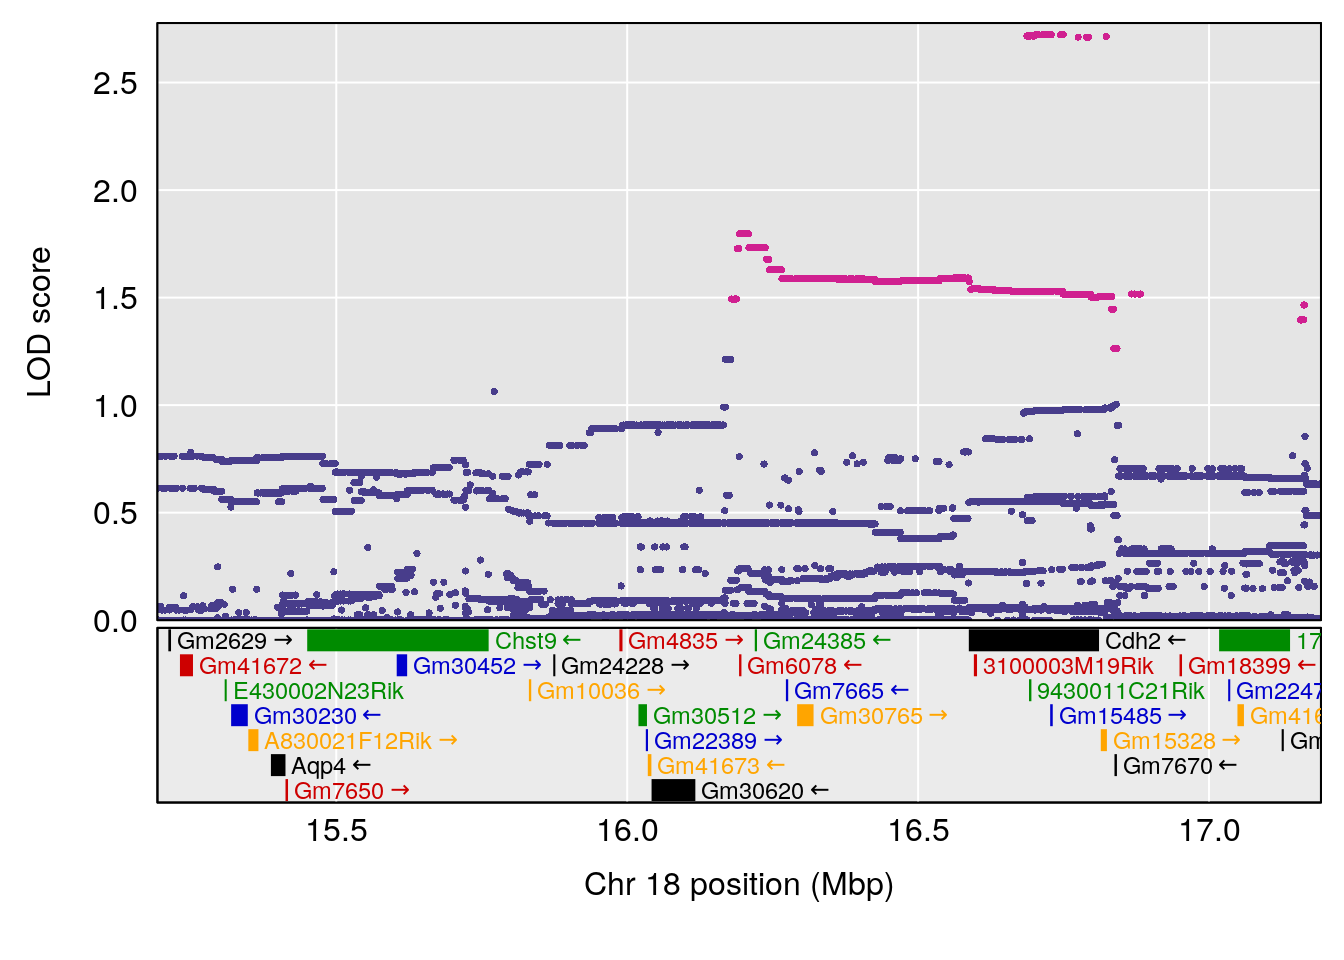
| Version | Author | Date |
|---|---|---|
| 8611541 | xhyuo | 2023-02-21 |
# [1] 4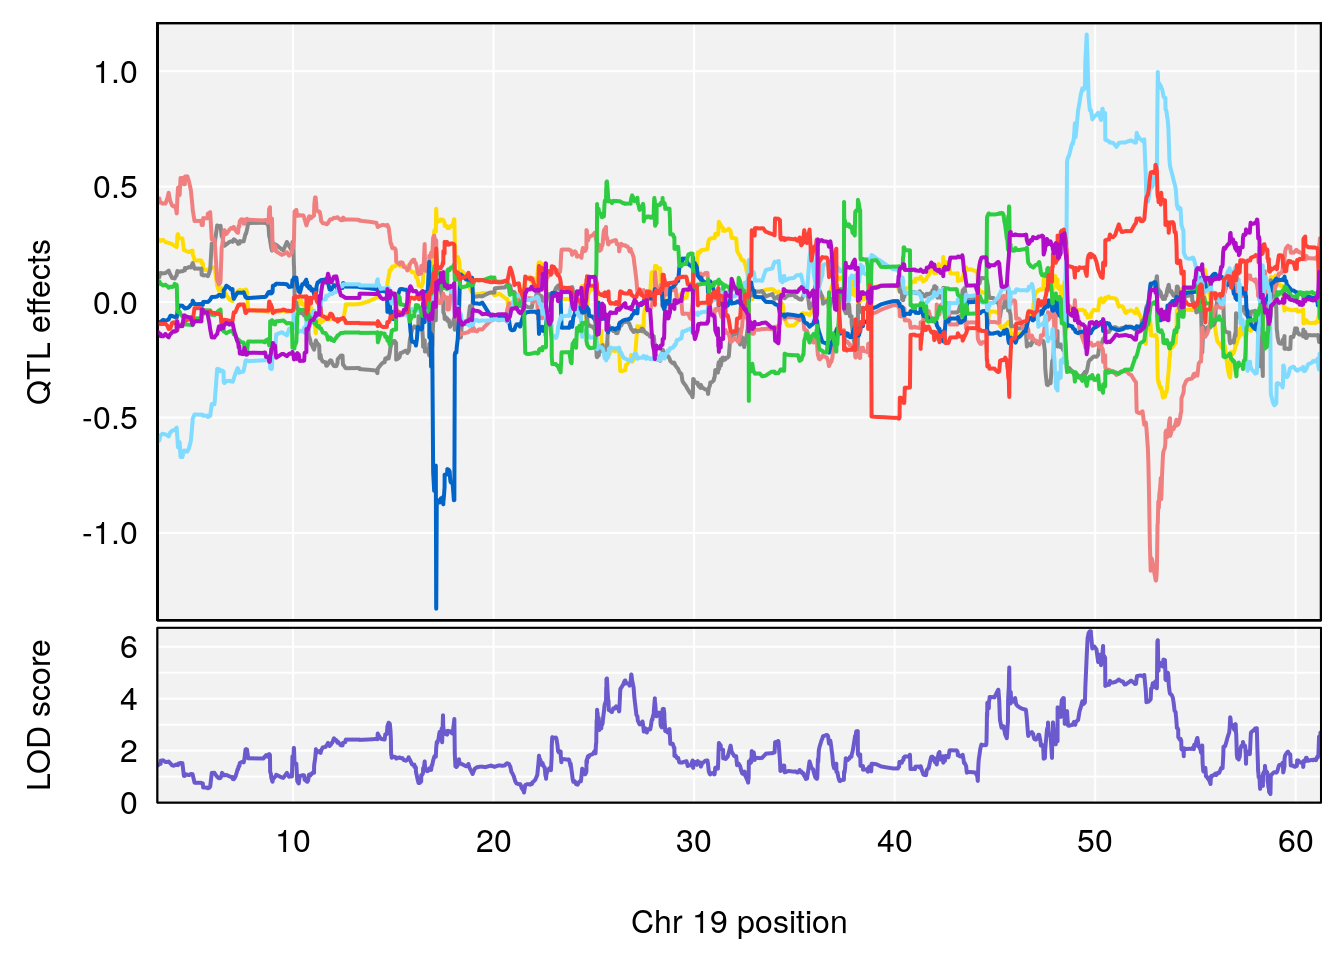
| Version | Author | Date |
|---|---|---|
| 8611541 | xhyuo | 2023-02-21 |
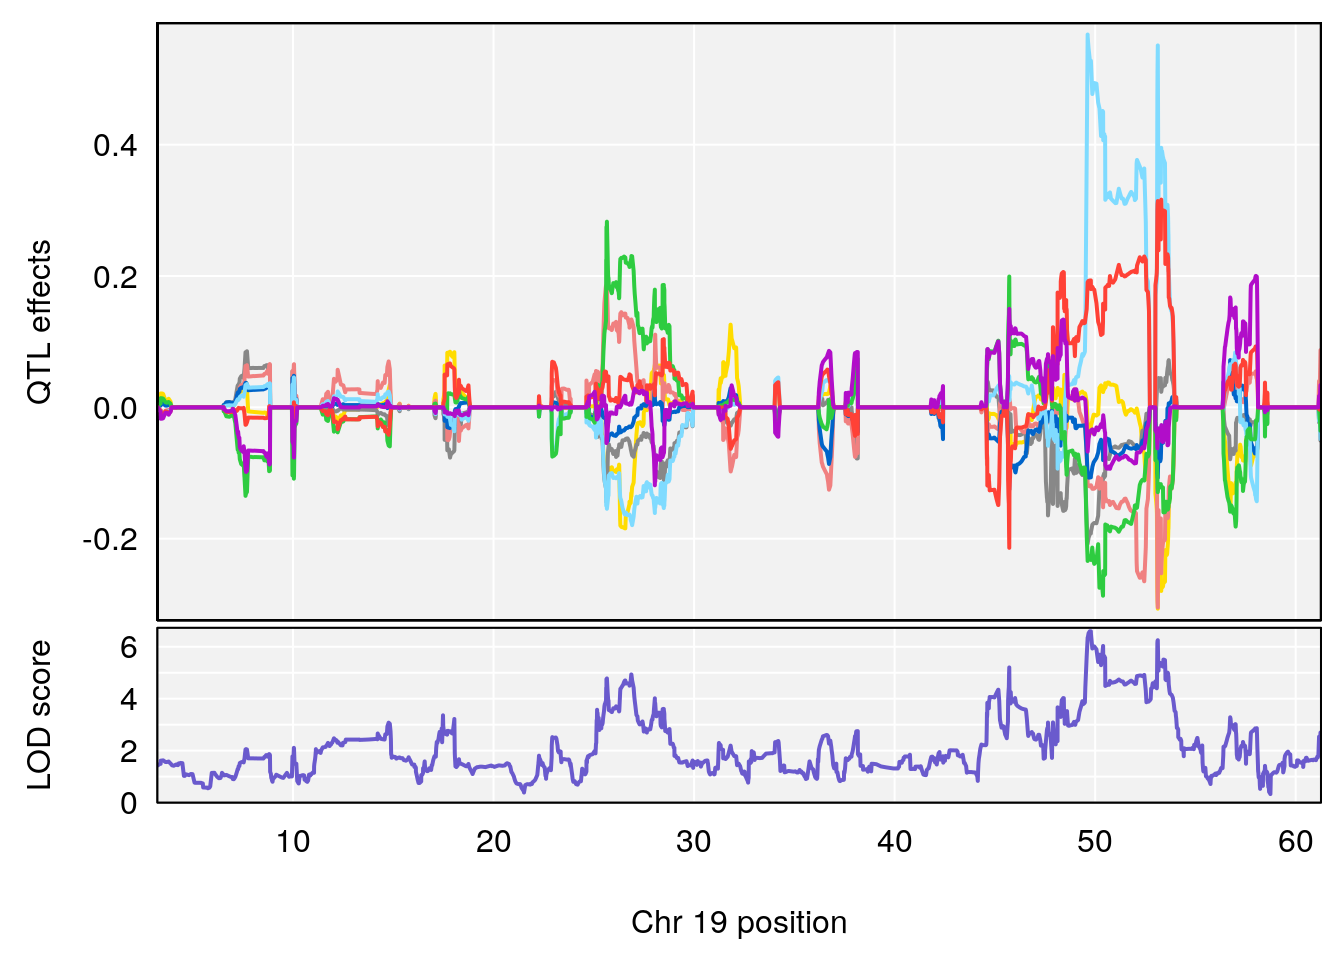
| Version | Author | Date |
|---|---|---|
| 8611541 | xhyuo | 2023-02-21 |
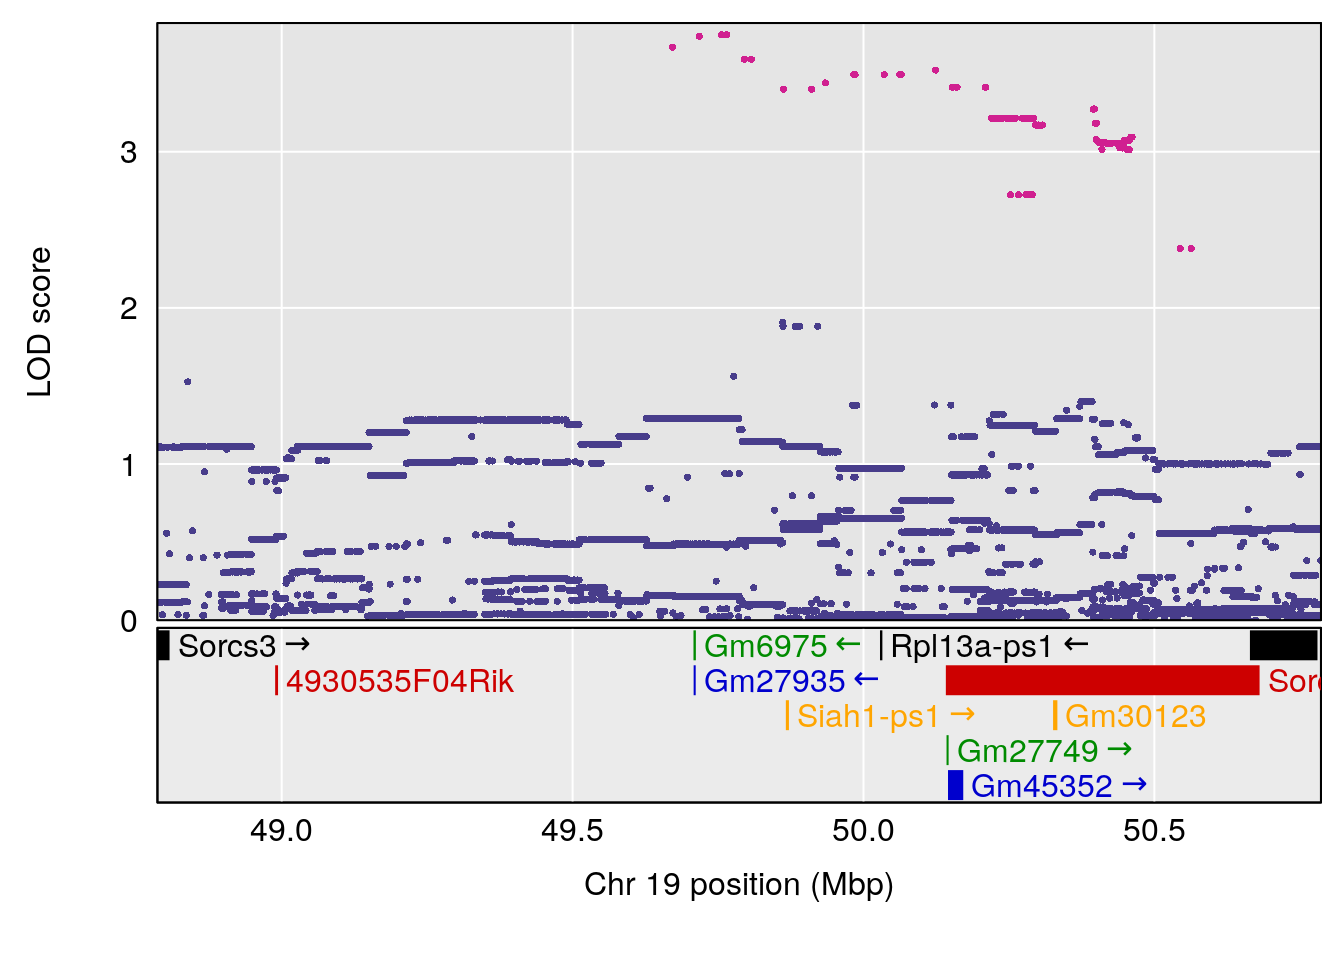
| Version | Author | Date |
|---|---|---|
| 8611541 | xhyuo | 2023-02-21 |
sessionInfo()
# R version 4.0.3 (2020-10-10)
# Platform: x86_64-pc-linux-gnu (64-bit)
# Running under: Ubuntu 20.04.2 LTS
#
# Matrix products: default
# BLAS/LAPACK: /usr/lib/x86_64-linux-gnu/openblas-pthread/libopenblasp-r0.3.8.so
#
# locale:
#  [1] LC_CTYPE=en_US.UTF-8       LC_NUMERIC=C
#  [3] LC_TIME=en_US.UTF-8        LC_COLLATE=en_US.UTF-8
#  [5] LC_MONETARY=en_US.UTF-8    LC_MESSAGES=C
#  [7] LC_PAPER=en_US.UTF-8       LC_NAME=C
#  [9] LC_ADDRESS=C               LC_TELEPHONE=C
# [11] LC_MEASUREMENT=en_US.UTF-8 LC_IDENTIFICATION=C
#
# attached base packages:
# [1] parallel  stats     graphics  grDevices utils     datasets  methods
# [8] base
#
# other attached packages:
#  [1] forcats_0.5.1   stringr_1.4.0   dplyr_1.0.4     purrr_0.3.4
#  [5] readr_1.4.0     tidyr_1.1.2     tibble_3.0.6    tidyverse_1.3.0
#  [9] openxlsx_4.2.3  abind_1.4-5     regress_1.3-21  survival_3.2-7
# [13] qtl2_0.24       GGally_2.1.0    gridExtra_2.3   ggplot2_3.3.3
# [17] workflowr_1.6.2
#
# loaded via a namespace (and not attached):
#  [1] httr_1.4.2         bit64_4.0.5        jsonlite_1.7.2     splines_4.0.3
#  [5] modelr_0.1.8       assertthat_0.2.1   highr_0.8          blob_1.2.1
#  [9] cellranger_1.1.0   yaml_2.2.1         pillar_1.4.7       RSQLite_2.2.3
# [13] backports_1.2.1    lattice_0.20-41    glue_1.4.2         digest_0.6.27
# [17] RColorBrewer_1.1-2 promises_1.2.0.1   rvest_0.3.6        colorspace_2.0-0
# [21] htmltools_0.5.1.1  httpuv_1.5.5       Matrix_1.3-2       plyr_1.8.6
# [25] pkgconfig_2.0.3    broom_0.7.4        haven_2.3.1        scales_1.1.1
# [29] whisker_0.4        later_1.1.0.1      git2r_0.28.0       farver_2.0.3
# [33] generics_0.1.0     ellipsis_0.3.1     cachem_1.0.4       withr_2.4.1
# [37] cli_2.3.0          magrittr_2.0.1     crayon_1.4.1       readxl_1.3.1
# [41] memoise_2.0.0      evaluate_0.14      fs_1.5.0           xml2_1.3.2
# [45] tools_4.0.3        data.table_1.13.6  hms_1.0.0          lifecycle_1.0.0
# [49] reprex_1.0.0       munsell_0.5.0      zip_2.1.1          compiler_4.0.3
# [53] rlang_1.0.2        grid_4.0.3         rstudioapi_0.13    labeling_0.4.2
# [57] rmarkdown_2.6      gtable_0.3.0       DBI_1.1.1          reshape_0.8.8
# [61] R6_2.5.0           lubridate_1.7.9.2  knitr_1.31         fastmap_1.1.0
# [65] bit_4.0.4          rprojroot_2.0.2    stringi_1.5.3      Rcpp_1.0.6
# [69] vctrs_0.3.6        dbplyr_2.1.0       tidyselect_1.1.0   xfun_0.21
This R Markdown site was created with workflowr