SIV user guide
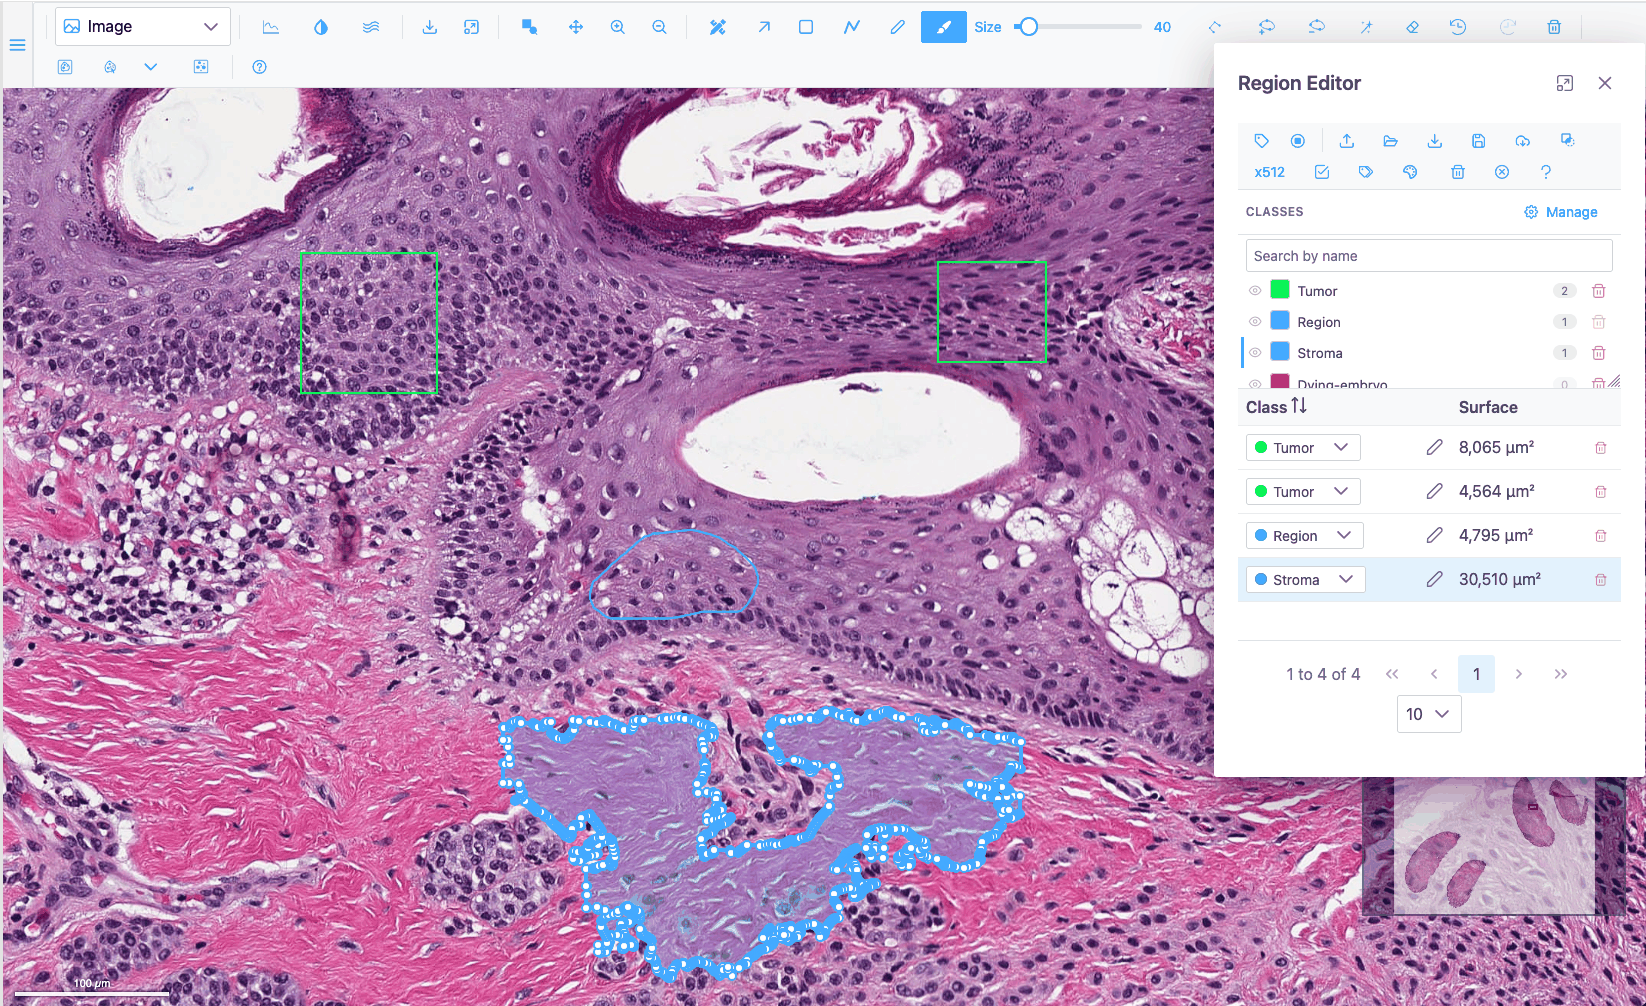
SIV (sci-image-visualizer) is the image viewer and annotation tool inside JAX Image Tools (JIT). It runs entirely in the browser and handles everything from a small PNG to a gigapixel whole-slide image, multichannel fluorescence, z-stacks and micro-CT volumes, and spatial-omics datasets. You can draw, edit and classify regions on any of them, and segment cells with AI models that run on your own machine.
JIT is the only JAX application that uses SIV today. SIV is a standalone Angular library, though, so other applications could embed it as well; this guide calls whichever application SIV runs in the host application. You can also try every feature without installing anything in the live demo.
How this guide is organised
-
Start here if you are new. Short guided lessons that take you from opening an image to an exported, classified set of annotations.
-
Recipes for a specific task: "make a dim channel visible", "segment every cell in an area", "select the cells inside a region".
-
Every button, slider, menu entry and shortcut: what it does, when it is available, and its defaults and limits.
-
Numbered test cases, one per behaviour, with steps and expected results, for verifying a release.
What SIV can do
| Area | Highlights | Read more |
|---|---|---|
| Viewing | Tiled, deep zoom on gigapixel images; minimap; scale bar in physical units; raw-pixel or smoothed rendering | Navigation |
| Plot types | Image, Heatmap, Contour, Surface, Volume, Isosurface, Spatial omics (2D and 3D) | Plot types |
| Display | Per-channel colour, visibility, min/max, gamma, colormaps, histogram, composite export | Channels & Histogram |
| Stacks and volumes | Slice slider, z-stacks, 3D volume and isosurface rendering, 3D camera | Stacks, volumes and 3D |
| Measuring | Intensity profile lines; region areas in µm² or mm² | Intensity profiles |
| Drawing regions | Rectangle, polyline, freeform, polygon, brush, magic wand, vertex tools, undo/redo | Region tools |
| Editing regions | Merge, ungroup, inverse, simplify, Bézier conversion, holes (donuts) | Region actions |
| Organising annotations | Region Editor table, annotation classes with colour presets, bulk relabelling | Region Editor |
| Exchanging annotations | GeoJSON import and export (QuPath-compatible) | GeoJSON |
| AI segmentation | Segment Anything (box and point prompts) and Cellpose, in the browser | AI segmentation |
| Spatial omics | Cells or spots over the tissue, coloured by cluster or gene; select from regions; distribution charts | Spatial omics |
Getting help in the app
The Help button at the end of the toolbar opens the toolbar reference of this guide in a new tab, and the Region Editor's button opens the Region Editor reference. Most buttons also show a tooltip when you hover over them.
Try it without installing anything
The live demo runs SIV with a gallery of sample images, whole-slide images and spatial-omics datasets. Every tutorial and QA case in this guide can be followed there.
Conventions
- Bold text is a label you see on screen: a button tooltip, a menu entry, a dialog title.
- Keys look like Ctrl+Z. On macOS, read Ctrl as Cmd unless the text says otherwise.
- Icons are shown as they appear in the toolbar, for example
 for the Wand.
- "Image view" means the Image plot type, the default 2D view of an image.