Channels & Histogram
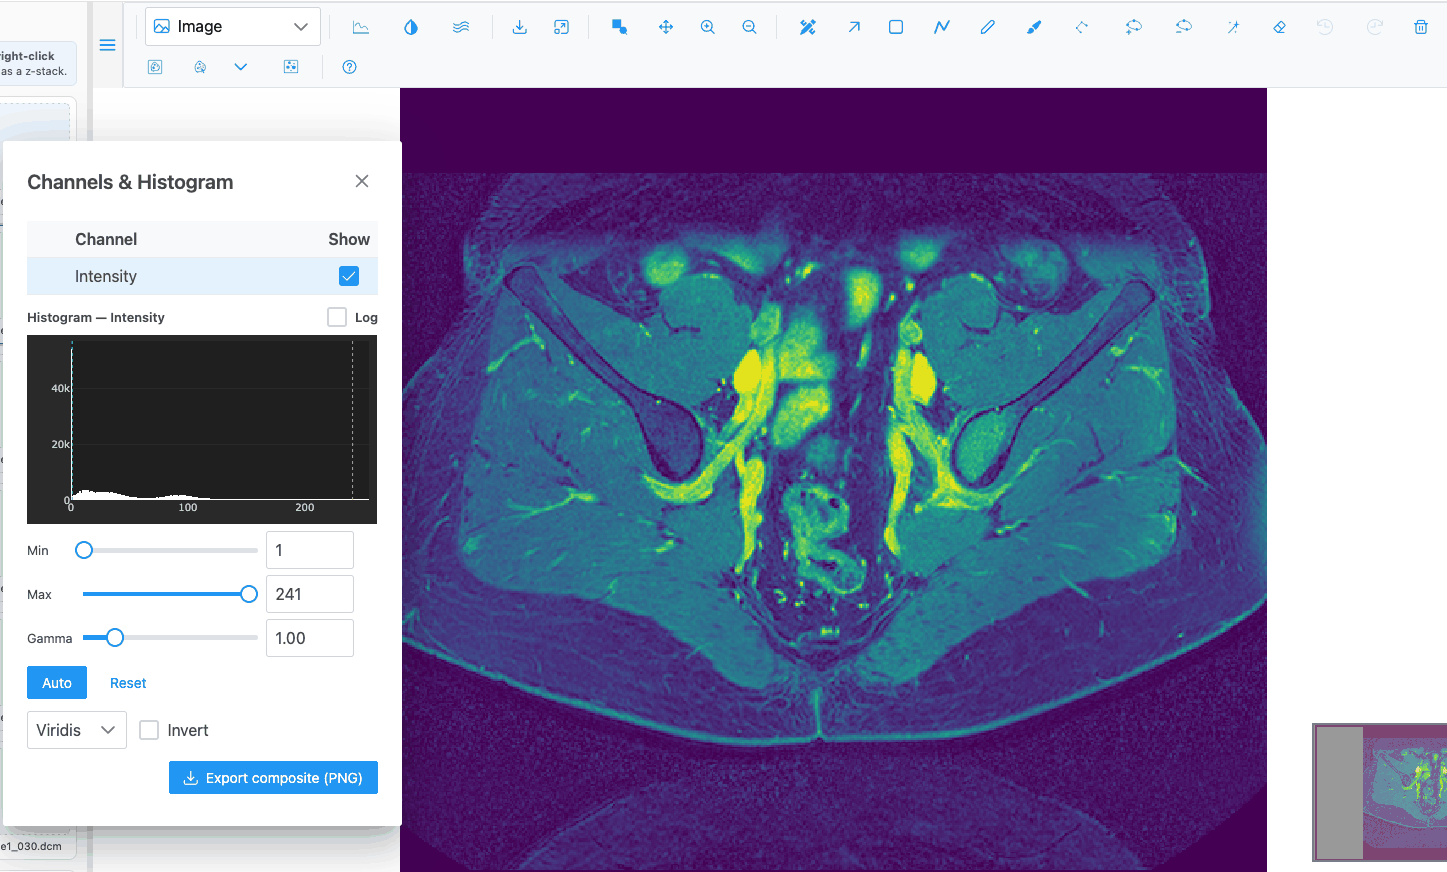
The Channels & Histogram dialog controls how pixel values become colours: which channels are shown, in
what colour, with what brightness, contrast and gamma, and which colormap a grayscale image uses. Open it
with the  button. It is available in every plot type.
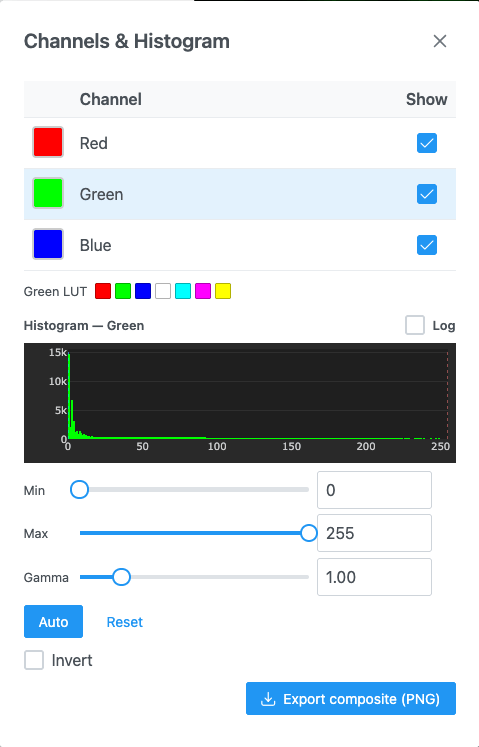
The dialog floats over the image: you can drag it, resize it and keep it open while you work. Every change applies live to the view (colour pickers apply when you release them).
Channel table
| Column | What it does |
|---|---|
| Colour swatch | The channel's colour. Click it to open the colour picker. Shown for RGB and multichannel images. |
| Channel | The channel name. Click the row to select the channel: the histogram and sliders below then apply to it. |
| Show | Shows or hides the channel. |
Default channels:
| Image | Channels |
|---|---|
| Grayscale | One channel, Intensity |
| RGB | Red, Green, Blue |
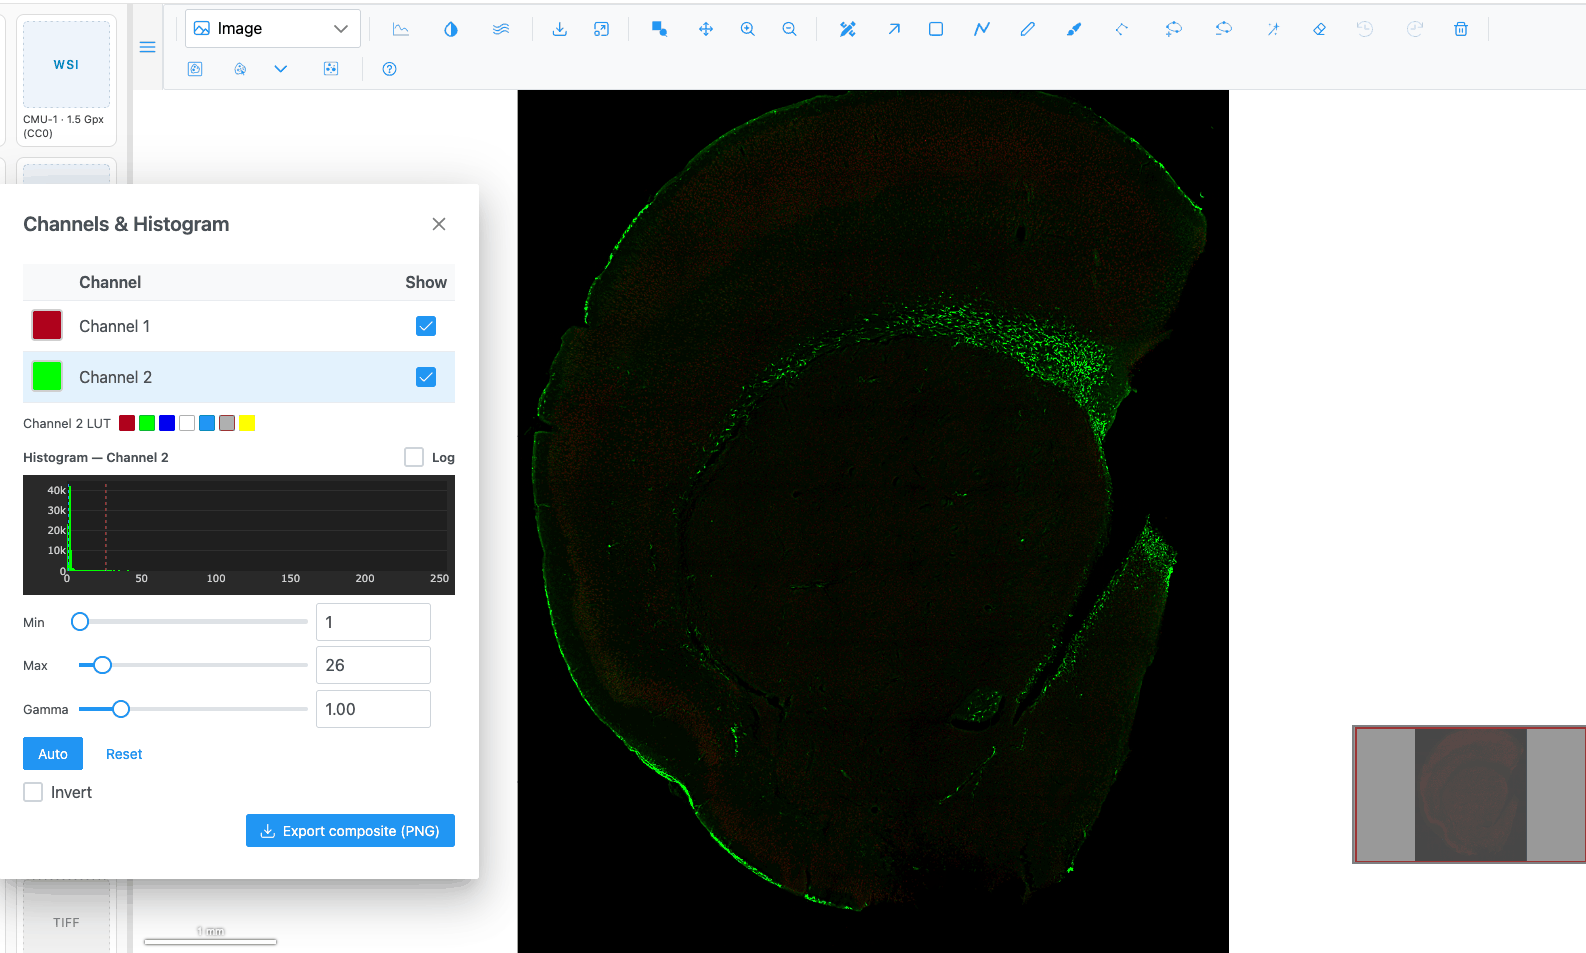
| Multichannel (fluorescence) | The names and colours the image carries, or "Channel 1", "Channel 2"… with red, green, blue, white, cyan, magenta, yellow. Only the first 4 channels are shown at first. Tick the others to show them. |
When the image groups its channels (for example by acquisition round), the table shows a folding row per group. The group checkbox is ticked only when every channel in it is shown (its tooltip says "n of m shown"). Clicking it shows or hides the whole group.
Warning
On a grayscale image, unticking Intensity hides the only channel, and the image goes blank. Tick it again to bring it back.
Colour picker
Click a swatch to open the picker: a honeycomb palette, a hex field (#RRGGBB), the system colour picker,
hue/saturation/lightness sliders and red/green/blue fields (0–255). A palette click applies and closes the
picker; the sliders apply when released. Click outside to close it.
LUT presets
For RGB and multichannel images, the
Histogram
Histogram —
For 8-bit images the histogram is sampled from the displayed tiles. For images deeper than 8 bits (16-bit microscopy), it comes from the server, and the axis and sliders use the image's own values over its observed range.
Brightness, contrast and gamma
| Control | Range | Default | What it does |
|---|---|---|---|
| Min | 0–255 (8-bit) or the native range | 0 | Values at or below Min are drawn black (or transparent for a channel). |
| Max | 0–255 (8-bit) or the native range | 255 | Values at or above Max are drawn at full colour. |
| Gamma | 0.1–5 (step 0.01) | 1.00 | Below 1 brightens dim values; above 1 darkens them. |
| Auto | — | — | Sets Min and Max to saturate 0.1% of pixels at each end. |
| Reset | — | — | Restores Min 0, Max 255, gamma 1 and the channel's default colour. |
Min can never pass Max: dragging one pushes the other. A small spinner shows next to a control while the view updates. Settings apply per channel.
Colormap and Invert
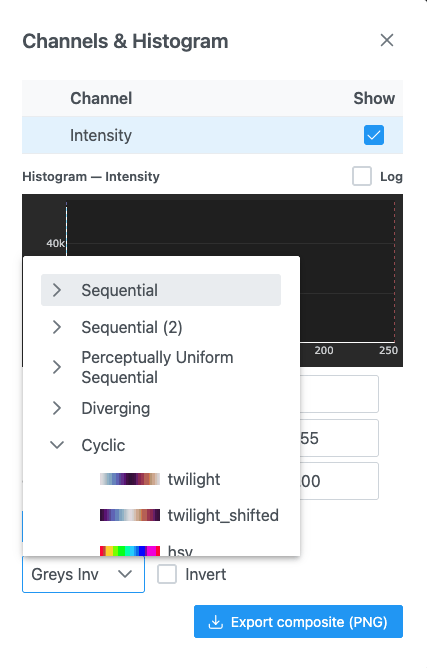
Colormap (grayscale images only) maps intensities to a colour scale. The default is Greys Inv. The list is grouped, with a preview of each colormap:
| Group | Colormaps |
|---|---|
| Sequential | Greys, Purples, Blues, Greens, Oranges, Reds, YlOrBr, YlOrRd, OrRd, PuRd, RdPu, BuPu, GnBu, YlGnBu, PuBuGn, BuGn, YlGn, Greys Inv, Greens Inv, YlOrRd Inv, YlGnBu Inv |
| Sequential (2) | binary, gist_yarg, gist_gray, gray, bone, pink, spring, summer, autumn, winter, cool, Wistia, hot, afmhot, gist_heat, copper, Bluered |
| Perceptually Uniform Sequential | Viridis, Magma, Inferno, Cividis, Electric, Plasma |
| Diverging | PiYG, PRGn, BrBG, PuOr, RdGy, RdBu, RdYlBu, RdYlGn, Spectral, coolwarm, bwr, seismic, berlin, managua, vanimo, Picnic, Portland |
| Cyclic | twilight, twilight_shifted, hsv |
| Qualitative | Pastel1, Pastel2, Accent, Dark2, Set1, Set2, Set3, tab10, tab20, tab20b, tab20c |
| Miscellaneous | flag, prism, ocean, gist_earth, terrain, gist_stern, gnuplot, gnuplot2, CMRmap, cubehelix, brg, gist_rainbow, rainbow, jet, turbo, nipy_spectral, gist_ncar, Blackbody |
Invert (all images) inverts the displayed intensities. To reverse a colormap, pick its "Inv" variant where one exists.
Export
| Button | Shown | What it saves |
|---|---|---|
| Export composite (PNG) | Always | Image view: the whole image with the current channels, colours and contrast, at full resolution up to 32 megapixels (larger images are saved at the largest level that fits), as <image>_composite.png. Heatmap: the plot as a PNG. 3D views: a canvas screenshot (napari-js.png). |
| Export 16-bit TIFF | The selected channel is deeper than 8 bits | A multi-band TIFF of the visible channels at their native bit depth, built by the server, as <image>_16bit.ome.tif. Nothing is saved while the server is still caching the image. |
What is kept
- Display settings stay while you re-plot the same image (for example switching plot type). Opening a different image starts from that image's defaults.
- Nothing in this dialog is saved across a page reload.