Stacks and 3D
Recipes for z-stacks, volumes and the 3D plot types. See Stacks, volumes and 3D for every control.
Step through the slices of a stack
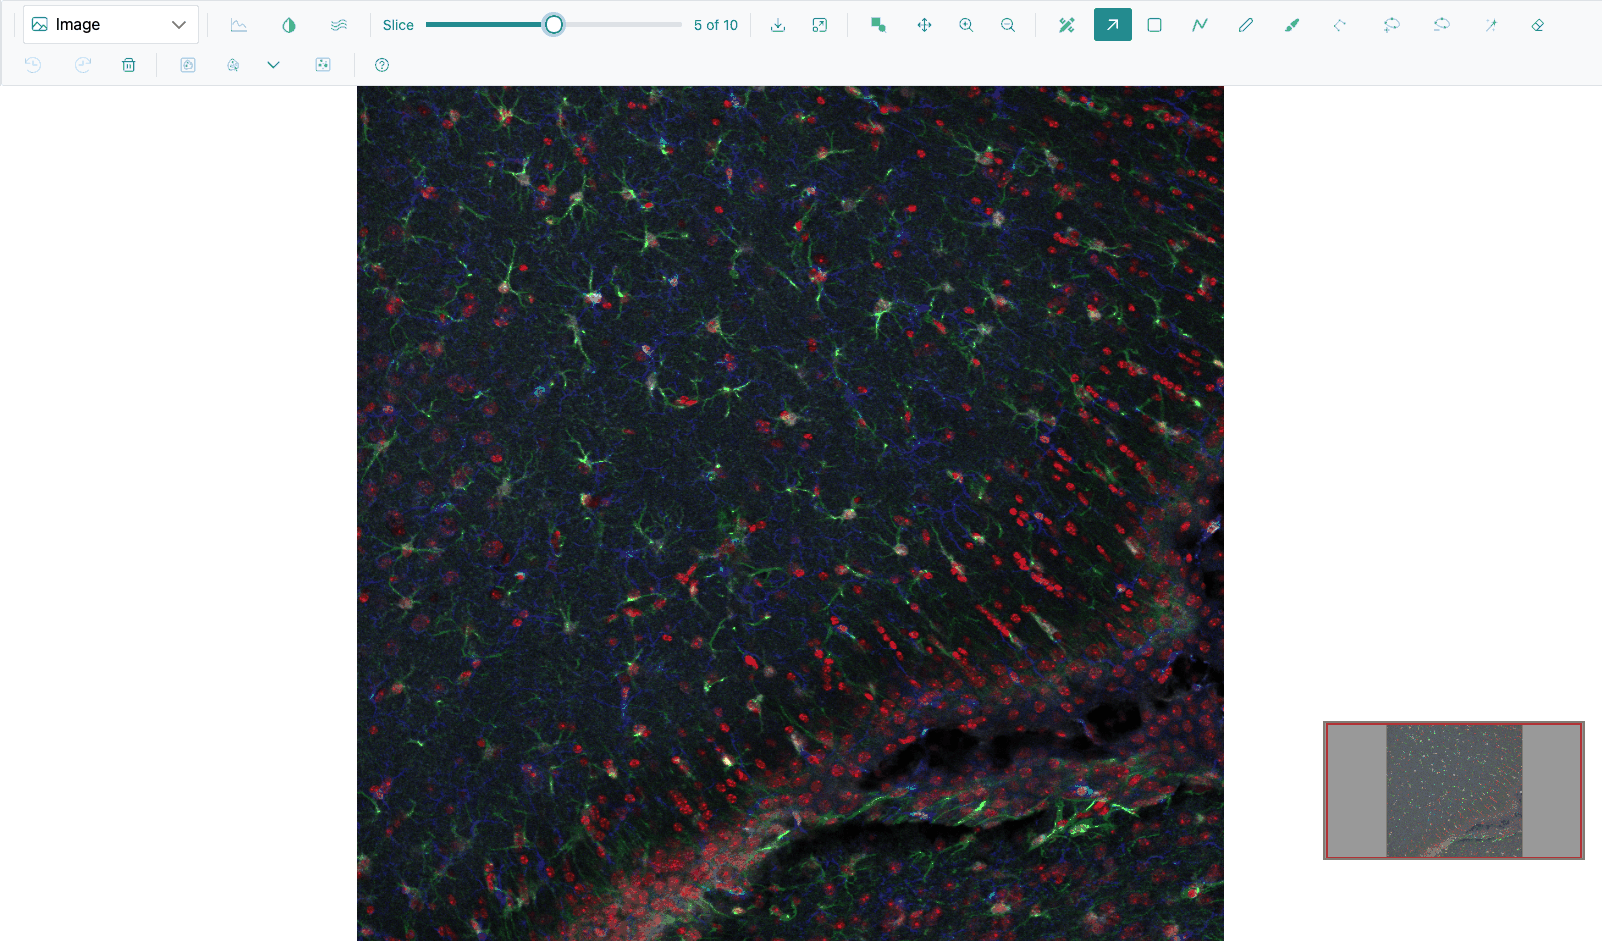
- Open a z-stack. In the demo, open the micro-ct folder and right-click a slice to load the folder as a stack, or open the TIFF GFPA_IBA1_…_zstack_Series002.tif.
- Drag the Slice slider in the toolbar, or press Left and Right while the pointer is over the image.
The readout "z of max" counts from 0. In the Image view, slices you have visited are kept in memory, so going back is instant, and zoom and pan are kept from slice to slice.
Note
The arrow keys step slices in the Image view and in the slice editor. In other views, click the slider first, then use the arrow keys.
Animate through a stack as a heatmap
- With a stack open, pick Heatmap.
- Click Stack mode. Every frame is loaded ("Loading frames...", with a Cancel button).
- Use the Z-plane: slider under the plot. It numbers slices from 1.
Click Single image mode to go back. In single-image mode, zooming fetches the visible area at full resolution.
See a stack as a 3D volume
- Open a grayscale or multichannel z-stack.
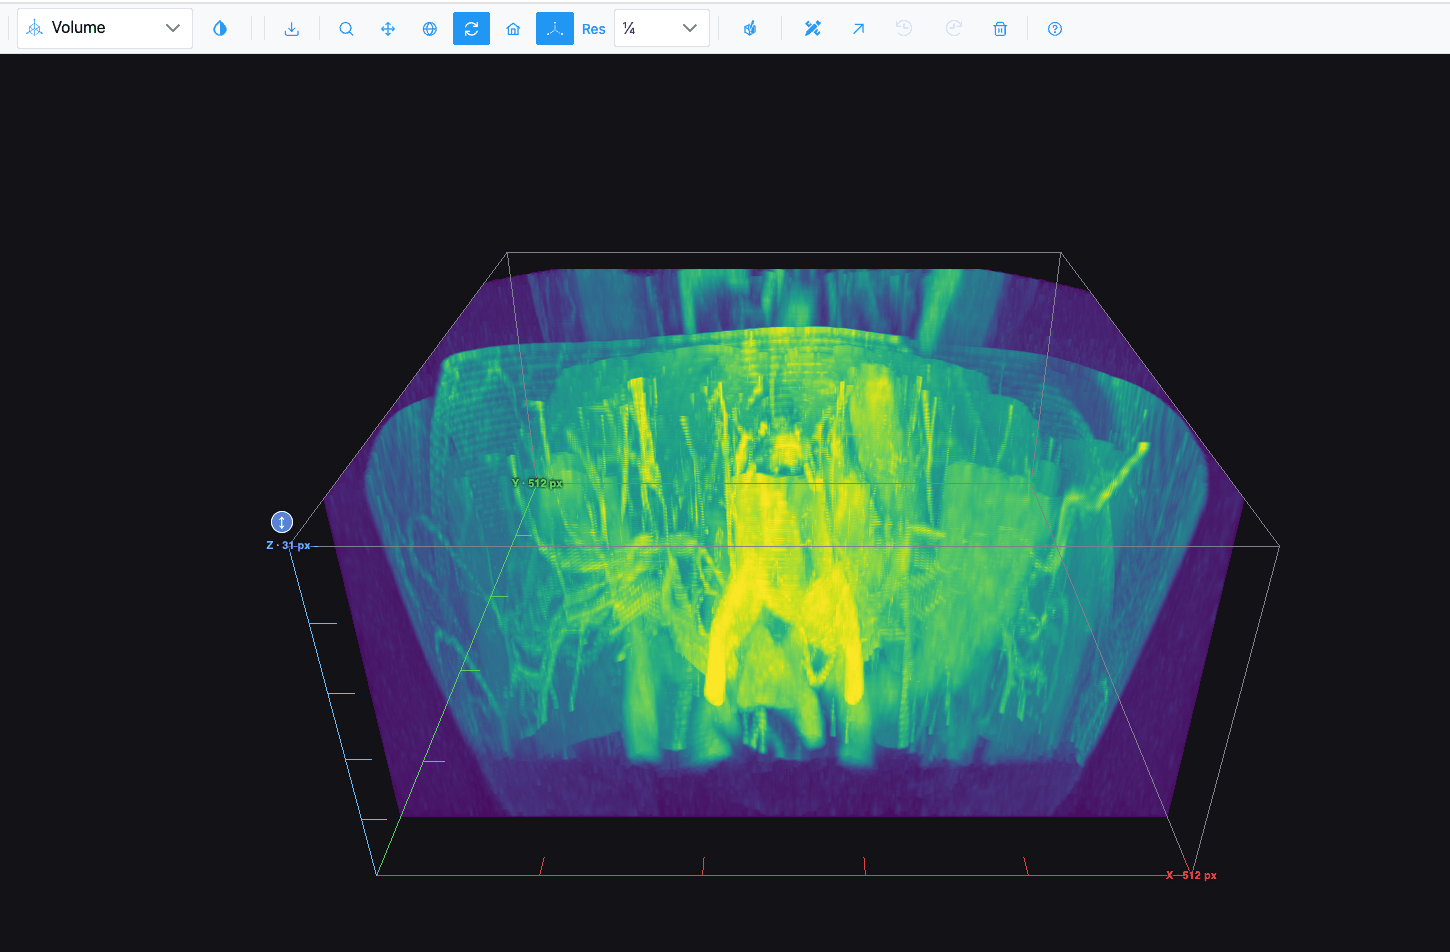
- Pick Volume in the plot-type dropdown. A badge shows "Building … in 3D…" while it loads.
- Drag to rotate, scroll to zoom.
The volume is a maximum-intensity projection. A multichannel stack draws one tinted layer per channel, in the colours set in Channels & Histogram.
Show surfaces at an intensity
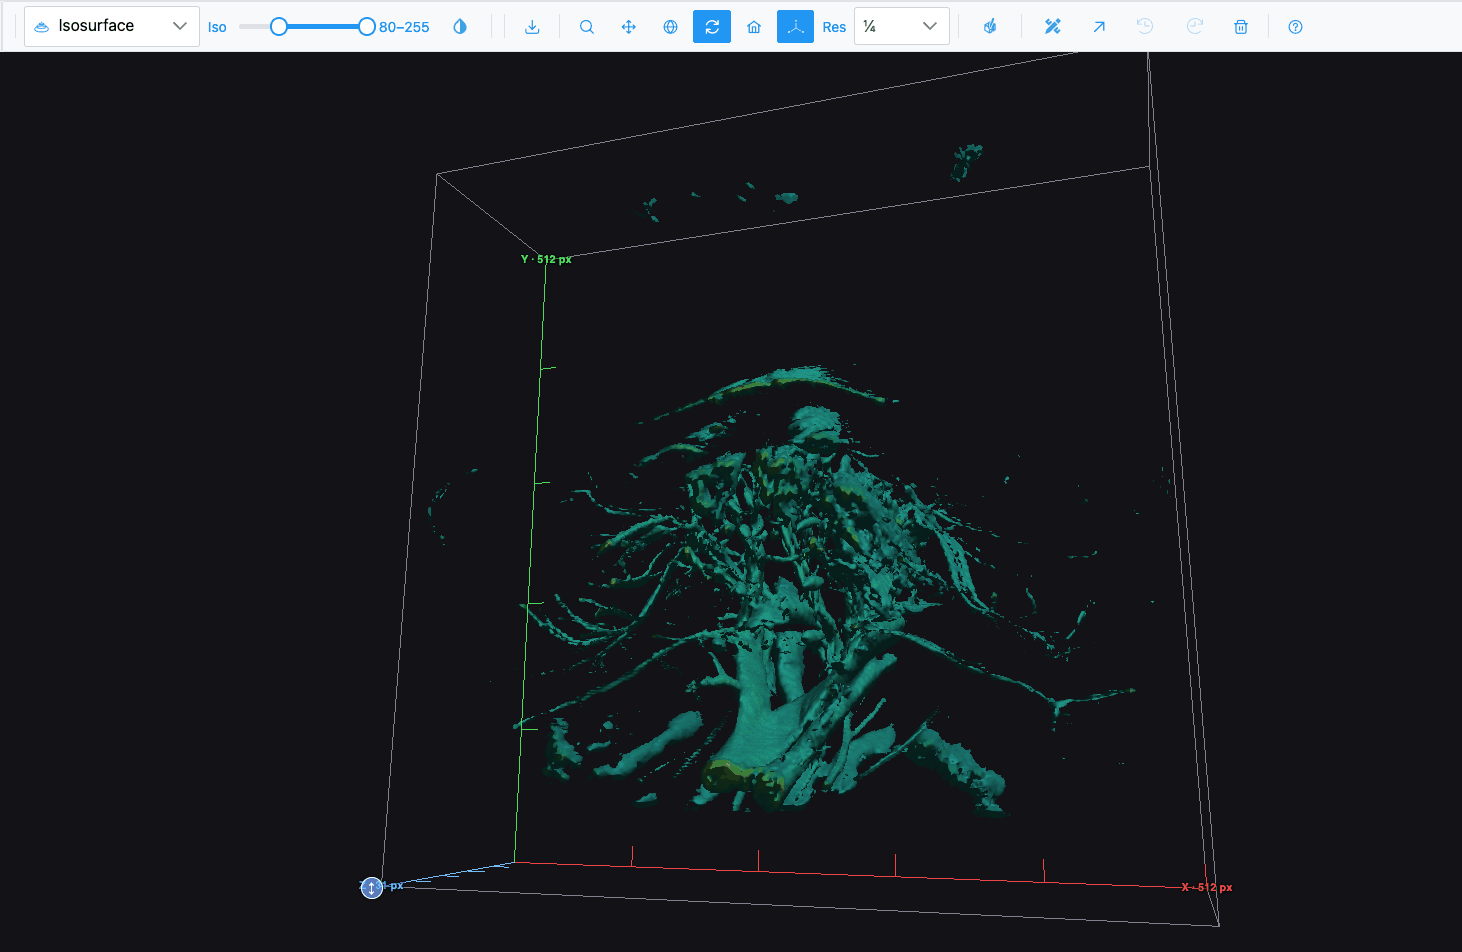
- With a z-stack open, pick Isosurface.
- Move the Iso band slider in the toolbar (0–255, mapped onto the stack's own intensity range). Narrow it to isolate bright structures; widen it to see more.
Get more (or less) detail in 3D
Use the Res dropdown in the toolbar: Full, ½, ¼ (default) or ⅛. Higher resolution shows more detail but takes longer and uses more graphics memory. Changing it reloads the view; the box's proportions do not change.
Stretch or flatten the volume in Z
- In the Volume view, find the round blue ↕ grip at the centre of the box's top face.
- Drag it up to stretch the volume in Z, down to flatten it (180 pixels of drag doubles or halves the height, between 0.1× and 10×).
- Double-click the grip to reset.
Control the 3D camera
| Want to | Do |
|---|---|
| Rotate | Drag (default mode is Turntable rotation ) |
| Zoom | Scroll, or choose Zoom and drag |
| Pan | Choose Pan and drag |
| Start again | Reset camera to default |
| Hide the axes and scale |  Toggle 3D axes / scale |
| See surfaces as wireframes | Toggle wireframe |
In the Volume, Isosurface and Surface views, Orbital rotation and Turntable rotation behave the same.
Draw regions on a volume with the slice editor
- In the Volume or Isosurface view, click
 Slice
editor.
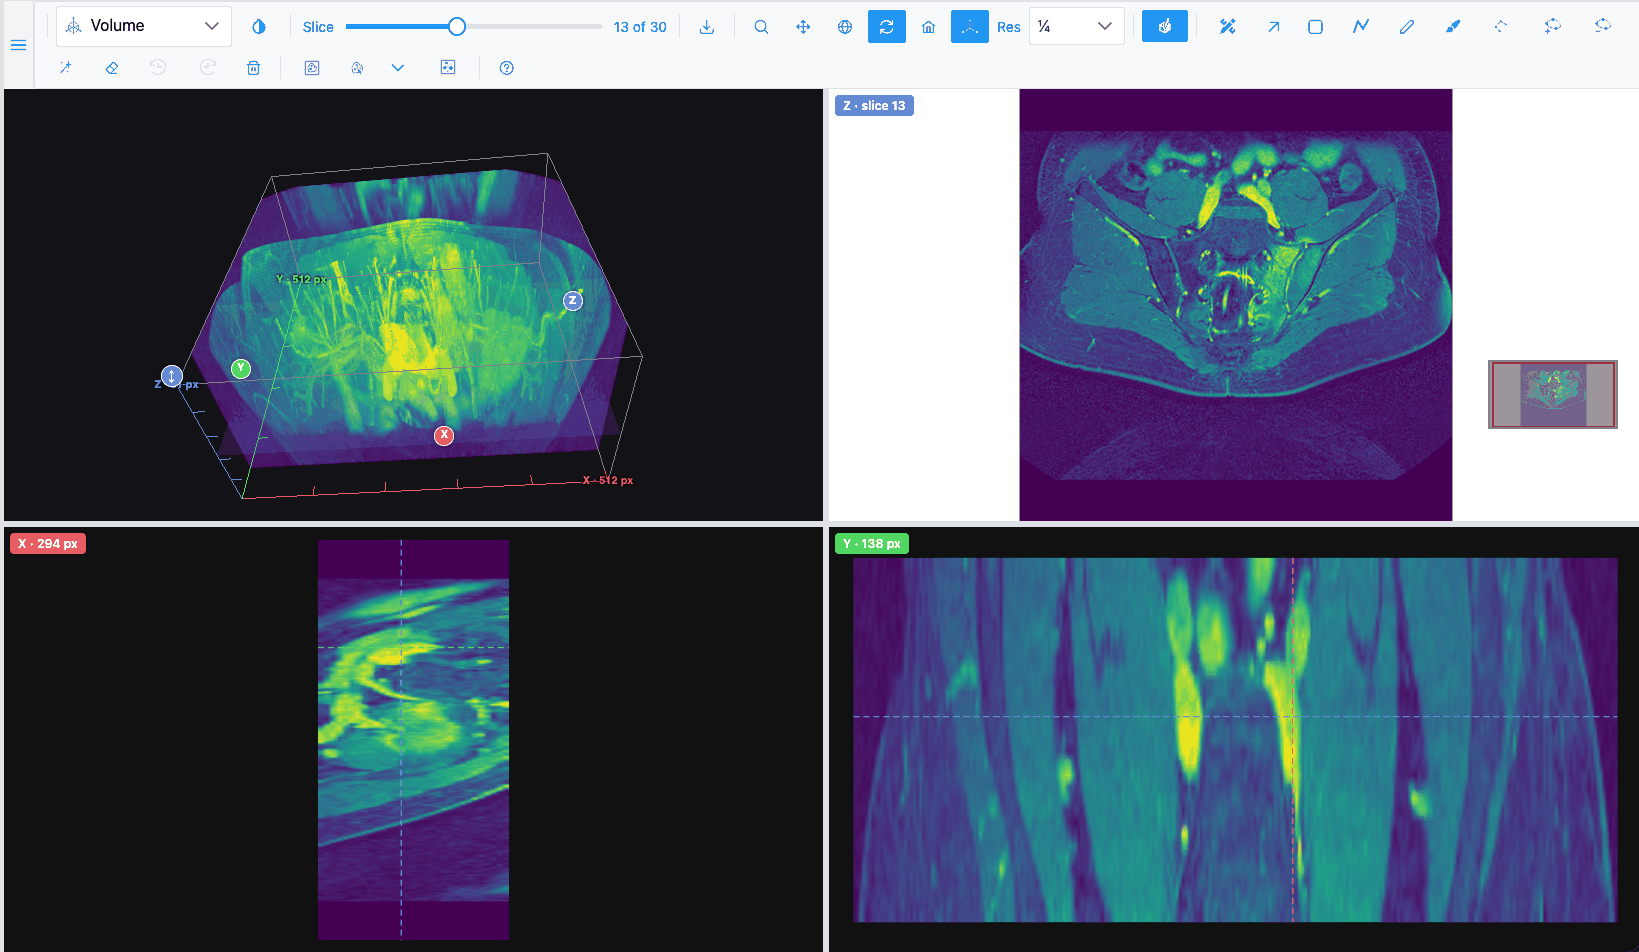
- The view splits in four: the 3D volume (top left), the current slice with every region tool (top right), and the sections through X and Y (bottom).
- Draw on the slice as in the Image view. Change slice with the Slice slider, the arrow keys, or by dragging the Z plane in the 3D view.
- Click a point in an X or Y section to move the slice and the other section there.
- Drag the dividers to resize the panes (or focus a divider and use the arrow keys).
Click the button again to close the editor. It stays open if you switch to another plot type and back.
Show a class of regions as a 3D surface
- Draw or import regions on several slices of a stack.
- In the Volume view, open the Region Editor.
- Click Show in the volume, in 3D next to a class. Its outlines from every slice are joined into a translucent surface.
- With Selection mode, click a surface to pick its class; Shift-click adds another.
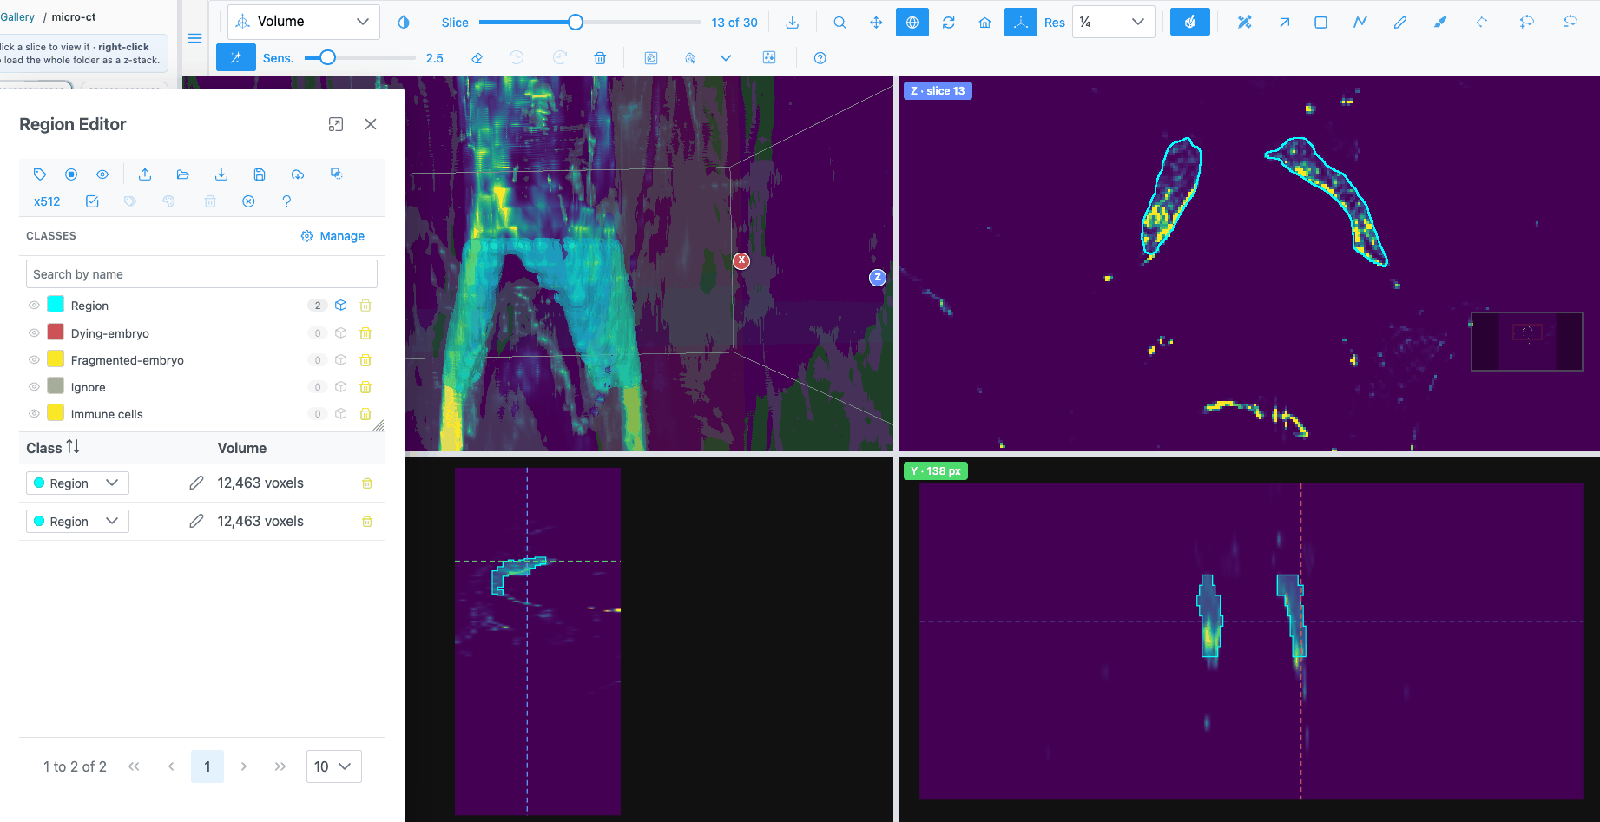
The table's Volume column shows each class's volume over the whole stack. In the Region Editor toolbar, lets you see regions through the volume.
Render a single image as a 3D surface
Pick Surface in the plot-type dropdown. The image's intensities become heights. For a stack, the Slice slider chooses which slice is shown as the surface.