Plot types
The plot-type dropdown, at the start of the toolbar, chooses how the loaded data is drawn. It offers only the plot types the data can support, so the list changes with what is loaded.
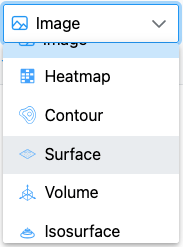
The plot types
| Plot type | Icon | Draws | Needs |
|---|---|---|---|
| Image | The image as a tiled, deeply zoomable raster with a minimap and a scale bar. The default. | — | |
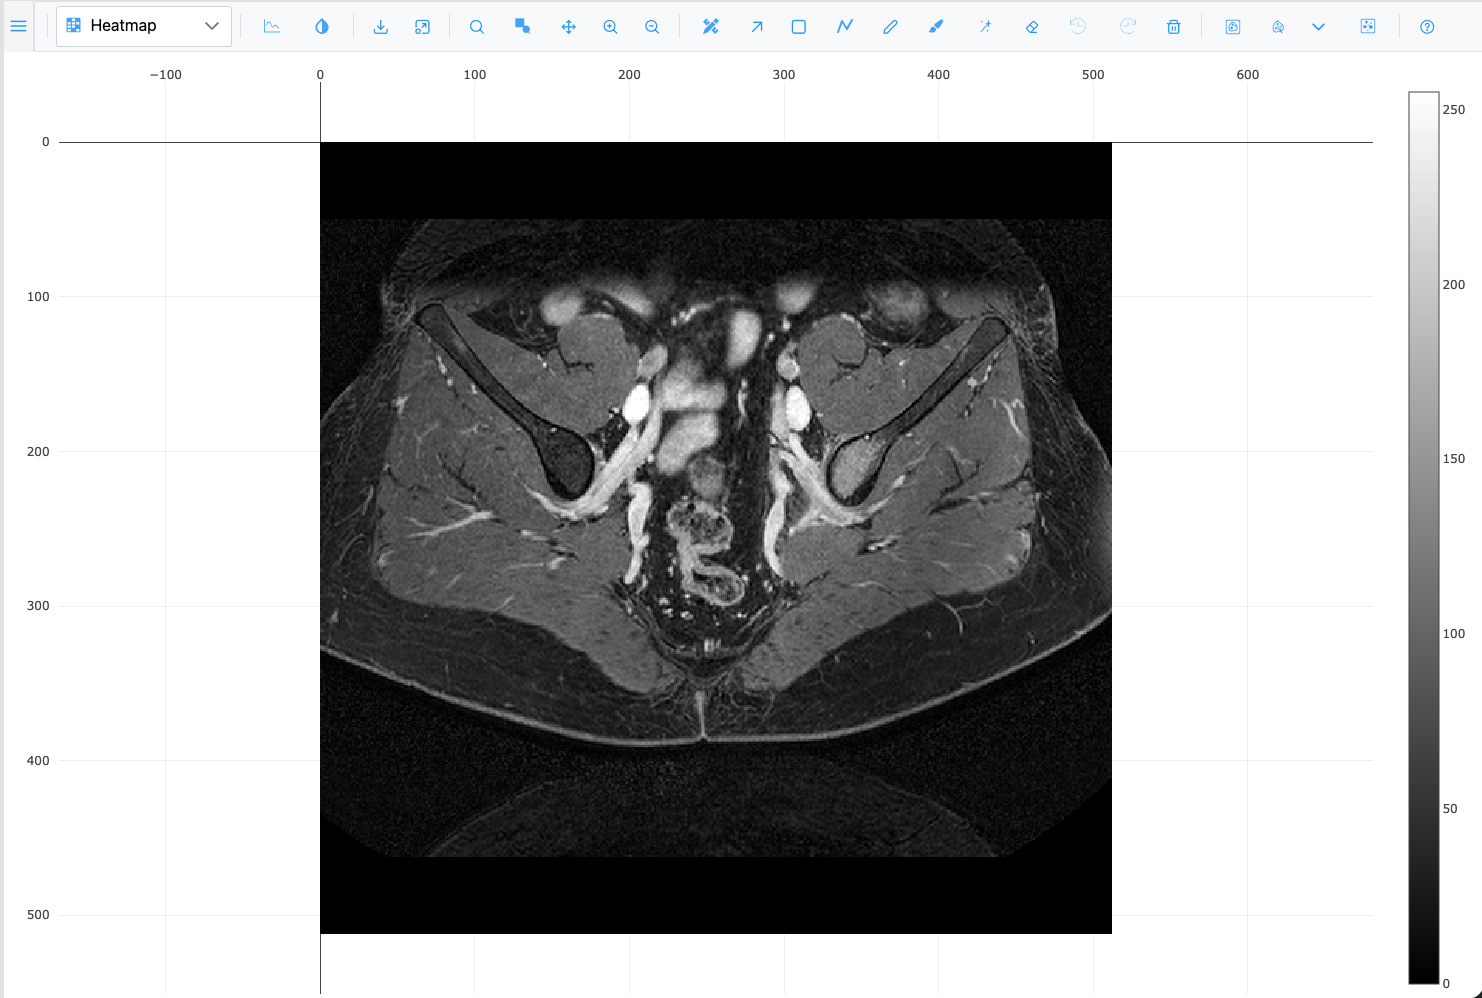
| Heatmap |  |
The pixel values as a heatmap with a colour bar. Zooming re-fetches the visible area at screen resolution. | — |
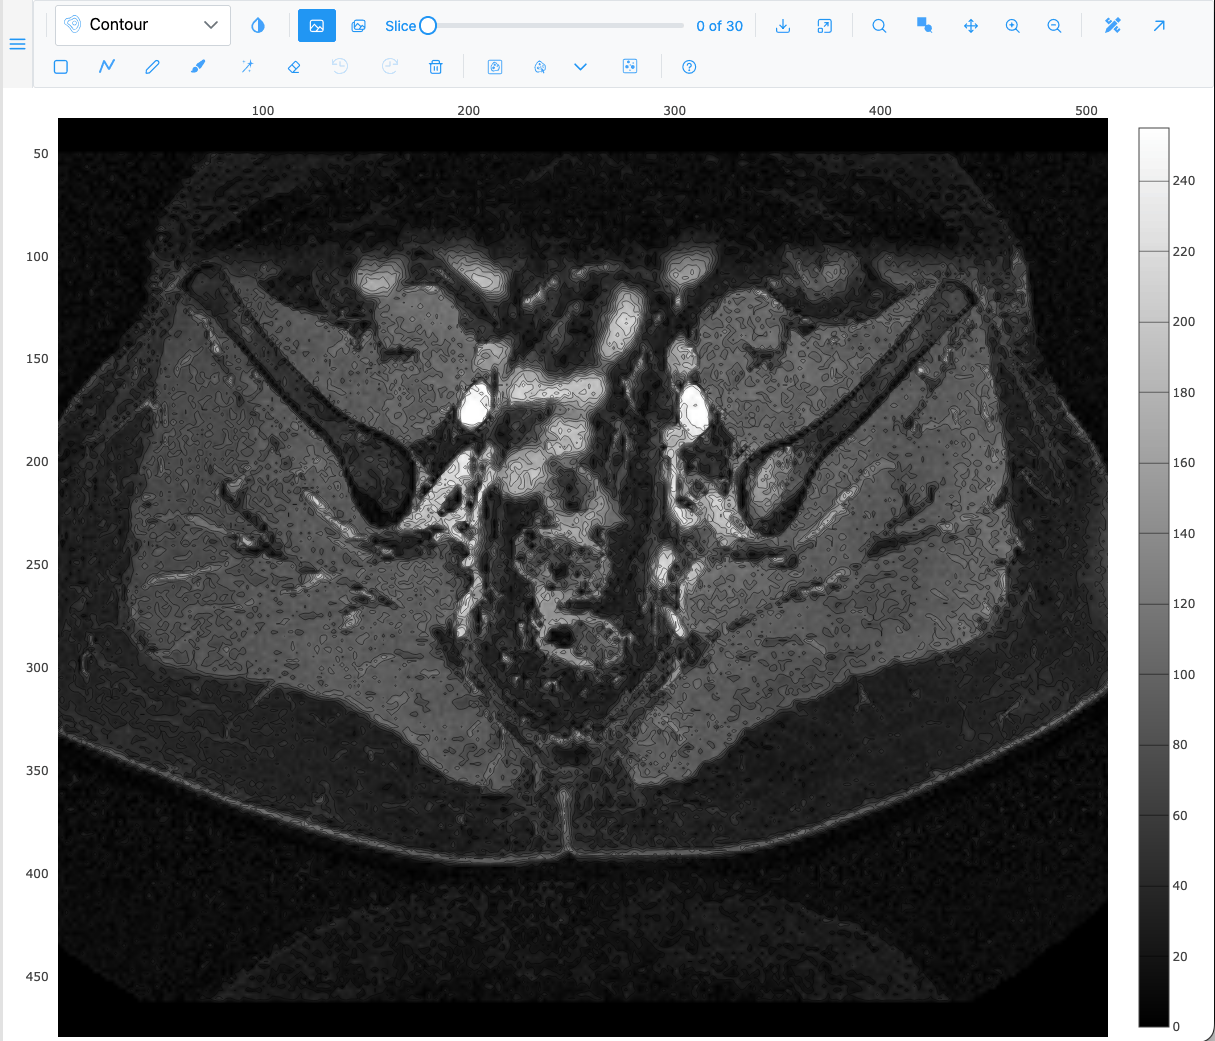
| Contour |  |
Iso-intensity contour lines. | A grayscale or multichannel image (not RGB) |
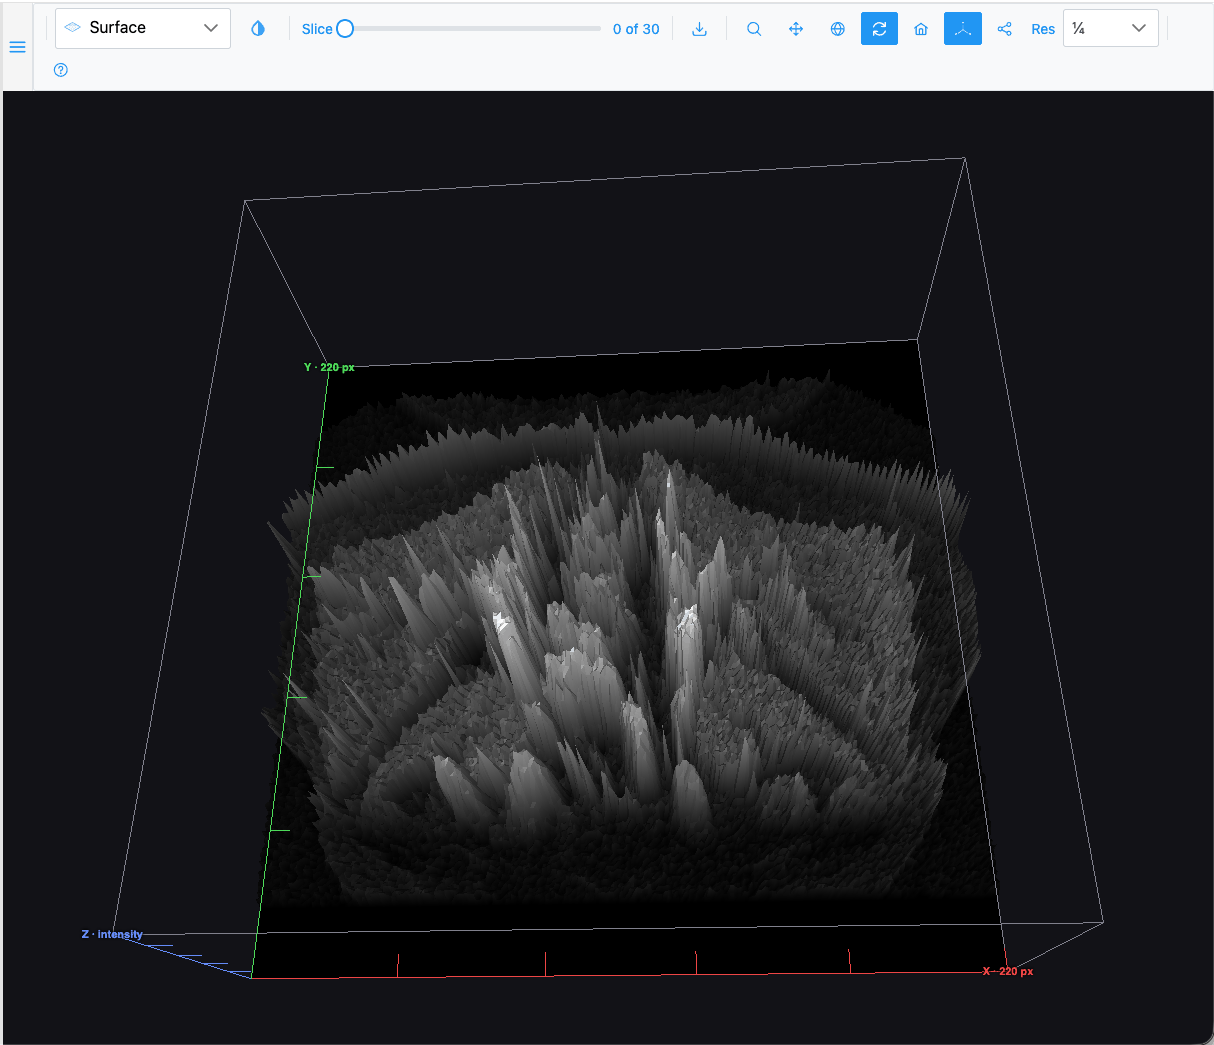
| Surface |  |
The image as a 3D height field (brightness = height). RGB images use their luminance. | — |
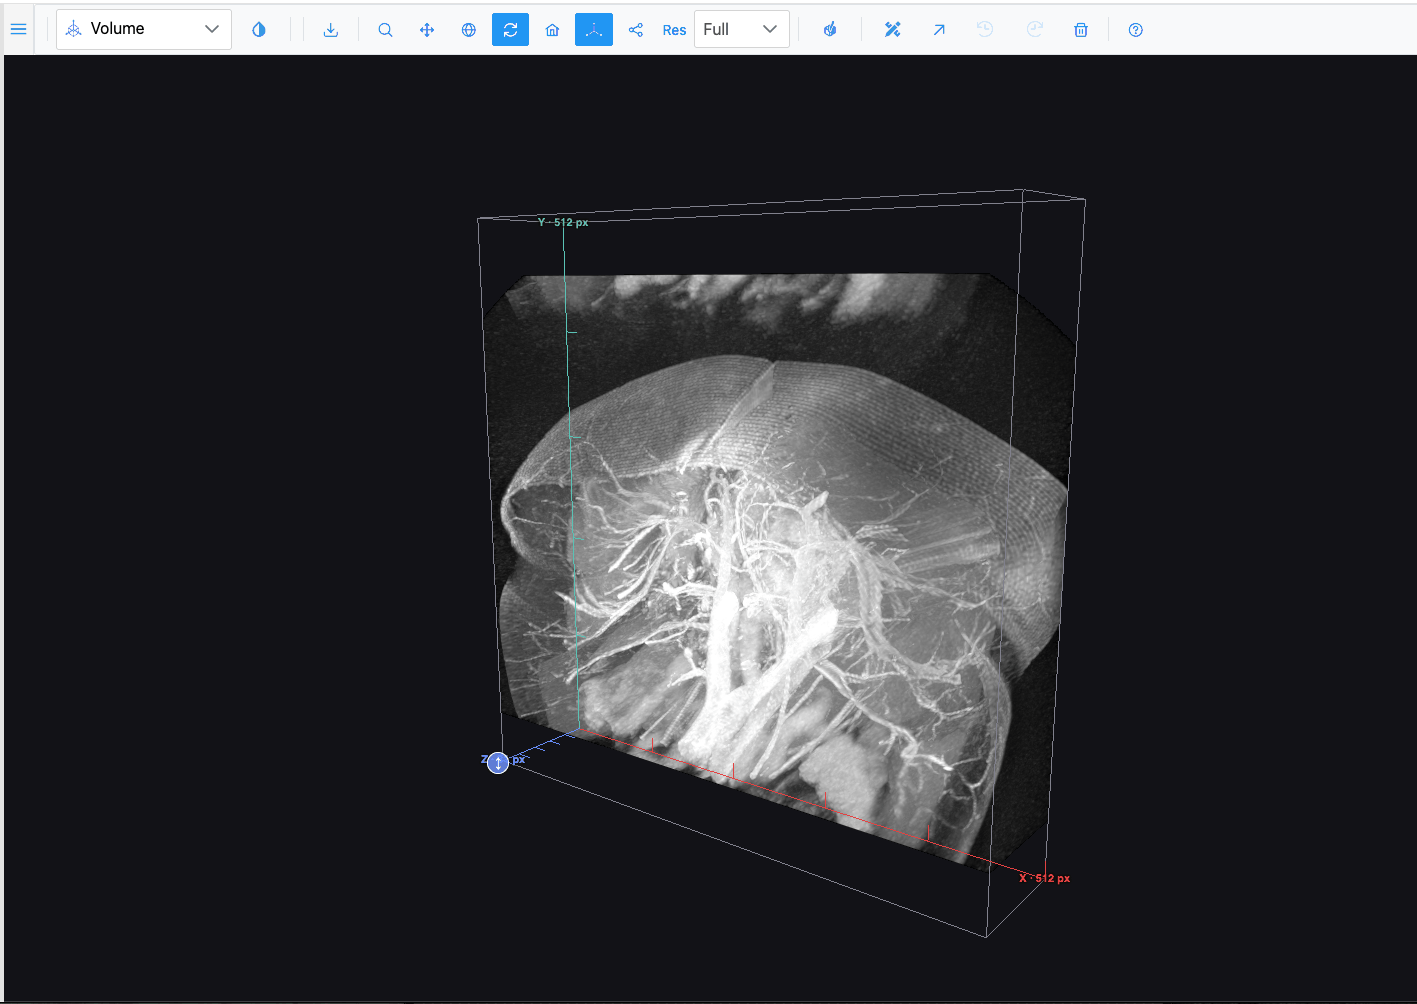
| Volume |  |
A z-stack as a 3D volume (maximum-intensity projection). | A z-stack, grayscale or multichannel |
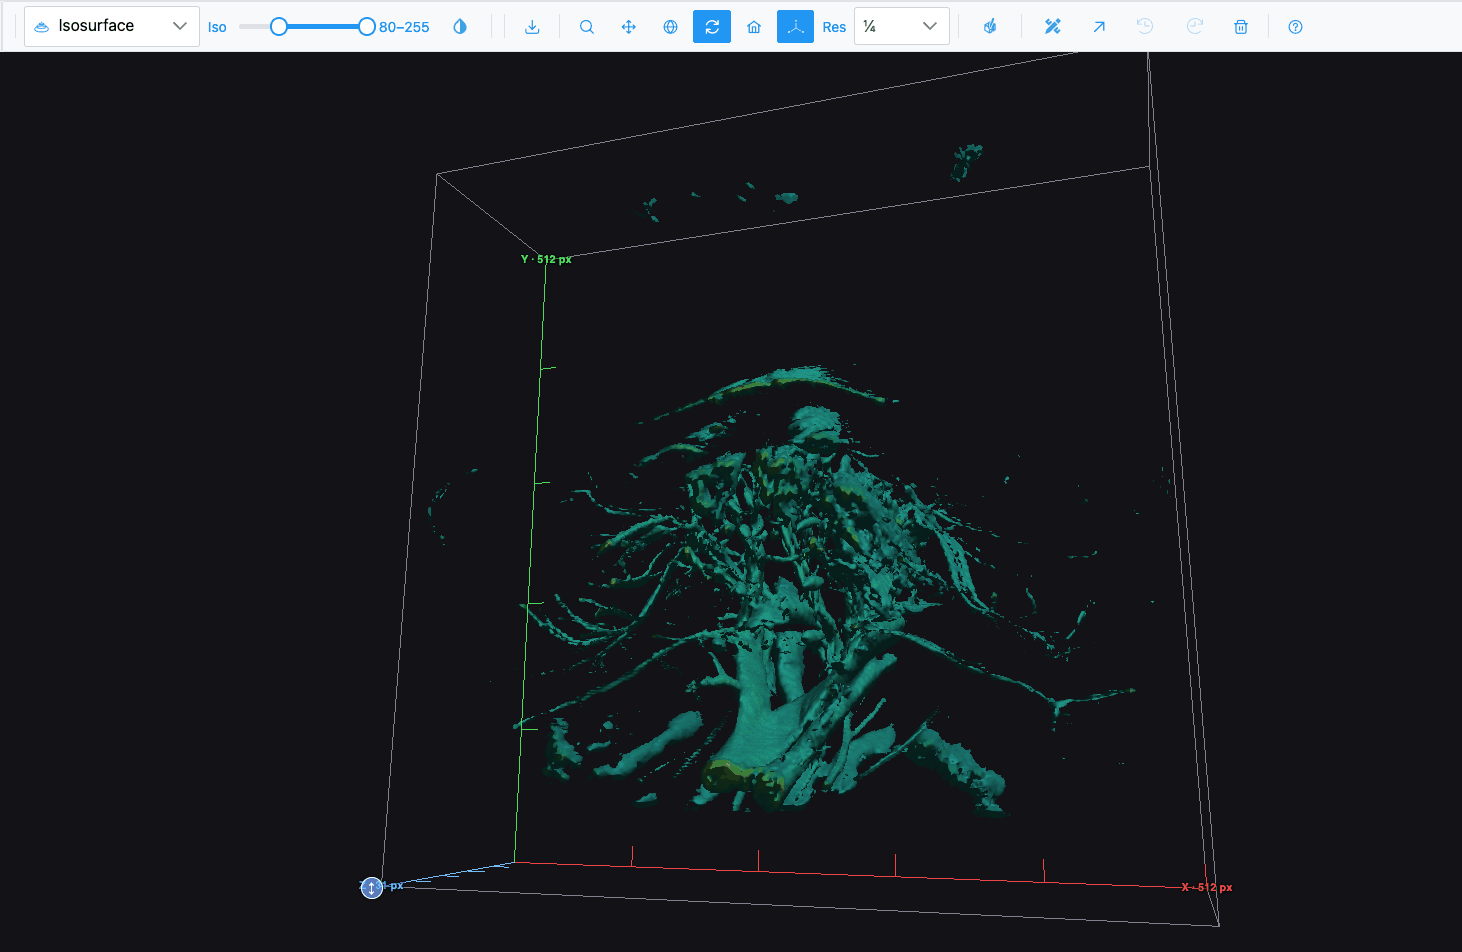
| Isosurface |  |
Surfaces through the volume at the intensity band set by the Iso slider. | A z-stack, grayscale or multichannel |
| Spatial omics |  |
Cells or spots of a spatial-omics dataset at their coordinates, over the tissue. | A spatial-omics dataset |
| Spatial omics 3D |  |
The dataset's cells as a 3D point cloud. | A dataset whose coordinates carry a z |
Availability rules
- Grayscale-only types (Contour, Volume, Isosurface) accept a grayscale image or a multichannel image (more than one channel, fewer than three RGB channels). They are not offered for RGB images.
- Stack-only types (Volume, Isosurface) need a z-stack.
- Spatial omics types appear while a dataset is loaded. They disappear when it is closed.
- Pixel types (Image, Heatmap, Surface) are withheld while a spatial-omics dataset with no tissue image or volume is open (for example seqFISH), since there are no pixels to draw.
- The host application may add its own plot types after the built-in ones.
What happens when you switch
- Switching plot type turns off the active region tool.
- Picking a 3D type sets the camera to Turntable rotation.
- If the selected type is not available for the next image (for example Contour, then an RGB image), the view falls back to Image.
- Opening another file while a 3D type is shown resets the view to Image. A 2D type (such as Heatmap) carries over if the new image supports it.
Which renderer draws what
SIV picks a renderer per plot type and falls back silently if one cannot draw:
| Plot type | Renderer | Falls back to |
|---|---|---|
| Image | OpenSeadragon (tiled 2D viewer) | Plotly |
| Heatmap, Contour | Plotly | — |
| Surface, Volume, Isosurface, Spatial omics 3D | napari-js (WebGPU) | Plotly |
| Spatial omics | napari-js (WebGPU) | OpenSeadragon + WebGL markers |
A fallback lasts for the current image only. WebGPU availability is checked once per page. See Limits and requirements.
Test mode
Developers and QA can open the viewer in test mode (in the demo and JIT, add ?test=1 to the URL
when the host supports it). The dropdown then shows every renderer explicitly, such as "Image (OSD)",
"Heatmap (Plotly)" and "Volume (napari · WebGPU)". It also adds test-only types: Scatter 2D (Plotly),
Surface (Plotly), Scatter 3D (Plotly), Isosurface (Plotly), Image (napari · WebGPU),
Scatter 2D (napari · WebGPU) and Scatter 3D (napari · WebGPU).