Intensity profile lines
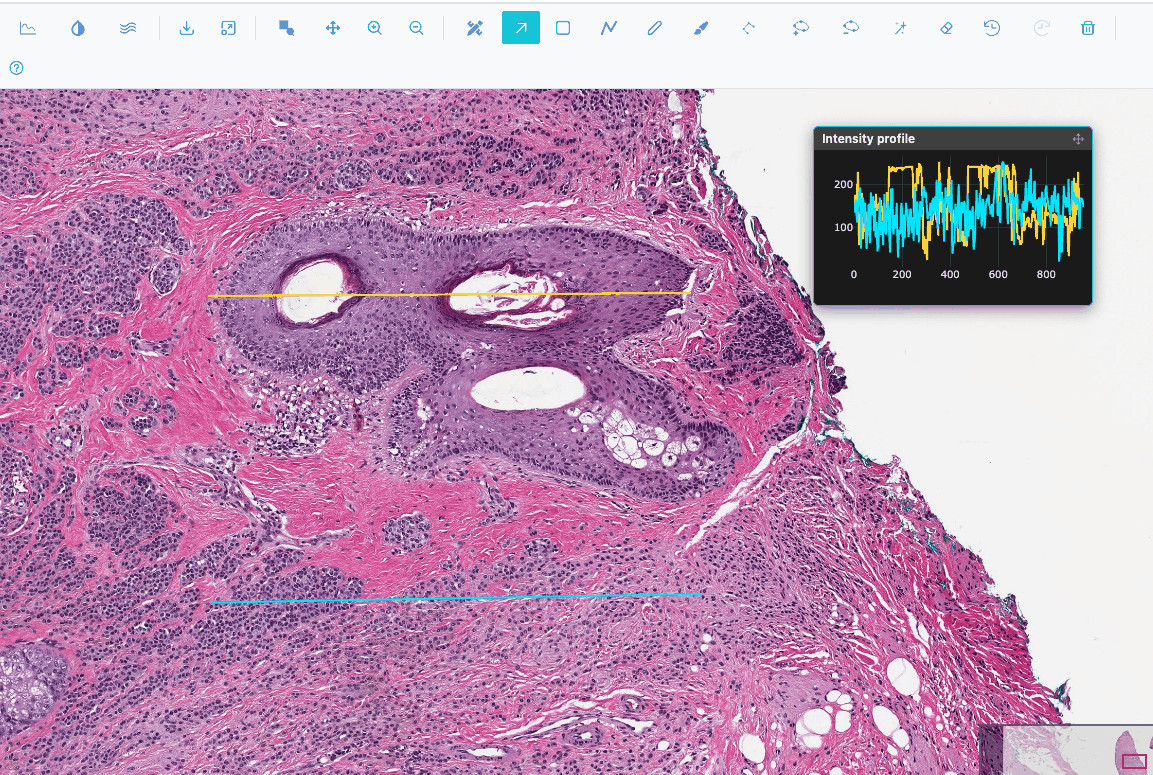
An intensity profile plots pixel intensity along a line, for example across a membrane or a nucleus.
Work in progress
Intensity profiles are not yet stable. Values are display values (8-bit, after contrast), not the image's native 16-bit data.
Adding lines
Click  Add an intensity line (Image and Heatmap views).
- Each click adds a horizontal line across the middle two-thirds of the visible image. Each new line is placed a little lower than the previous one.
- Each line gets its own colour, cycling through yellow, cyan, pink, green, orange, purple, red and aqua.
- In the Image view the new line is selected, so you can drag its endpoints straight away.
The Intensity profile inset
A floating Intensity profile panel opens at the top right of the view. Drag it by its header to move it.
- One trace per line, named "Line 1", "Line 2"…, in the line's colour.
- X axis: Position (µm) when the image has a physical pixel size, otherwise Position (px). Y axis: Intensity.
- The traces update live while you drag a line. In the Image view they are re-sampled at the current zoom each time the view settles.
- RGB images are sampled as luminance.
Removing lines
Select a line and press Del or click Delete selected region . The inset closes when no line is left.
Profile lines are not regions: they are not listed in the Region Editor and are never exported.