Viewing and display
Recipes for looking at images: contrast, colour, channels, pixel rendering, exporting what you see and arranging the toolbar. The controls are described in full in Channels & Histogram and Navigation.
Adjust brightness and contrast
Make a dim image, or a dim channel, readable.
- Click
 Channels & Histogram.
- For a multichannel or RGB image, click the row of the channel to adjust. The histogram shows that channel.
- Drag Max down until the structures you care about are bright. Drag Min up to darken the background. You can also type exact values in the boxes next to the sliders.
- To let SIV choose, click Auto: min and max are set so that 0.1% of the pixels saturate at each end.
- Tick Log above the histogram if most pixels pile up in a few bins; it only changes the histogram's y axis, not the image.
Min can never exceed max; moving one past the other pushes it along. The image updates live.
16-bit images
For images with more than 8 bits per pixel, the histogram and sliders use the image's native values (for example 0–4095), not 0–255. Auto is computed from the native histogram.
Brighten mid-tones with gamma
- In Channels & Histogram, select the channel.
- Move Gamma (0.1 to 5, default 1). Values below 1 brighten the mid-tones; values above 1 darken them.
Undo contrast changes
Click Reset in Channels & Histogram. It restores the selected channel's window to 0–255, gamma to 1 and its default colour.
Show or hide channels
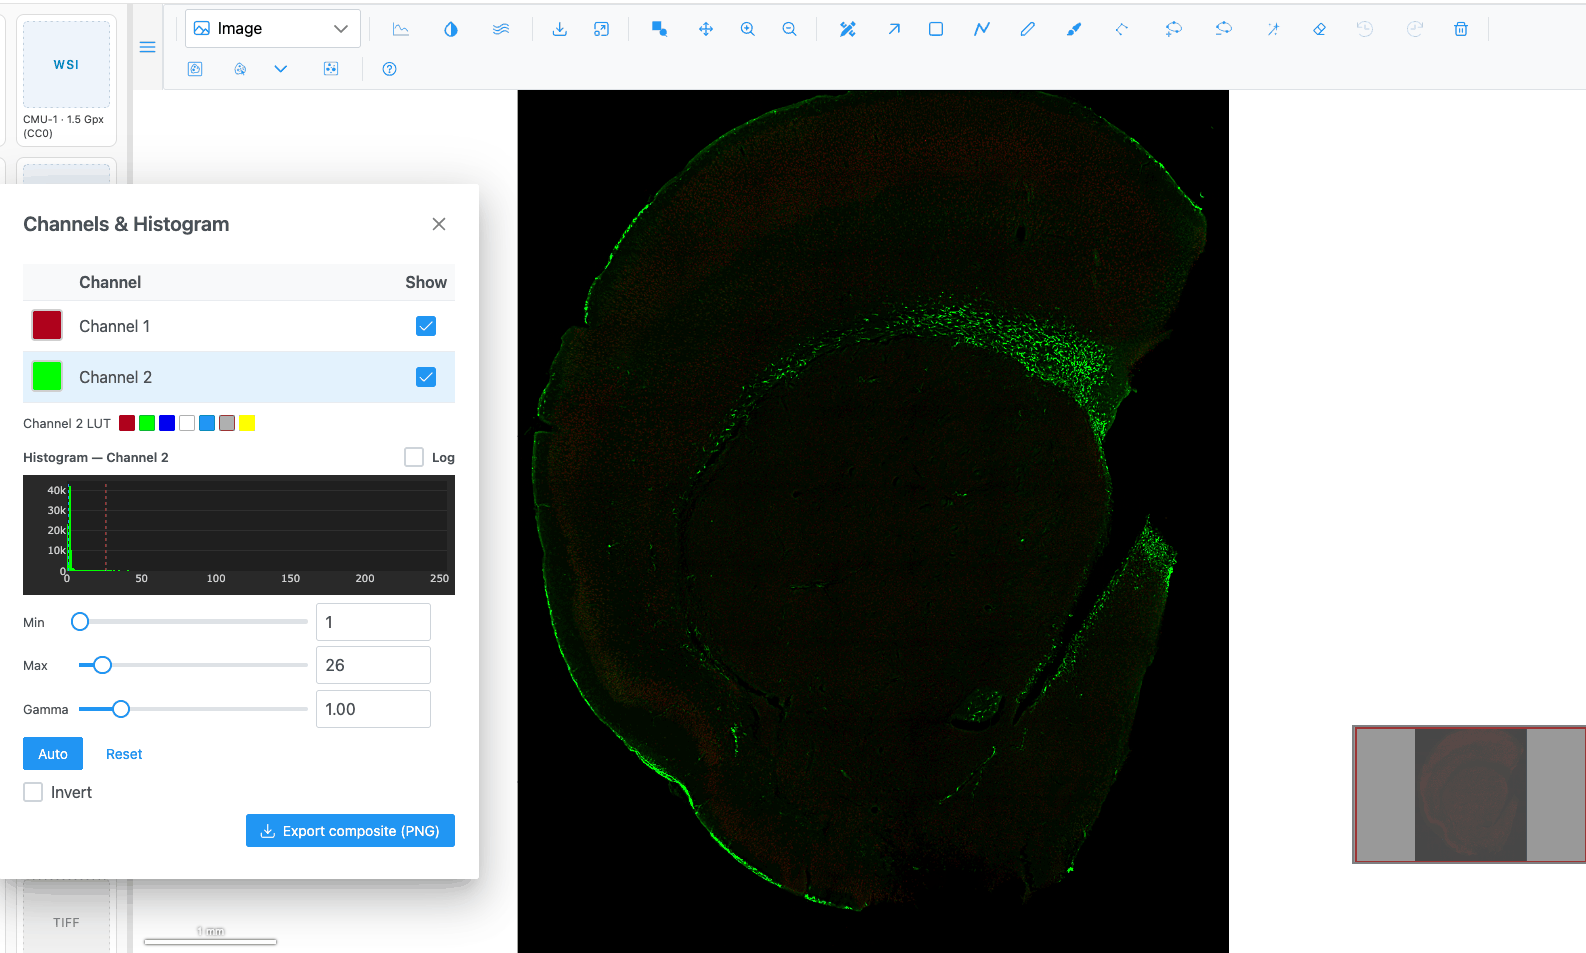
- In Channels & Histogram, untick Show for the channels to hide.
- If the channels are grouped (a chevron and a count next to a group name), the group's checkbox shows or hides all its channels at once. It is ticked only when all of them are shown, and its tooltip says how many are shown.
Note
A multichannel image opens with only its first 4 channels visible, unless the image says otherwise. Tick the others to show them.
Warning
Hiding the only channel of a grayscale image leaves the view blank. Tick Show again.
Change a channel's colour
- In Channels & Histogram, click the colour swatch at the start of the channel's row. (Swatches show for RGB and multichannel images.)
- Pick a colour in the honeycomb, type a hex code such as
#FF00FF, or use the H, S and L sliders or R, G, B fields.
The image recolours when you click a honeycomb cell or release a slider, not while you drag.
For the usual fluorescence colours, click one of the swatches in the LUT row under the table: Red, Green, Blue, Gray, Cyan, Magenta or Yellow.
Apply a colormap to a grayscale image
- Open a grayscale image, for example a micro-ct slice in the demo.
- In Channels & Histogram, open Colormap and pick a scale. They are grouped as Sequential, Perceptually Uniform Sequential (Viridis, Magma, Inferno, Cividis…), Diverging, Cyclic, Qualitative and Miscellaneous, each with a preview.
- Tick Invert to invert the image.
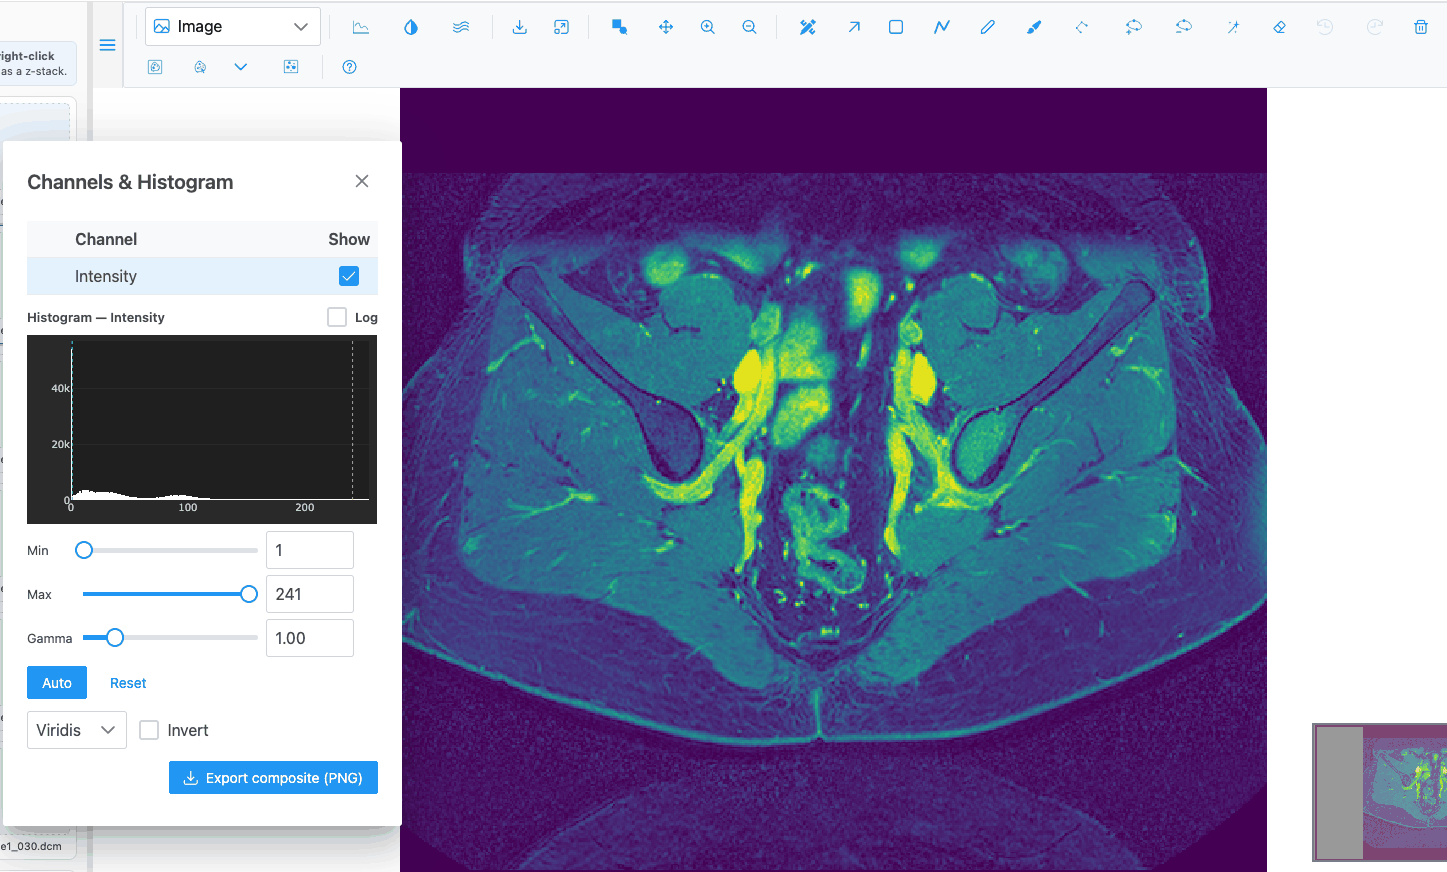
The default colormap is Greys Inv. Colormaps are only offered for single-channel grayscale images; RGB and multichannel images use per-channel colours instead.
Inspect raw pixels or smooth the image
The Image view opens showing raw pixels (nearest neighbour): zoomed in, each pixel is a crisp block, so you
can see exact values. To blend them, click  Smoothen. The
icon turns white while smoothing is on. Click again to go back to raw pixels. The setting stays when you
switch images.
Export what you see as a PNG
Click Download image as PNG. You get the current view at screen resolution, with your colours and contrast. In the Image view, the regions, scale bar and minimap are not included.
In Channels & Histogram, click Export composite (PNG). In the Image view SIV stitches the image
at the largest available resolution (up to 32 megapixels), applies your channel colours and contrast,
and saves <name>_composite.png. Tiles that fail to load leave gaps.
In the 3D views, both buttons save a screenshot of the canvas named napari-js.png.
Export the original data as a 16-bit TIFF
- Open a high-bit-depth image (more than 8 bits per pixel).
- In Channels & Histogram, choose which channels to include with their Show checkboxes.
- Click Export 16-bit TIFF. The server builds a multi-band OME-TIFF of the visible channels at their
native bit depth, saved as
<name>_16bit.ome.tif.
The button only appears for images over 8 bits. If the image is still being cached on the server, nothing is saved yet; try again a little later.
Measure a distance with the scale bar
The scale bar at the bottom left of the Image view shows a round length (1, 2 or 5 × 10ⁿ µm, switching to mm as you zoom out) and updates as you zoom. It is shown only for images that record their pixel size. For a profile along a line, use an intensity profile line.
Plot intensity along a line
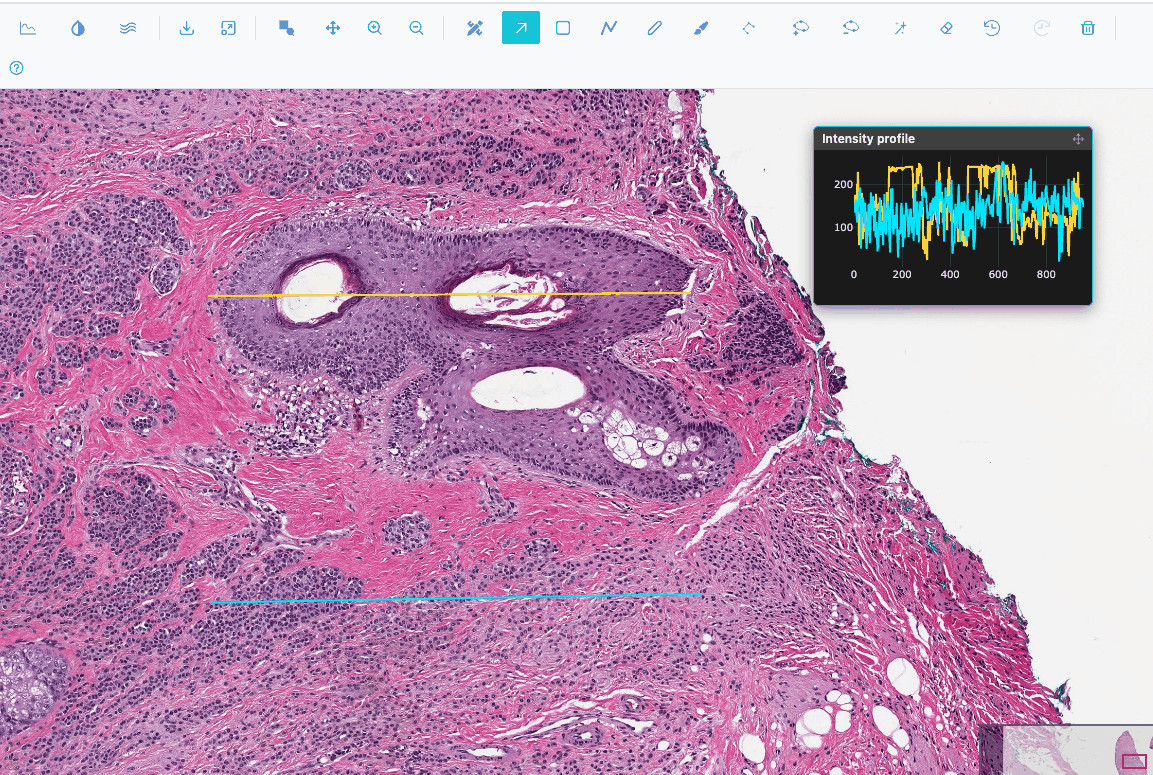
- In the Image or Heatmap view, click
 Add an
intensity line. A horizontal line appears across the middle of the view, and the Intensity profile
inset opens with its plot.
- Drag the line's ends onto the structure to measure. The plot updates as you drag.
- Click the button again to add another line, in a new colour, below the first.
- To remove a line, click it to select it and press Del or click .
The x axis is in µm when the image records its pixel size, otherwise in pixels. Values are the displayed 8-bit intensities (luminance for RGB images), not the native 16-bit values. See Intensity profile lines.
Get back to the whole image
Click Fit to view, or right-click and choose Autoscale.
Jump around a large image
Drag the red rectangle in the minimap at the bottom right, or click elsewhere in the minimap. On a gigapixel slide it is faster than panning.
Move the toolbar over the image
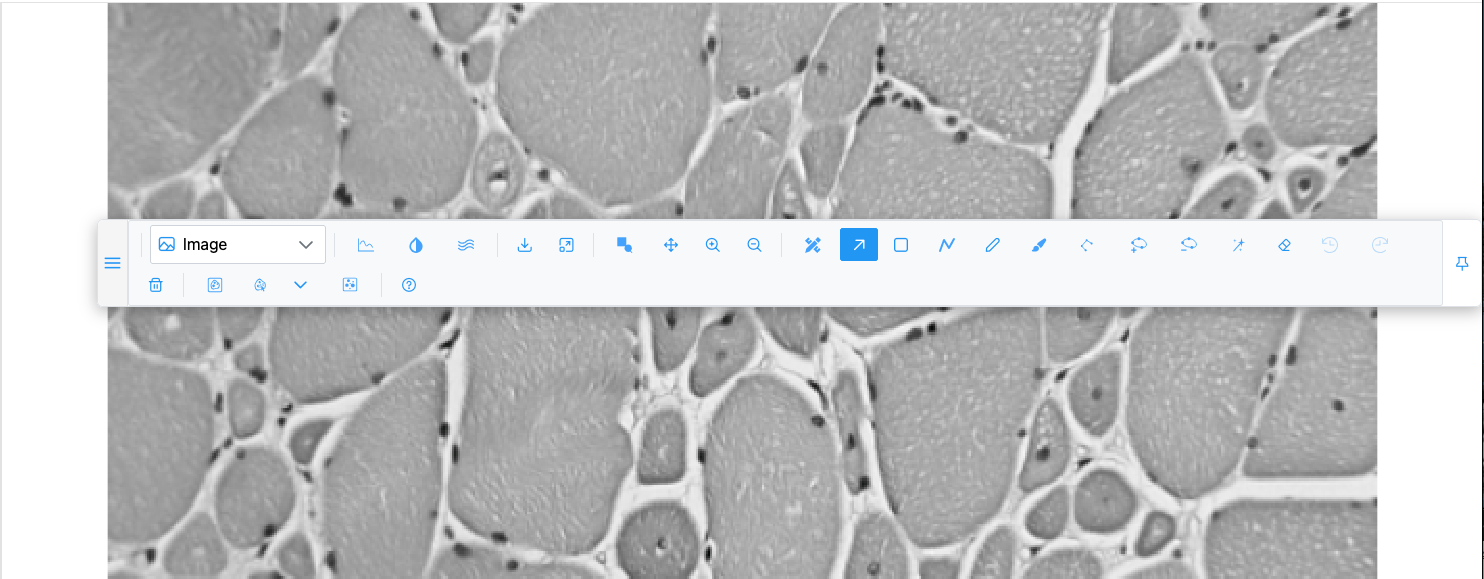
- Drag the handle at the left end of the toolbar onto the image. The toolbar floats.
- Drag it again by the same handle to move it.
- Click Dock to top to put it back.
Tip
The floating toolbar can be dragged partly or fully off-screen. If you lose it, reload the page: the toolbar always starts docked.
View an image as a heatmap, contour or surface
Pick Heatmap, Contour or Surface in the plot-type dropdown. The list only contains what the image can show: Contour needs a grayscale or multichannel image, and the 3D volume views need a z-stack. See Plot types.
In the Heatmap view, zooming re-fetches the visible part at screen resolution, so detail sharpens after a zoom.