CC_SARS
Hao He
2023-09-29
Last updated: 2023-09-29
Checks: 7 0
Knit directory: DO_Opioid/
This reproducible R Markdown analysis was created with workflowr (version 1.6.2). The Checks tab describes the reproducibility checks that were applied when the results were created. The Past versions tab lists the development history.
Great! Since the R Markdown file has been committed to the Git repository, you know the exact version of the code that produced these results.
Great job! The global environment was empty. Objects defined in the global environment can affect the analysis in your R Markdown file in unknown ways. For reproduciblity it’s best to always run the code in an empty environment.
The command set.seed(20200504) was run prior to running the code in the R Markdown file. Setting a seed ensures that any results that rely on randomness, e.g. subsampling or permutations, are reproducible.
Great job! Recording the operating system, R version, and package versions is critical for reproducibility.
Nice! There were no cached chunks for this analysis, so you can be confident that you successfully produced the results during this run.
Great job! Using relative paths to the files within your workflowr project makes it easier to run your code on other machines.
Great! You are using Git for version control. Tracking code development and connecting the code version to the results is critical for reproducibility.
The results in this page were generated with repository version acc8369. See the Past versions tab to see a history of the changes made to the R Markdown and HTML files.
Note that you need to be careful to ensure that all relevant files for the analysis have been committed to Git prior to generating the results (you can use wflow_publish or wflow_git_commit). workflowr only checks the R Markdown file, but you know if there are other scripts or data files that it depends on. Below is the status of the Git repository when the results were generated:
Ignored files:
    Ignored:    .RData
    Ignored:    .Rhistory
    Ignored:    .Rproj.user/
    Ignored:    analysis/Picture1.png
    Ignored:    ieugwasr_oauth/

Untracked files:
    Untracked:  Rplot_rz.png
    Untracked:  TIMBR.test.prop.bm.MN.RET.RData
    Untracked:  TIMBR.test.random.RData
    Untracked:  TIMBR.test.rz.transformed_TVb_ml.RData
    Untracked:  analysis/DDO_morphine1_second_set_69k.stdout
    Untracked:  analysis/DO_Fentanyl.R
    Untracked:  analysis/DO_Fentanyl.err
    Untracked:  analysis/DO_Fentanyl.out
    Untracked:  analysis/DO_Fentanyl.sh
    Untracked:  analysis/DO_Fentanyl_69k.R
    Untracked:  analysis/DO_Fentanyl_69k.err
    Untracked:  analysis/DO_Fentanyl_69k.out
    Untracked:  analysis/DO_Fentanyl_69k.sh
    Untracked:  analysis/DO_Fentanyl_Cohort2_GCTA_herit.R
    Untracked:  analysis/DO_Fentanyl_Cohort2_gemma.R
    Untracked:  analysis/DO_Fentanyl_Cohort2_mapping.R
    Untracked:  analysis/DO_Fentanyl_Cohort2_mapping.err
    Untracked:  analysis/DO_Fentanyl_Cohort2_mapping.out
    Untracked:  analysis/DO_Fentanyl_Cohort2_mapping.sh
    Untracked:  analysis/DO_Fentanyl_GCTA_herit.R
    Untracked:  analysis/DO_Fentanyl_alternate_metrics_69k.R
    Untracked:  analysis/DO_Fentanyl_alternate_metrics_69k.err
    Untracked:  analysis/DO_Fentanyl_alternate_metrics_69k.out
    Untracked:  analysis/DO_Fentanyl_alternate_metrics_69k.sh
    Untracked:  analysis/DO_Fentanyl_alternate_metrics_array.R
    Untracked:  analysis/DO_Fentanyl_alternate_metrics_array.err
    Untracked:  analysis/DO_Fentanyl_alternate_metrics_array.out
    Untracked:  analysis/DO_Fentanyl_alternate_metrics_array.sh
    Untracked:  analysis/DO_Fentanyl_array.R
    Untracked:  analysis/DO_Fentanyl_array.err
    Untracked:  analysis/DO_Fentanyl_array.out
    Untracked:  analysis/DO_Fentanyl_array.sh
    Untracked:  analysis/DO_Fentanyl_combining2Cohort_GCTA_herit.R
    Untracked:  analysis/DO_Fentanyl_combining2Cohort_gemma.R
    Untracked:  analysis/DO_Fentanyl_combining2Cohort_mapping.R
    Untracked:  analysis/DO_Fentanyl_combining2Cohort_mapping.err
    Untracked:  analysis/DO_Fentanyl_combining2Cohort_mapping.out
    Untracked:  analysis/DO_Fentanyl_combining2Cohort_mapping.sh
    Untracked:  analysis/DO_Fentanyl_combining2Cohort_mapping_CoxPH.R
    Untracked:  analysis/DO_Fentanyl_finalreport_to_plink.sh
    Untracked:  analysis/DO_Fentanyl_gemma.R
    Untracked:  analysis/DO_Fentanyl_gemma.err
    Untracked:  analysis/DO_Fentanyl_gemma.out
    Untracked:  analysis/DO_Fentanyl_gemma.sh
    Untracked:  analysis/DO_morphine1.R
    Untracked:  analysis/DO_morphine1.Rout
    Untracked:  analysis/DO_morphine1.sh
    Untracked:  analysis/DO_morphine1.stderr
    Untracked:  analysis/DO_morphine1.stdout
    Untracked:  analysis/DO_morphine1_SNP.R
    Untracked:  analysis/DO_morphine1_SNP.Rout
    Untracked:  analysis/DO_morphine1_SNP.sh
    Untracked:  analysis/DO_morphine1_SNP.stderr
    Untracked:  analysis/DO_morphine1_SNP.stdout
    Untracked:  analysis/DO_morphine1_combined.R
    Untracked:  analysis/DO_morphine1_combined.Rout
    Untracked:  analysis/DO_morphine1_combined.sh
    Untracked:  analysis/DO_morphine1_combined.stderr
    Untracked:  analysis/DO_morphine1_combined.stdout
    Untracked:  analysis/DO_morphine1_combined_69k.R
    Untracked:  analysis/DO_morphine1_combined_69k.Rout
    Untracked:  analysis/DO_morphine1_combined_69k.sh
    Untracked:  analysis/DO_morphine1_combined_69k.stderr
    Untracked:  analysis/DO_morphine1_combined_69k.stdout
    Untracked:  analysis/DO_morphine1_combined_69k_m2.R
    Untracked:  analysis/DO_morphine1_combined_69k_m2.Rout
    Untracked:  analysis/DO_morphine1_combined_69k_m2.sh
    Untracked:  analysis/DO_morphine1_combined_69k_m2.stderr
    Untracked:  analysis/DO_morphine1_combined_69k_m2.stdout
    Untracked:  analysis/DO_morphine1_combined_weight_DOB.R
    Untracked:  analysis/DO_morphine1_combined_weight_DOB.Rout
    Untracked:  analysis/DO_morphine1_combined_weight_DOB.err
    Untracked:  analysis/DO_morphine1_combined_weight_DOB.out
    Untracked:  analysis/DO_morphine1_combined_weight_DOB.sh
    Untracked:  analysis/DO_morphine1_combined_weight_DOB.stderr
    Untracked:  analysis/DO_morphine1_combined_weight_DOB.stdout
    Untracked:  analysis/DO_morphine1_combined_weight_age.R
    Untracked:  analysis/DO_morphine1_combined_weight_age.err
    Untracked:  analysis/DO_morphine1_combined_weight_age.out
    Untracked:  analysis/DO_morphine1_combined_weight_age.sh
    Untracked:  analysis/DO_morphine1_combined_weight_age_GAMMT.R
    Untracked:  analysis/DO_morphine1_combined_weight_age_GAMMT.err
    Untracked:  analysis/DO_morphine1_combined_weight_age_GAMMT.out
    Untracked:  analysis/DO_morphine1_combined_weight_age_GAMMT.sh
    Untracked:  analysis/DO_morphine1_combined_weight_age_GAMMT_chr19.R
    Untracked:  analysis/DO_morphine1_combined_weight_age_GAMMT_chr19.err
    Untracked:  analysis/DO_morphine1_combined_weight_age_GAMMT_chr19.out
    Untracked:  analysis/DO_morphine1_combined_weight_age_GAMMT_chr19.sh
    Untracked:  analysis/DO_morphine1_cph.R
    Untracked:  analysis/DO_morphine1_cph.Rout
    Untracked:  analysis/DO_morphine1_cph.sh
    Untracked:  analysis/DO_morphine1_second_set.R
    Untracked:  analysis/DO_morphine1_second_set.Rout
    Untracked:  analysis/DO_morphine1_second_set.sh
    Untracked:  analysis/DO_morphine1_second_set.stderr
    Untracked:  analysis/DO_morphine1_second_set.stdout
    Untracked:  analysis/DO_morphine1_second_set_69k.R
    Untracked:  analysis/DO_morphine1_second_set_69k.Rout
    Untracked:  analysis/DO_morphine1_second_set_69k.sh
    Untracked:  analysis/DO_morphine1_second_set_69k.stderr
    Untracked:  analysis/DO_morphine1_second_set_SNP.R
    Untracked:  analysis/DO_morphine1_second_set_SNP.Rout
    Untracked:  analysis/DO_morphine1_second_set_SNP.sh
    Untracked:  analysis/DO_morphine1_second_set_SNP.stderr
    Untracked:  analysis/DO_morphine1_second_set_SNP.stdout
    Untracked:  analysis/DO_morphine1_second_set_weight_DOB.R
    Untracked:  analysis/DO_morphine1_second_set_weight_DOB.Rout
    Untracked:  analysis/DO_morphine1_second_set_weight_DOB.err
    Untracked:  analysis/DO_morphine1_second_set_weight_DOB.out
    Untracked:  analysis/DO_morphine1_second_set_weight_DOB.sh
    Untracked:  analysis/DO_morphine1_second_set_weight_DOB.stderr
    Untracked:  analysis/DO_morphine1_second_set_weight_DOB.stdout
    Untracked:  analysis/DO_morphine1_second_set_weight_age.R
    Untracked:  analysis/DO_morphine1_second_set_weight_age.Rout
    Untracked:  analysis/DO_morphine1_second_set_weight_age.err
    Untracked:  analysis/DO_morphine1_second_set_weight_age.out
    Untracked:  analysis/DO_morphine1_second_set_weight_age.sh
    Untracked:  analysis/DO_morphine1_second_set_weight_age.stderr
    Untracked:  analysis/DO_morphine1_second_set_weight_age.stdout
    Untracked:  analysis/DO_morphine1_weight_DOB.R
    Untracked:  analysis/DO_morphine1_weight_DOB.sh
    Untracked:  analysis/DO_morphine1_weight_age.R
    Untracked:  analysis/DO_morphine1_weight_age.sh
    Untracked:  analysis/DO_morphine_gemma.R
    Untracked:  analysis/DO_morphine_gemma.err
    Untracked:  analysis/DO_morphine_gemma.out
    Untracked:  analysis/DO_morphine_gemma.sh
    Untracked:  analysis/DO_morphine_gemma_firstmin.R
    Untracked:  analysis/DO_morphine_gemma_firstmin.err
    Untracked:  analysis/DO_morphine_gemma_firstmin.out
    Untracked:  analysis/DO_morphine_gemma_firstmin.sh
    Untracked:  analysis/DO_morphine_gemma_withpermu.R
    Untracked:  analysis/DO_morphine_gemma_withpermu.err
    Untracked:  analysis/DO_morphine_gemma_withpermu.out
    Untracked:  analysis/DO_morphine_gemma_withpermu.sh
    Untracked:  analysis/DO_morphine_gemma_withpermu_firstbatch_min.depression.R
    Untracked:  analysis/DO_morphine_gemma_withpermu_firstbatch_min.depression.err
    Untracked:  analysis/DO_morphine_gemma_withpermu_firstbatch_min.depression.out
    Untracked:  analysis/DO_morphine_gemma_withpermu_firstbatch_min.depression.sh
    Untracked:  analysis/Lisa_Tarantino_Interval_needs_mvar_annotation.R
    Untracked:  analysis/Plot_DO_morphine1_SNP.R
    Untracked:  analysis/Plot_DO_morphine1_SNP.Rout
    Untracked:  analysis/Plot_DO_morphine1_SNP.sh
    Untracked:  analysis/Plot_DO_morphine1_SNP.stderr
    Untracked:  analysis/Plot_DO_morphine1_SNP.stdout
    Untracked:  analysis/Plot_DO_morphine1_second_set_SNP.R
    Untracked:  analysis/Plot_DO_morphine1_second_set_SNP.Rout
    Untracked:  analysis/Plot_DO_morphine1_second_set_SNP.sh
    Untracked:  analysis/Plot_DO_morphine1_second_set_SNP.stderr
    Untracked:  analysis/Plot_DO_morphine1_second_set_SNP.stdout
    Untracked:  analysis/download_GSE100356_sra.sh
    Untracked:  analysis/fentanyl_2cohorts_coxph.R
    Untracked:  analysis/fentanyl_2cohorts_coxph.err
    Untracked:  analysis/fentanyl_2cohorts_coxph.out
    Untracked:  analysis/fentanyl_2cohorts_coxph.sh
    Untracked:  analysis/fentanyl_scanone.cph.R
    Untracked:  analysis/fentanyl_scanone.cph.err
    Untracked:  analysis/fentanyl_scanone.cph.out
    Untracked:  analysis/fentanyl_scanone.cph.sh
    Untracked:  analysis/geo_rnaseq.R
    Untracked:  analysis/heritability_first_second_batch.R
    Untracked:  analysis/morphine_fentanyl_survival_time.R
    Untracked:  analysis/nf-rnaseq-b6.R
    Untracked:  analysis/plot_fentanyl_2cohorts_coxph.R
    Untracked:  analysis/scripts/
    Untracked:  analysis/tibmr.R
    Untracked:  analysis/timbr_demo.R
    Untracked:  analysis/workflow_proc.R
    Untracked:  analysis/workflow_proc.sh
    Untracked:  analysis/workflow_proc.stderr
    Untracked:  analysis/workflow_proc.stdout
    Untracked:  analysis/x.R
    Untracked:  code/PLINKtoCSVR.R
    Untracked:  code/cfw/
    Untracked:  code/gemma_plot.R
    Untracked:  code/process.sanger.snp.R
    Untracked:  code/reconst_utils.R
    Untracked:  data/69k_grid_pgmap.RData
    Untracked:  data/BOT_NTS_rnaseq_results/
    Untracked:  data/CC_SARS-1/
    Untracked:  data/CC_SARS-2/
    Untracked:  data/Composite Post Kevins Program Group 2 Fentanyl Prepped for Hao.xlsx
    Untracked:  data/DO_WBP_Data_JAB_to_map.xlsx
    Untracked:  data/Fentanyl_alternate_metrics.xlsx
    Untracked:  data/FinalReport/
    Untracked:  data/GM/
    Untracked:  data/GM_covar.csv
    Untracked:  data/GM_covar_07092018_morphine.csv
    Untracked:  data/Jackson_Lab_Bubier_MURGIGV01/
    Untracked:  data/Lisa Tarantino Interval needs mvar.xlsx
    Untracked:  data/Lisa_Tarantino_Interval_needs_mvar_annotation.csv
    Untracked:  data/MPD_Upload_October.csv
    Untracked:  data/MPD_Upload_October_updated_sex.csv
    Untracked:  data/Master Fentanyl DO Study Sheet.xlsx
    Untracked:  data/MasterMorphine Second Set DO w DOB2.xlsx
    Untracked:  data/MasterMorphine Second Set DO.xlsx
    Untracked:  data/Morphine CC DO mice Updated with Published inbred strains.csv
    Untracked:  data/Morphine_CC_DO_mice_Updated_with_Published_inbred_strains.csv
    Untracked:  data/cc_variants.sqlite
    Untracked:  data/combined/
    Untracked:  data/fentanyl/
    Untracked:  data/fentanyl2/
    Untracked:  data/fentanyl_1_2/
    Untracked:  data/fentanyl_2cohorts_coxph_data.Rdata
    Untracked:  data/first/
    Untracked:  data/founder_geno.csv
    Untracked:  data/genetic_map.csv
    Untracked:  data/gm.json
    Untracked:  data/gwas.sh
    Untracked:  data/marker_grid_0.02cM_plus.txt
    Untracked:  data/metabolomics_mouse_fecal/
    Untracked:  data/mouse_genes_mgi.sqlite
    Untracked:  data/pheno.csv
    Untracked:  data/pheno_qtl2.csv
    Untracked:  data/pheno_qtl2_07092018_morphine.csv
    Untracked:  data/pheno_qtl2_w_dob.csv
    Untracked:  data/physical_map.csv
    Untracked:  data/rnaseq/
    Untracked:  data/sample_geno.csv
    Untracked:  data/second/
    Untracked:  figure/
    Untracked:  glimma-plots/
    Untracked:  output/DO_Fentanyl_Cohort2_MinDepressionRR_coefplot.pdf
    Untracked:  output/DO_Fentanyl_Cohort2_MinDepressionRR_coefplot_blup.pdf
    Untracked:  output/DO_Fentanyl_Cohort2_RRDepressionRateHrSLOPE_coefplot.pdf
    Untracked:  output/DO_Fentanyl_Cohort2_RRRecoveryRateHrSLOPE_coefplot.pdf
    Untracked:  output/DO_Fentanyl_Cohort2_RRRecoveryRateHrSLOPE_coefplot_blup.pdf
    Untracked:  output/DO_Fentanyl_Cohort2_StartofRecoveryHr_coefplot.pdf
    Untracked:  output/DO_Fentanyl_Cohort2_StartofRecoveryHr_coefplot_blup.pdf
    Untracked:  output/DO_Fentanyl_Cohort2_Statusbin_coefplot.pdf
    Untracked:  output/DO_Fentanyl_Cohort2_Statusbin_coefplot_blup.pdf
    Untracked:  output/DO_Fentanyl_Cohort2_SteadyStateDepressionDurationHrINTERVAL_coefplot.pdf
    Untracked:  output/DO_Fentanyl_Cohort2_TimetoDead(Hr)_coefplot.pdf
    Untracked:  output/DO_Fentanyl_Cohort2_TimetoDeadHr_coefplot.pdf
    Untracked:  output/DO_Fentanyl_Cohort2_TimetoDeadHr_coefplot_blup.pdf
    Untracked:  output/DO_Fentanyl_Cohort2_TimetoProjectedRecoveryHr_coefplot.pdf
    Untracked:  output/DO_Fentanyl_Cohort2_TimetoProjectedRecoveryHr_coefplot_blup.pdf
    Untracked:  output/DO_Fentanyl_Cohort2_TimetoSteadyRRDepression(Hr)_coefplot.pdf
    Untracked:  output/DO_Fentanyl_Cohort2_TimetoSteadyRRDepressionHr_coefplot.pdf
    Untracked:  output/DO_Fentanyl_Cohort2_TimetoSteadyRRDepressionHr_coefplot_blup.pdf
    Untracked:  output/DO_Fentanyl_Cohort2_TimetoThresholdRecoveryHr_coefplot.pdf
    Untracked:  output/DO_Fentanyl_Cohort2_TimetoThresholdRecoveryHr_coefplot_blup.pdf
    Untracked:  output/DO_morphine_Min.depression.png
    Untracked:  output/DO_morphine_Min.depression22222_violin_chr5.pdf
    Untracked:  output/DO_morphine_Min.depression_coefplot.pdf
    Untracked:  output/DO_morphine_Min.depression_coefplot_blup.pdf
    Untracked:  output/DO_morphine_Min.depression_coefplot_blup_chr5.png
    Untracked:  output/DO_morphine_Min.depression_coefplot_blup_chrX.png
    Untracked:  output/DO_morphine_Min.depression_coefplot_chr5.png
    Untracked:  output/DO_morphine_Min.depression_coefplot_chrX.png
    Untracked:  output/DO_morphine_Min.depression_peak_genes_chr5.png
    Untracked:  output/DO_morphine_Min.depression_violin_chr5.png
    Untracked:  output/DO_morphine_Recovery.Time.png
    Untracked:  output/DO_morphine_Recovery.Time_coefplot.pdf
    Untracked:  output/DO_morphine_Recovery.Time_coefplot_blup.pdf
    Untracked:  output/DO_morphine_Recovery.Time_coefplot_blup_chr11.png
    Untracked:  output/DO_morphine_Recovery.Time_coefplot_blup_chr4.png
    Untracked:  output/DO_morphine_Recovery.Time_coefplot_blup_chr7.png
    Untracked:  output/DO_morphine_Recovery.Time_coefplot_blup_chr9.png
    Untracked:  output/DO_morphine_Recovery.Time_coefplot_chr11.png
    Untracked:  output/DO_morphine_Recovery.Time_coefplot_chr4.png
    Untracked:  output/DO_morphine_Recovery.Time_coefplot_chr7.png
    Untracked:  output/DO_morphine_Recovery.Time_coefplot_chr9.png
    Untracked:  output/DO_morphine_Status_bin.png
    Untracked:  output/DO_morphine_Status_bin_coefplot.pdf
    Untracked:  output/DO_morphine_Status_bin_coefplot_blup.pdf
    Untracked:  output/DO_morphine_Survival.Time.png
    Untracked:  output/DO_morphine_Survival.Time_coefplot.pdf
    Untracked:  output/DO_morphine_Survival.Time_coefplot_blup.pdf
    Untracked:  output/DO_morphine_Survival.Time_coefplot_blup_chr17.png
    Untracked:  output/DO_morphine_Survival.Time_coefplot_blup_chr8.png
    Untracked:  output/DO_morphine_Survival.Time_coefplot_chr17.png
    Untracked:  output/DO_morphine_Survival.Time_coefplot_chr8.png
    Untracked:  output/DO_morphine_combine_batch_peak_violin.pdf
    Untracked:  output/DO_morphine_combined_69k_m2_Min.depression.png
    Untracked:  output/DO_morphine_combined_69k_m2_Min.depression_coefplot.pdf
    Untracked:  output/DO_morphine_combined_69k_m2_Min.depression_coefplot_blup.pdf
    Untracked:  output/DO_morphine_combined_69k_m2_Recovery.Time.png
    Untracked:  output/DO_morphine_combined_69k_m2_Recovery.Time_coefplot.pdf
    Untracked:  output/DO_morphine_combined_69k_m2_Recovery.Time_coefplot_blup.pdf
    Untracked:  output/DO_morphine_combined_69k_m2_Status_bin.png
    Untracked:  output/DO_morphine_combined_69k_m2_Status_bin_coefplot.pdf
    Untracked:  output/DO_morphine_combined_69k_m2_Status_bin_coefplot_blup.pdf
    Untracked:  output/DO_morphine_combined_69k_m2_Survival.Time.png
    Untracked:  output/DO_morphine_combined_69k_m2_Survival.Time_coefplot.pdf
    Untracked:  output/DO_morphine_combined_69k_m2_Survival.Time_coefplot_blup.pdf
    Untracked:  output/DO_morphine_coxph_24hrs_kinship_QTL.png
    Untracked:  output/DO_morphine_cphout.RData
    Untracked:  output/DO_morphine_first_batch_peak_in_second_batch_violin.pdf
    Untracked:  output/DO_morphine_first_batch_peak_in_second_batch_violin_sidebyside.pdf
    Untracked:  output/DO_morphine_first_batch_peak_violin.pdf
    Untracked:  output/DO_morphine_operm.cph.RData
    Untracked:  output/DO_morphine_second_batch_on_first_batch_peak_violin.pdf
    Untracked:  output/DO_morphine_second_batch_peak_ch6surv_on_first_batchviolin.pdf
    Untracked:  output/DO_morphine_second_batch_peak_ch6surv_on_first_batchviolin2.pdf
    Untracked:  output/DO_morphine_second_batch_peak_in_first_batch_violin.pdf
    Untracked:  output/DO_morphine_second_batch_peak_in_first_batch_violin_sidebyside.pdf
    Untracked:  output/DO_morphine_second_batch_peak_violin.pdf
    Untracked:  output/DO_morphine_secondbatch_69k_Min.depression.png
    Untracked:  output/DO_morphine_secondbatch_69k_Min.depression_coefplot.pdf
    Untracked:  output/DO_morphine_secondbatch_69k_Min.depression_coefplot_blup.pdf
    Untracked:  output/DO_morphine_secondbatch_69k_Recovery.Time.png
    Untracked:  output/DO_morphine_secondbatch_69k_Recovery.Time_coefplot.pdf
    Untracked:  output/DO_morphine_secondbatch_69k_Recovery.Time_coefplot_blup.pdf
    Untracked:  output/DO_morphine_secondbatch_69k_Status_bin.png
    Untracked:  output/DO_morphine_secondbatch_69k_Status_bin_coefplot.pdf
    Untracked:  output/DO_morphine_secondbatch_69k_Status_bin_coefplot_blup.pdf
    Untracked:  output/DO_morphine_secondbatch_69k_Survival.Time.png
    Untracked:  output/DO_morphine_secondbatch_69k_Survival.Time_coefplot.pdf
    Untracked:  output/DO_morphine_secondbatch_69k_Survival.Time_coefplot_blup.pdf
    Untracked:  output/DO_morphine_secondbatch_Min.depression.png
    Untracked:  output/DO_morphine_secondbatch_Min.depression_coefplot.pdf
    Untracked:  output/DO_morphine_secondbatch_Min.depression_coefplot_blup.pdf
    Untracked:  output/DO_morphine_secondbatch_Recovery.Time.png
    Untracked:  output/DO_morphine_secondbatch_Recovery.Time_coefplot.pdf
    Untracked:  output/DO_morphine_secondbatch_Recovery.Time_coefplot_blup.pdf
    Untracked:  output/DO_morphine_secondbatch_Status_bin.png
    Untracked:  output/DO_morphine_secondbatch_Status_bin_coefplot.pdf
    Untracked:  output/DO_morphine_secondbatch_Status_bin_coefplot_blup.pdf
    Untracked:  output/DO_morphine_secondbatch_Survival.Time.png
    Untracked:  output/DO_morphine_secondbatch_Survival.Time_coefplot.pdf
    Untracked:  output/DO_morphine_secondbatch_Survival.Time_coefplot_blup.pdf
    Untracked:  output/Fentanyl/
    Untracked:  output/KPNA3.pdf
    Untracked:  output/SSC4D.pdf
    Untracked:  output/TIMBR.test.RData
    Untracked:  output/apr_69kchr_combined.RData
    Untracked:  output/apr_69kchr_k_loco_combined.rds
    Untracked:  output/apr_69kchr_second_set.RData
    Untracked:  output/combine_batch_variation.RData
    Untracked:  output/combined_gm.RData
    Untracked:  output/combined_gm.k_loco.rds
    Untracked:  output/combined_gm.k_overall.rds
    Untracked:  output/combined_gm.probs_8state.rds
    Untracked:  output/coxph/
    Untracked:  output/do.morphine.RData
    Untracked:  output/do.morphine.k_loco.rds
    Untracked:  output/do.morphine.probs_36state.rds
    Untracked:  output/do.morphine.probs_8state.rds
    Untracked:  output/do_Fentanyl_combine2cohort_MeanDepressionBR_coefplot.pdf
    Untracked:  output/do_Fentanyl_combine2cohort_MeanDepressionBR_coefplot_blup.pdf
    Untracked:  output/do_Fentanyl_combine2cohort_MinDepressionBR_coefplot.pdf
    Untracked:  output/do_Fentanyl_combine2cohort_MinDepressionBR_coefplot_blup.pdf
    Untracked:  output/do_Fentanyl_combine2cohort_MinDepressionRR_coefplot.pdf
    Untracked:  output/do_Fentanyl_combine2cohort_MinDepressionRR_coefplot_blup.pdf
    Untracked:  output/do_Fentanyl_combine2cohort_RRRecoveryRateHr_coefplot.pdf
    Untracked:  output/do_Fentanyl_combine2cohort_RRRecoveryRateHr_coefplot_blup.pdf
    Untracked:  output/do_Fentanyl_combine2cohort_StartofRecoveryHr_coefplot.pdf
    Untracked:  output/do_Fentanyl_combine2cohort_StartofRecoveryHr_coefplot_blup.pdf
    Untracked:  output/do_Fentanyl_combine2cohort_Statusbin_coefplot.pdf
    Untracked:  output/do_Fentanyl_combine2cohort_Statusbin_coefplot_blup.pdf
    Untracked:  output/do_Fentanyl_combine2cohort_SteadyStateDepressionDurationHr_coefplot.pdf
    Untracked:  output/do_Fentanyl_combine2cohort_SteadyStateDepressionDurationHr_coefplot_blup.pdf
    Untracked:  output/do_Fentanyl_combine2cohort_SurvivalTime_coefplot.pdf
    Untracked:  output/do_Fentanyl_combine2cohort_SurvivalTime_coefplot_blup.pdf
    Untracked:  output/do_Fentanyl_combine2cohort_TimetoDeadHr_coefplot.pdf
    Untracked:  output/do_Fentanyl_combine2cohort_TimetoDeadHr_coefplot_blup.pdf
    Untracked:  output/do_Fentanyl_combine2cohort_TimetoMostlyDeadHr_coefplot.pdf
    Untracked:  output/do_Fentanyl_combine2cohort_TimetoMostlyDeadHr_coefplot_blup.pdf
    Untracked:  output/do_Fentanyl_combine2cohort_TimetoProjectedRecoveryHr_coefplot.pdf
    Untracked:  output/do_Fentanyl_combine2cohort_TimetoProjectedRecoveryHr_coefplot_blup.pdf
    Untracked:  output/do_Fentanyl_combine2cohort_TimetoRecoveryHr_coefplot.pdf
    Untracked:  output/do_Fentanyl_combine2cohort_TimetoRecoveryHr_coefplot_blup.pdf
    Untracked:  output/first_batch_variation.RData
    Untracked:  output/first_second_survival_peak_chr.xlsx
    Untracked:  output/hsq_1_first_batch_herit_qtl2.RData
    Untracked:  output/hsq_2_second_batch_herit_qtl2.RData
    Untracked:  output/morphine_fentanyl_survival_time.pdf
    Untracked:  output/old_temp/
    Untracked:  output/out_1_operm.RData
    Untracked:  output/pr_69kchr_combined.RData
    Untracked:  output/pr_69kchr_second_set.RData
    Untracked:  output/qtl.morphine.69k.out.combined.RData
    Untracked:  output/qtl.morphine.69k.out.combined_m2.RData
    Untracked:  output/qtl.morphine.69k.out.second_set.RData
    Untracked:  output/qtl.morphine.operm.RData
    Untracked:  output/qtl.morphine.out.RData
    Untracked:  output/qtl.morphine.out.combined_gm.RData
    Untracked:  output/qtl.morphine.out.combined_gm.female.RData
    Untracked:  output/qtl.morphine.out.combined_gm.male.RData
    Untracked:  output/qtl.morphine.out.combined_weight_DOB.RData
    Untracked:  output/qtl.morphine.out.combined_weight_age.RData
    Untracked:  output/qtl.morphine.out.female.RData
    Untracked:  output/qtl.morphine.out.male.RData
    Untracked:  output/qtl.morphine.out.second_set.RData
    Untracked:  output/qtl.morphine.out.second_set.female.RData
    Untracked:  output/qtl.morphine.out.second_set.male.RData
    Untracked:  output/qtl.morphine.out.second_set.weight_DOB.RData
    Untracked:  output/qtl.morphine.out.second_set.weight_age.RData
    Untracked:  output/qtl.morphine.out.weight_DOB.RData
    Untracked:  output/qtl.morphine.out.weight_age.RData
    Untracked:  output/qtl.morphine1.snpout.RData
    Untracked:  output/qtl.morphine2.snpout.RData
    Untracked:  output/second_batch_pheno.csv
    Untracked:  output/second_batch_variation.RData
    Untracked:  output/second_set_apr_69kchr_k_loco.rds
    Untracked:  output/second_set_gm.RData
    Untracked:  output/second_set_gm.k_loco.rds
    Untracked:  output/second_set_gm.probs_36state.rds
    Untracked:  output/second_set_gm.probs_8state.rds
    Untracked:  output/topSNP_chr5_mindepression.csv
    Untracked:  output/zoompeak_Min.depression_9.pdf
    Untracked:  output/zoompeak_Recovery.Time_16.pdf
    Untracked:  output/zoompeak_Status_bin_11.pdf
    Untracked:  output/zoompeak_Survival.Time_1.pdf
    Untracked:  output/zoompeak_fentanyl_Survival.Time_2.pdf
    Untracked:  sra-tools_v2.10.7.sif

Unstaged changes:
    Modified:   .gitignore
    Modified:   _workflowr.yml
    Deleted:    analysis/CC_SARS-2.Rmd
    Modified:   analysis/marker_violin.Rmd
    Modified:   output/CC_SARS_Chr16_QTL_interval.pdf
    Modified:   output/CC_SARS_Chr16_plotGeno.pdf
    Modified:   output/CC_SARS_Chr16_plotGeno.png
Note that any generated files, e.g. HTML, png, CSS, etc., are not included in this status report because it is ok for generated content to have uncommitted changes.
These are the previous versions of the repository in which changes were made to the R Markdown (analysis/CC_SARS.Rmd) and HTML (docs/CC_SARS.html) files. If you’ve configured a remote Git repository (see ?wflow_git_remote), click on the hyperlinks in the table below to view the files as they were in that past version.
| File | Version | Author | Date | Message |
|---|---|---|---|---|
| Rmd | acc8369 | xhyuo | 2023-09-29 | qtl mapping conditional on Chr16 young |
| html | 1bf1450 | xhyuo | 2023-09-01 | Build site. |
| Rmd | 9f2fe4c | xhyuo | 2023-09-01 | qtl mapping dpi |
| html | 87576d1 | xhyuo | 2023-06-07 | Build site. |
| Rmd | 9fd2684 | xhyuo | 2023-06-07 | snp annotation csv |
| html | ac4e5fd | xhyuo | 2023-06-07 | Build site. |
| Rmd | 501e447 | xhyuo | 2023-06-07 | snp annotation |
| html | 446ef80 | xhyuo | 2023-05-12 | Build site. |
| Rmd | 4cdafe6 | xhyuo | 2023-05-12 | CC_SARS plotGeno pheno label |
| html | 5d16c51 | xhyuo | 2023-05-04 | Build site. |
| Rmd | 650b581 | xhyuo | 2023-05-04 | CC_SARS plotGeno png |
| html | 20c7a92 | xhyuo | 2023-05-04 | Build site. |
| Rmd | 8cd8b14 | xhyuo | 2023-05-04 | CC_SARS plotGeno save |
| html | 69d6d51 | xhyuo | 2023-04-20 | Build site. |
| Rmd | f14e74b | xhyuo | 2023-04-20 | CC_SARS plotGeno2 |
| html | 1804c4f | xhyuo | 2023-04-20 | Build site. |
| Rmd | 5f9d416 | xhyuo | 2023-04-20 | CC_SARS plotGeno |
| html | 7670d84 | xhyuo | 2023-04-12 | Build site. |
| Rmd | c81156f | xhyuo | 2023-04-12 | CC_SARS qtl plot remove noninformative marker |
| html | c3bafbc | xhyuo | 2023-04-12 | Build site. |
| Rmd | 7062be2 | xhyuo | 2023-04-12 | CC_SARS qtl remove noninformative marker |
| html | d3baa96 | xhyuo | 2023-04-11 | Build site. |
| Rmd | d2e27f6 | xhyuo | 2023-04-11 | CC_SARS qtl peak |
| html | c2d7684 | xhyuo | 2023-04-07 | Build site. |
| Rmd | f1fa513 | xhyuo | 2023-04-07 | CC_SARS qtl new lod drop |
| html | ea484cc | xhyuo | 2023-04-06 | Build site. |
| Rmd | b315db7 | xhyuo | 2023-04-06 | CC_SARS qtl lod drop |
| html | 80390e8 | xhyuo | 2023-04-05 | Build site. |
| Rmd | 3efc2fb | xhyuo | 2023-04-05 | CC_SARS sex qtl |
| html | b864fd1 | xhyuo | 2023-03-30 | Build site. |
| Rmd | 558a2a4 | xhyuo | 2023-03-30 | CC_SARS qtl |
| html | 6a0b66f | xhyuo | 2023-03-22 | Build site. |
| Rmd | ffa3ffd | xhyuo | 2023-03-22 | CC_SARS |
Last update: 2023-09-29
Loading libraries
library(ggplot2)
library(gridExtra)
library(GGally)
library(parallel)
library(qtl)
library(parallel)
library(survival)
library(regress)
library(abind)
library(tidyverse)
library(broman)
library(qtl2)
library(qtlcharts)
library(DT)
library(biomaRt)
library(vroom)
source("code/PLINKtoCSVR.R")

rz.transform <- function(y) {
  rankY=rank(y, ties.method="average", na.last="keep")
  rzT=qnorm(rankY/(length(na.exclude(rankY))+1))
  return(rzT)
}
Read phenotype data
# Read phenotype data -----------------------------------------------------
pheno <- readxl::read_xlsx(path = "data/CC_SARS-1/Menachery 2022 SARS-CoV-1 Study.xlsx", skip = 1,
                        sheet = 1)
pheno <- pheno %>%
  slice(-1) %>%
  dplyr::mutate(across(7:18, as.numeric))
# Warning in mask$eval_all_mutate(quo): NAs introduced by coercion
colnames(pheno)[1] <- "AnimalID"
colnames(pheno)[7:11] <- paste0("DPI-g.", 0:4)
colnames(pheno)[12:16] <- paste0("DPI-perct.", 0:4)
colnames(pheno)[17] <- "Lung_titer_4DPI_PFU_per_ml"
colnames(pheno)[18] <- "Log10_Lung_titer_4DPI_PFU_per_ml"
#add another column for log10 (+1) so that it will not be NA
pheno <- pheno %>%
  dplyr::mutate(Log10_1_Lung_titer_4DPI_PFU_per_ml = log10(Lung_titer_4DPI_PFU_per_ml + 1))

#
pheno <- pheno %>%
  dplyr::mutate(strain = str_sub(Strain, 1, 4), .after = Strain) %>%
  tidyr::unite(IID, c("strain", "Gender", "AnimalID"), sep = "_", remove = FALSE) %>%
  tidyr::separate(Parents, c("MID", "FID"))

#boxplot
p1 <- ggplot(pheno, aes(x=Gender, y=Lung_titer_4DPI_PFU_per_ml, group = Gender, fill = Gender, alpha = 0.9)) +
  geom_boxplot(show.legend = F , outlier.size = 1.5, notchwidth = 0.85) +
  geom_jitter(color="black", size=0.8, alpha=0.9) +
  scale_fill_brewer(palette="Blues") +
  ylab("Lung titer 4DPI [PFU/ml]") +
  xlab("Gender") +
  labs(fill = "") +
  theme(legend.position = "none",
        panel.grid.major = element_blank(),
        panel.grid.minor = element_blank(),
        panel.background = element_blank(),
        axis.line = element_line(colour = "black"),
        text = element_text(size=16),
        axis.title=element_text(size=16)) +
  guides(shape = guide_legend(override.aes = list(size = 12)))
p1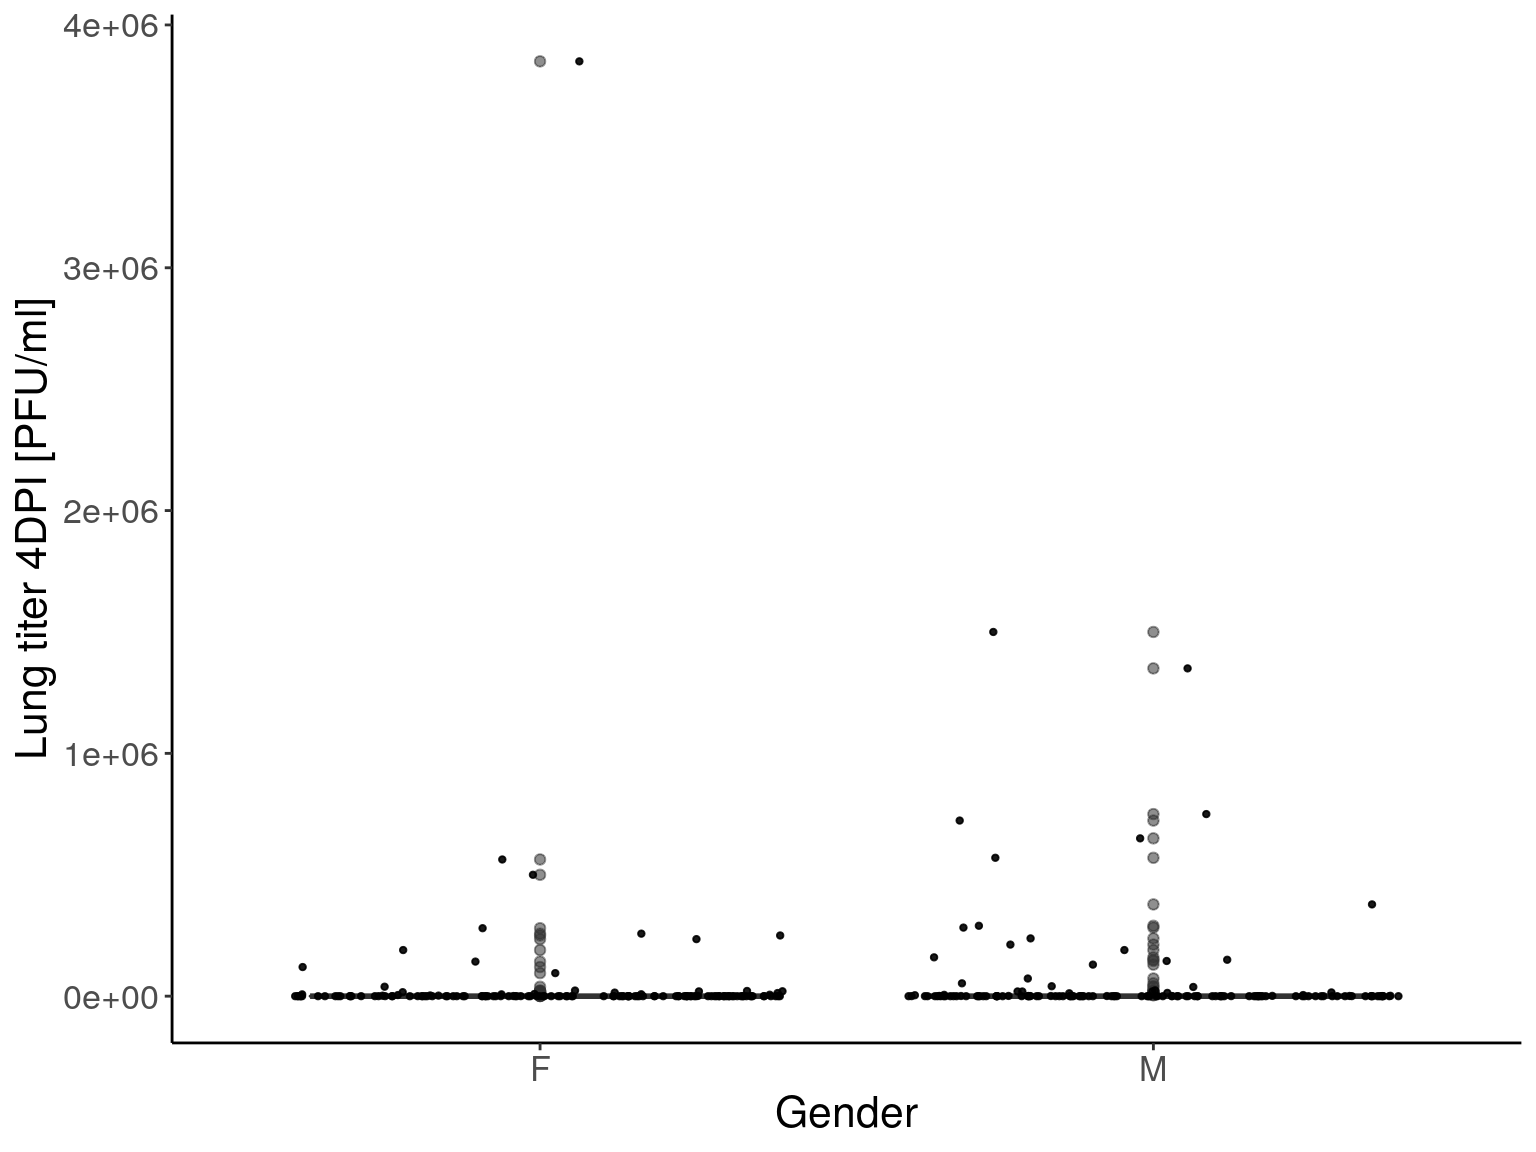
| Version | Author | Date |
|---|---|---|
| 6a0b66f | xhyuo | 2023-03-22 |
p2 <- ggplot(pheno, aes(x=Gender, y=Log10_1_Lung_titer_4DPI_PFU_per_ml, group = Gender, fill = Gender, alpha = 0.9)) +
  geom_boxplot(show.legend = F , outlier.size = 1.5, notchwidth = 0.85) +
  geom_jitter(color="black", size=0.8, alpha=0.9) +
  scale_fill_brewer(palette="Blues") +
  ylab("Log10 (Lung titer)") +
  xlab("Gender") +
  labs(fill = "") +
  theme(legend.position = "none",
        panel.grid.major = element_blank(),
        panel.grid.minor = element_blank(),
        panel.background = element_blank(),
        axis.line = element_line(colour = "black"),
        text = element_text(size=16),
        axis.title=element_text(size=16)) +
  guides(shape = guide_legend(override.aes = list(size = 12)))
p2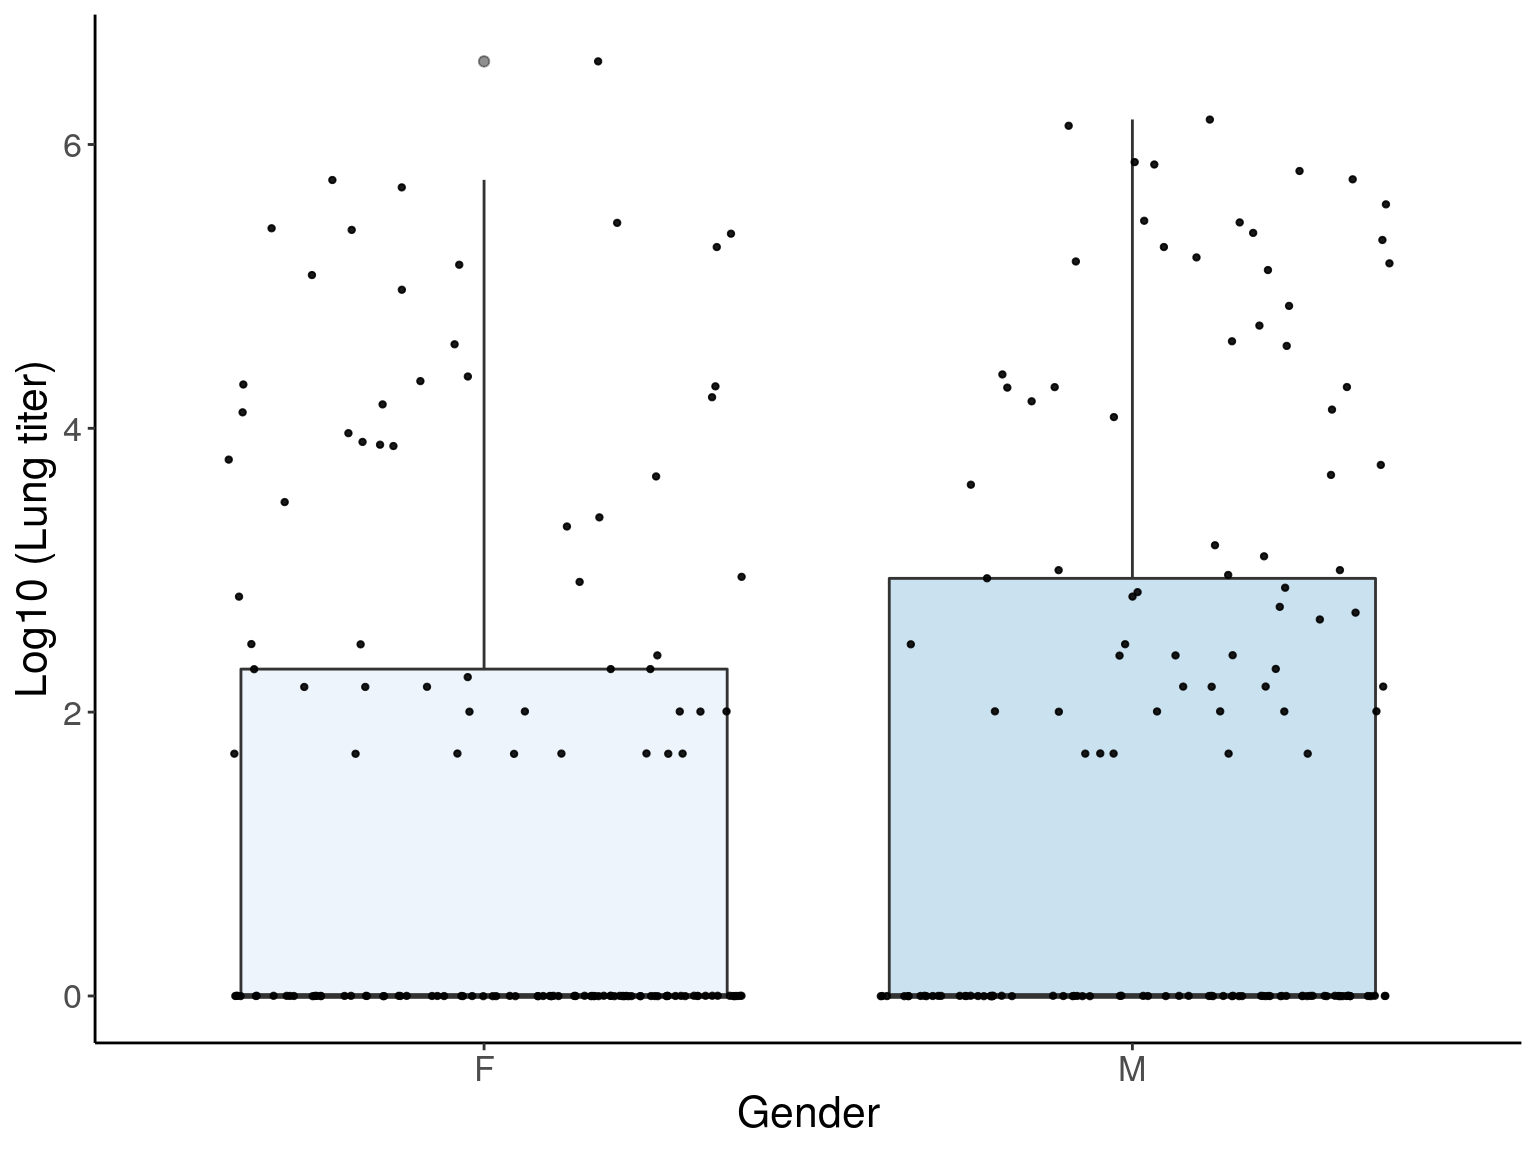
QC on the genotype data
batch.name <- list.files("data/CC_SARS-1/", pattern = "*-raw-genotypes.txt", full.names = TRUE)

#read data
geno <- map_dfr(batch.name, ~read.table(.x, header = TRUE, sep = "\t"))
geno <- geno %>%
  dplyr::mutate(Sample.Name = gsub(" ", "", Sample.Name))

#missing
percent_missing <- geno %>%
  dplyr::filter(Allele1...Forward == "-" & Allele2...Forward == "-") %>%
  group_by(Sample.Name) %>%
  tally() %>%
  dplyr::mutate(Percent_missing_genotype_data = 100*n/n_distinct(geno$SNP.Name)) %>%
  dplyr::mutate(Mouse=seq_along(Sample.Name))

#iplot
iplot(percent_missing$Mouse,
      percent_missing$Percent_missing_genotype_data,
      indID=paste0(percent_missing$Sample.Name, " (", round(percent_missing$Percent_missing_genotype_data,2), "%)"),
      chartOpts=list(xlab="Mouse",  ylab="Percent missing genotype data", ylim=c(0, 100)))
Sex
#sex
#xint and yint
#Xint
Xint <- geno %>%
  dplyr::filter(Chromosome == "X") %>%
  dplyr::mutate(xint = (X+Y)/2) %>%
  reshape2::dcast(. , Sample.Name ~ SNP.Name, value.var = "xint") %>%
  column_to_rownames(var = "Sample.Name")
#Yint
Yint <- geno %>%
  dplyr::filter(Chromosome == "Y") %>%
  dplyr::mutate(yint = (X+Y)/2) %>%
  reshape2::dcast(. , Sample.Name ~ SNP.Name, value.var = "yint") %>%
  column_to_rownames(var = "Sample.Name")

#sex order
all.equal(rownames(Xint), rownames(Yint))
# [1] TRUE
sex <- str_extract(rownames(Xint), "(?<=_)[^_]*(?=_)")

x_pval <- apply(Xint, 2, function(a) t.test(a ~ sex)$p.value)
y_pval <- apply(Yint, 2, function(a) t.test(a ~ sex)$p.value)

xint_ave <- rowMeans(Xint[, x_pval < 0.05/length(x_pval)], na.rm=TRUE)
yint_ave <- rowMeans(Yint[, y_pval < 0.05/length(y_pval)], na.rm=TRUE)

point_colors <- as.character( brocolors("web")[c("green", "purple")] )
labels <- paste0(names(xint_ave))
iplot(xint_ave, yint_ave, group=sex, indID=labels,
      chartOpts=list(pointcolor=point_colors, pointsize=4,
                     xlab="Average X chr intensity", ylab="Average Y chr intensity"))
Genotype format on PLINK and R/qtl
minimuga <- read.csv("https://raw.githubusercontent.com/kbroman/MUGAarrays/c4e92e32300d97055408fbc26c84e0005a873d4a/UWisc/mini_uwisc_v2.csv")

#remove bad samples MVVM_F_879, VMVM_F_583
pheno <- pheno %>%
  dplyr::filter(!(IID %in% c("MVVM_F_879", "VMVM_F_583")))
geno <- geno %>%
  dplyr::filter(!(Sample.Name %in% c("MVVM_F_879", "VMVM_F_583"))) %>%
  dplyr::filter(!(Chromosome %in% c("Y", "MT", "PAR", "0"))) %>%
  dplyr::left_join(., minimuga[, c(1,4)], by = c("SNP.Name"  = "marker"))

#chromosome (1-22, X, Y or 0 if unplaced)
#rs# or snp identifier
#Genetic distance (morgans)
#Base-pair position (bp units)

map <- geno %>%
  dplyr::select(Chromosome, SNP.Name, cM_cox, bp = Position) %>%
  #dplyr::mutate(morgan = 0, .before = bp) %>%
  #dplyr::filter(Chromosome %in% c("Y", "MT", "PAR", "0"))
  distinct()

ped.pheno <- geno %>%
  tidyr::unite("geno", Allele1...Forward, Allele2...Forward, sep = " ", remove = FALSE) %>%
  dplyr::select(Sample.Name, SNP.Name, geno) %>%
  dplyr::mutate(geno = case_when(
    geno == "- -" ~ "0 0",
    TRUE ~ as.character(geno)
  )) %>%
  reshape2::dcast(. , Sample.Name ~ SNP.Name, value.var = "geno") %>%
  left_join(x = pheno[, c(1,3,7,8,10:14, 16:22)], y = ., by = c("IID" = "Sample.Name")) %>%
  dplyr::mutate(FFID = paste0(FID, "_", MID), .before = 1)

#qc on the marker
qc_marker <- data.frame(name = colnames(ped.pheno)[-1:-17],
                        letter = map_chr(18:ncol(ped.pheno), function(x){
                          paste0(unique(unlist(strsplit(pull(ped.pheno[,x]), " "))), collapse = "")
                          }),
                        length = map_dbl(18:ncol(ped.pheno), function(x){
                          y  = unique(unlist(strsplit(pull(ped.pheno[,x]), " ")))
                          length(y[y != "-"])
                          })
                        )
#select marker with length > 1
ped.pheno <- cbind(ped.pheno[, 1:17], ped.pheno[, qc_marker[qc_marker$length > 1, "name"]])
#update map
map <- map %>%
  dplyr::filter(SNP.Name %in% qc_marker[qc_marker$length > 1, "name"])
all.equal(map$SNP.Name, colnames(ped.pheno)[-1:-17])
# [1] TRUE
write.table(map, file = "data/CC_SARS-1/cc_sars.map", sep = " ", quote = F, col.names = FALSE, row.names = FALSE)

#ped
ped <- ped.pheno %>%
  dplyr::mutate(Gender = if_else(Gender == "M", 1, 2)) %>%
  dplyr::select(FFID, IID, FID, MID, Gender, 17:last_col())
write.table(ped, file = "data/CC_SARS-1/cc_sars.ped", sep = " ", quote = F, col.names = FALSE, row.names = FALSE)
#pheno
write.table(ped.pheno[, c(1, 2, 6:17)], file = "data/CC_SARS-1/cc_sars.pheno", sep = " ", quote = F, col.names = TRUE, row.names = FALSE)

#read plink format
system("cd /projects/compsci/vmp/USERS/heh/DO_Opioid/data/CC_SARS-1; /projects/csna/csna_workflow/code/plink-1.07-x86_64/plink --noweb --file cc_sars  --missing-phenotype NA --mind 0.1 --geno 0.1 --recode --out cc_sars_qc")
QTL mapping with removing non-informative markers
cross <- PLINKtoCSVR(ped = "data/CC_SARS-1/cc_sars_qc.ped",
                     map = "data/CC_SARS-1/cc_sars_qc.map",
                     out = "data/CC_SARS-1/cross.csvr")
#  --Read the following data:
#    282  individuals
#    2785  markers
#    2  phenotypes
# Warning in summary.cross(cross): Some markers at the same position on chr
# 1,2,3,5,6,7,8,9,10,11,12,13,14,15,16,18,19,23; use jittermap().
#  --Cross type: f2
cross$pheno <- cbind(cross$pheno, ped.pheno[, c(6:17)])
#rankz on DPI
cross$pheno <- cross$pheno %>%
  dplyr::mutate(across(3:11, ~rz.transform(.x)))
#convert to cross2
cross2 <- convert2cross2(cross)

plotMap(cross) 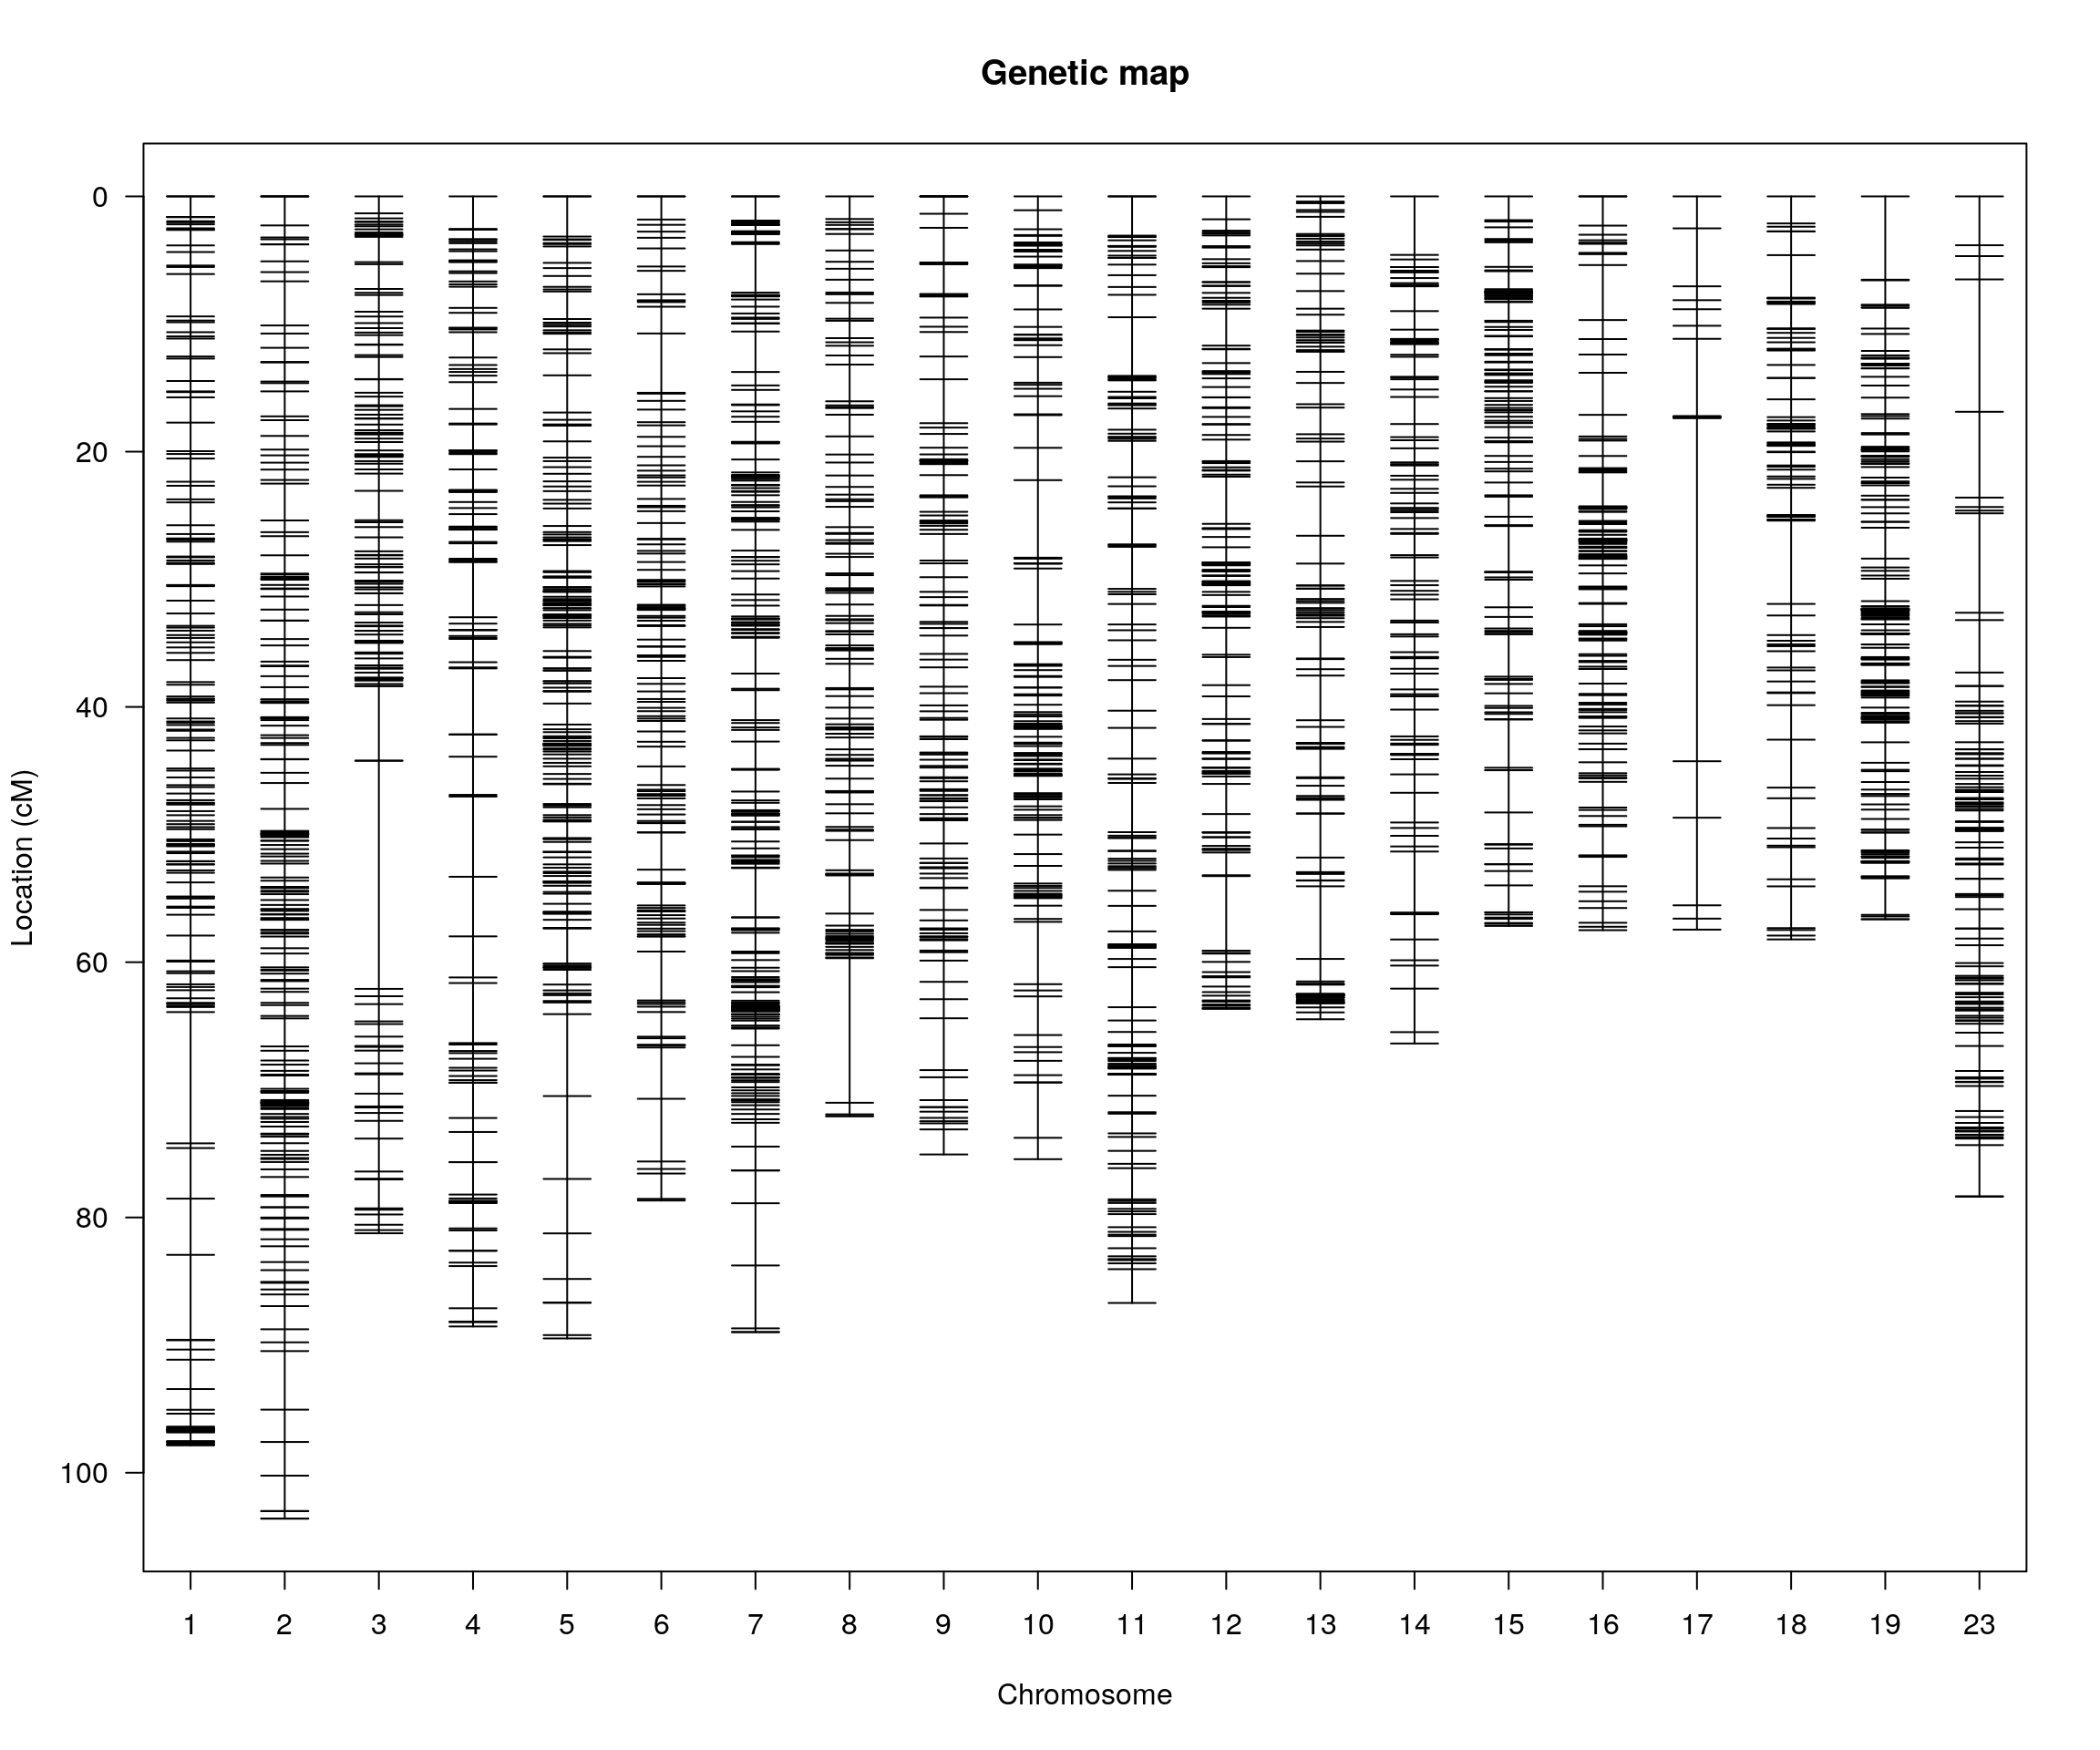
plotPheno(cross, pheno.col = 14, xlab = "", main = "Log10_1_Lung_titer_4DPI_PFU_per_ml")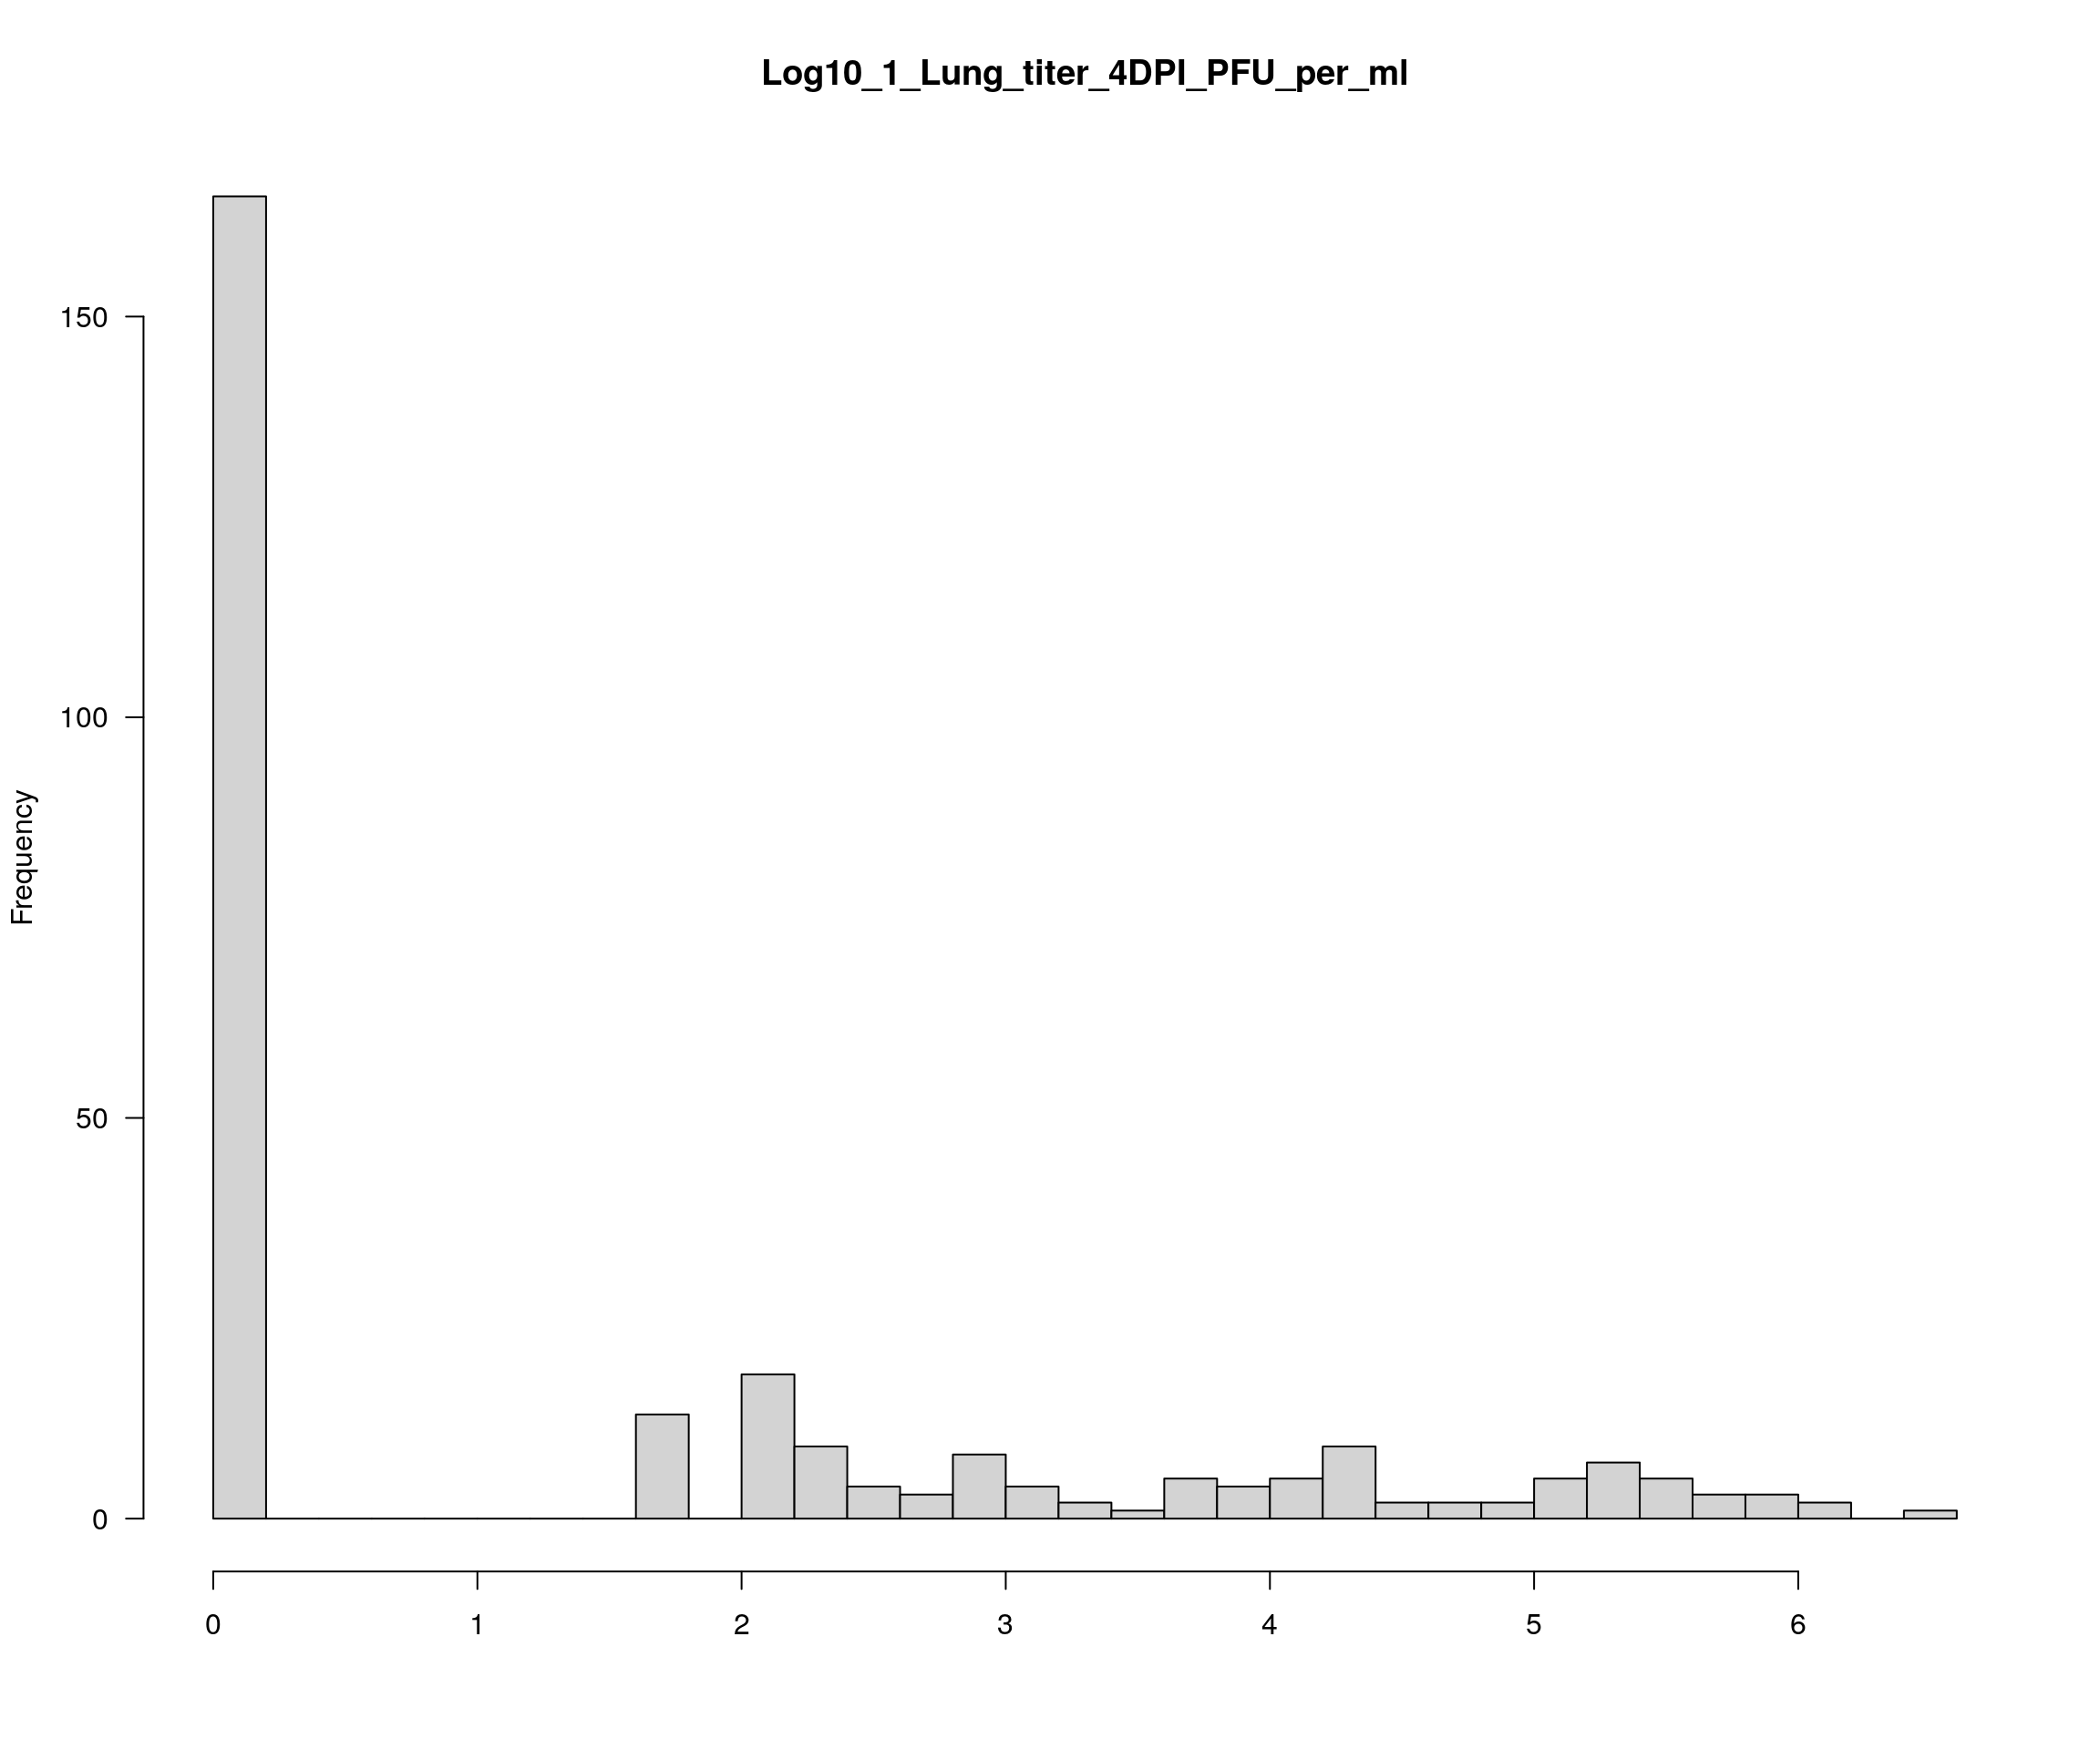
plotPheno(cross, pheno.col = 12, xlab = "", main = "Lung_titer_4DPI_PFU_per_ml")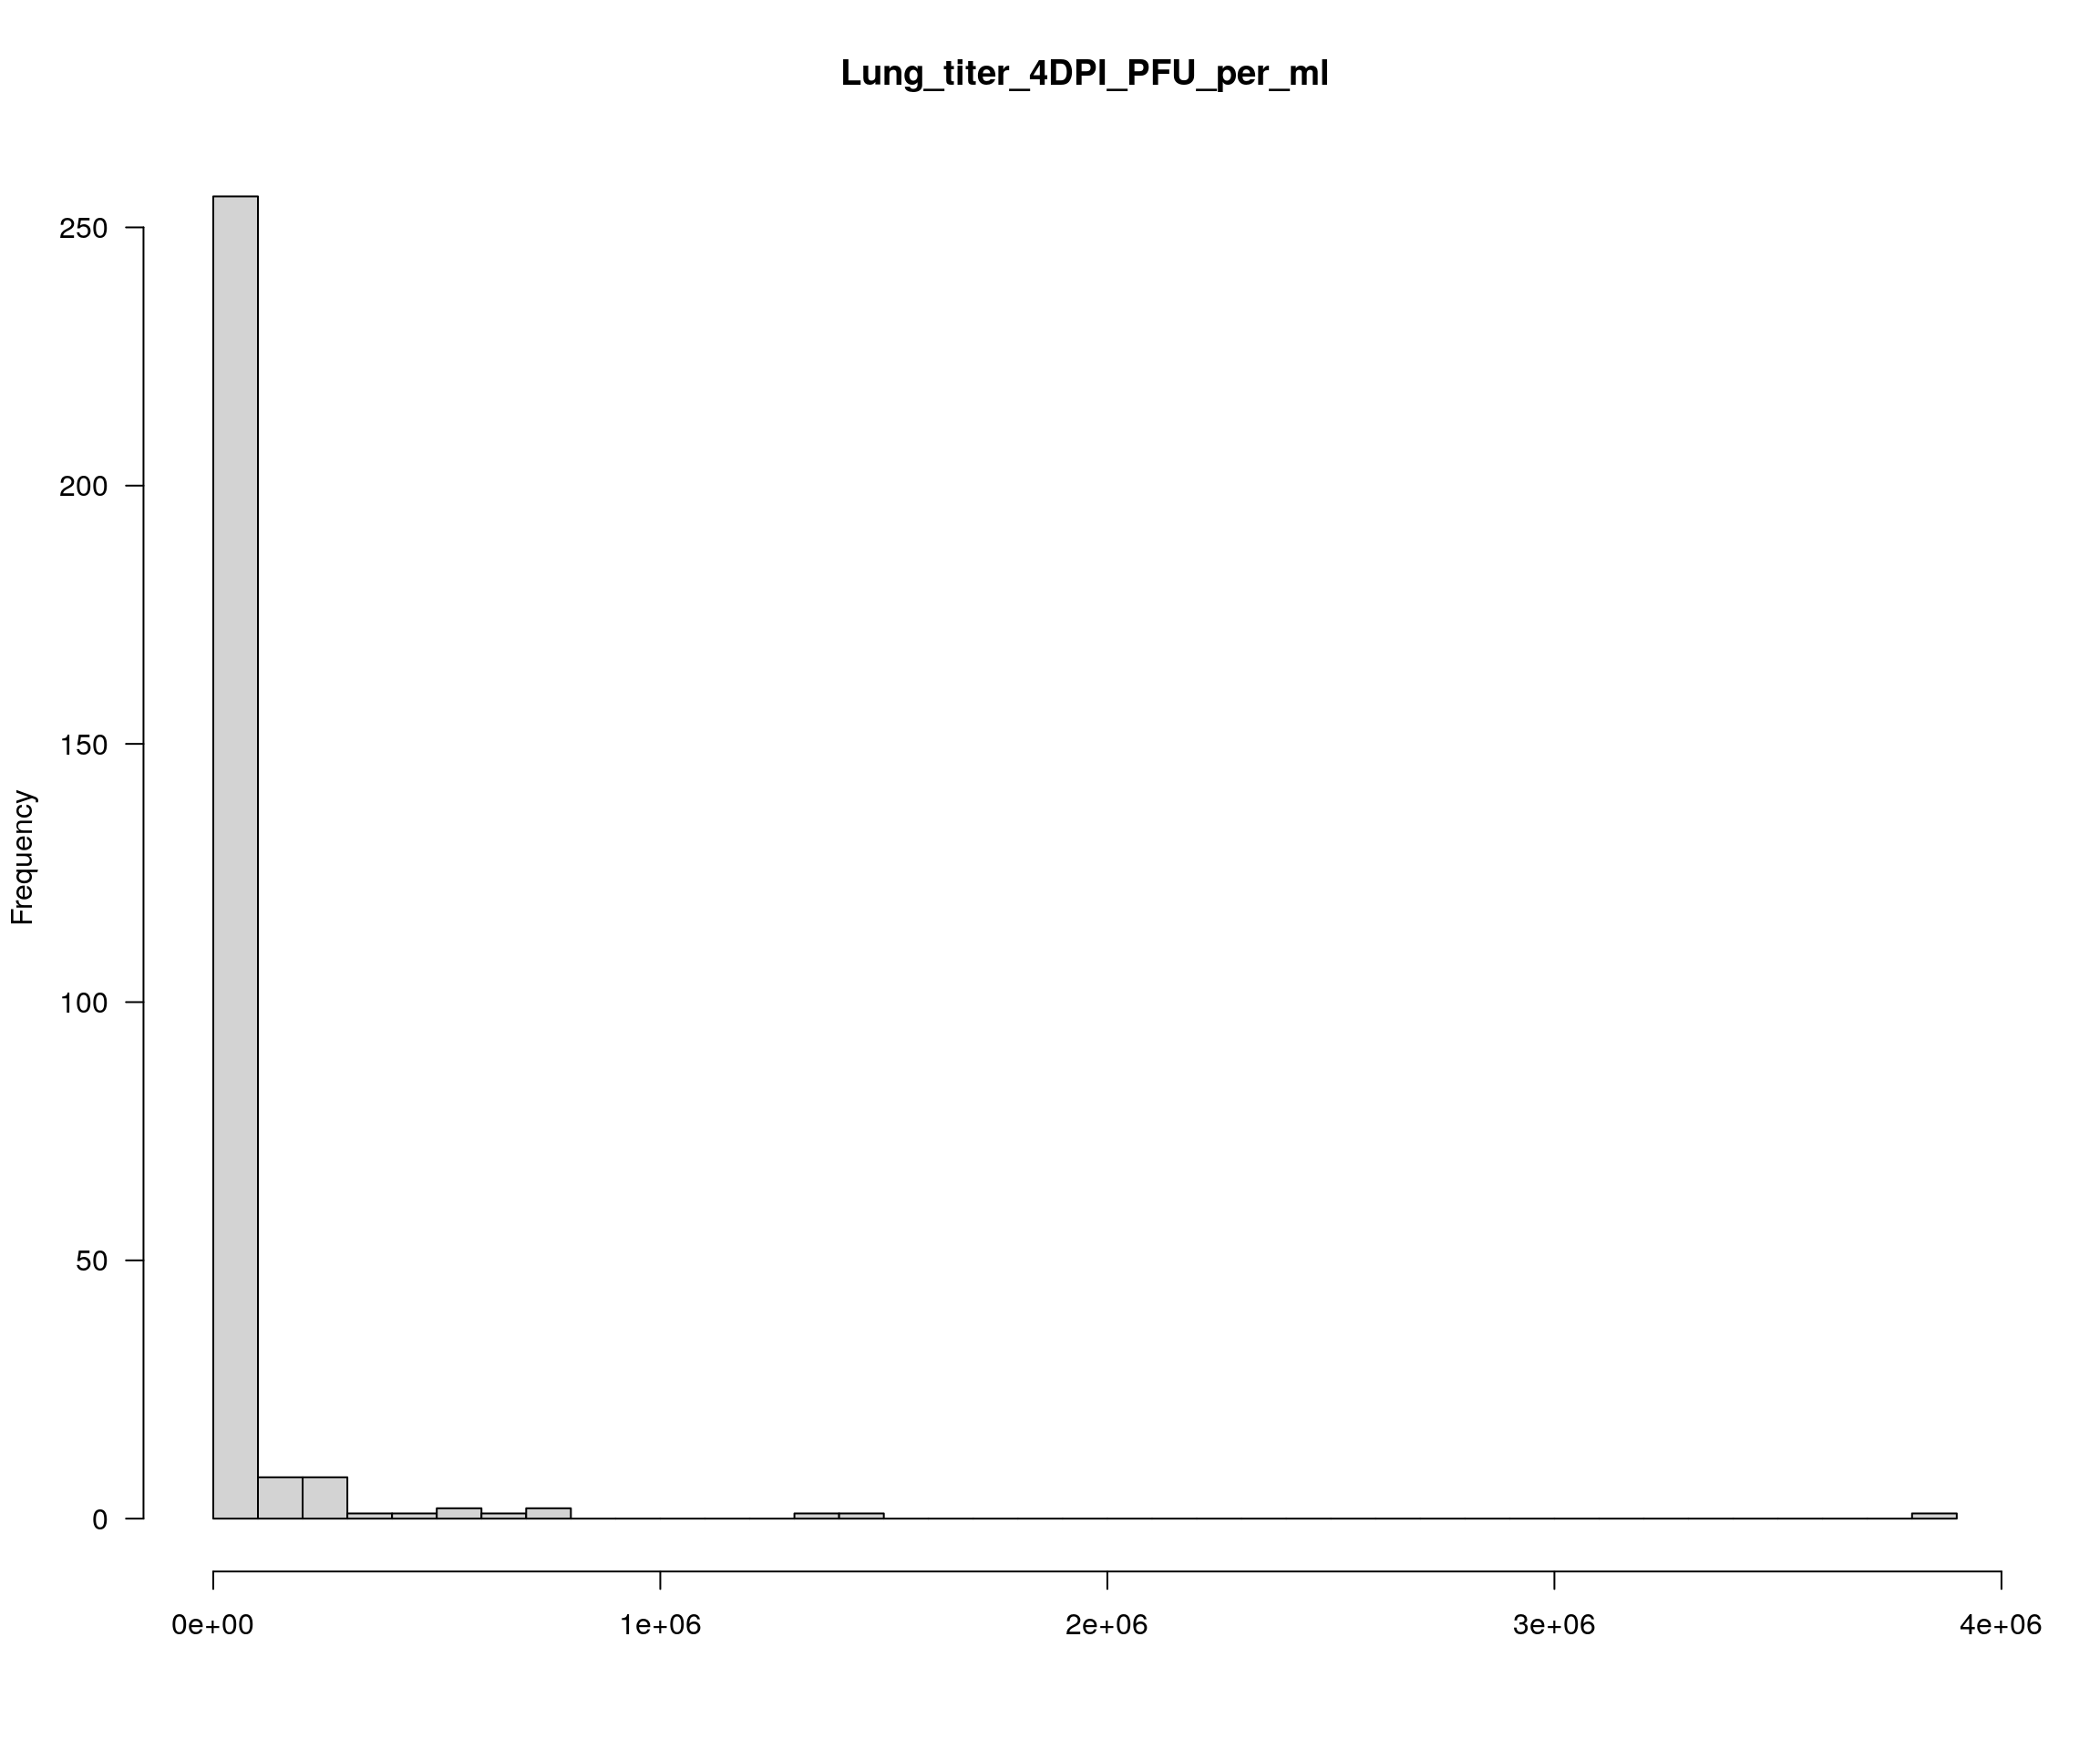
plotPheno(cross, pheno.col = 13, xlab = "", main = "Log10_Lung_titer_4DPI_PFU_per_ml")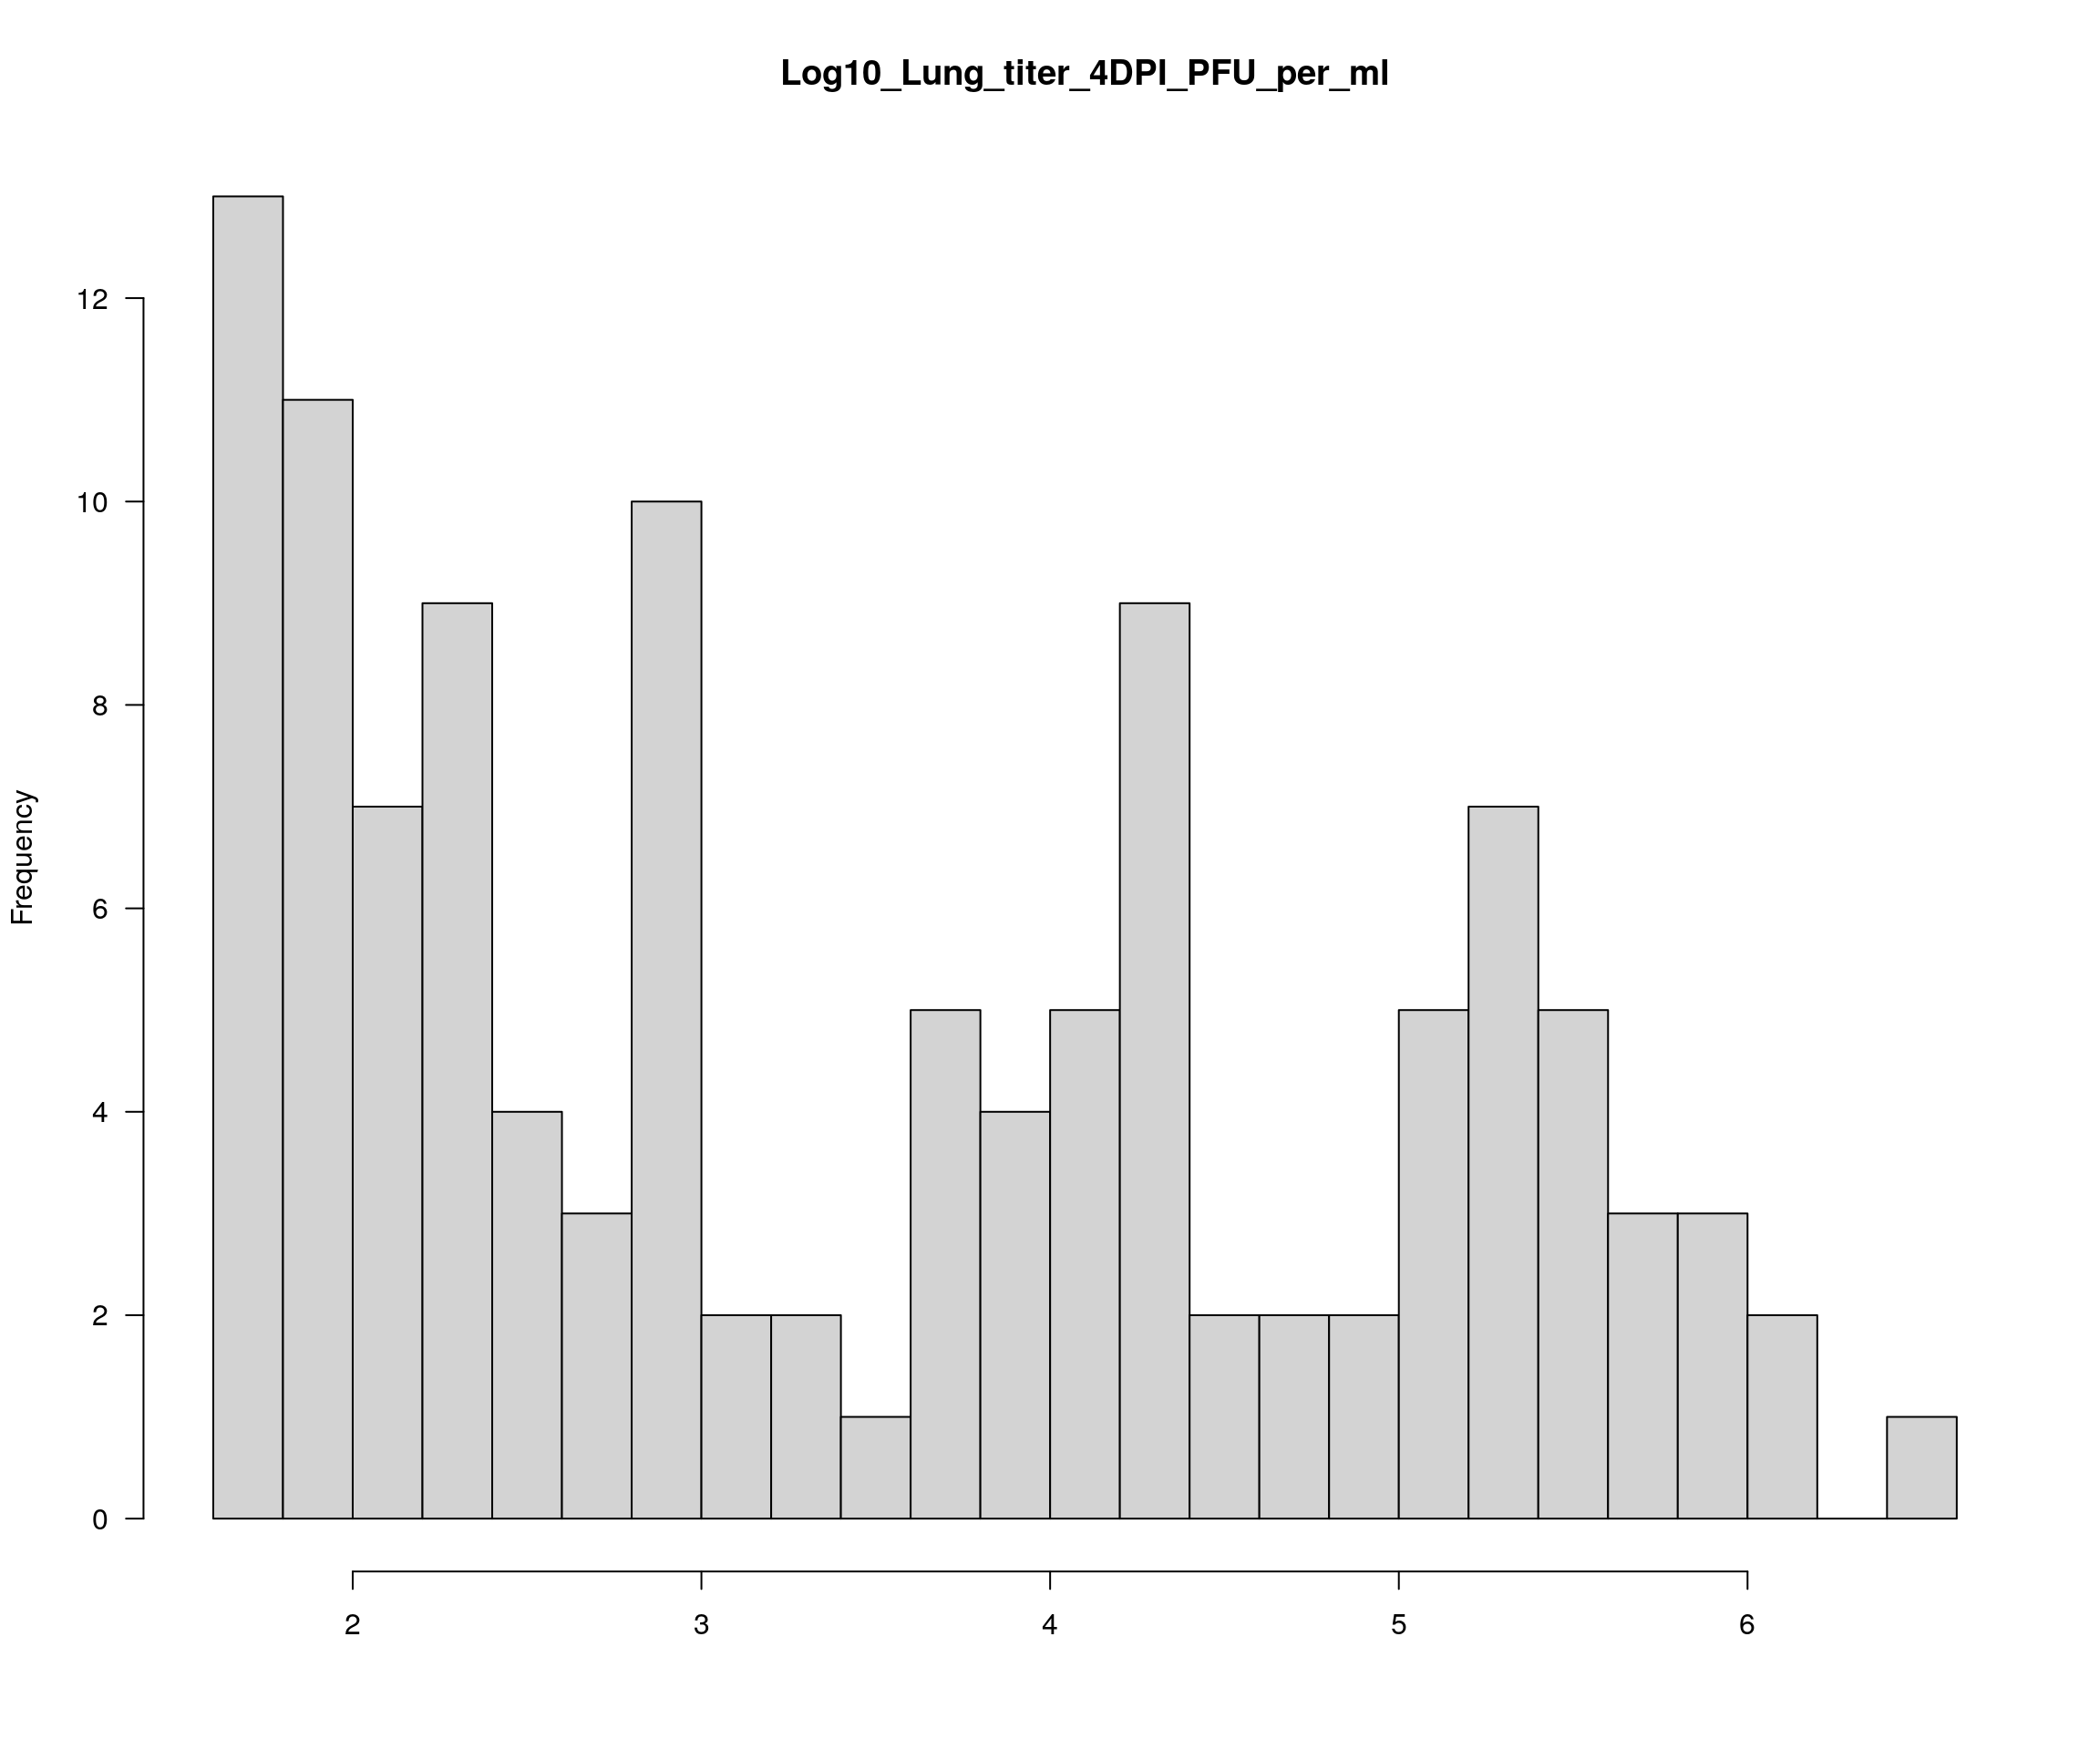
#0/1 for females/males
covars <- model.matrix(~ sex, cross$pheno)[,-1]
f2_qtl <- calc.genoprob(cross)

#1
out_1 <- scanone(f2_qtl, pheno.col = 14, model = "2part", n.cluster = 10)
#out_1_operm <- scanone(f2_qtl, pheno.col = 1, model = "2part", n.perm = 100, n.cluster = 10)
#save(out_1_operm, file = "output/out_1_operm.RData")
load("output/out_1_operm.RData")
summary(out_1[,1:3], perms = out_1_operm[,1], alpha = 0.05, pvalues = TRUE)
#              chr  pos lod.p.mu pval
# gUNCHS042457  16 25.5     52.6    0
summary(out_1_operm[,1], alpha=c(0.05))
# LOD thresholds (100 permutations)
#    lod.p.mu
# 5%     9.06

#3
out_3 <- scanone(f2_qtl, pheno.col = 13, model = "normal", n.cluster = 10)
# Warning in checkcovar(cross, pheno.col, addcovar, intcovar, perm.strata, : Dropping 165 individuals with missing phenotypes.
#
plot(out_1, col = c("red"), main = "Log10_1_Lung_titer_4DPI_PFU_per_ml", ylab = "LOD")
add.threshold(out_1, perms = out_1_operm, alpha = 0.05, col="magenta")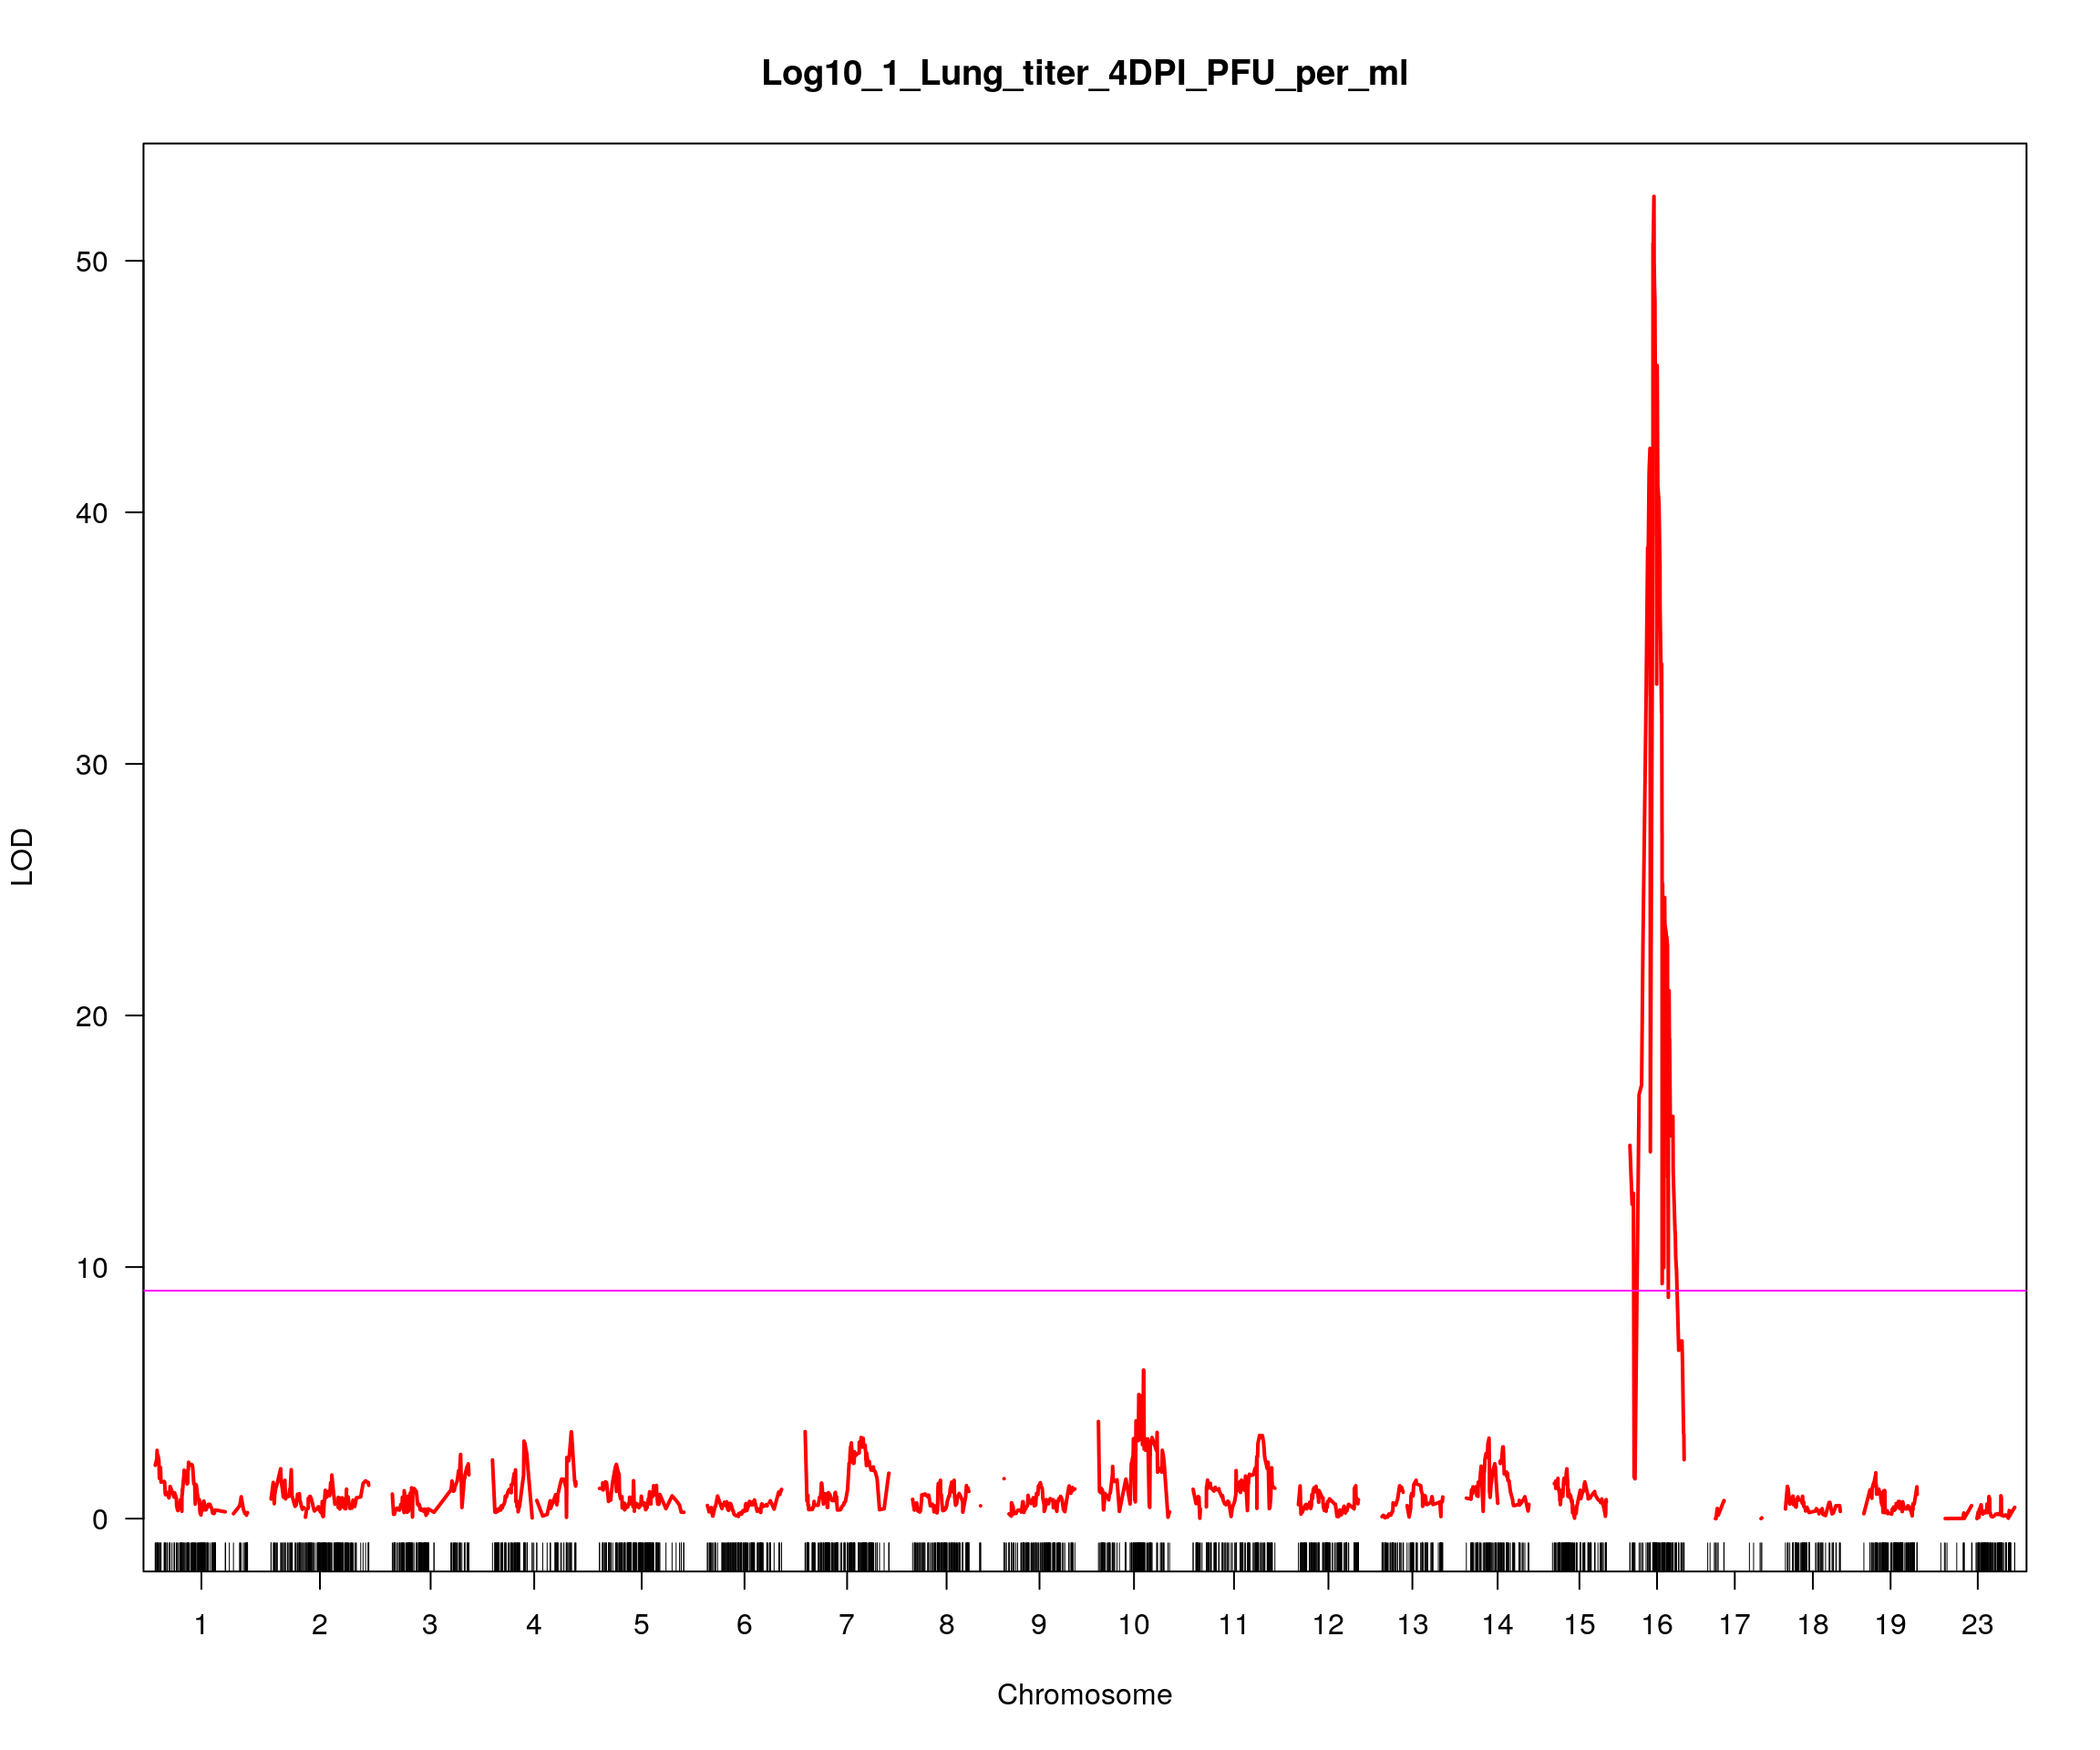
plot(out_3, col = c("gray"), main = "Log10_Lung_titer_4DPI_PFU_per_ml", ylab = "LOD")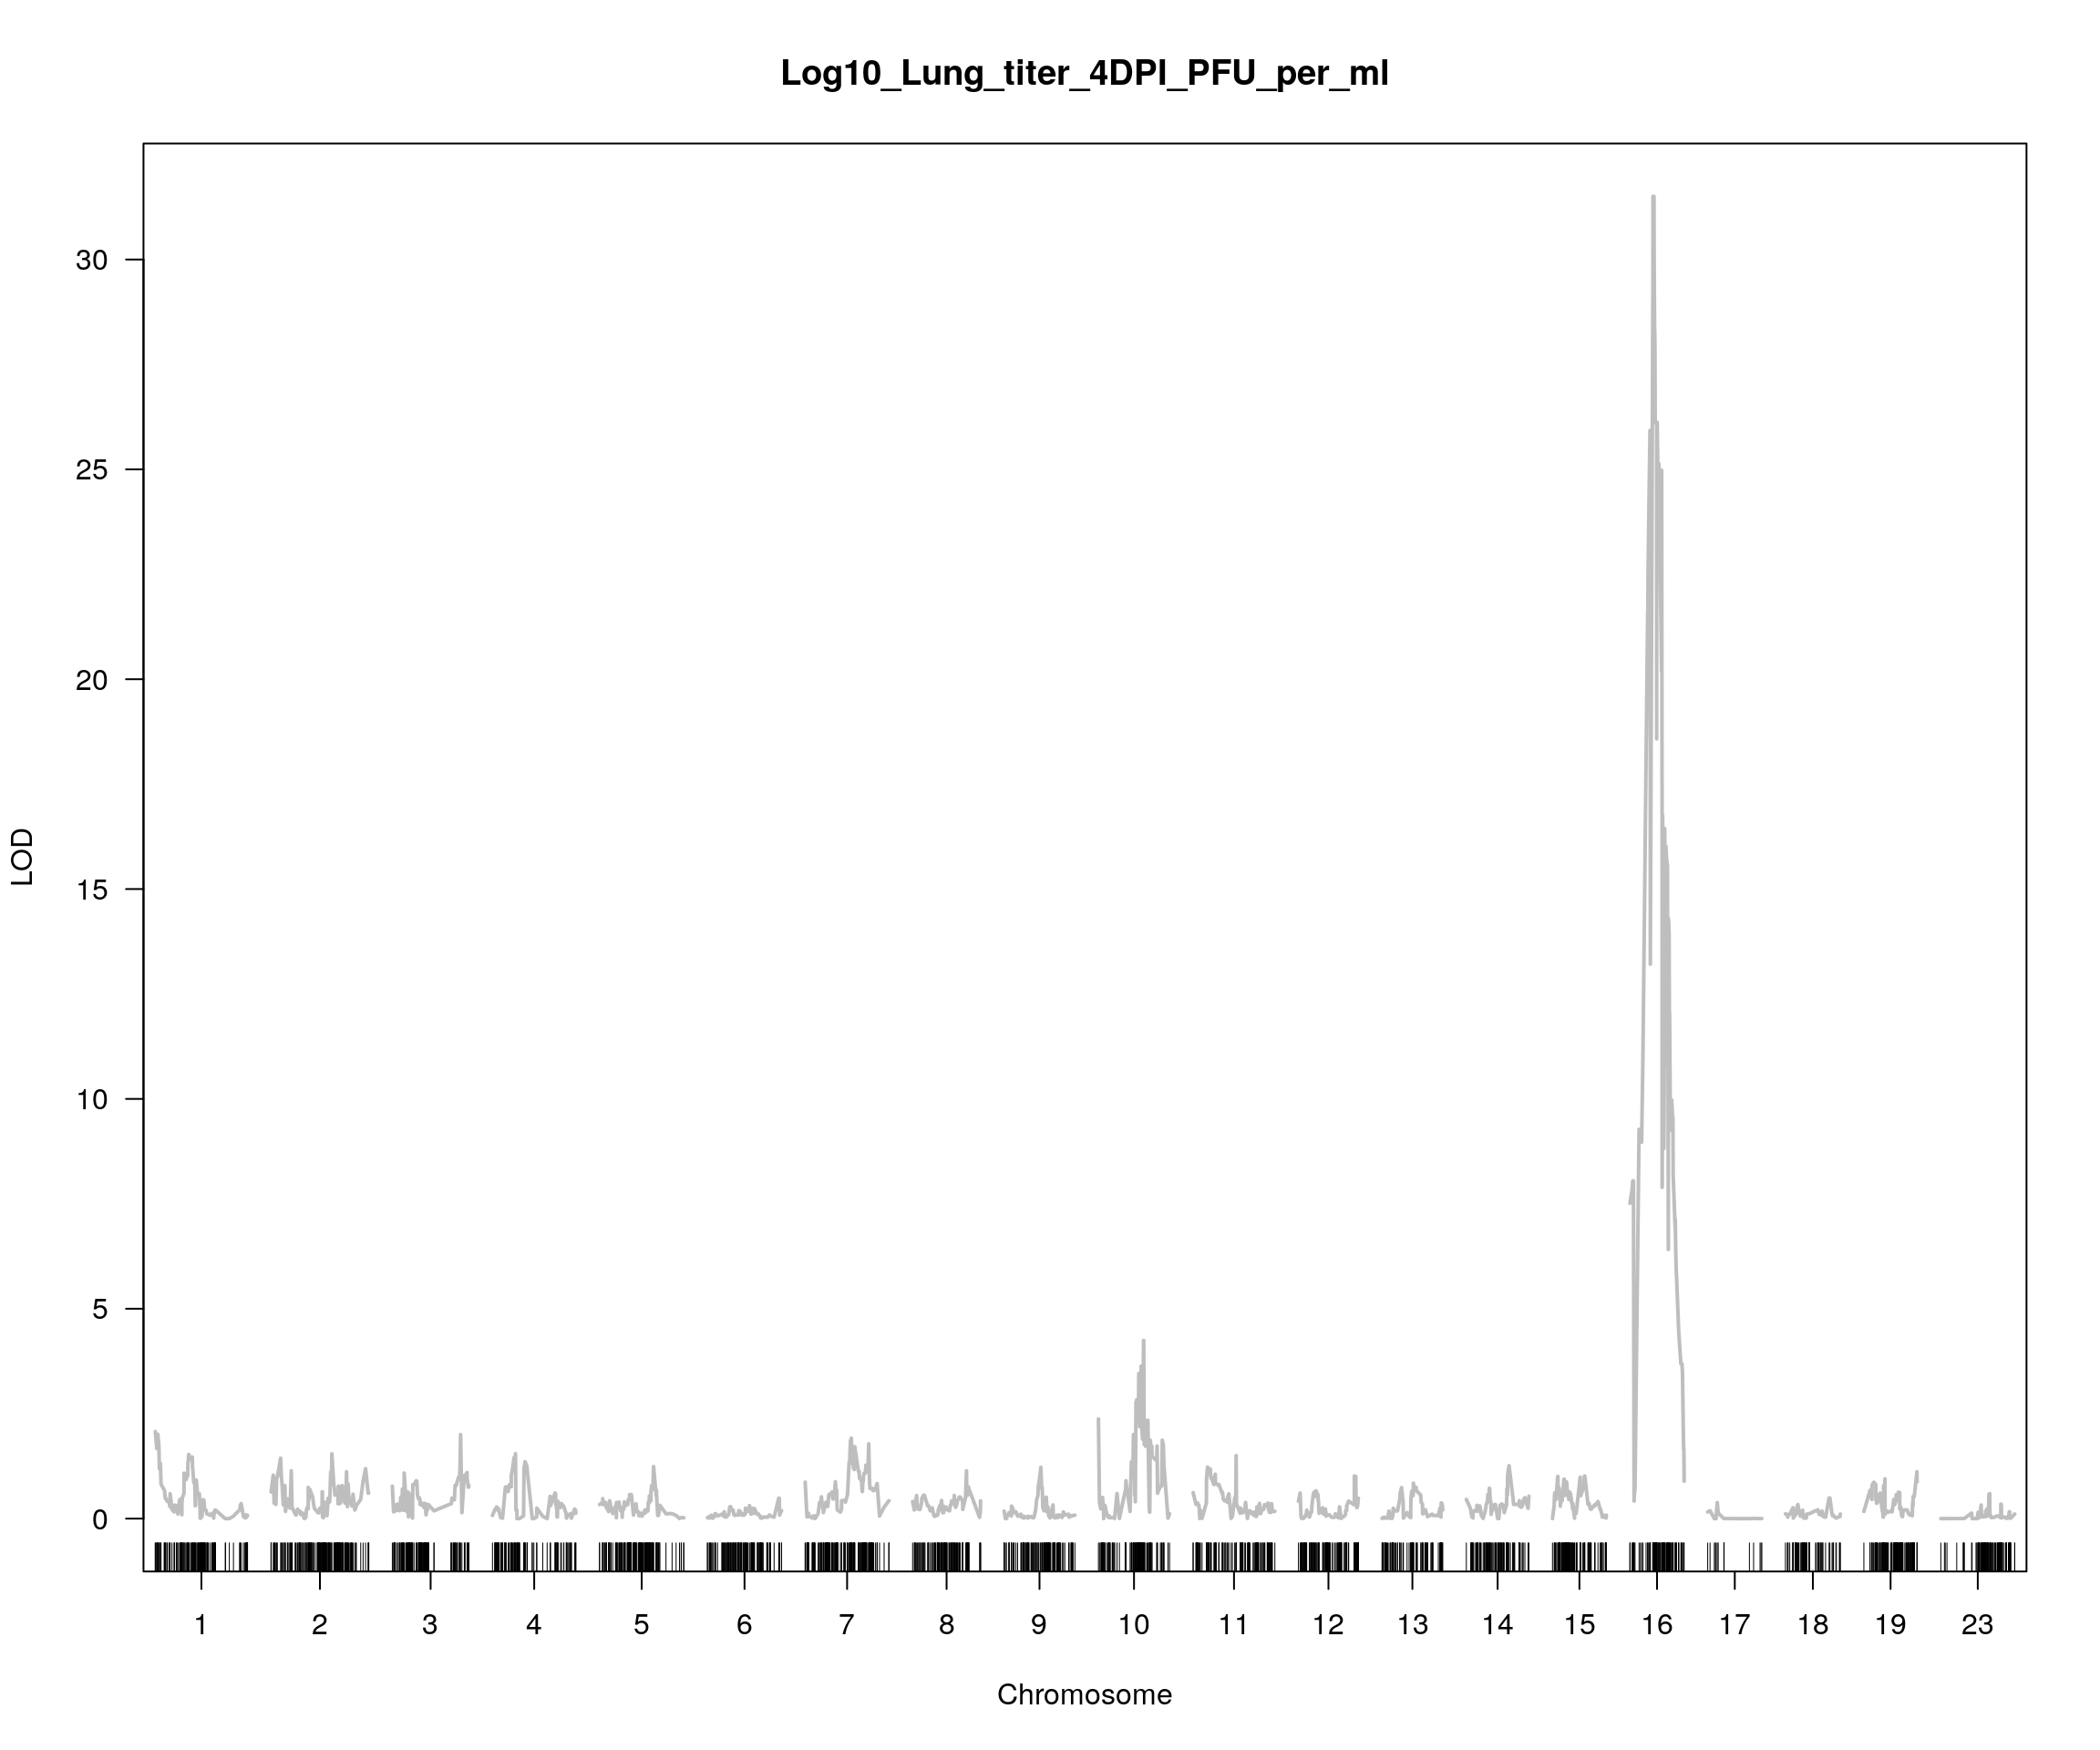
#1.5 drop interval on cM
drop_interval = find_peaks(out_1[, 3, drop = F], map = cross2$gmap, drop = 1.5, threshold = 9.2)
drop_interval
#   lodindex lodcolumn chr    pos      lod  ci_lo  ci_hi
# 1        1  lod.p.mu  16 25.536 52.56001 24.714 25.676

#chr16
plot(out_1, col = c("red"), chr = drop_interval$chr, ylab = "LOD")
plot(out_3, col = c("gray"), chr = drop_interval$chr, add = TRUE, ylab = "LOD")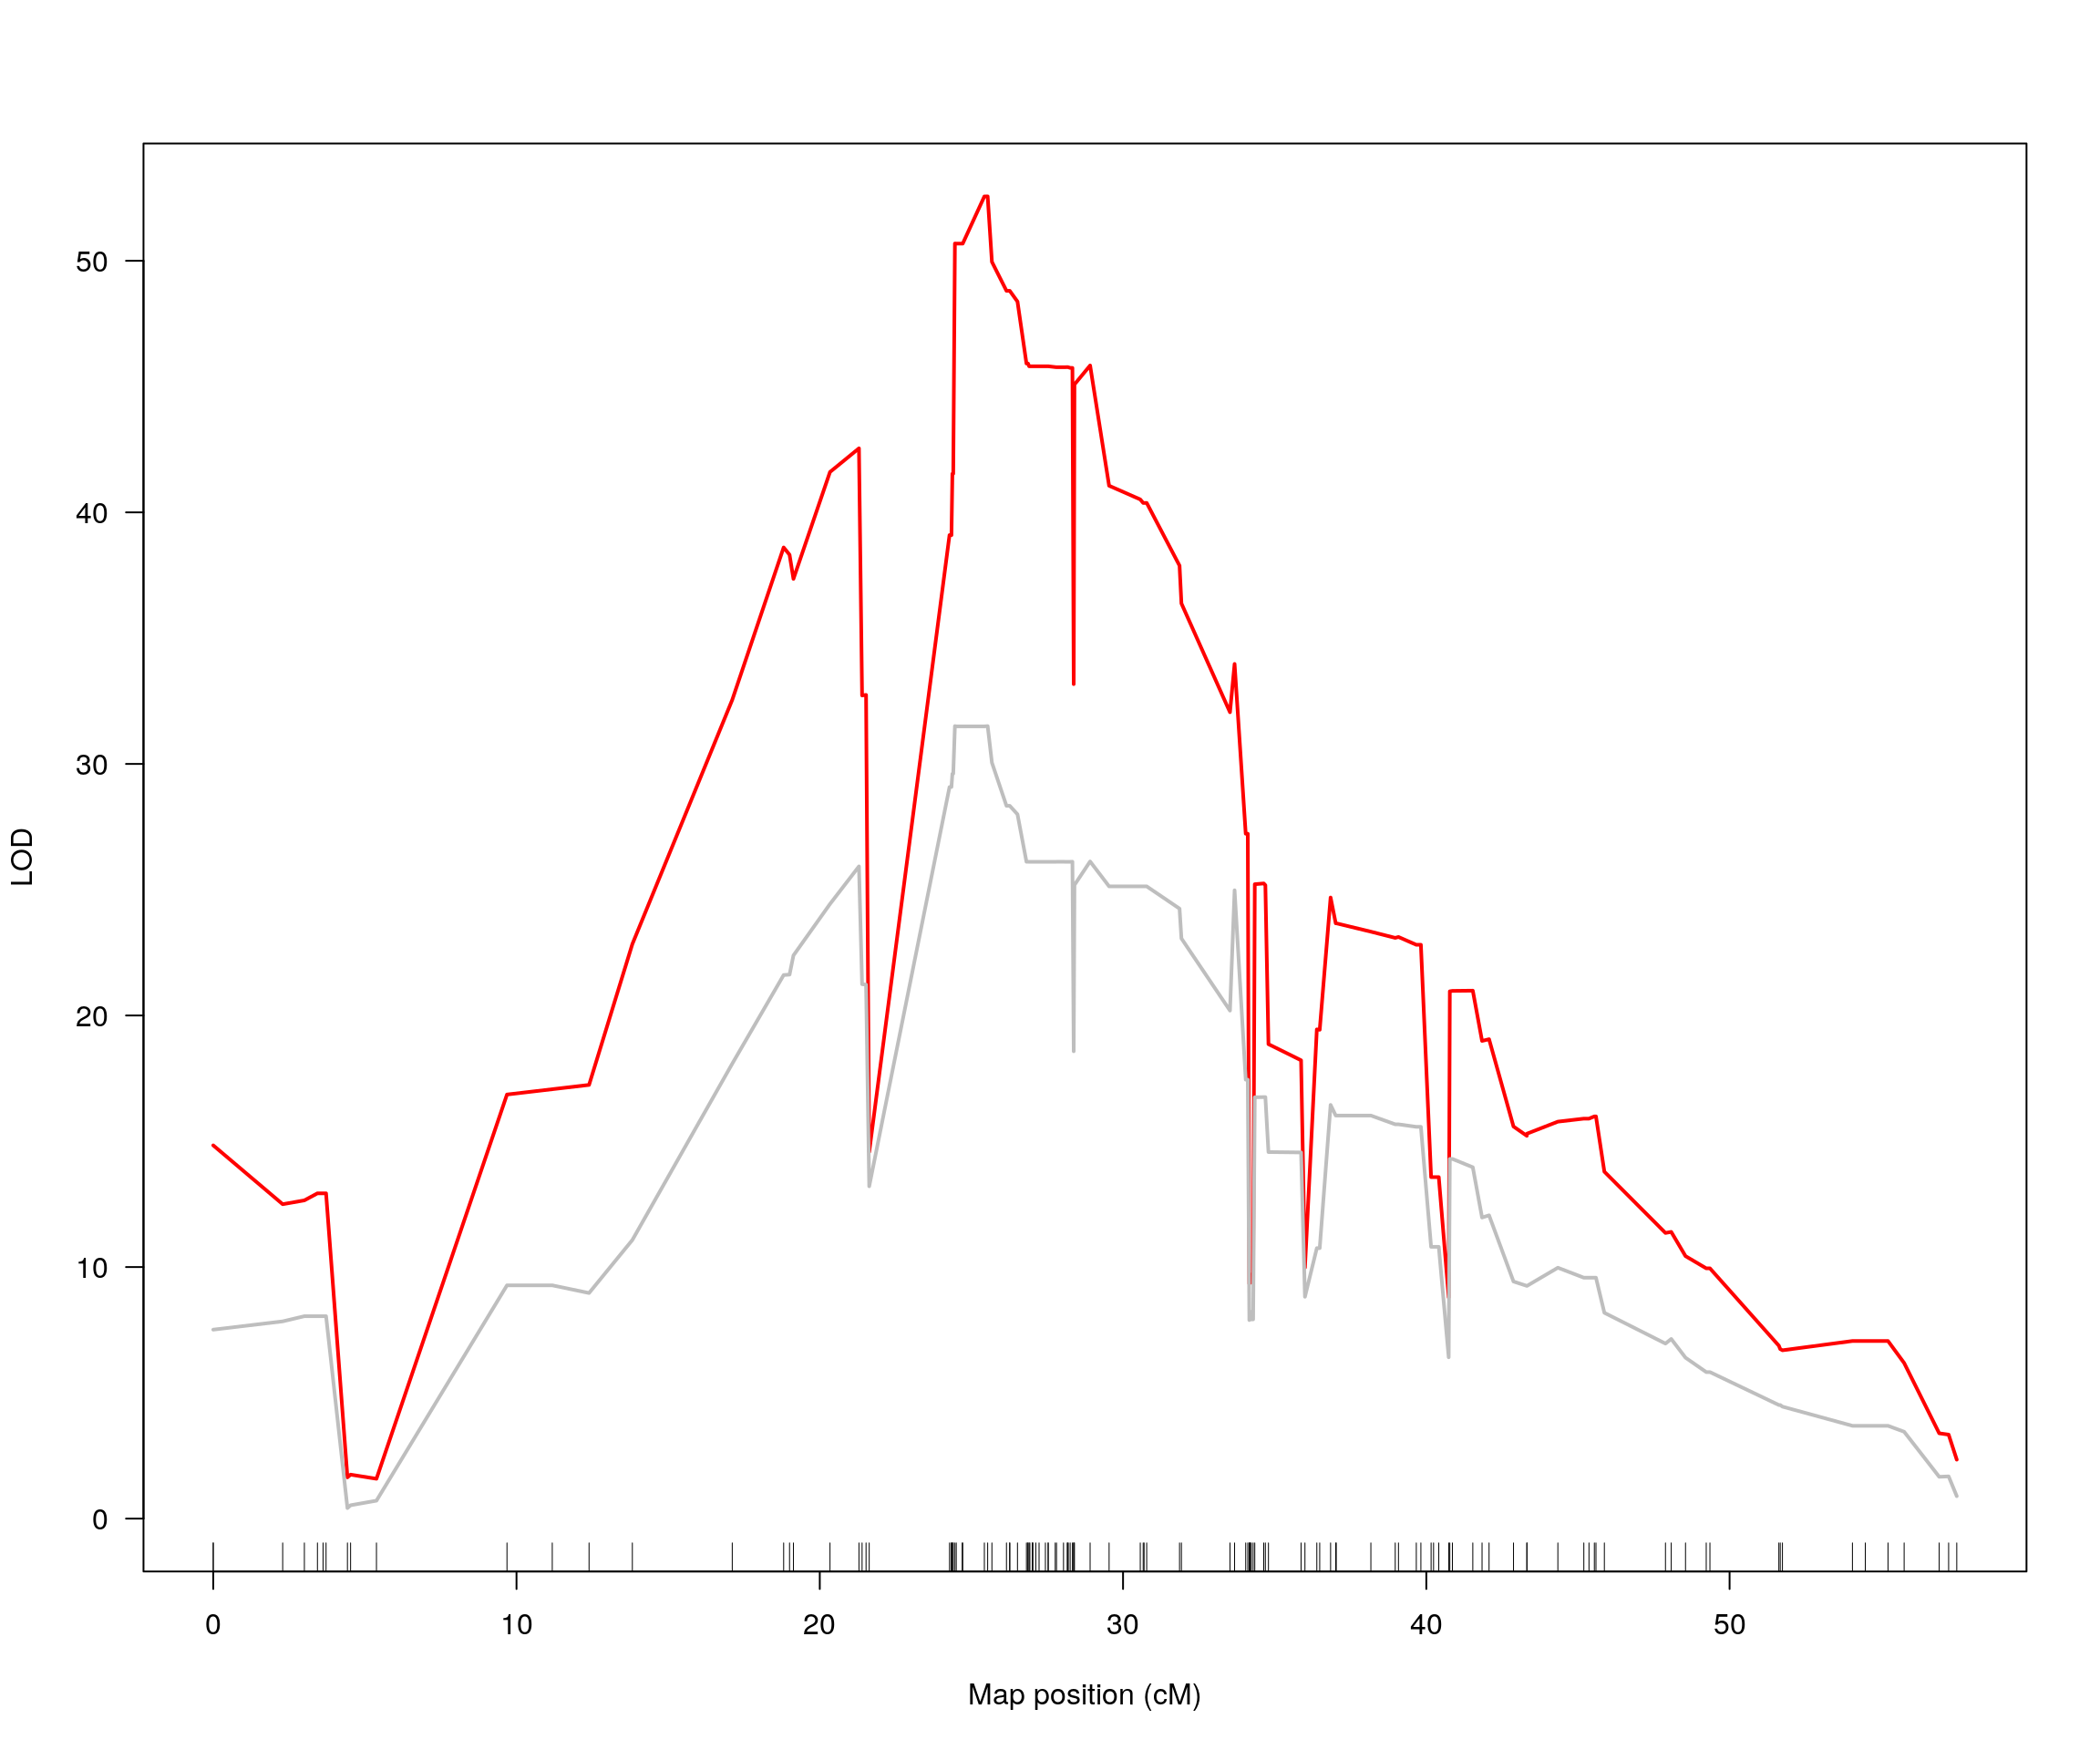
#peak
peak = lodint(out_1, chr = drop_interval$chr)
peak
#              chr    pos lod.p.mu    lod.p   lod.mu
# gUNC26636079  16 24.714 50.68370 19.18999 31.49371
# gUNCHS042457  16 25.536 52.56001 21.05561 31.49602
# UNC26651633   16 25.676 49.95863 19.90604 30.52492
#peak marker
marker = rownames(peak)[which.max(peak$lod.p.mu)]
par(mar=c(3, 5, 4, 3))
plotPXG(f2_qtl, marker = marker, jitter = 0.25, pheno.col = 1, infer = F,
          main = marker, ylab = "Log10_1_Lung_titer_4DPI_PFU_per_ml",
          mgp = c(3.4,1,0))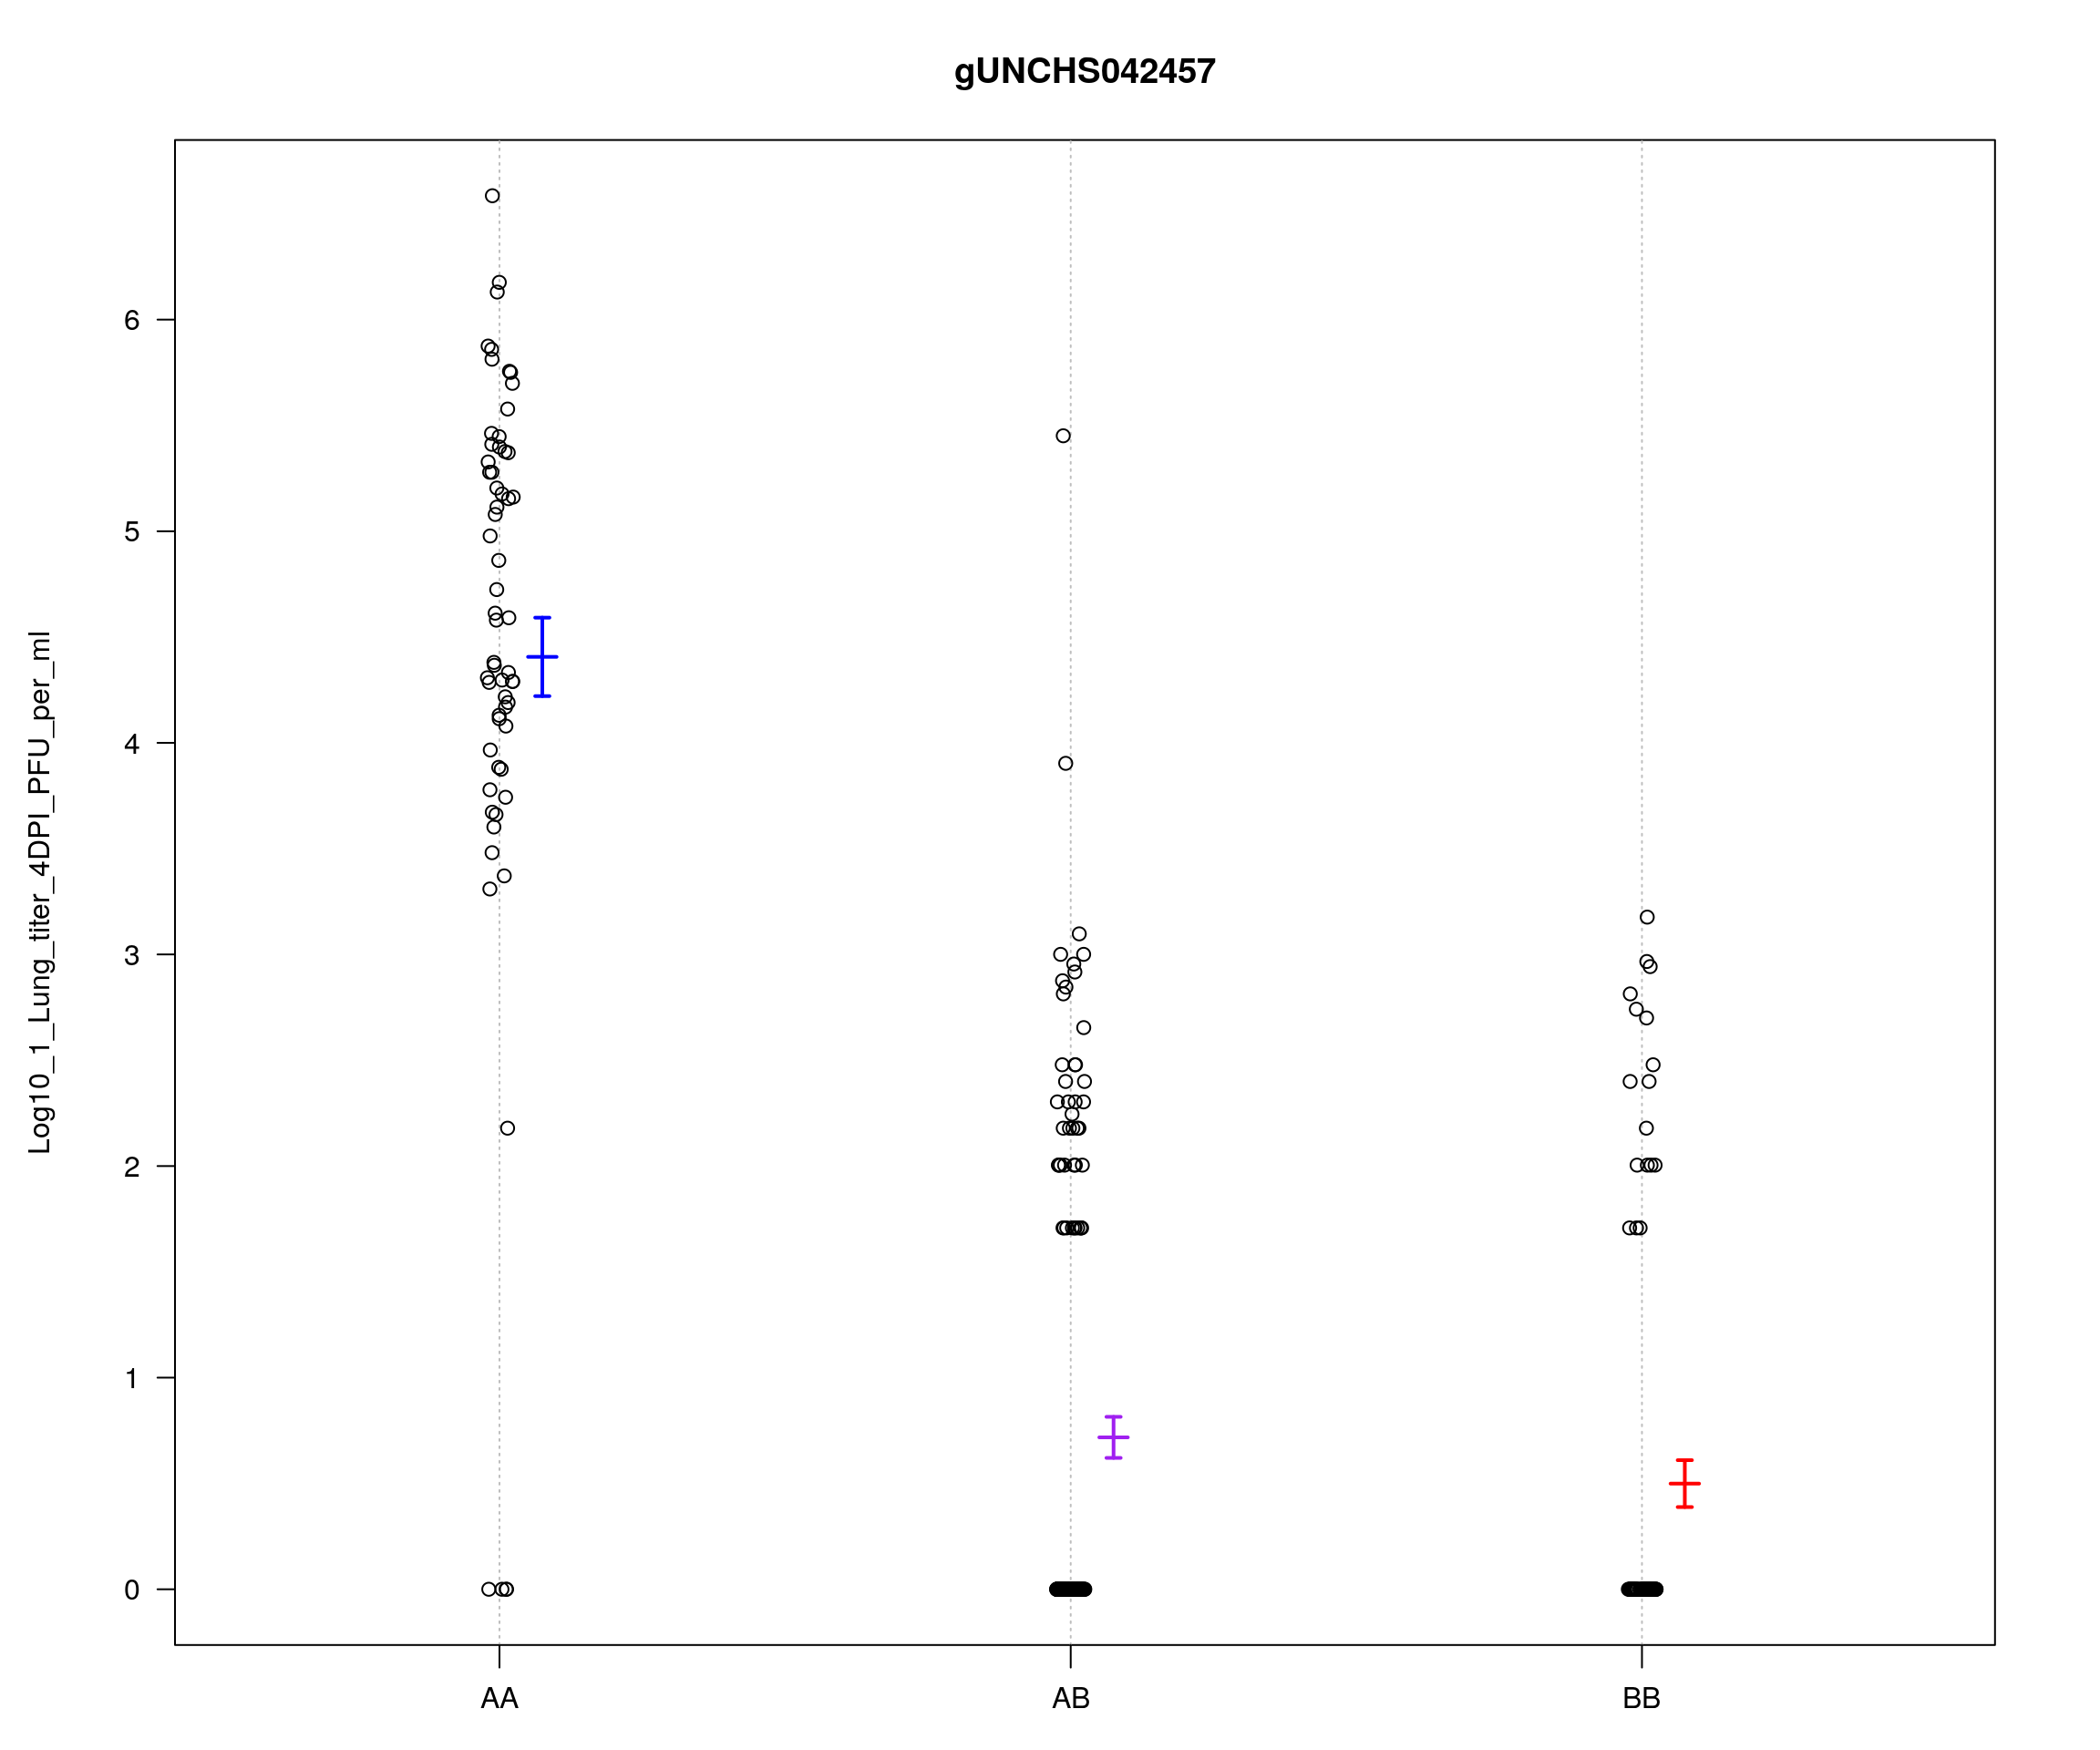
# Calculate error LOD scores
#cross <- calc.errorlod(cross, error.prob = 0.01)
#save(cross, file = "data/CC_SARS-1/cross.RData")
load("data/CC_SARS-1/cross.RData")

#chr16 1.5 drop interval on bp-----------------------------------------------------------------------
peak_bp = map[map$Chromosome == drop_interval$chr & map$cM_cox == drop_interval$pos & !is.na(map$cM_cox), "bp"]/10^6
peak_bp
# [1] 36.35104

start = map[map$Chromosome == drop_interval$chr & map$cM_cox == drop_interval$ci_lo & !is.na(map$cM_cox), "bp"]/10^6
start
# [1] 35.15812
end   = map[map$Chromosome == drop_interval$chr & map$cM_cox == drop_interval$ci_hi & !is.na(map$cM_cox), "bp"]/10^6
end
# [1] 36.57991
#genes in the qtl region
query_variants <- create_variant_query_func("data/cc_variants.sqlite")
query_genes <- create_gene_query_func("data/mouse_genes_mgi.sqlite")
chr16_gene <- query_genes(chr = 16, start, end)

#add bp
out_1_bp <- out_1 %>%
  rownames_to_column(.) %>%
  left_join(minimuga[, c(1,3,4)], by = c("rowname" = "marker")) %>%
  dplyr::mutate(pos = bp_mm10/10^6) %>%
  column_to_rownames()
class(out_1_bp) <- c("scanone","data.frame")

#plot
layout(mat = matrix(c(1:2),
                    nrow = 2,
                    ncol = 1),
       heights = c(1, 2))    # Heights of the two rows
# Plot 1
par(mar = c(0.01, 5, 2, 0.5))
#Create the base plot
plot(out_1_bp, col = c("red"), chr = 16, main = "CC_SARS Chr16 QTL interval", xlab = "", ylab = "LOD", xlim = c(start, end), ylim = c(0, 60))
text(peak_bp, 55, paste0(drop_interval$chr, "@", drop_interval$pos, "cM"), cex = 0.75)
segments(x0 = peak_bp,
         x1 = peak_bp,
         y0 = 0,
         y1 = drop_interval$lod,
         col="black", lty=2, lwd=1)
# Plot 2
par(mar = c(5.10, 5, 0, 0.5))
plot_genes(chr16_gene, bgcolor="white", xlim = c(start, end))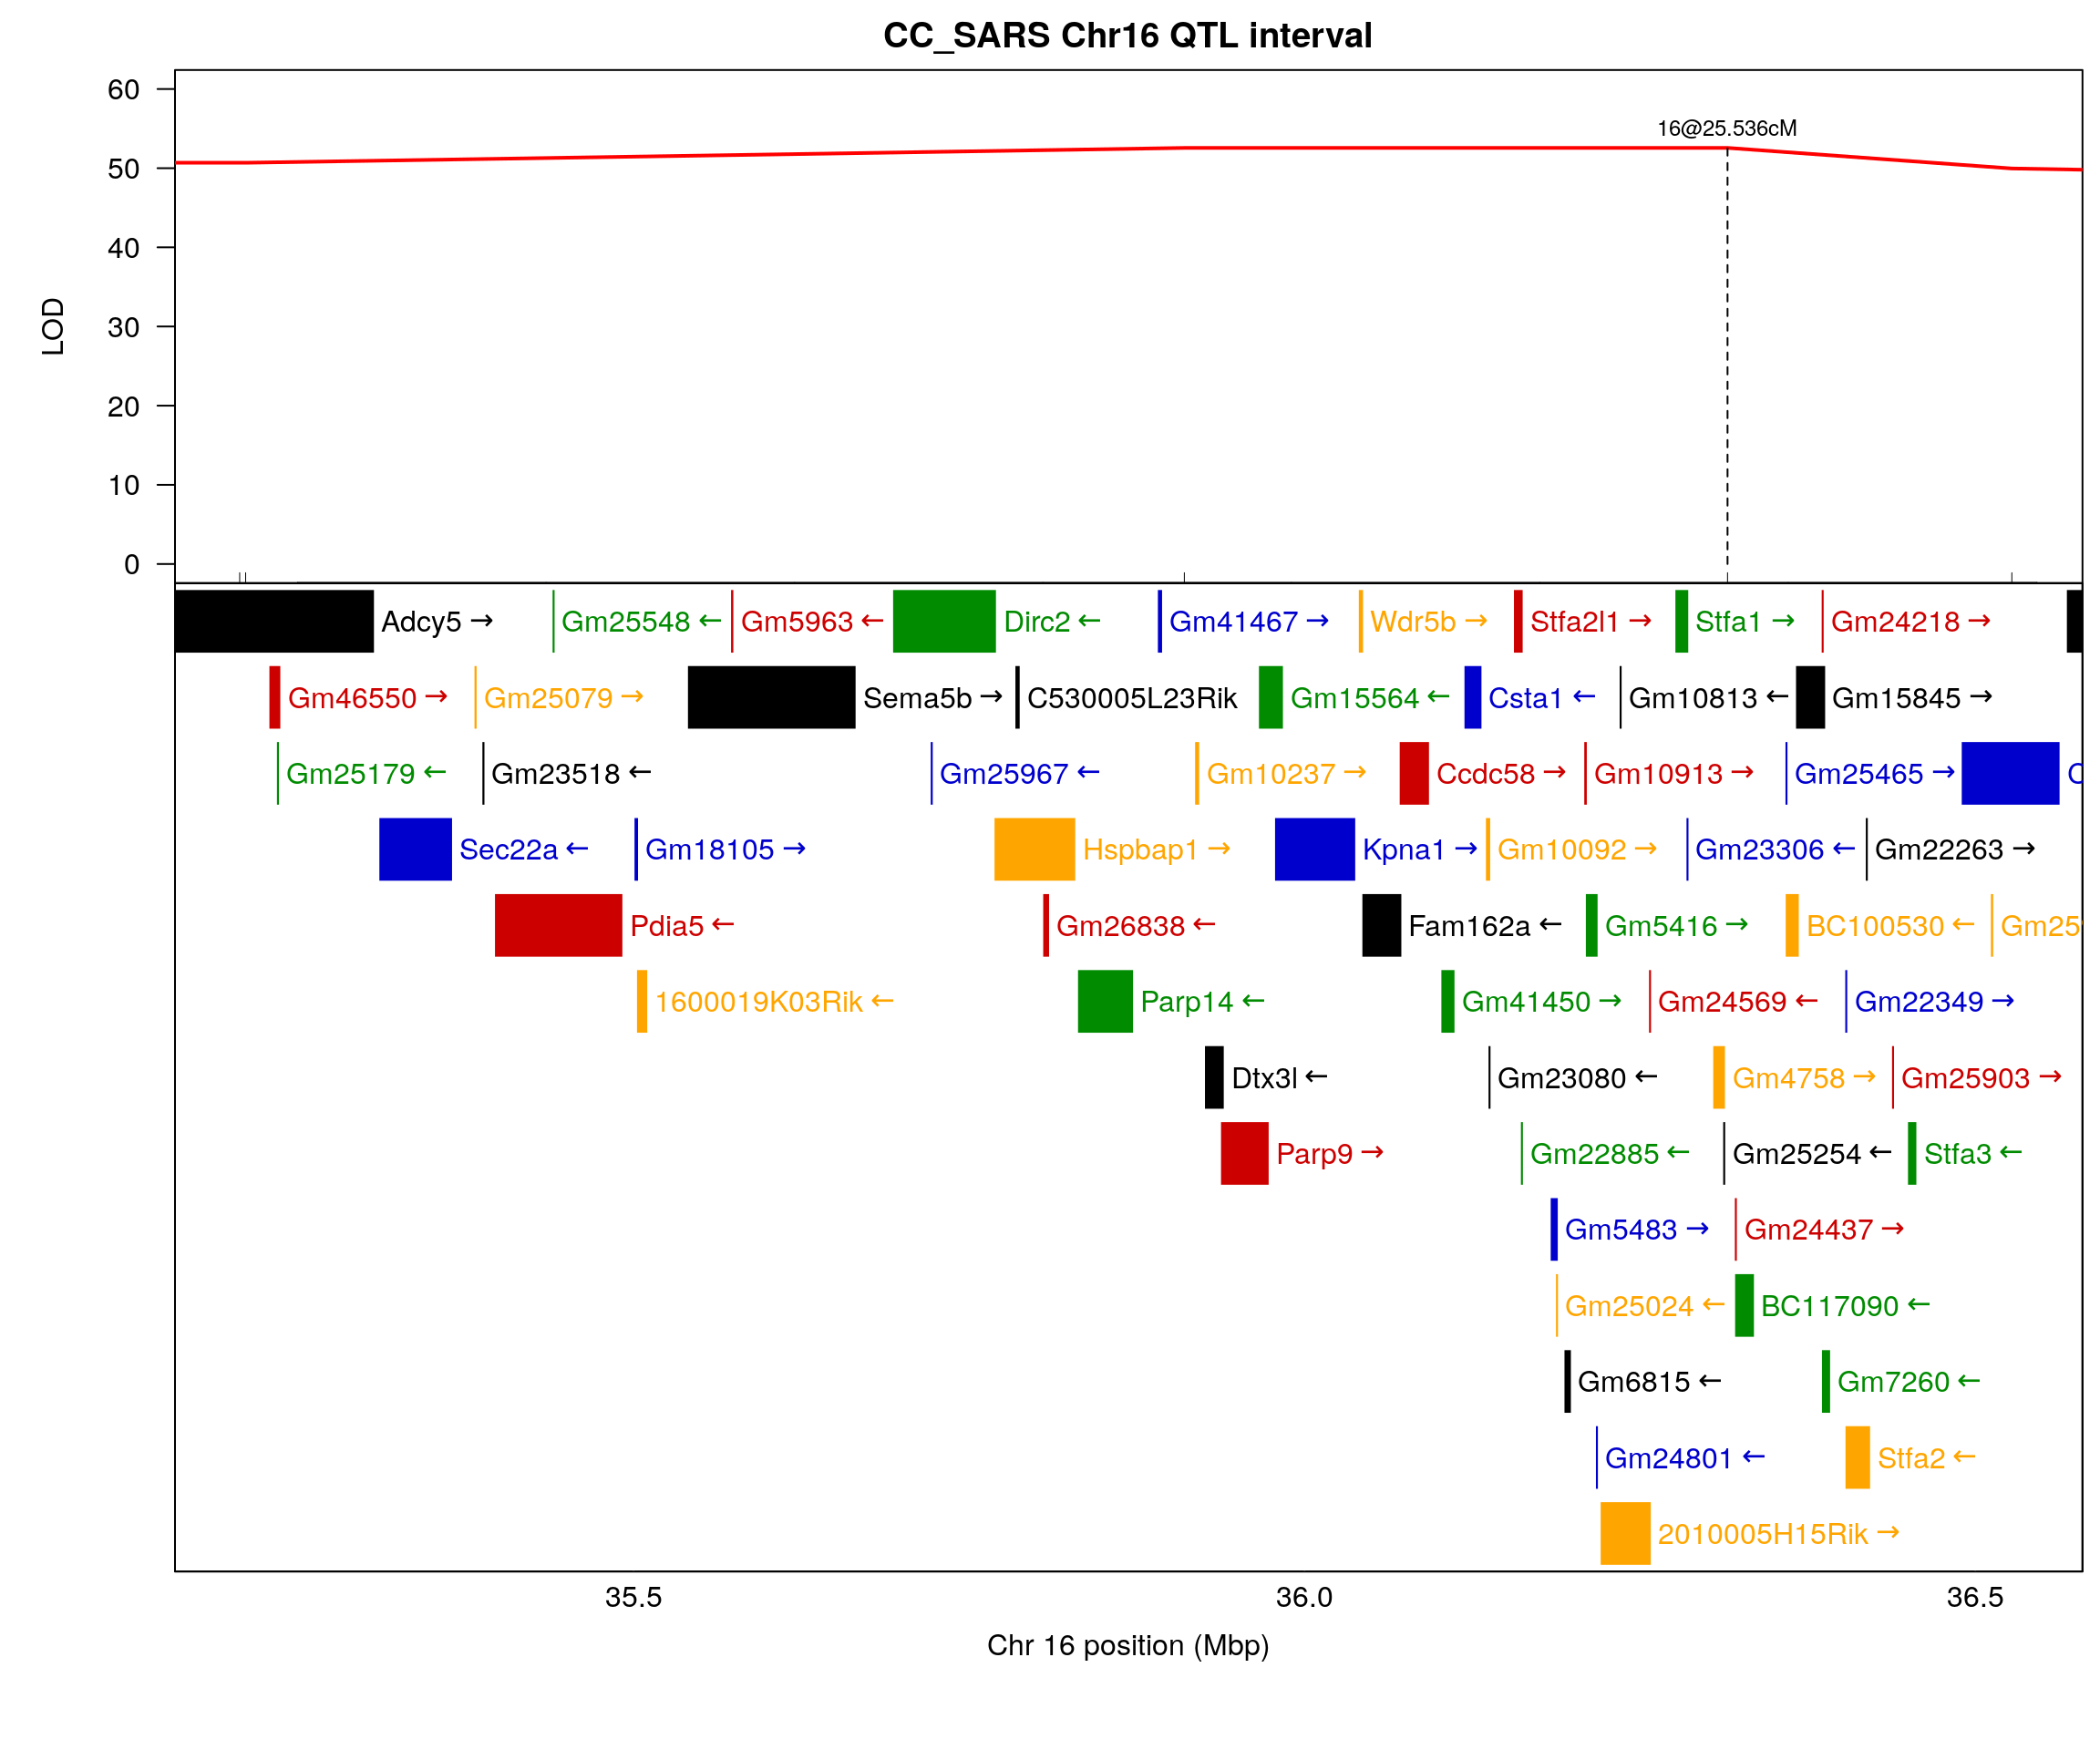
#save plot
pdf(file = "data/CC_SARS-1/CC_SARS_Chr16_QTL_interval.pdf", width = 6, height = 6)
#plot
layout(mat = matrix(c(1:2),
                    nrow = 2,
                    ncol = 1),
       heights = c(1, 2))    # Heights of the two rows
# Plot 1
par(mar = c(0.01, 5, 2, 0.5))
#Create the base plot
plot(out_1_bp, col = c("red"), chr = 16, main = "CC_SARS Chr16 QTL interval", xlab = "", ylab = "LOD", xlim = c(start, end), ylim = c(0, 60))
text(peak_bp, 55, paste0(drop_interval$chr, "@", drop_interval$pos, "cM"), cex = 0.75)
segments(x0 = peak_bp,
         x1 = peak_bp,
         y0 = 0,
         y1 = drop_interval$lod,
         col="black", lty=2, lwd=1)
# Plot 2
par(mar = c(5.10, 5, 0, 0.5))
plot_genes(chr16_gene, bgcolor="white", xlim = c(start, end))
dev.off()
# png
#   2

#B10160031421 16@21.63
#gUNCHS042457 16@25.536
#gUNC26706586 16@28.373
#gUNC26899499 16@34.29
#mUNC26936620 16@35.998
#S6J162881072 16@40.738
# plot genotype data, flagging genotypes with error LOD > cutoff
#sort the pheno to have top and bottom individuals
top_ind <- cross$pheno %>%
  rownames_to_column(var = "id") %>%
  slice_max(., Pheno, n = 10) %>%
  pull(id)

bottom_ind <- cross$pheno %>%
  rownames_to_column(var = "id") %>%
  slice_min(., Pheno, n = 10, with_ties = FALSE) %>%
  pull(id)

pheno_ind <- cross$pheno[c(top_ind, bottom_ind), ]
#save plot
png(file = "data/CC_SARS-1/CC_SARS_Chr16_plotGeno.png", width = 800, height = 600)
par(mar = c(5, 3, 6, 6))
plotGeno(cross, chr = 16, ind = as.numeric(c(top_ind, bottom_ind)), xlim = c(0, 50), main = "")
par(las = 2)
axis(side = 4, at= 1:20, labels =  paste0(rownames(pheno_ind), " | ", round(pheno_ind$Pheno,3)))
#add horizontal line at y=20
abline(v = c(21.63, 25.536, 28.373, 34.29, 35.998, 40.738), col = c("red"), lty = c(2, 1, rep(2,4)), lwd = c(1))
xtick <- c(21.63, 25.536, 28.373, 34.29, 35.998, 40.738)
labels <- paste0(c("B10160031421", "gUNCHS042457", "gUNC26706586", "gUNC26899499", "mUNC26936620", "S6J162881072"))
axis(side = 3, at = xtick, labels = FALSE)
text(x = xtick-0.05,  par("usr")[1],
     labels = labels, srt = 90, pos = 1, xpd = TRUE, offset = 0.2, cex = 0.7)
dev.off()
# png
#   2

#knitr::include_graphics("output/CC_SARS_Chr16_plotGeno.png")

#save plot
pdf(file = "data/CC_SARS-1/CC_SARS_Chr16_plotGeno.pdf", width = 12, height = 10)
par(mar = c(5, 3, 6, 6))
plotGeno(cross, chr = 16, ind = as.numeric(c(top_ind, bottom_ind)), xlim = c(0, 50), main = "")
par(las = 2)
axis(side = 4, at= 1:20, labels =  paste0(rownames(pheno_ind), " | ", round(pheno_ind$Pheno,3)))
#add horizontal line at y=20
abline(v = c(21.63, 25.536, 28.373, 34.29, 35.998, 40.738), col = c("red"), lty = c(2, 1, rep(2,4)), lwd = c(1))
xtick <- c(21.63, 25.536, 28.373, 34.29, 35.998, 40.738)
labels <- paste0(c("B10160031421", "gUNCHS042457", "gUNC26706586", "gUNC26899499", "mUNC26936620", "S6J162881072"))
axis(side = 3, at = xtick, labels = FALSE)
text(x = xtick-0.05,  par("usr")[1],
     labels = labels, srt = 90, pos = 1, xpd = TRUE, offset = 0.2, cex = 0.7)
dev.off()
# png
#   2

#par(mar = c(5, 3, 6, 6))
plotGeno(cross, chr = 16, ind = as.numeric(c(top_ind, bottom_ind)), xlim = c(0, 50), main = "")
par(las = 2)
axis(side = 4, at= 1:20, labels =  paste0(rownames(pheno_ind), " | ", round(pheno_ind$Pheno,3)))
#add horizontal line at y=20
abline(v = c(21.63, 25.536, 28.373, 34.29, 35.998, 40.738), col = c("red"), lty = c(2, 1, rep(2,4)), lwd = c(1))
xtick <- c(21.63, 25.536, 28.373, 34.29, 35.998, 40.738)
labels <- paste0(c("B10160031421", "gUNCHS042457", "gUNC26706586", "gUNC26899499", "mUNC26936620", "S6J162881072"))
axis(side = 3, at = xtick, labels = FALSE)
text(x = xtick-0.05,  par("usr")[1],
     labels = labels, srt = 90, pos = 1, xpd = TRUE, offset = 0.2, cex = 0.7)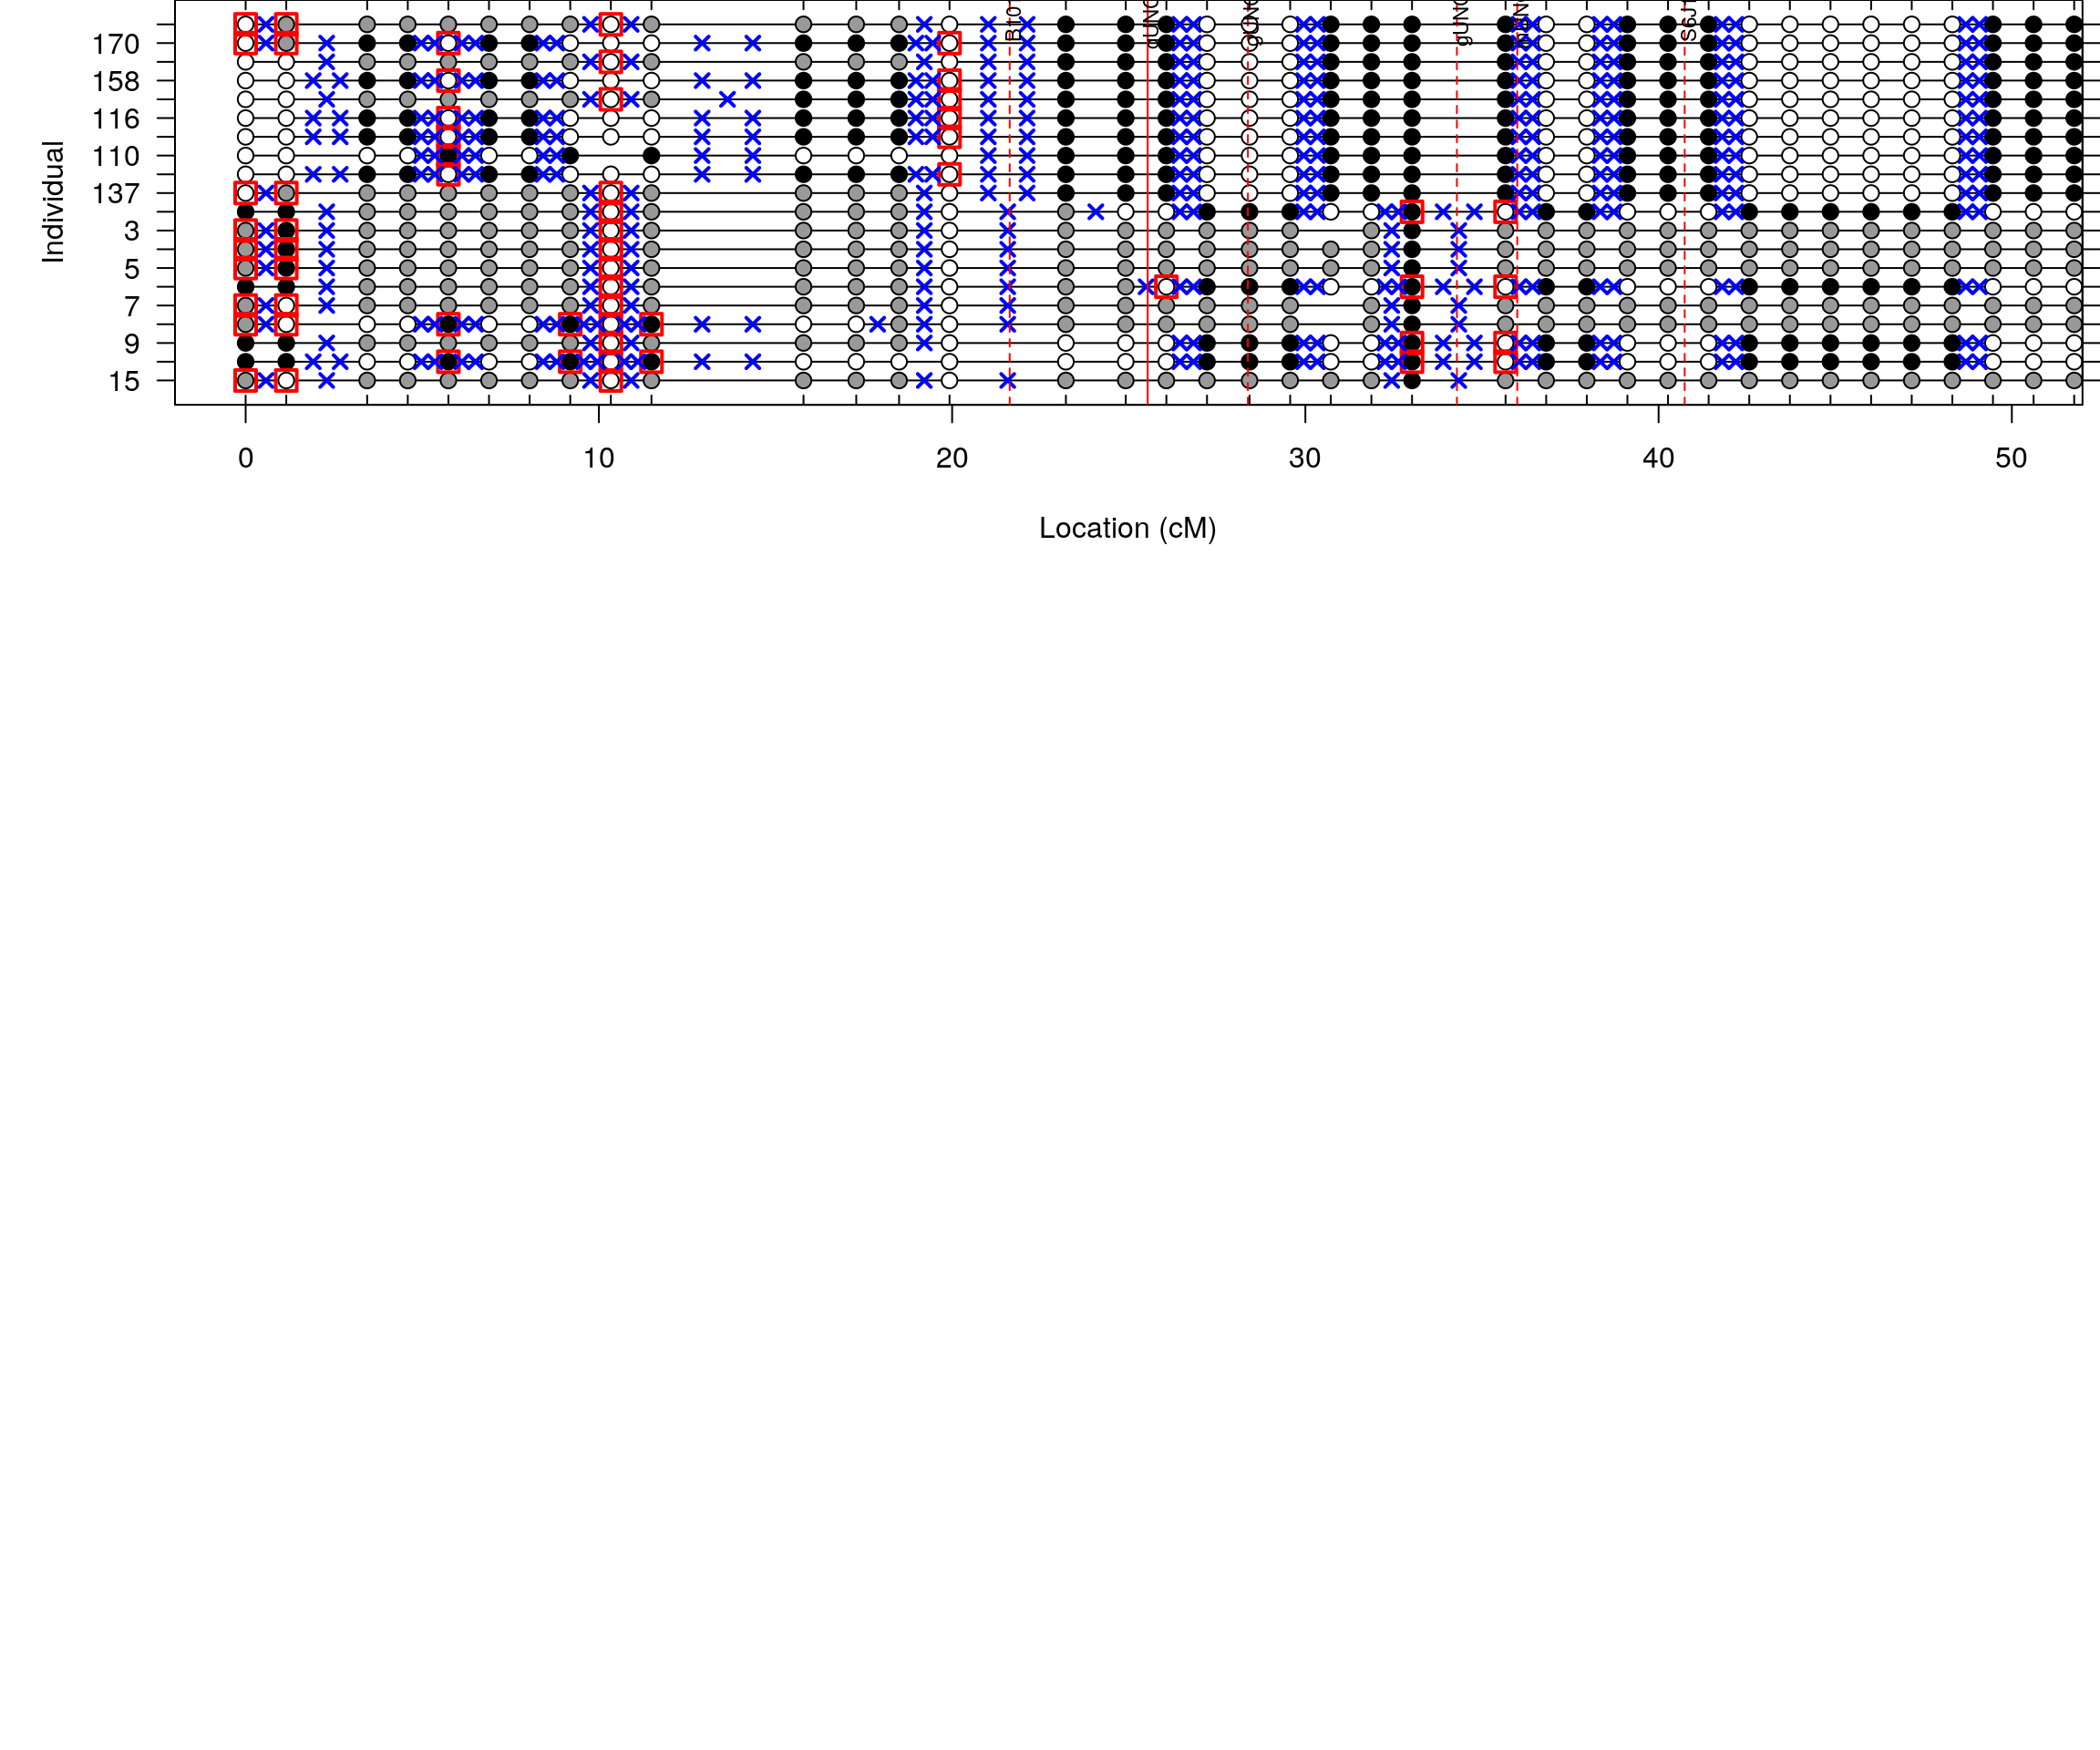
Interactive qtl plot
#interactive qtl plot
iplotScanone(out_1, f2_qtl,chr = drop_interval$chr)
snp annotation
snp.list <- read.csv("data/CC_SARS-1/20000 to MVAR.csv", header = TRUE)

# view the available databases GRCm38
listEnsembl(version = 102)
#         biomart                version
# 1         genes      Ensembl Genes 102
# 2 mouse_strains      Mouse strains 102
# 3          snps  Ensembl Variation 102
# 4    regulation Ensembl Regulation 102
## set up connection to ensembl database
ensembl <- useEnsembl(biomart = "snps", version=102)

# serach the available datasets (species)
searchDatasets(mart = ensembl, pattern = "Mouse")
#                dataset
# 20       mmusculus_snp
# 21 mmusculus_structvar
#                                                                      description
# 20 Mouse Short Variants (SNPs and indels excluding flagged variants) (GRCm38.p6)
# 21                                         Mouse Structural Variants (GRCm38.p6)
#      version
# 20 GRCm38.p6
# 21 GRCm38.p6

ensembl <- useEnsembl(biomart = 'snps',
                      dataset = c('mmusculus_snp'),
                      version = 102)

# check the available "filters" - things you can filter for
ensembl_filters  <- listFilters(ensembl)
ensembl_attributes <- listAttributes(ensembl)

# To find the correct name for the Ensembl ID we can filter the name column
# Set the filter type and values
ourFilterType <- "snp_filter"

# get the Ensembl IDs from our results table
filterValues <- na.omit(snp.list$rs)

# Set the list of attributes
attributeNames <- c("refsnp_source",'refsnp_id',
                    "chr_name",
                    "chrom_start",
                    "consequence_type_tv",
                    "ensembl_gene_stable_id"
                    )

# run the query
annot_snp <- getBM(attributes=attributeNames, filters = ourFilterType, values = filterValues,
               mart = ensembl)

#annotation gene
ensembl <- useEnsembl(biomart = 'genes',
                      dataset = 'mmusculus_gene_ensembl',
                      version = 102)
annot_gene <- getBM(attributes=c("ensembl_gene_id",
                                 "external_gene_name"),
                    filters = "ensembl_gene_id",
                    values = unique(na.omit(annot_snp$ensembl_gene_stable_id)),
                    mart = ensembl)

annot_snp = annot_snp %>%
  left_join(annot_gene, by = c("ensembl_gene_stable_id" = "ensembl_gene_id")) %>%
  tidyr::unite("consequence_type_tv|gene_name",
               c("consequence_type_tv", "external_gene_name"), sep = "|")


snp.list.annot <- left_join(snp.list, annot_snp, by = c("rs" = "refsnp_id"))


#display snp.list.annot
DT::datatable(snp.list.annot[, c(-10:-12)], filter = list(position = 'top', clear = FALSE),
              extensions = 'Buttons', options = list(dom = 'Bfrtip',
                                                     buttons = c('csv', 'excel'),
                                                     pageLength = 40,
                                                     scrollY = "300px",
                                                     scrollX = "40px"))
# Warning in instance$preRenderHook(instance): It seems your data is too big
# for client-side DataTables. You may consider server-side processing: https://
# rstudio.github.io/DT/server.html
QTL mapping on DPI
dpi_out <- scanone(f2_qtl, pheno.col = 3:11, addcovar = covars, n.cluster = 20)
save(dpi_out, file = "data/CC_SARS-1/dpi_out.RData")
dpi_operm <- scanone(f2_qtl, pheno.col = 3:11, addcovar = covars, n.cluster = 20, n.perm = 1000)
#  -Running permutations via a cluster of 20 nodes.
save(dpi_operm, file = "data/CC_SARS-1/dpi_operm.RData")
load("data/CC_SARS-1/dpi_out.RData")
load("data/CC_SARS-1/dpi_operm.RData")
load("data/CC_SARS-1/cross.RData")
query_variants <- create_variant_query_func("data/cc_variants.sqlite")
query_genes <- create_gene_query_func("data/mouse_genes_mgi.sqlite")
variants <- list()
for(i in 1:9){
  print(paste0("pheno = ", i))
  plot(dpi_out, lodcolumn = i, col = c("blue"), ylim = c(0, max(max(dpi_out[, i + 2]),
                                                                summary(dpi_operm[,i], alpha=c(0.05))[[1]])))
  add.threshold(dpi_out, lodcolumn = i, perms = dpi_operm, alpha = 0.05, col="red")
  #1.5 drop interval on cM
  drop_interval = find_peaks(dpi_out[,i+2, drop=F], map = cross2$gmap, drop = 1.5, threshold =
                               summary(dpi_operm[,i], alpha=c(0.05))[[1]])
  print(drop_interval)
  if(nrow(drop_interval) != 0){
    for(j in 1:nrow(drop_interval)){
      print(paste0("row = ", j))
      chr = drop_interval[j, "chr"]
      pos = drop_interval[j, "pos"]
      ci_lo = drop_interval[j, "ci_lo"]
      ci_hi = drop_interval[j, "ci_hi"]
      lod = drop_interval[j, "lod"]
      # 1.5 drop interval on bp
      peak_bp = map[map$Chromosome == chr & map$cM_cox == pos & !is.na(map$cM_cox), "bp"]/10^6
      start = unique(map[map$Chromosome == chr & map$cM_cox == ci_lo & !is.na(map$cM_cox), "bp"]/10^6)
      end   = unique(map[map$Chromosome == chr & map$cM_cox == ci_hi & !is.na(map$cM_cox), "bp"]/10^6)
      #genes in the qtl region
      chr_gene <- query_genes(chr, start, end)
      snp <- query_variants(chr, start, end)
      variants[[i]] <- snp %>%
        dplyr::mutate(Pheno = colnames(dpi_out)[[i+2]], .before = 1)

      # #add bp
      # out_bp <- dpi_out[, c(1,2,i+2)] %>%
      #   rownames_to_column(.) %>%
      #   left_join(minimuga[, c(1,3,4)], by = c("rowname" = "marker")) %>%
      #   dplyr::mutate(pos = bp_mm10/10^6) %>%
      #   column_to_rownames()
      # class(out_bp) <- c("scanone","data.frame")

      #plot
      # if((ci_hi - ci_lo) < 30){
      #   layout(mat = matrix(c(1:2),
      #                       nrow = 2,
      #                       ncol = 1),
      #          heights = c(1, 2))    # Heights of the two rows
      #   # Plot 1
      #   par(mar = c(0.01, 5, 2, 0.5))
      #   #Create the base plot
      #   plot(out_bp, col = c("red"), chr = chr, main = paste0("CC_SARS Chr", chr, " QTL interval"), xlab = "", ylab = "LOD", xlim = c(start, end), ylim = c(0, max(max(dpi_out[, i + 2]),
      #                                                                                                                                                              summary(dpi_operm[,i], alpha=c(0.05))[[1]])))
      #   text(peak_bp, peak_bp-5, paste0(chr, "@", pos, "cM"), cex = 0.75)
      #   segments(x0 = peak_bp,
      #            x1 = peak_bp,
      #            y0 = 0,
      #            y1 = lod,
      #            col="black", lty=2, lwd=1)
      #   # Plot 2
      #   par(mar = c(5.10, 5, 0, 0.5))
      #   plot_genes(chr_gene, bgcolor="white", xlim = c(start, end))
      # }
    }
  }
}
# [1] "pheno = 1"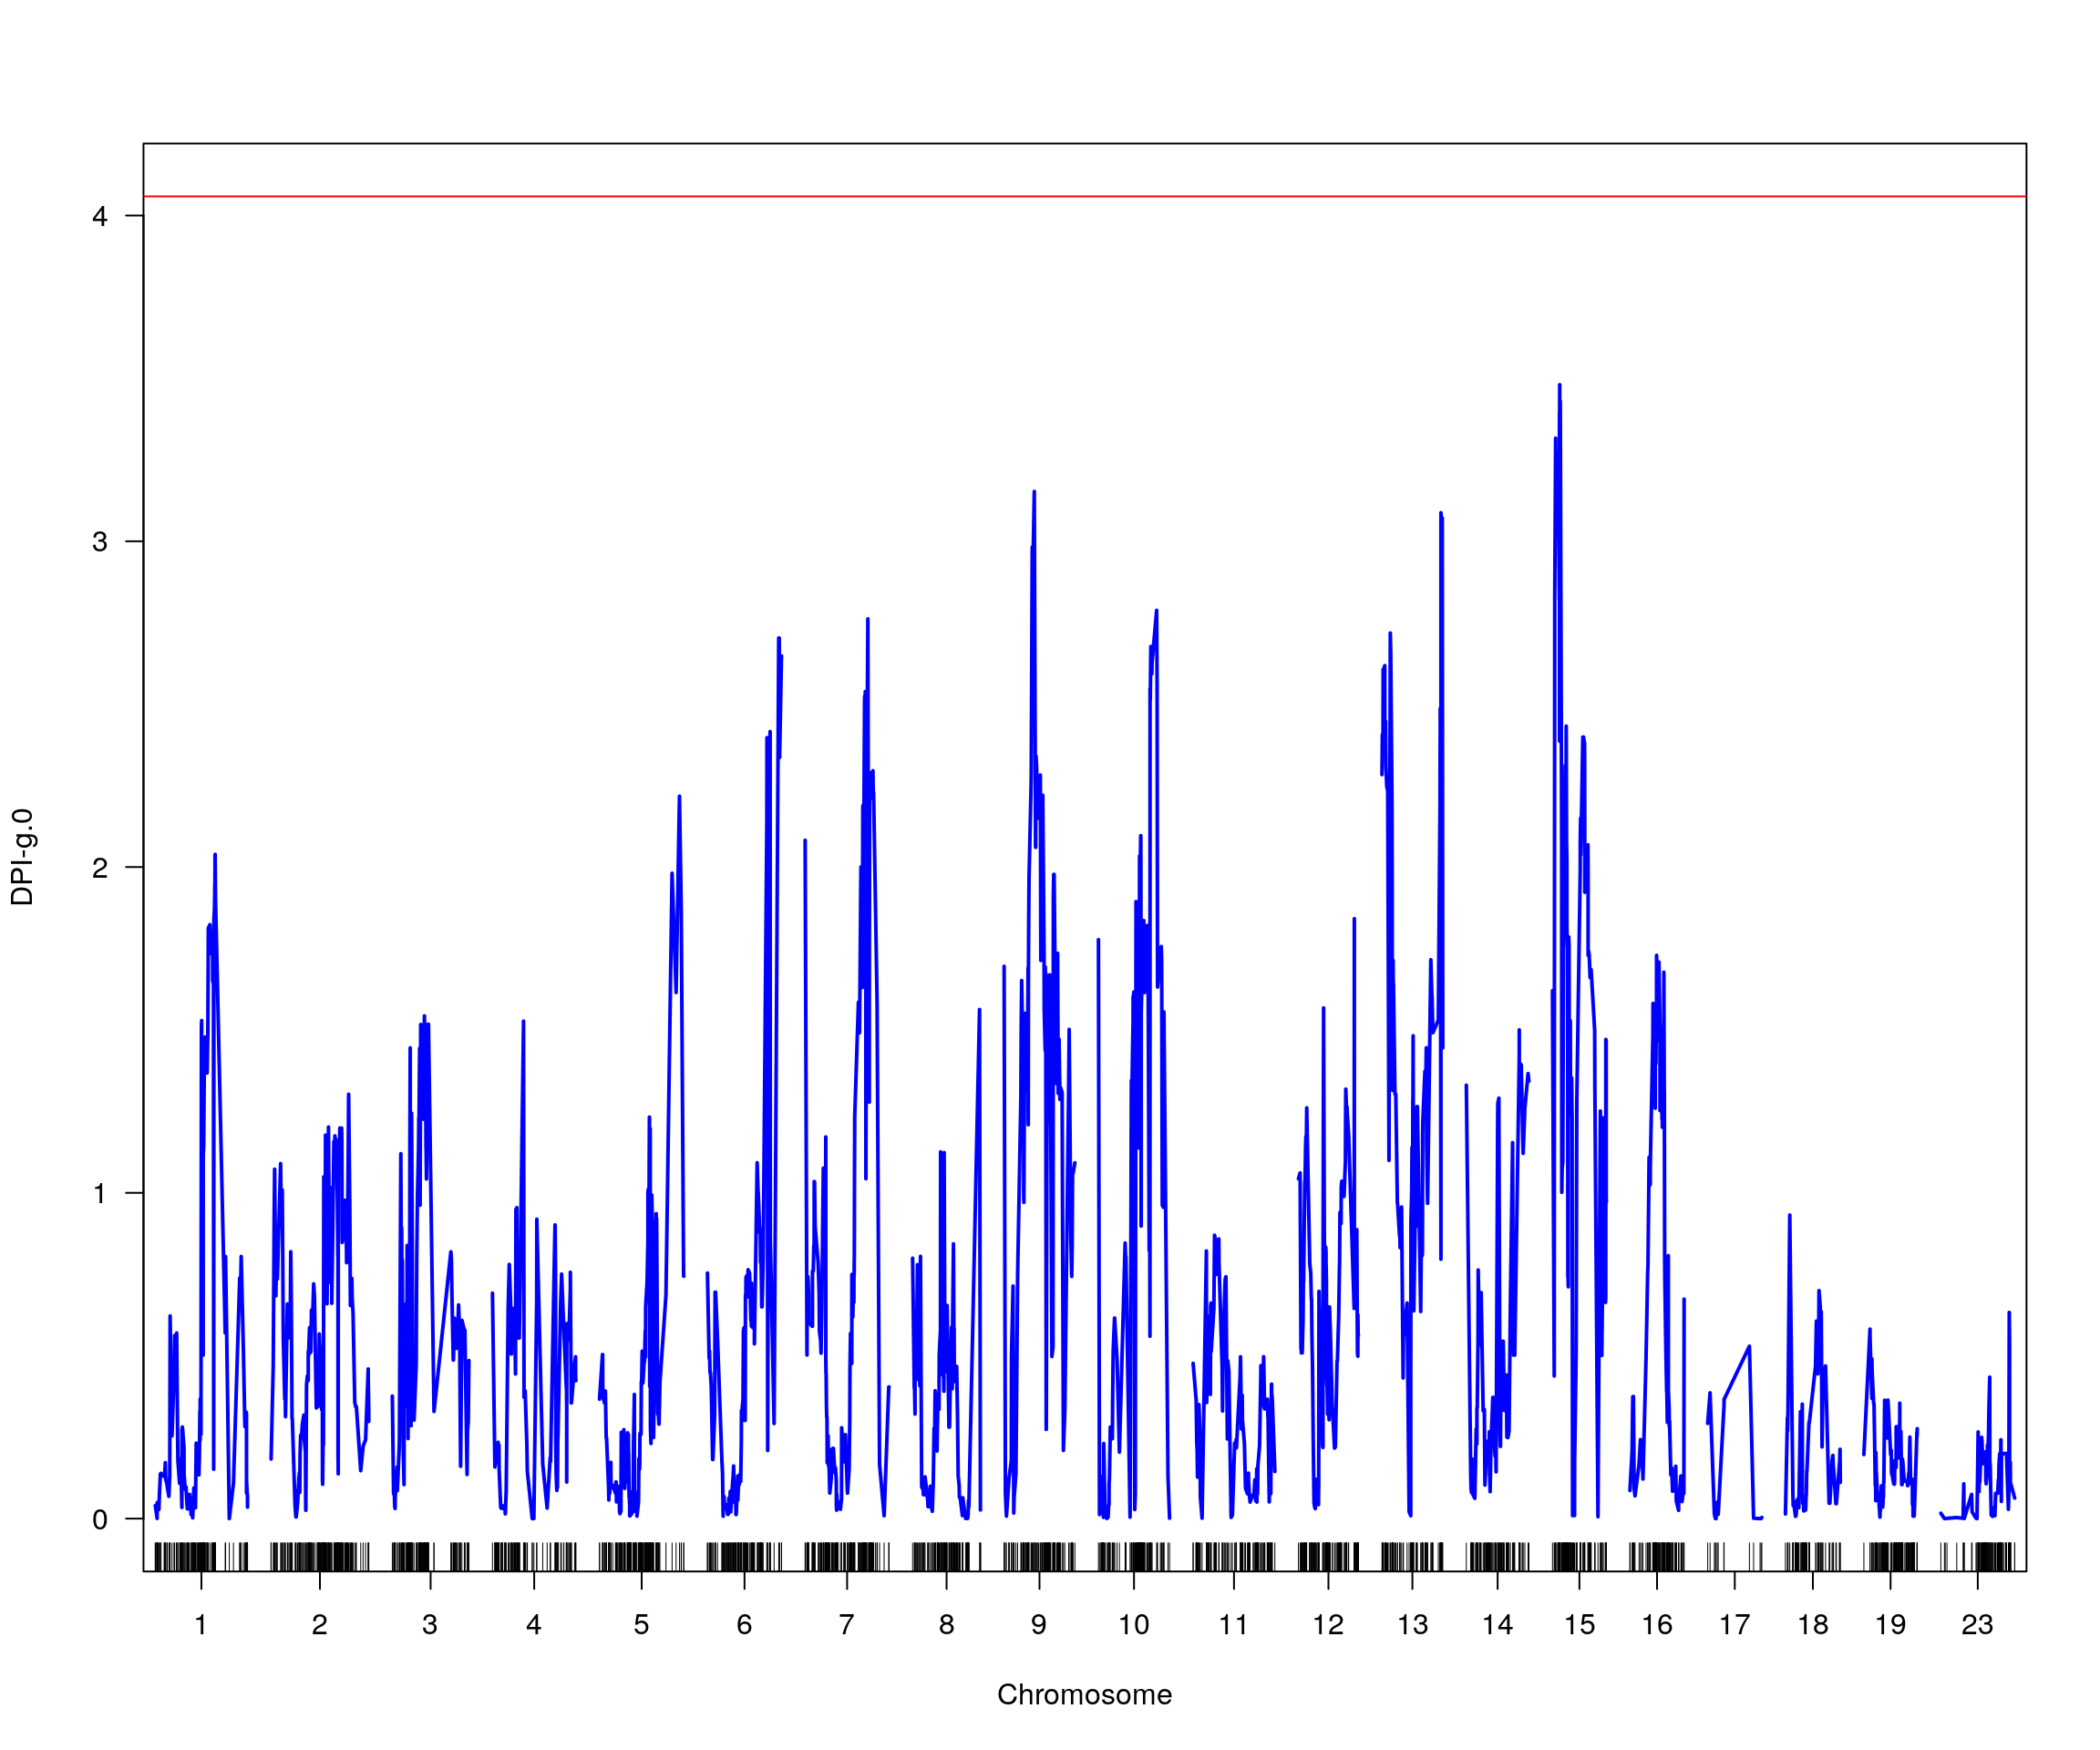
| Version | Author | Date |
|---|---|---|
| 1bf1450 | xhyuo | 2023-09-01 |
# [1] lodindex  lodcolumn chr       pos       lod       ci_lo     ci_hi
# <0 rows> (or 0-length row.names)
# [1] "pheno = 2"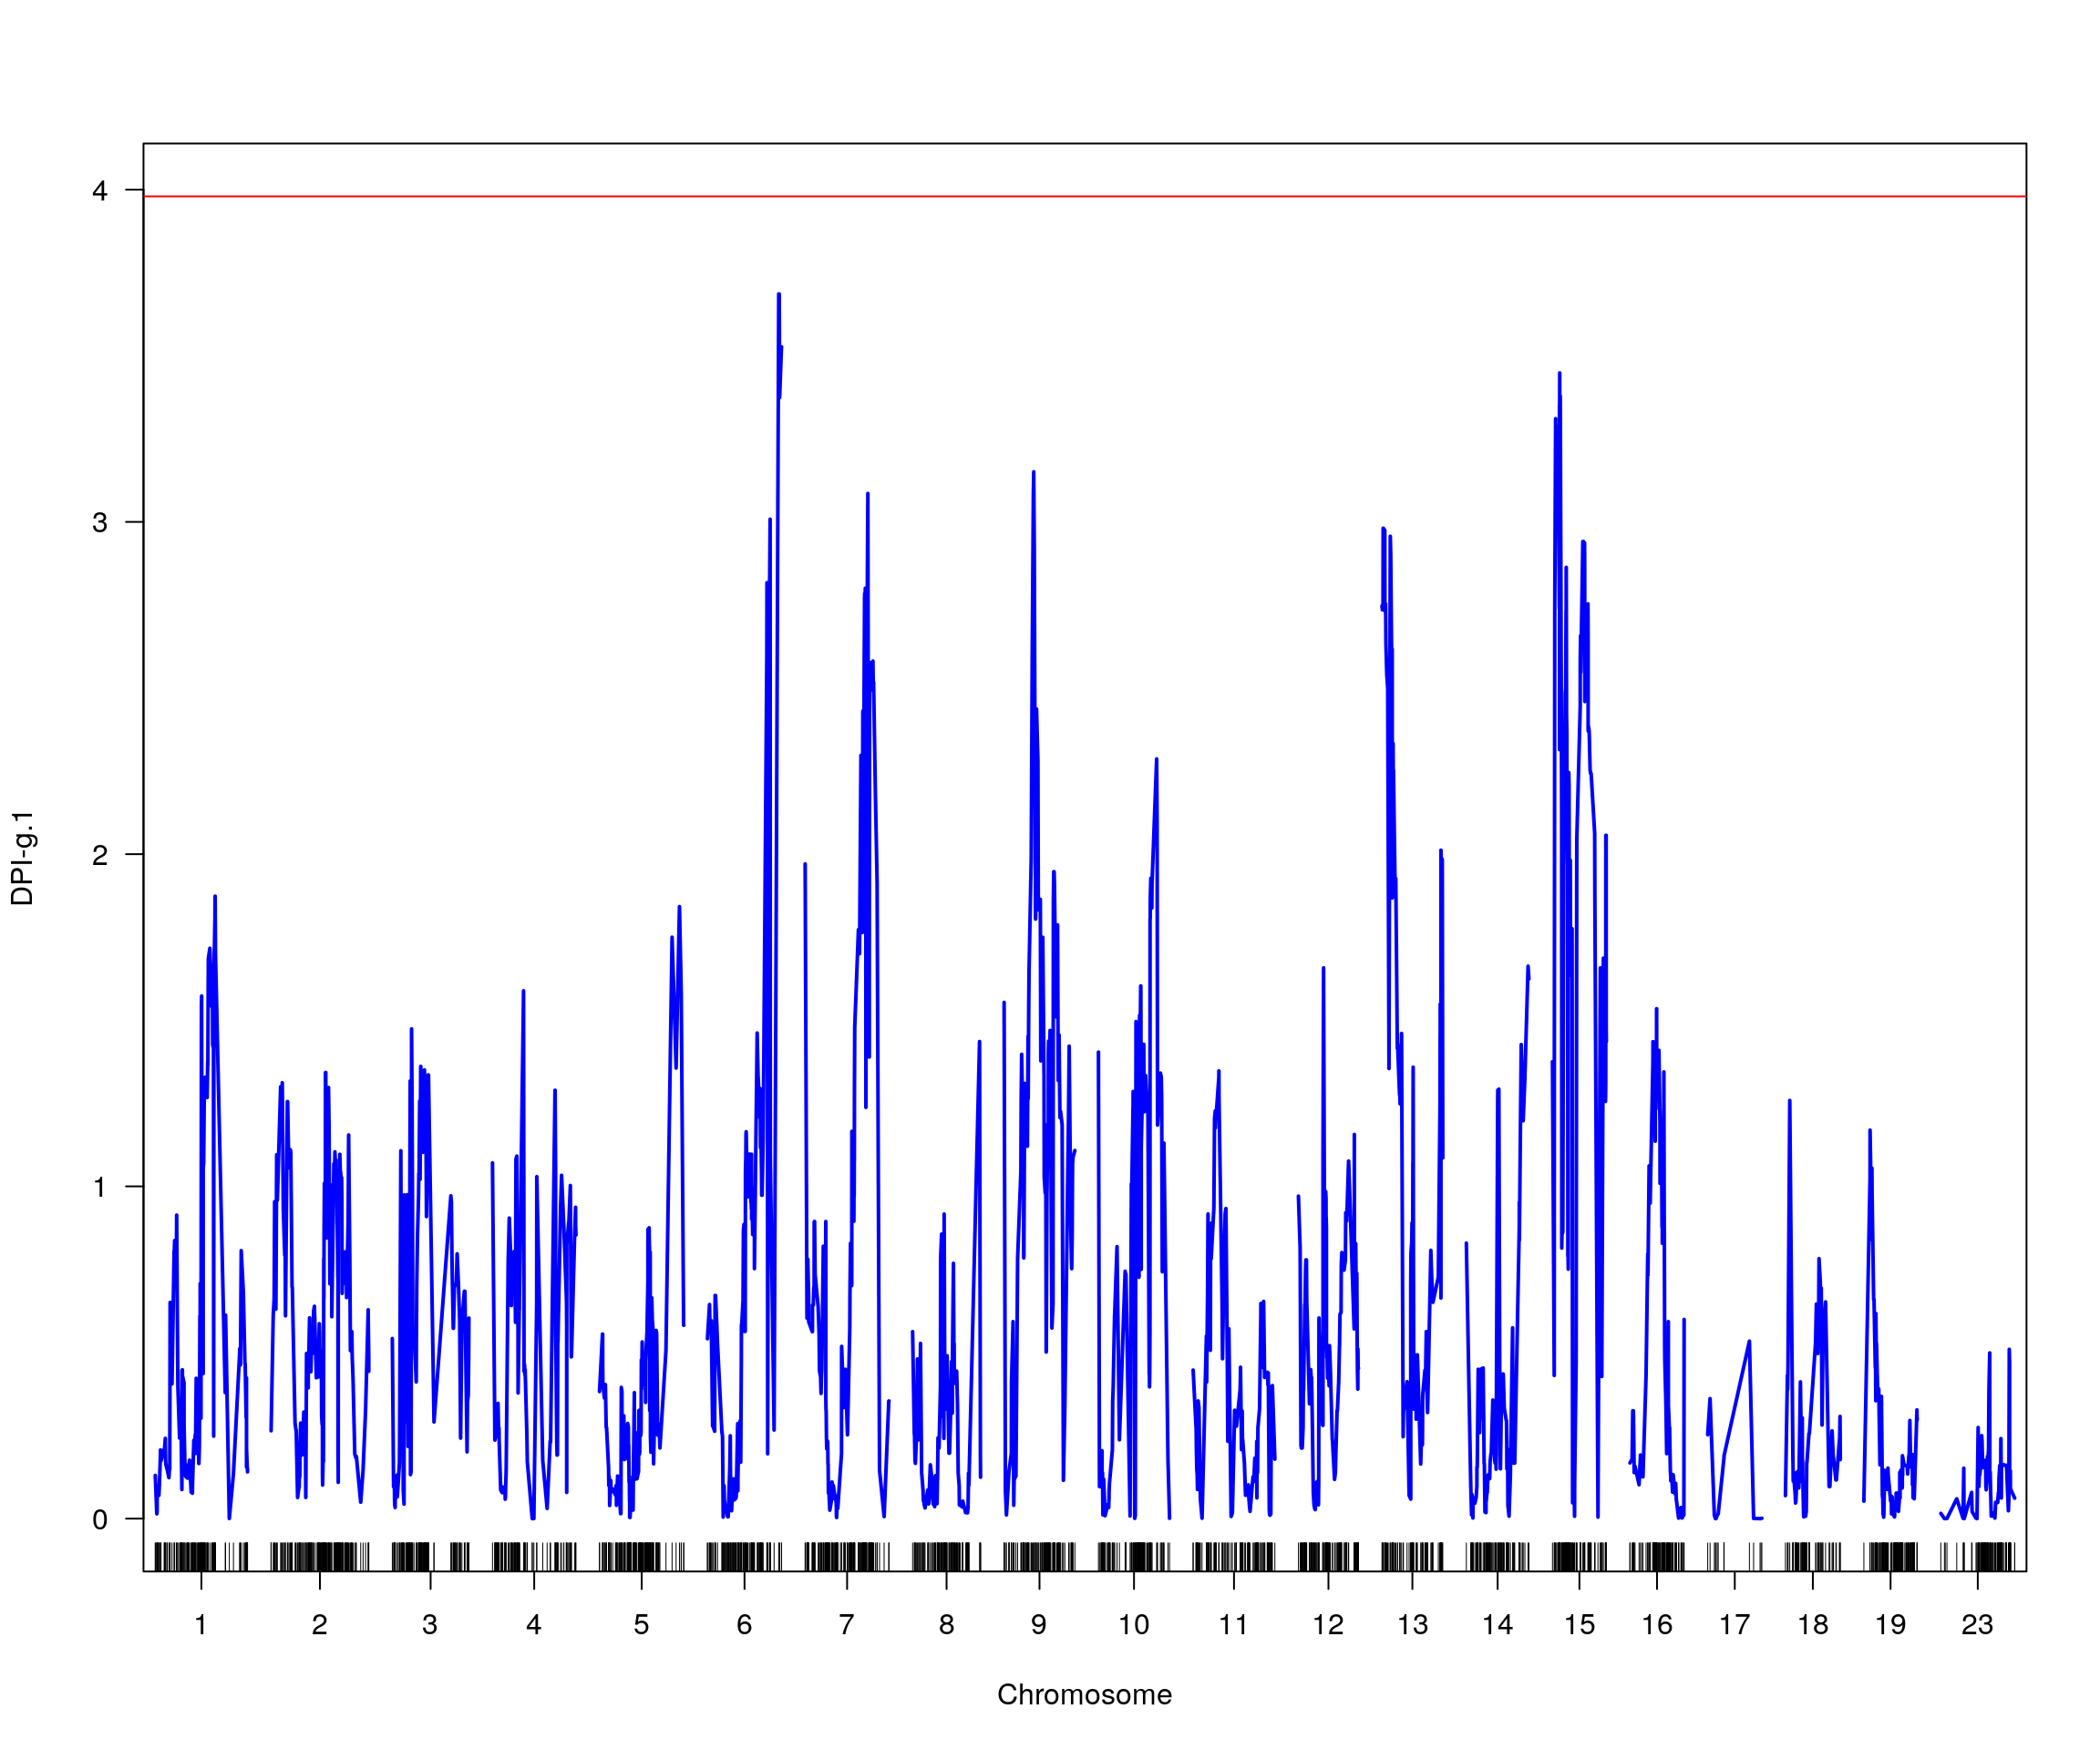
| Version | Author | Date |
|---|---|---|
| 1bf1450 | xhyuo | 2023-09-01 |
# [1] lodindex  lodcolumn chr       pos       lod       ci_lo     ci_hi
# <0 rows> (or 0-length row.names)
# [1] "pheno = 3"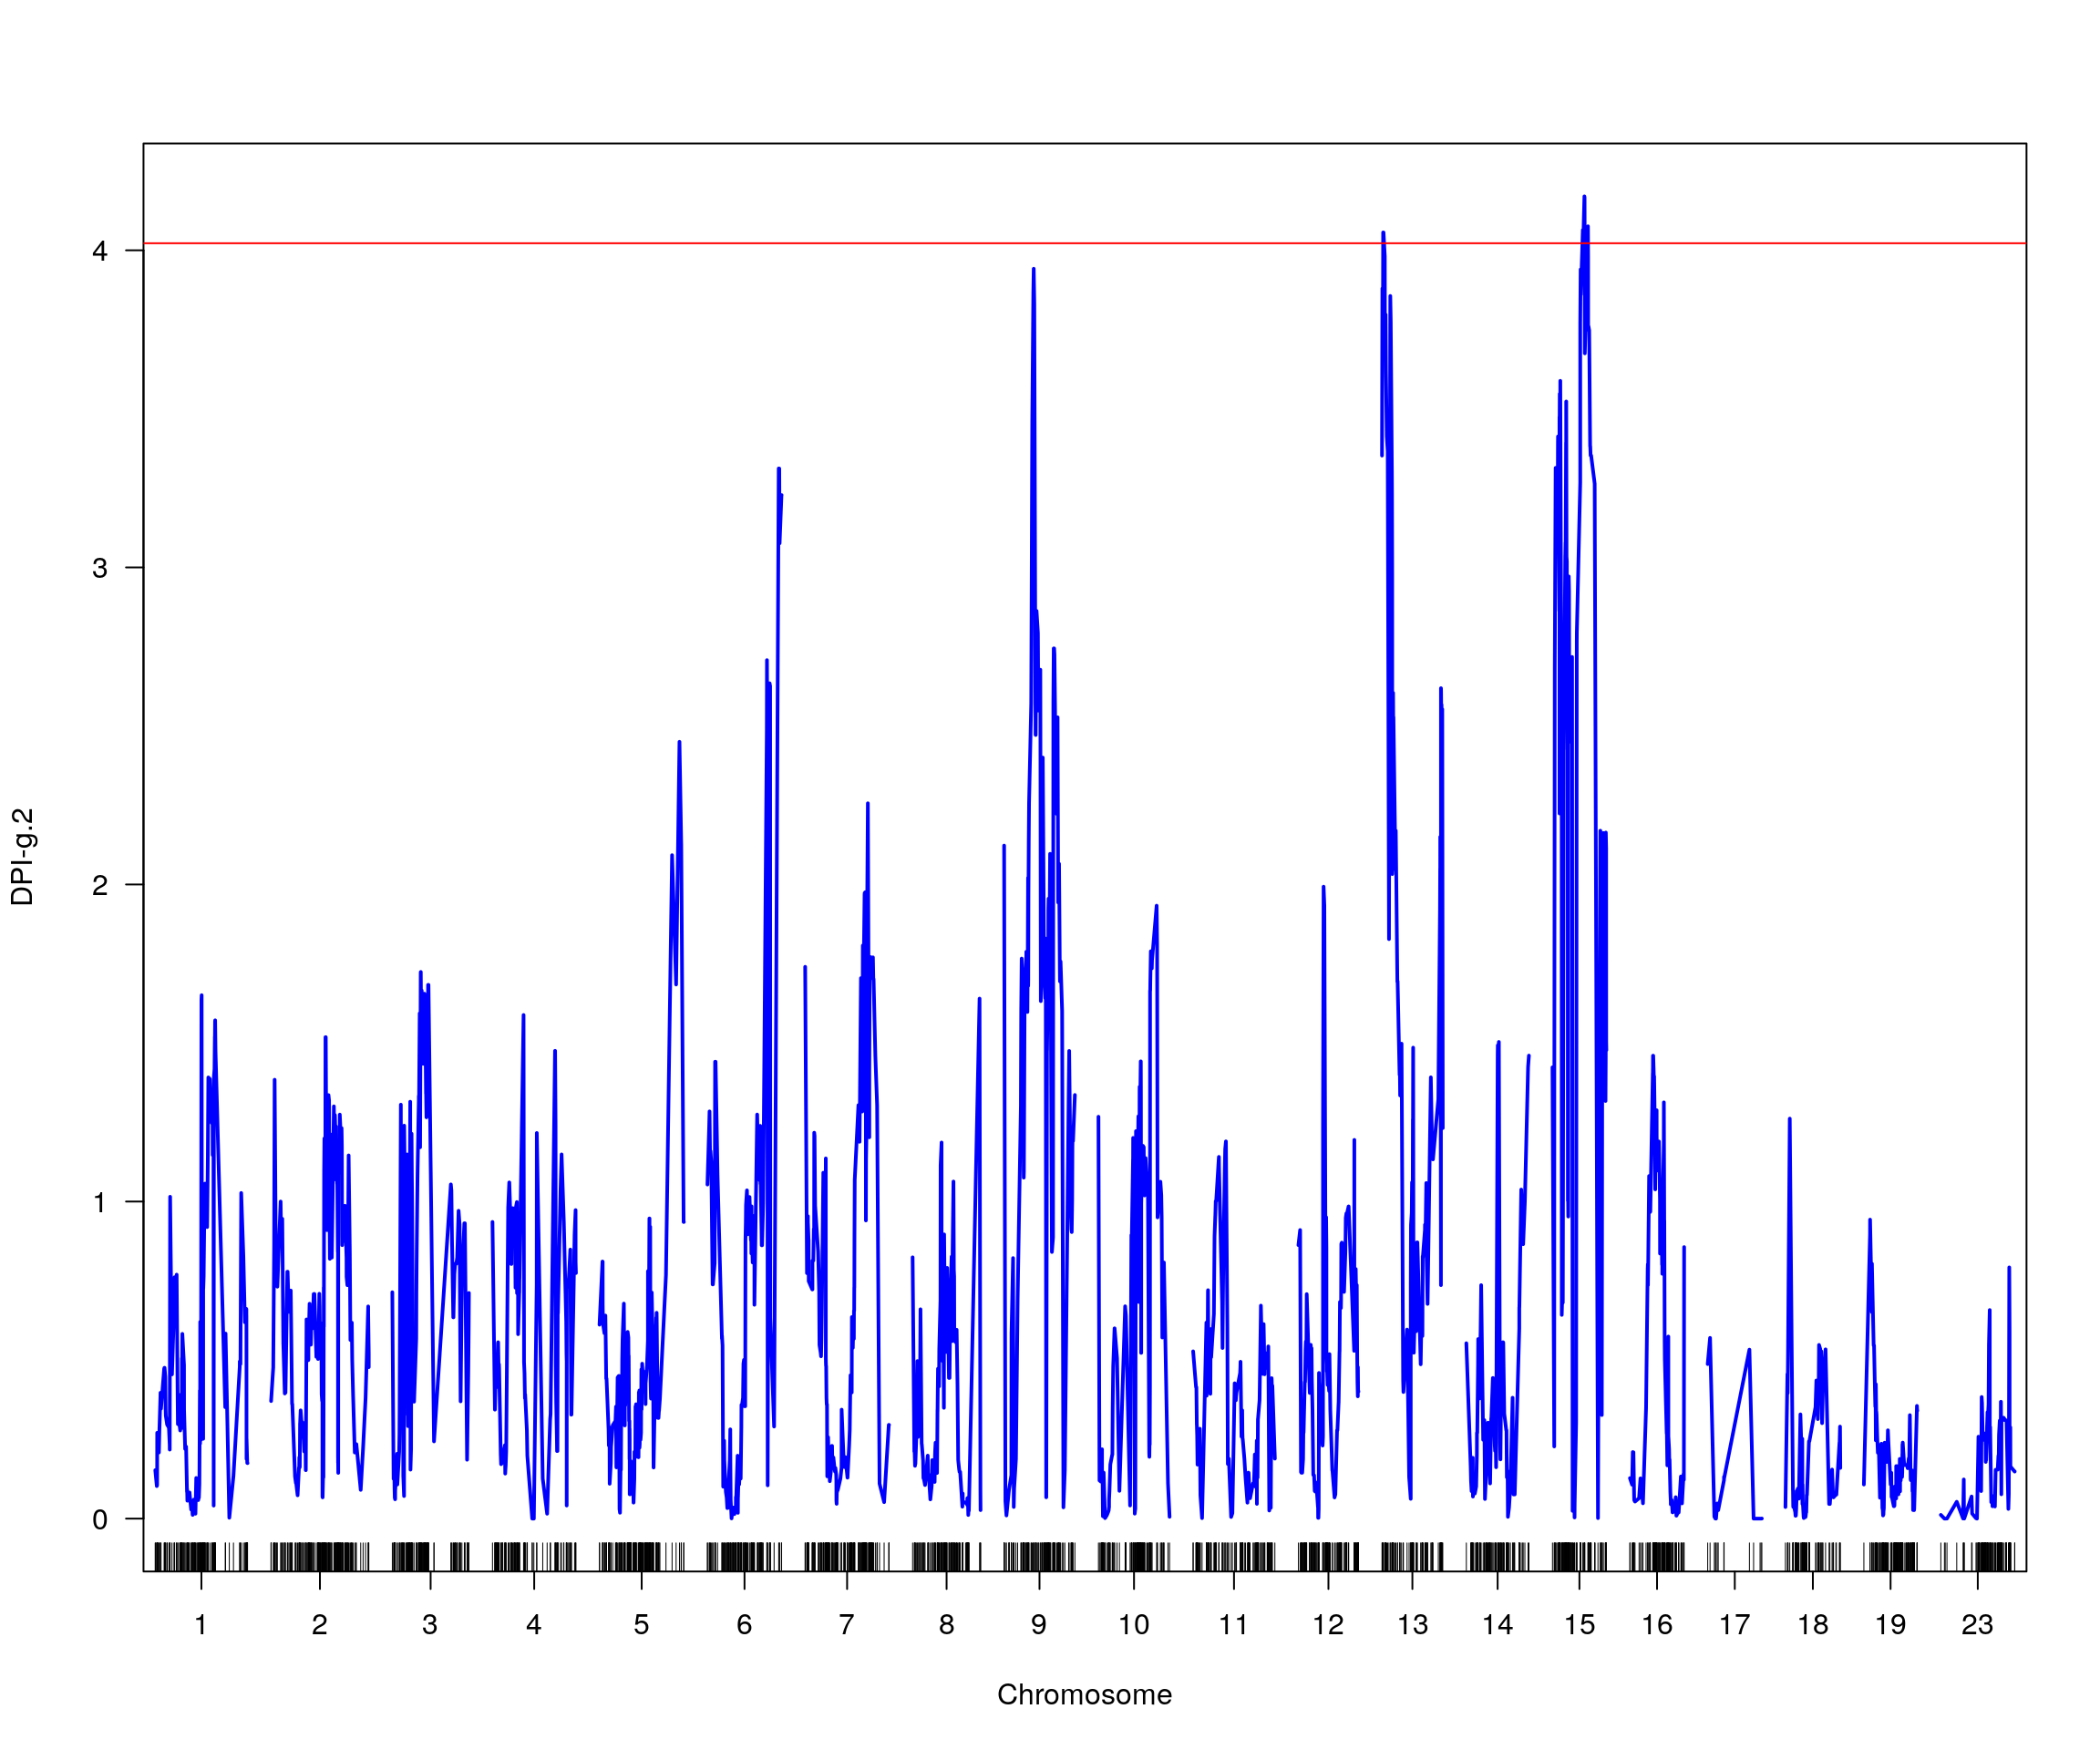
| Version | Author | Date |
|---|---|---|
| 1bf1450 | xhyuo | 2023-09-01 |
#   lodindex lodcolumn chr    pos      lod ci_lo  ci_hi
# 1        1   DPI-g.2  13  3.459 4.056407 2.245 65.465
# 2        1   DPI-g.2  15 33.852 4.170061 1.972 48.270
# [1] "row = 1"
# [1] "row = 2"
# [1] "pheno = 4"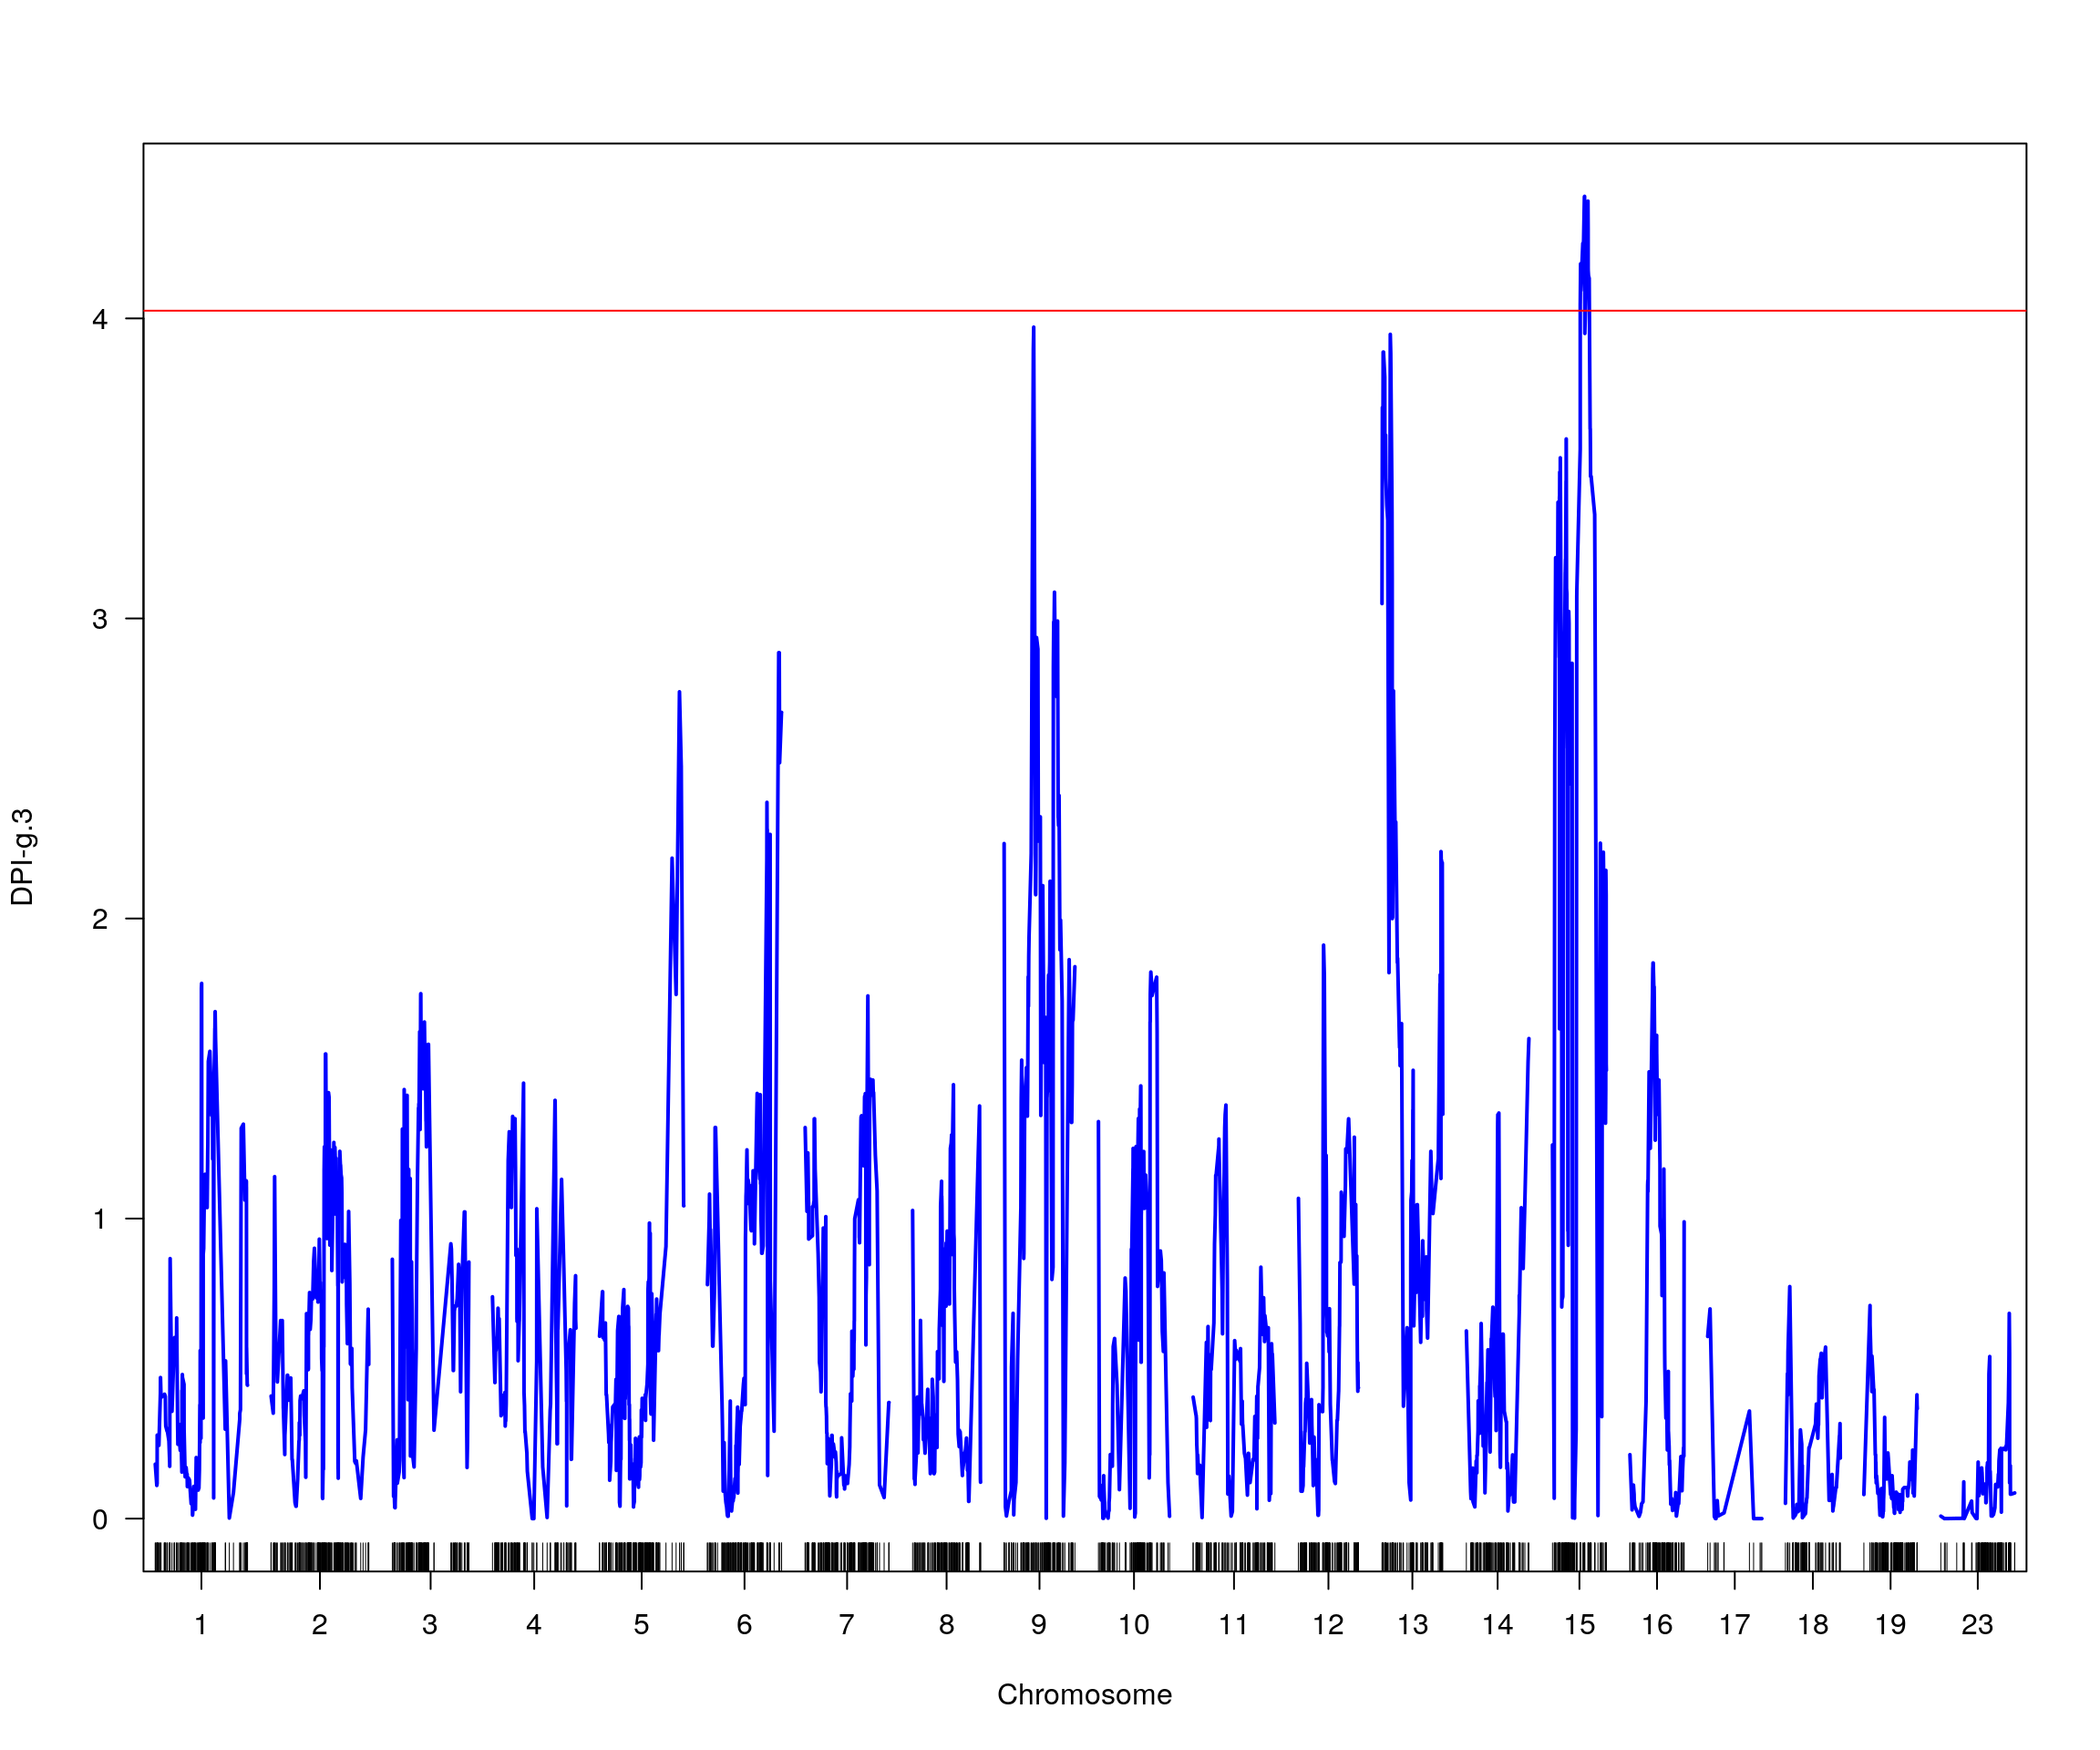
| Version | Author | Date |
|---|---|---|
| 1bf1450 | xhyuo | 2023-09-01 |
#   lodindex lodcolumn chr   pos      lod ci_lo ci_hi
# 1        1   DPI-g.3  15 34.04 4.406689 2.422 48.27
# [1] "row = 1"
# [1] "pheno = 5"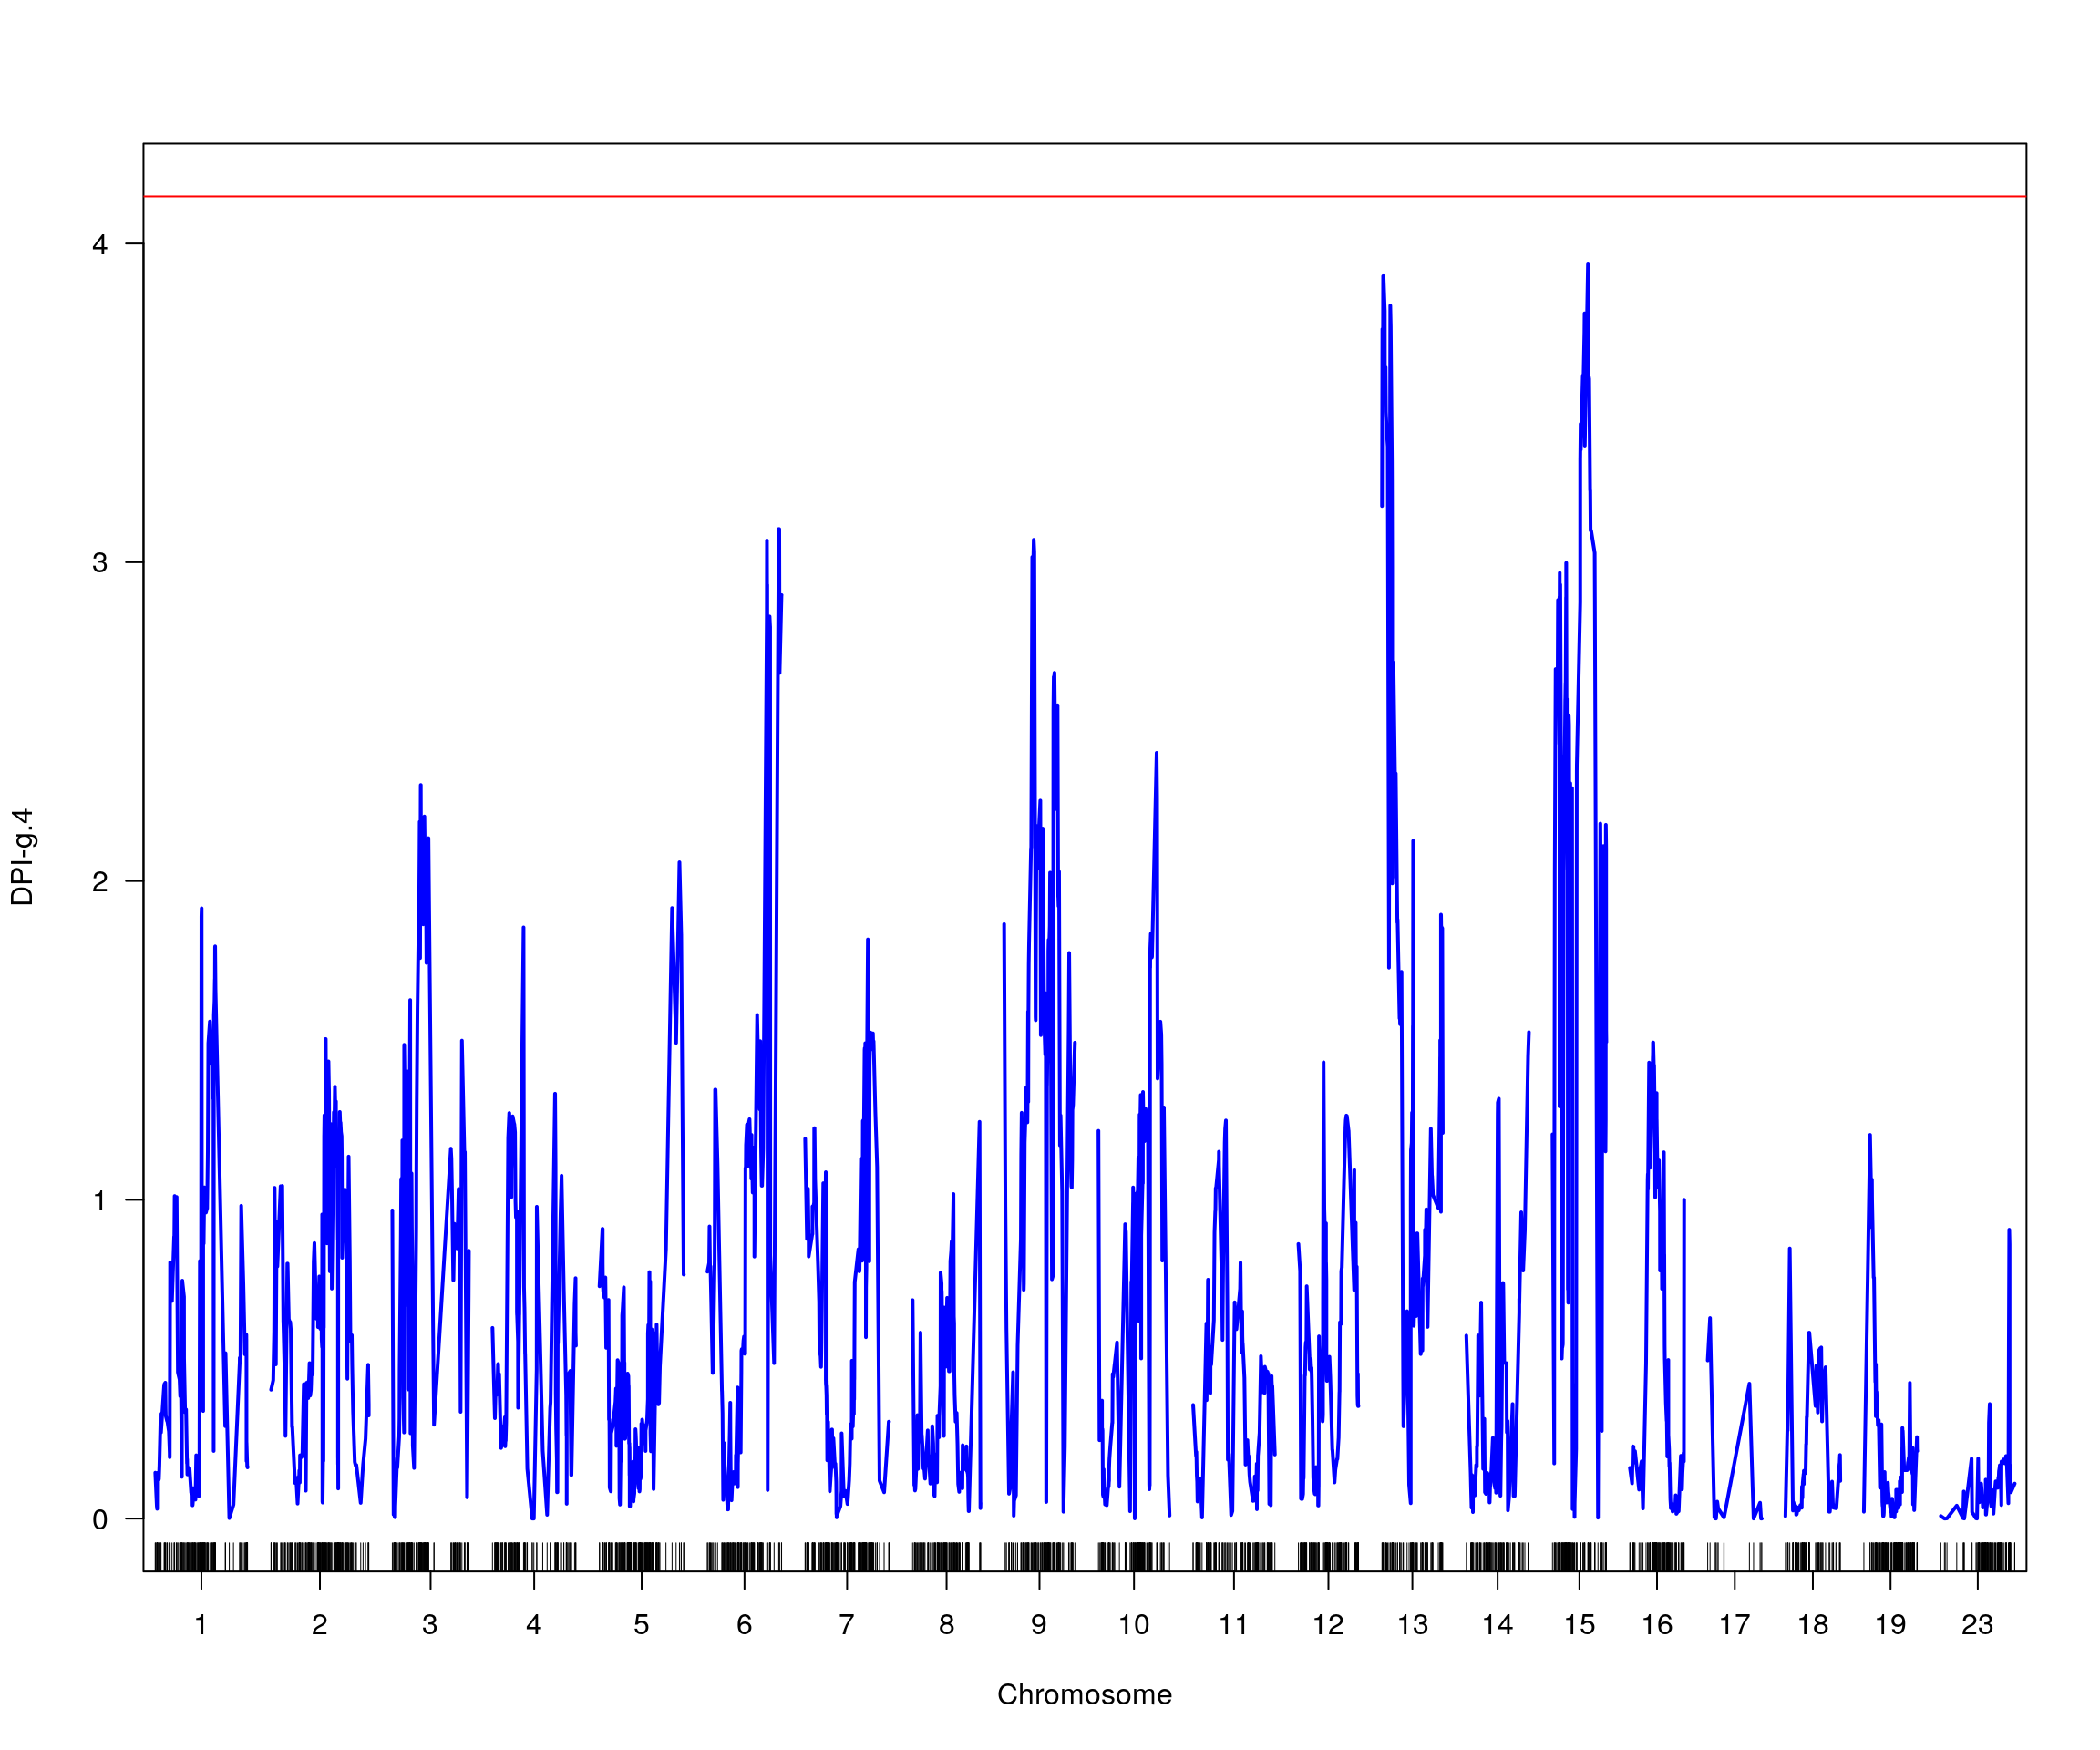
| Version | Author | Date |
|---|---|---|
| 1bf1450 | xhyuo | 2023-09-01 |
# [1] lodindex  lodcolumn chr       pos       lod       ci_lo     ci_hi
# <0 rows> (or 0-length row.names)
# [1] "pheno = 6"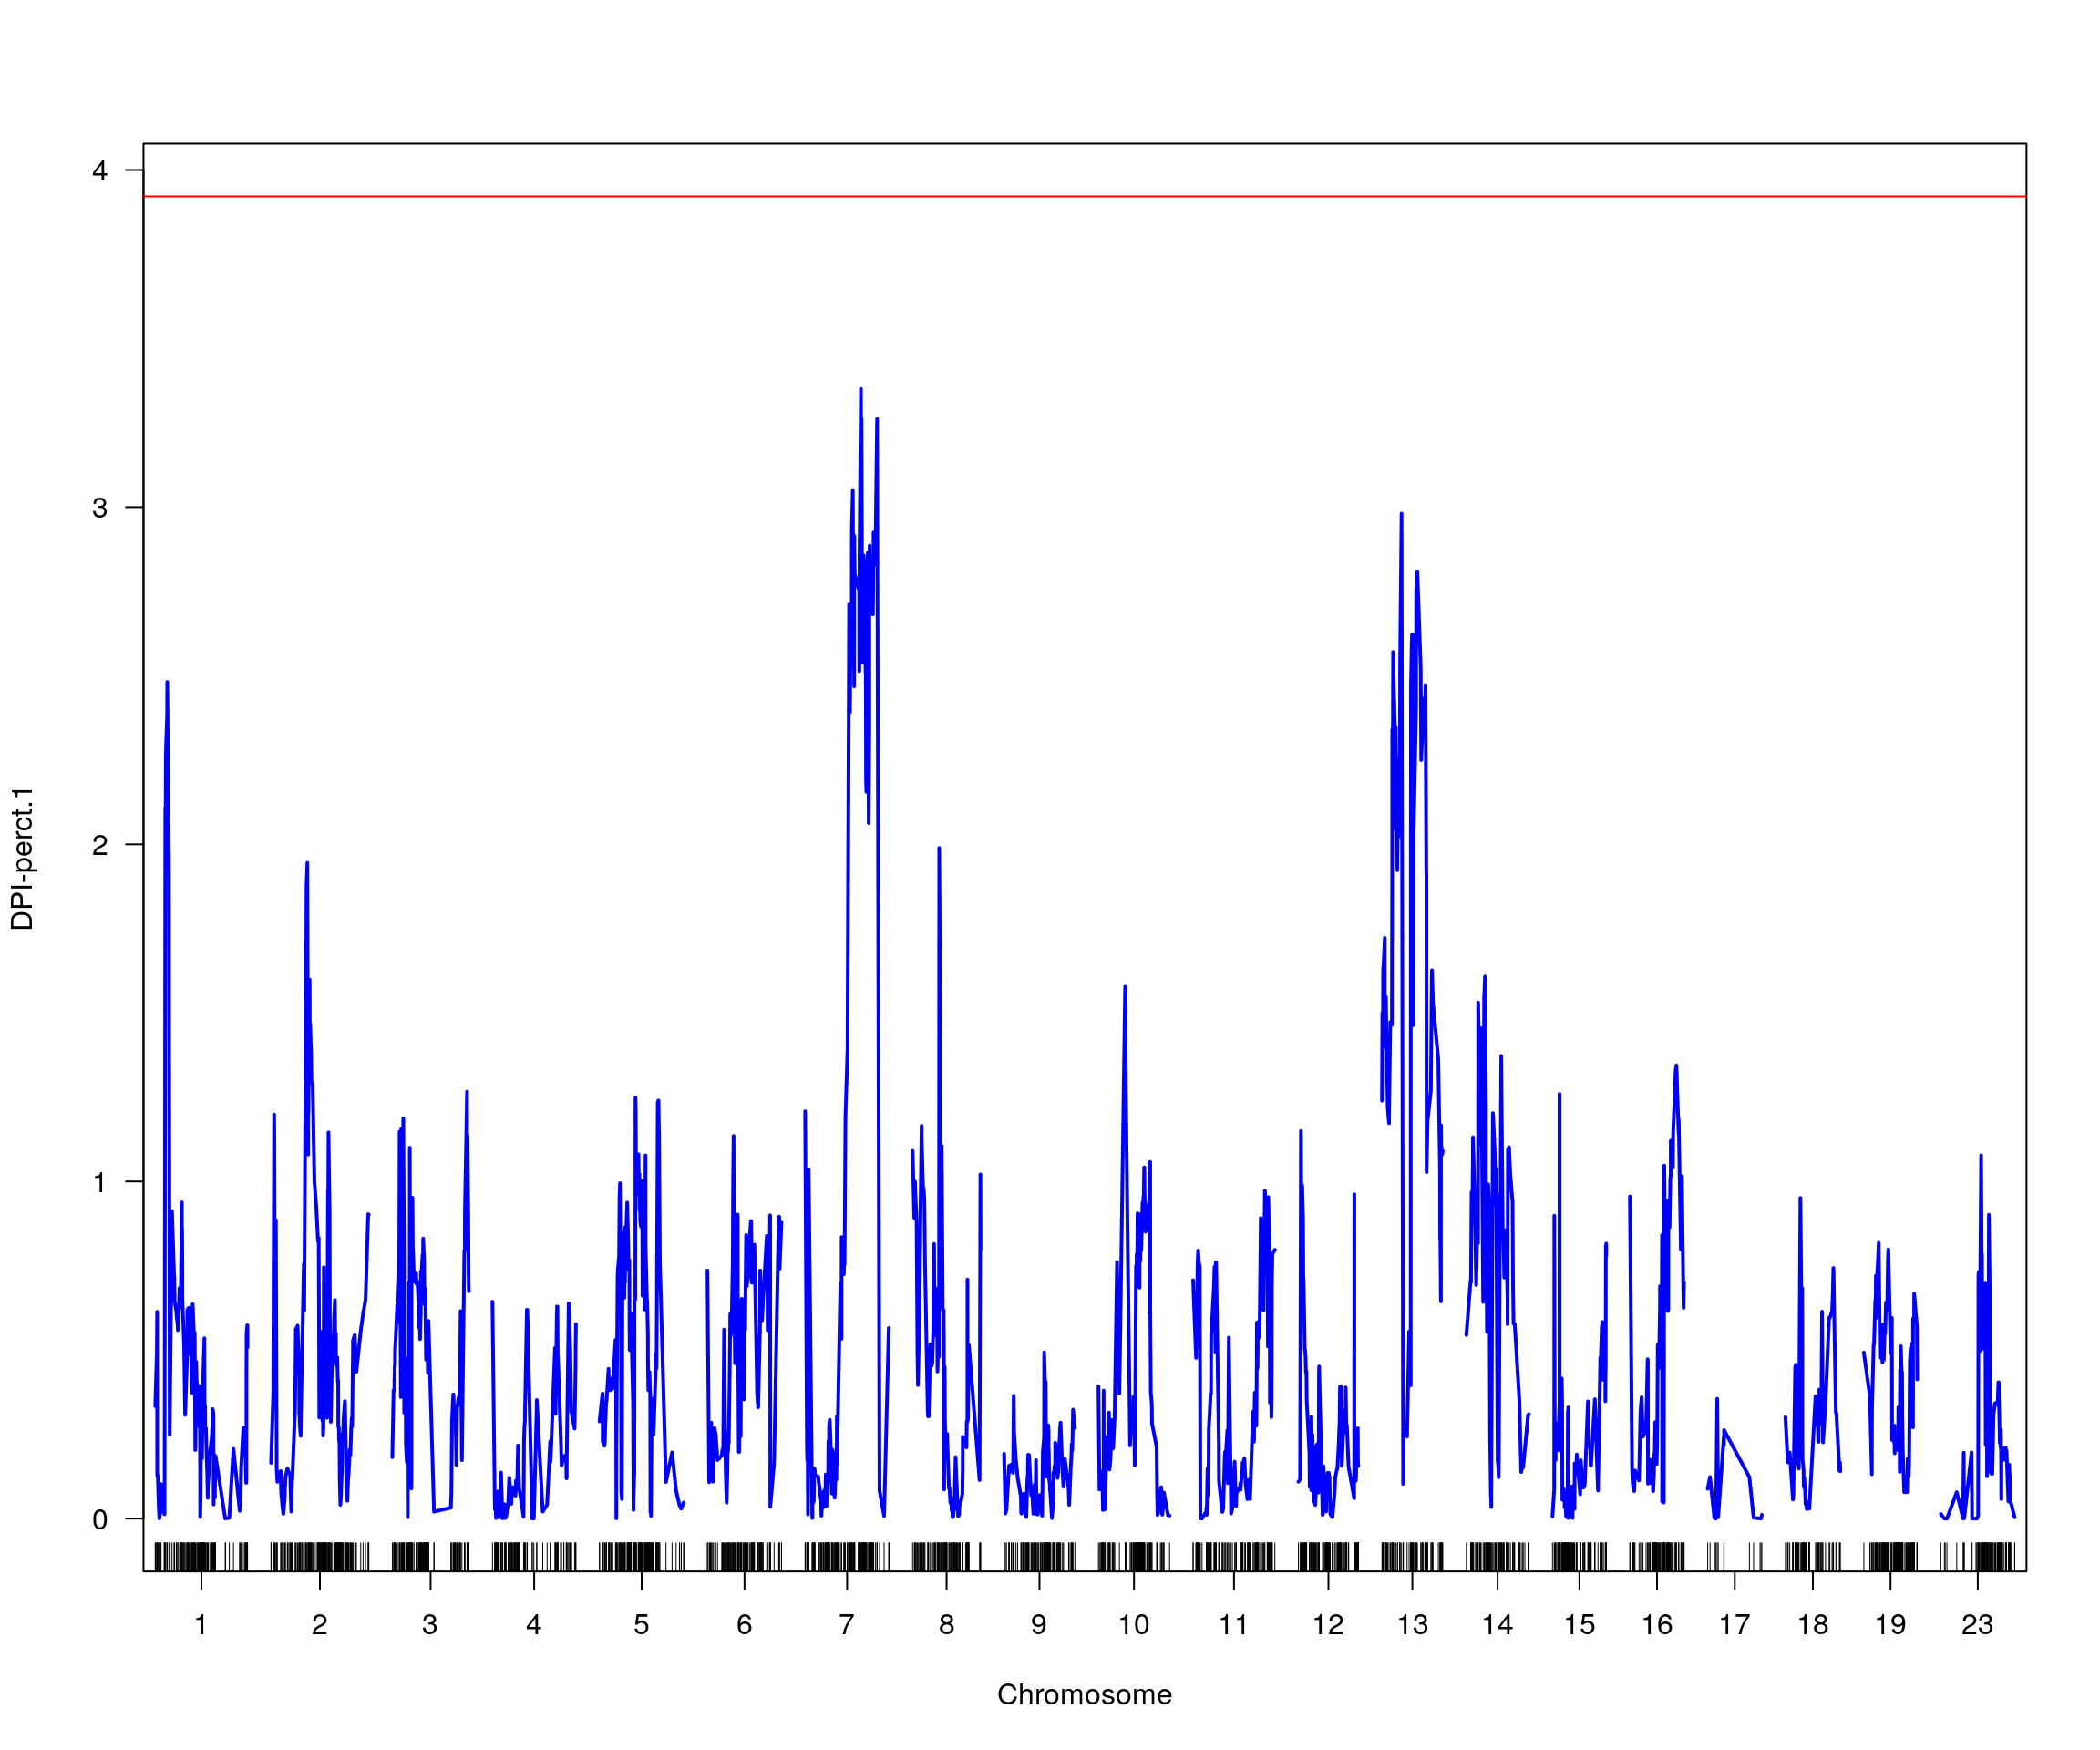
| Version | Author | Date |
|---|---|---|
| 1bf1450 | xhyuo | 2023-09-01 |
# [1] lodindex  lodcolumn chr       pos       lod       ci_lo     ci_hi
# <0 rows> (or 0-length row.names)
# [1] "pheno = 7"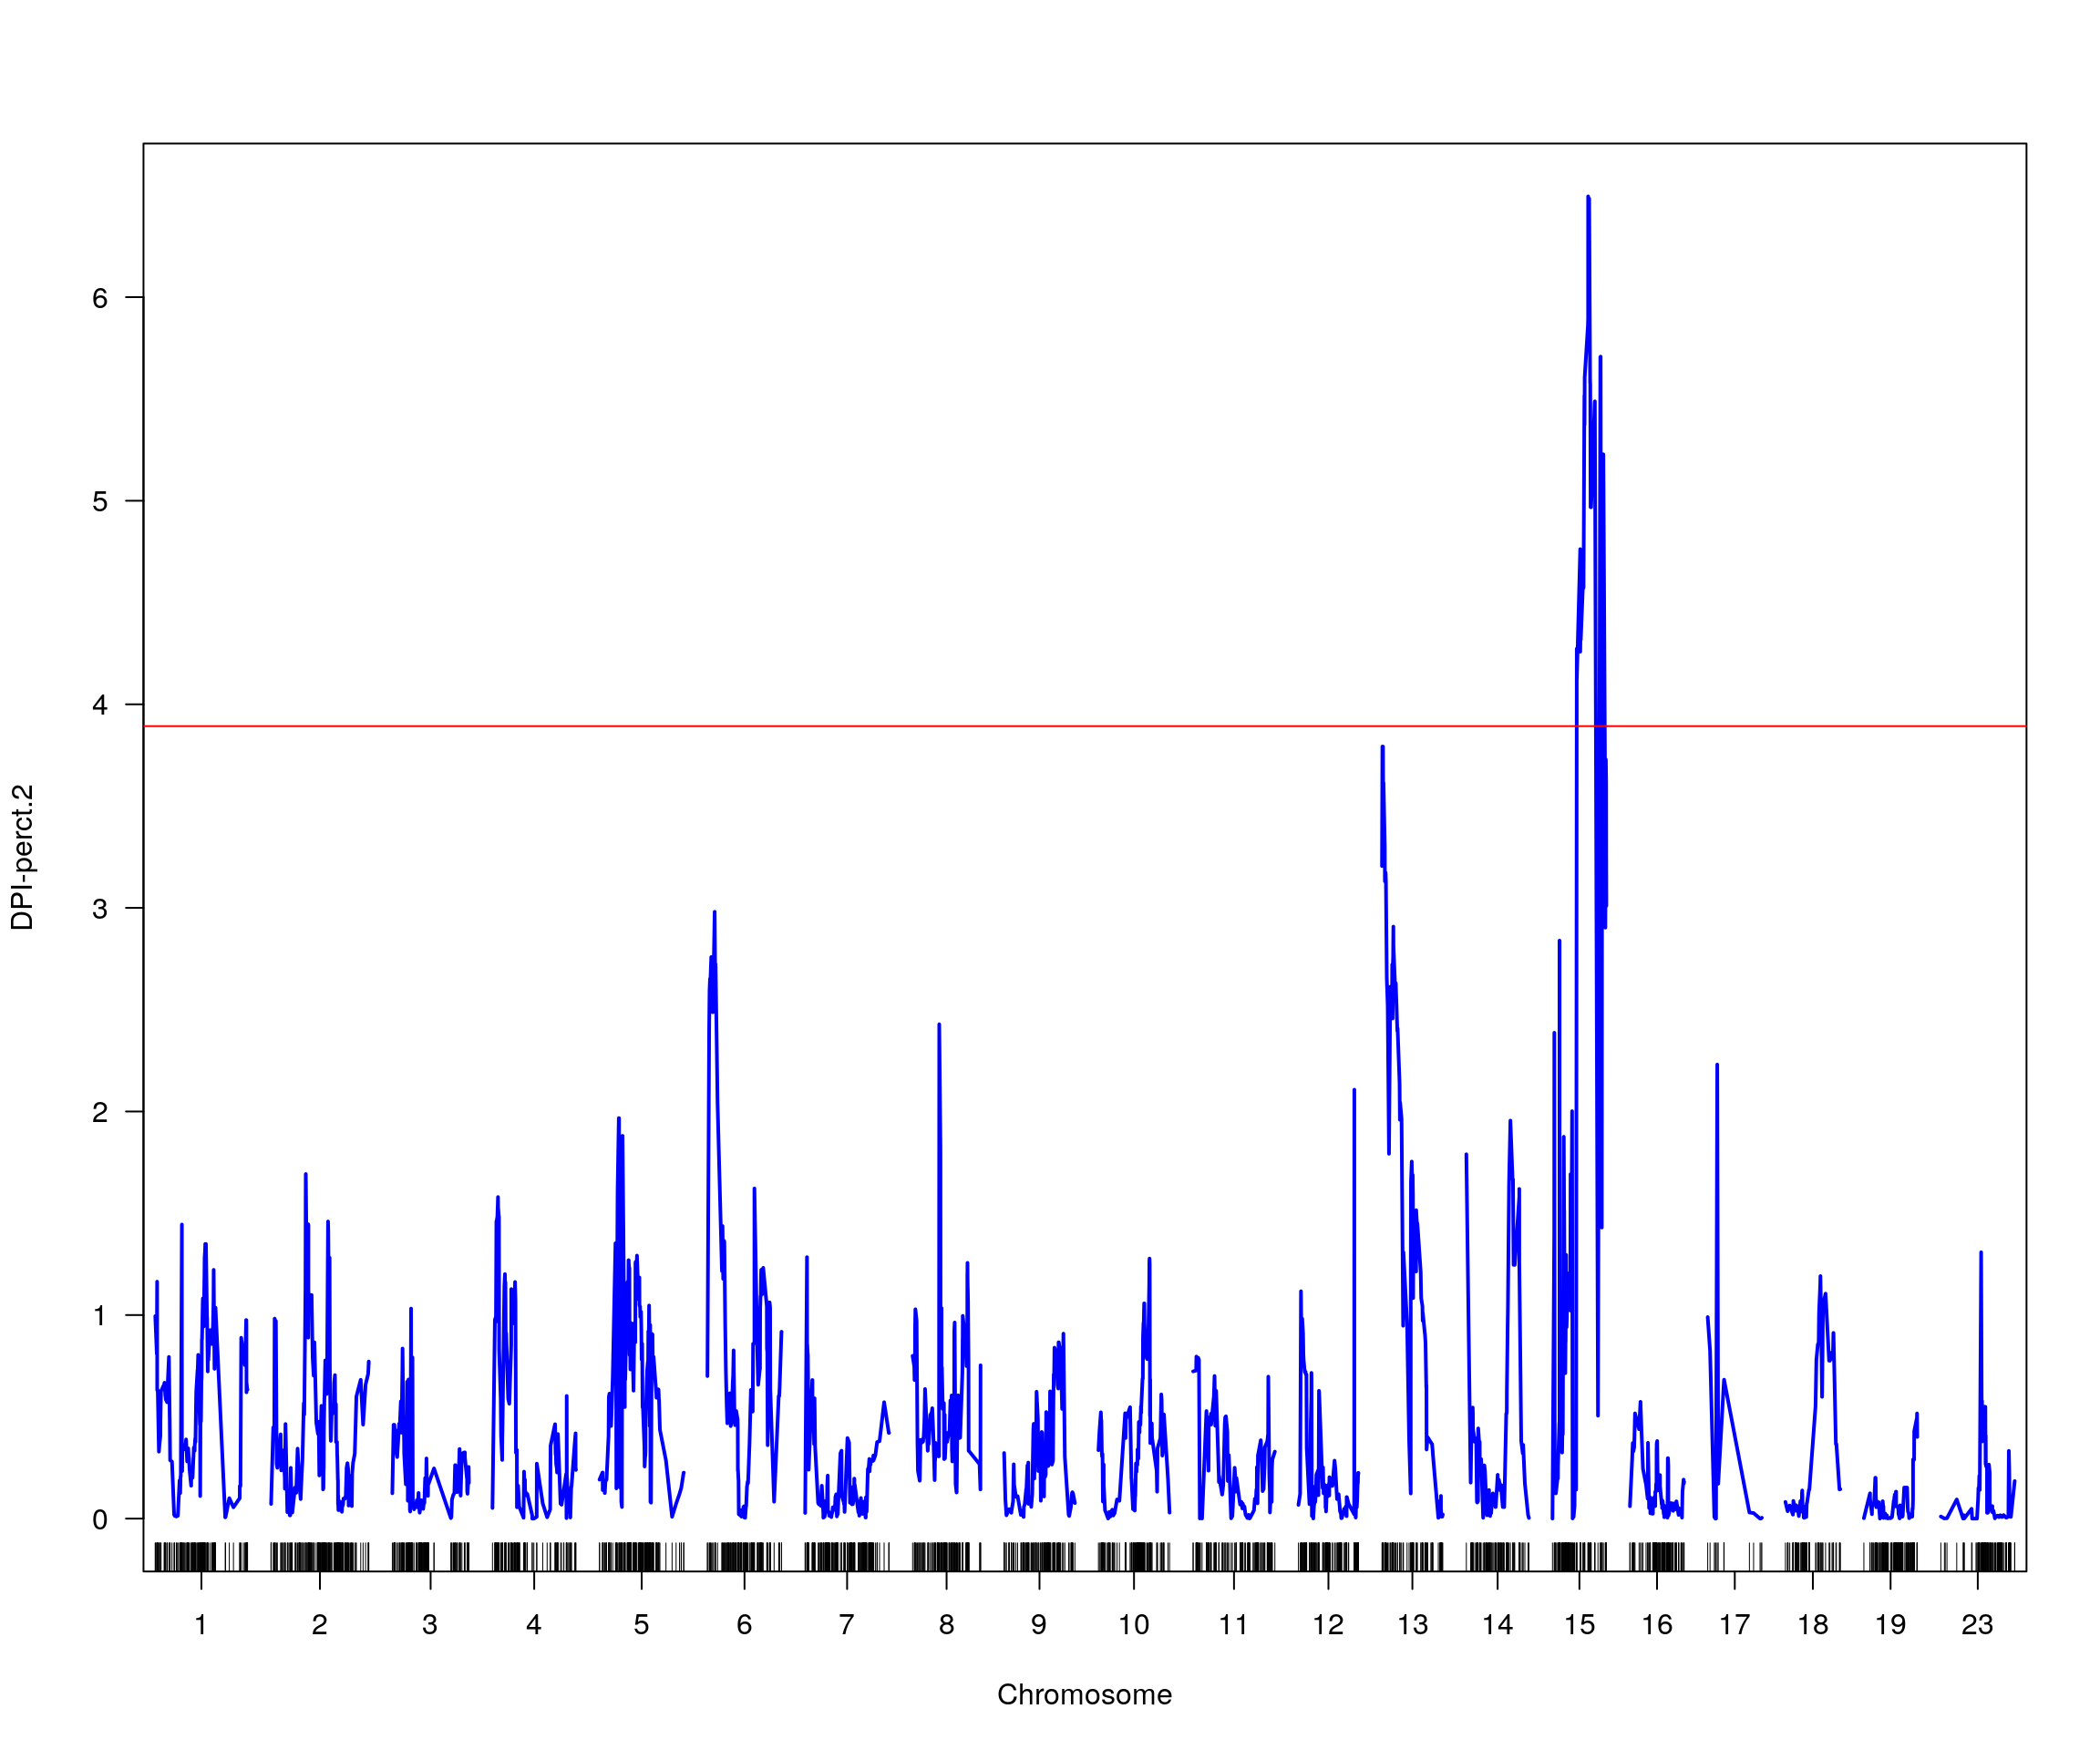
| Version | Author | Date |
|---|---|---|
| 1bf1450 | xhyuo | 2023-09-01 |
#   lodindex   lodcolumn chr    pos      lod  ci_lo ci_hi
# 1        1 DPI-perct.2  15 37.829 6.495021 32.951 56.09
# [1] "row = 1"
# [1] "pheno = 8"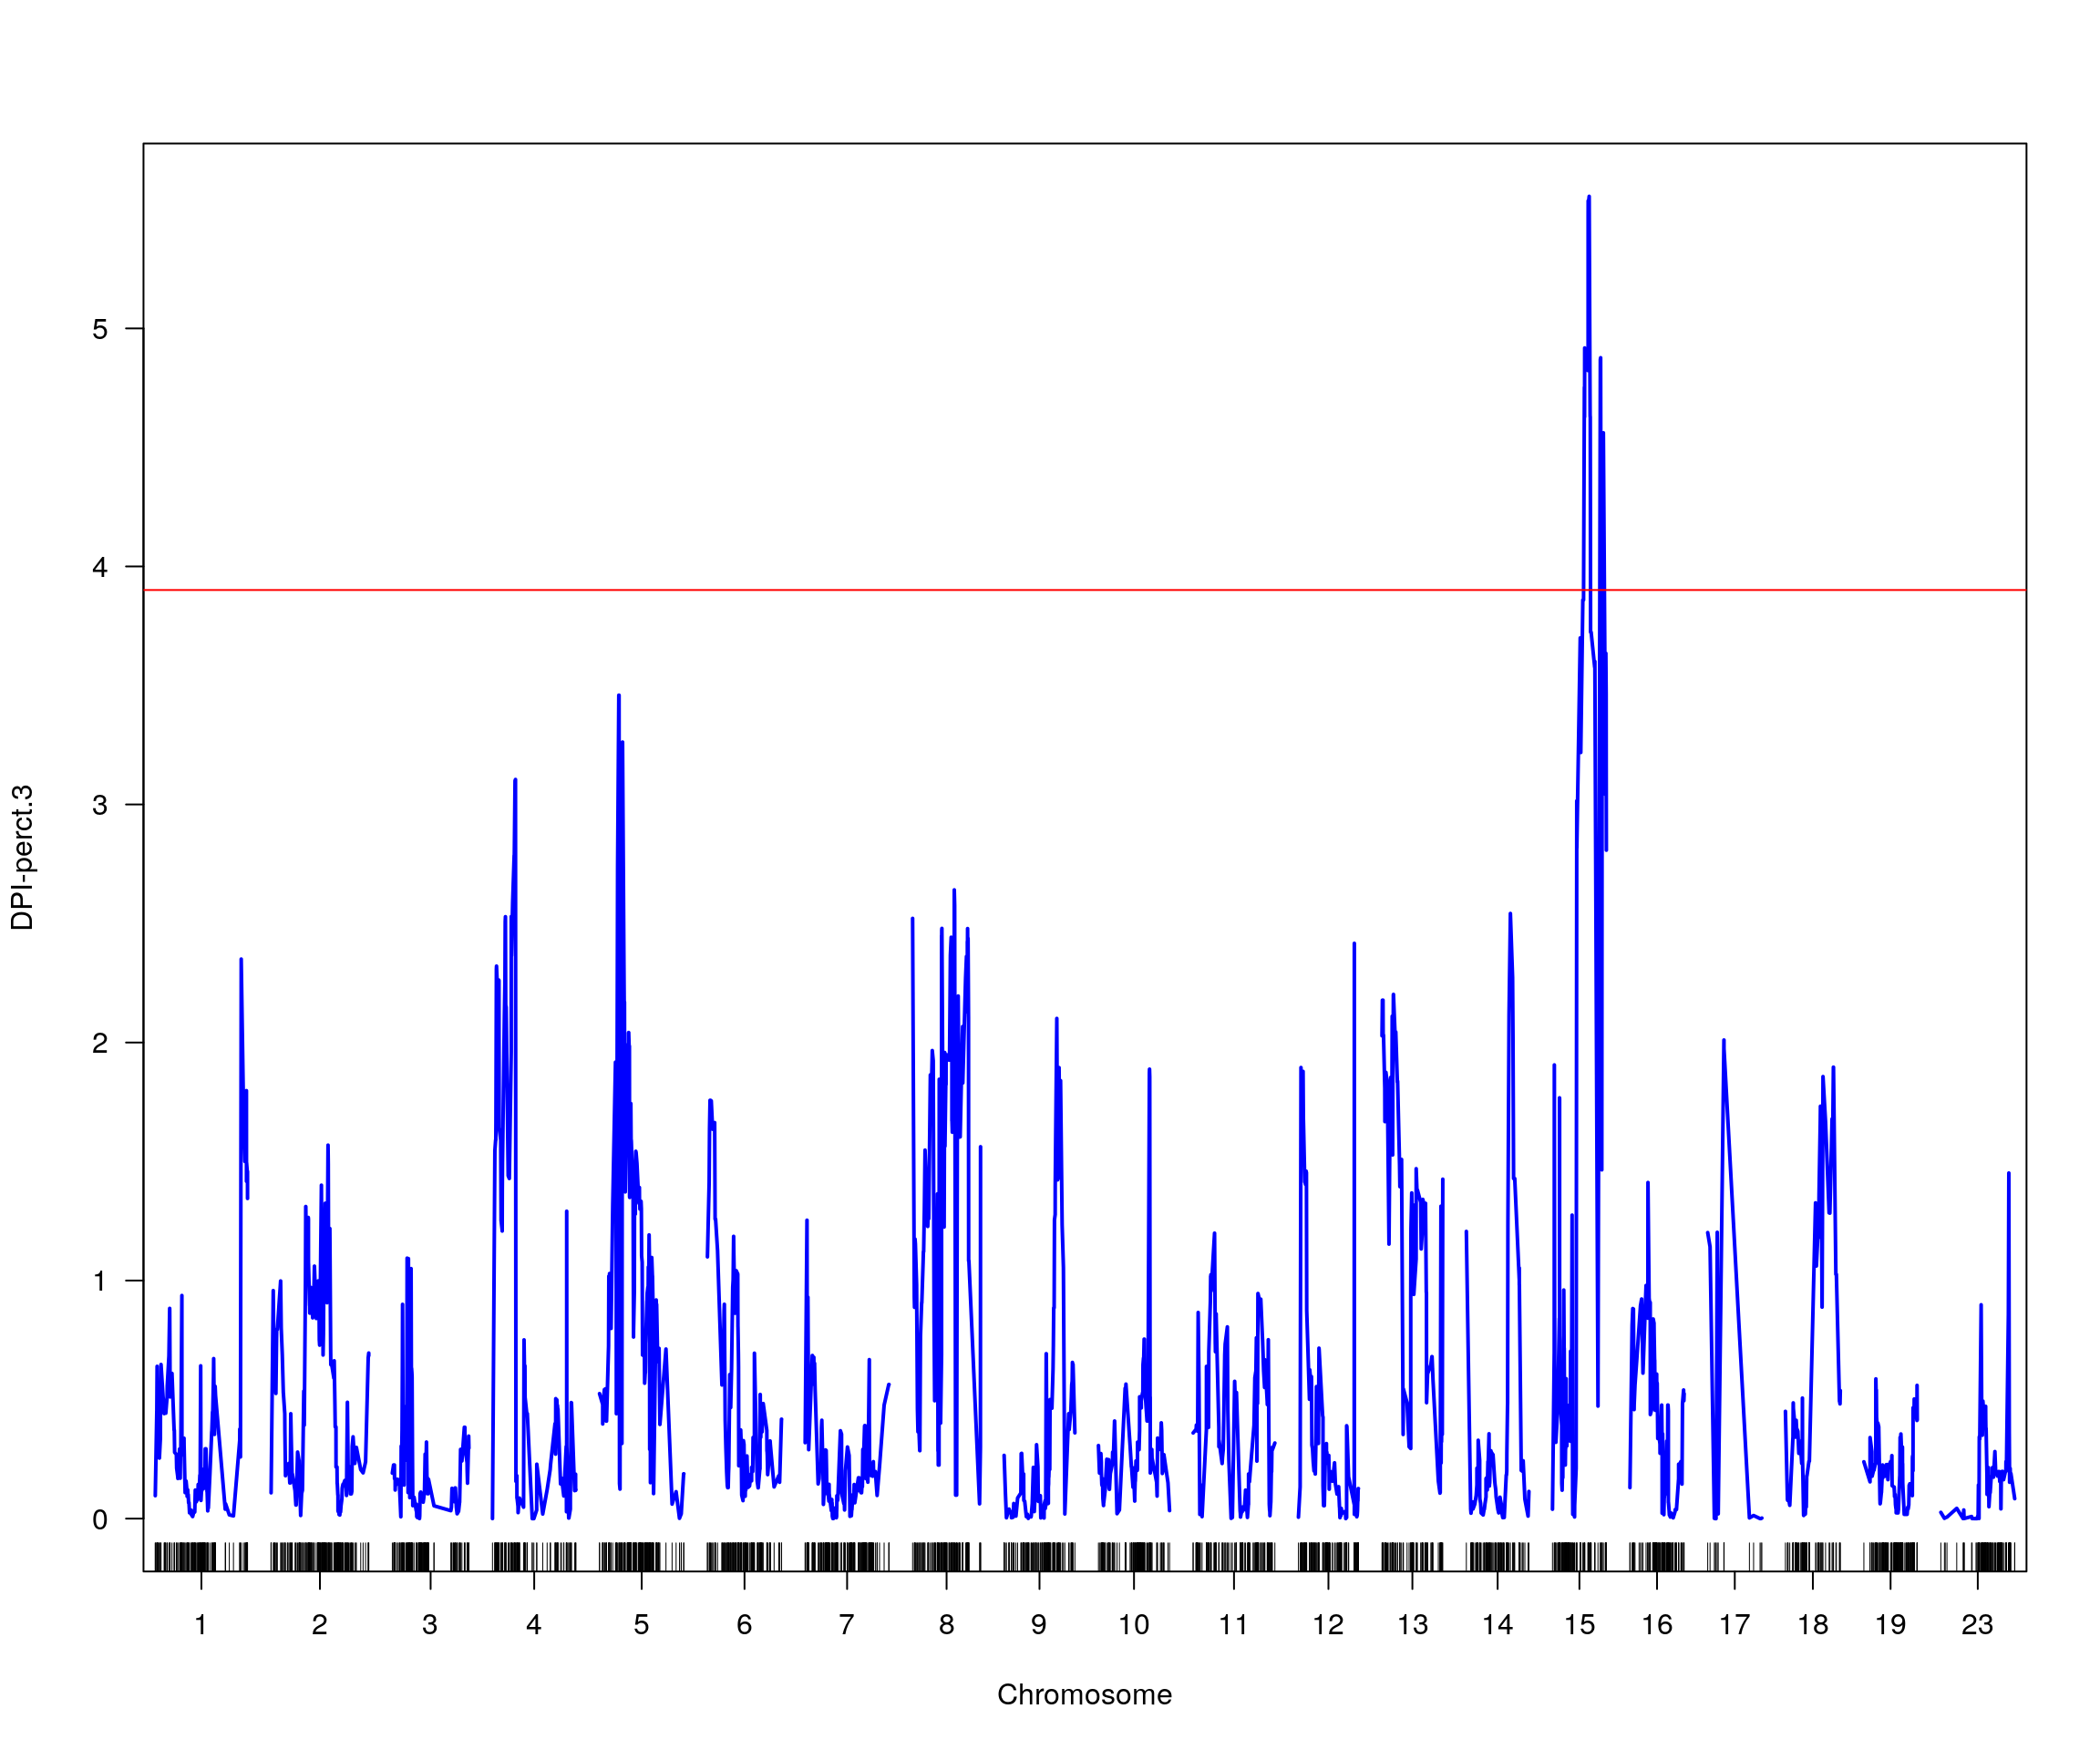
| Version | Author | Date |
|---|---|---|
| 1bf1450 | xhyuo | 2023-09-01 |
#   lodindex   lodcolumn chr    pos      lod  ci_lo ci_hi
# 1        1 DPI-perct.3  15 38.933 5.554559 32.951 56.09
# [1] "row = 1"
# [1] "pheno = 9"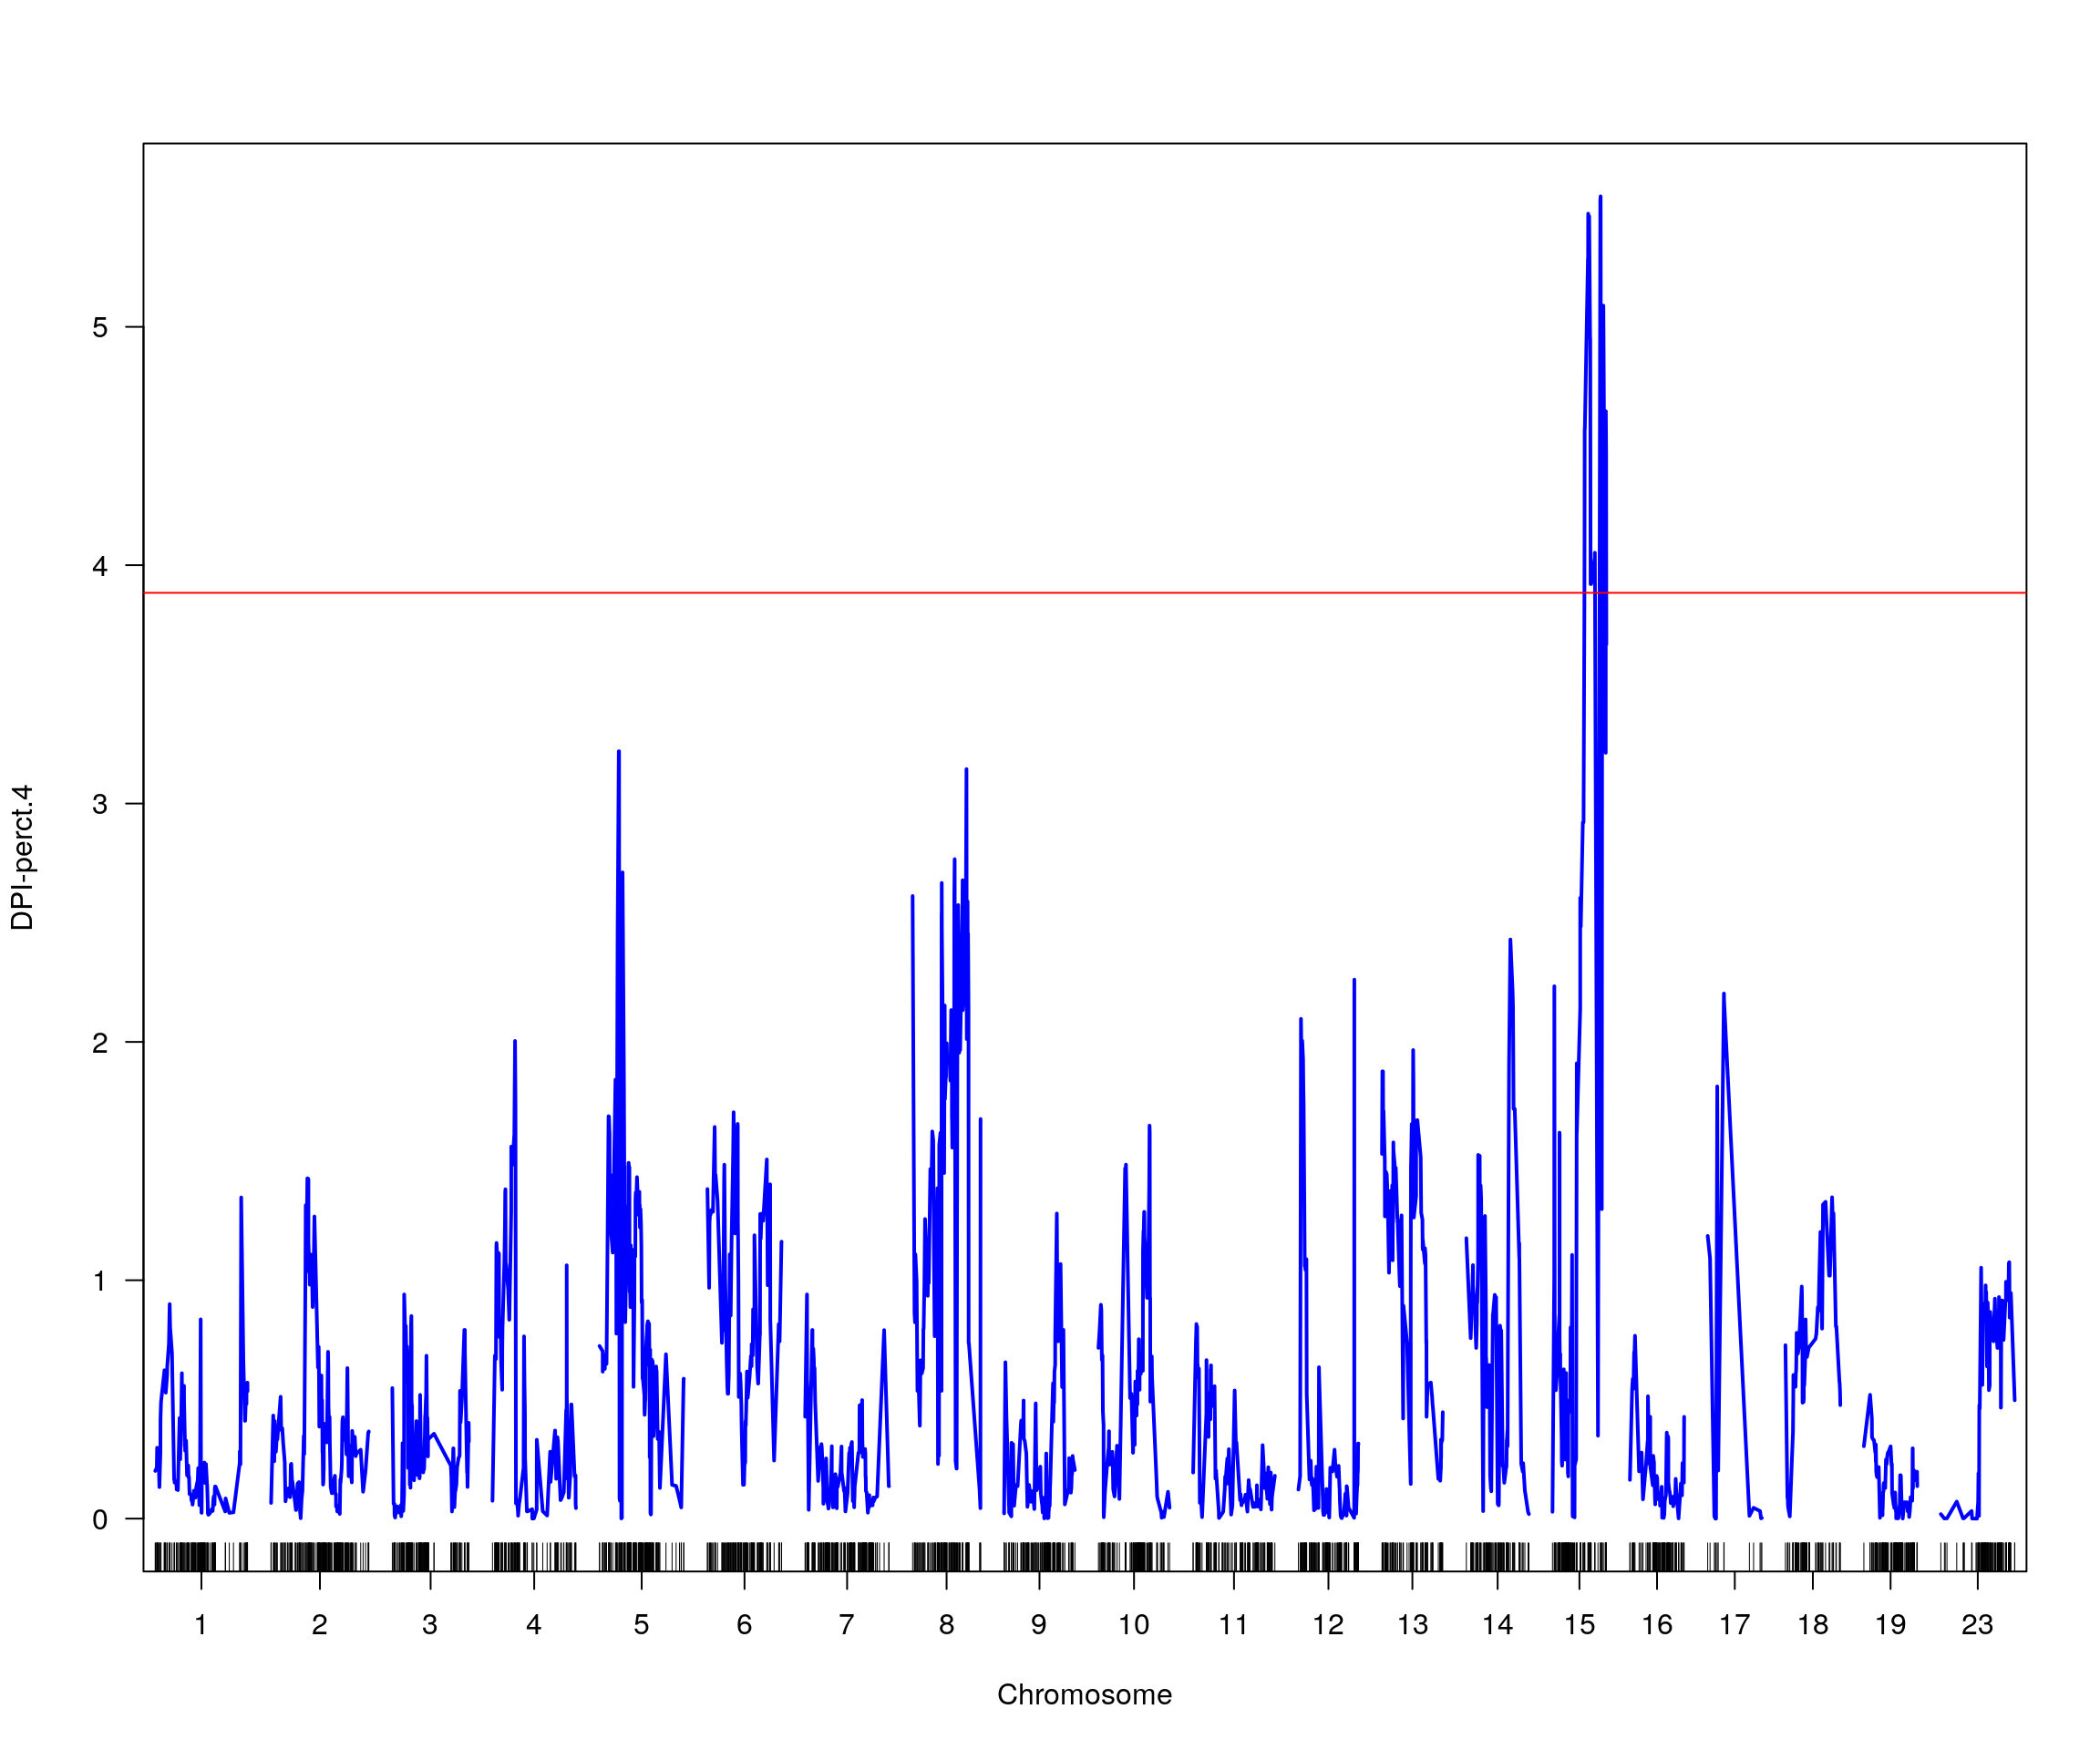
| Version | Author | Date |
|---|---|---|
| 1bf1450 | xhyuo | 2023-09-01 |
#   lodindex   lodcolumn chr    pos     lod  ci_lo  ci_hi
# 1        1 DPI-perct.4  15 51.087 5.54724 33.852 57.158
# [1] "row = 1"
variants_all <- bind_rows(variants)
#display variants_all
vroom::vroom_write(variants_all, file = "data/CC_SARS-1/variants_all.csv", delim = ",", col_names = TRUE, quote = "none", num_threads = 10)
QTL mapping conditioning on 16 locus
#pull out the top marker in out_3
out_3_peak <- find_peaks(out_3[, 3, drop = F], map = cross2$gmap, drop = 1.5)
out_3_marker <- find.marker(cross, 16, 24.456)
out_3_marker_covar = as.data.frame(pull.markers(cross, out_3_marker)$geno$`16`$data[,1, drop=F])
out_3_marker_covar_matrix = model.matrix(~gUNC26630094, out_3_marker_covar)[,-1]
out_3_condi_chr16 <- scanone(f2_qtl, pheno.col = 13, addcovar = out_3_marker_covar_matrix,
                             model = "normal", n.cluster = 10,
                             method = "mr-imp")
# Warning in checkcovar(cross, pheno.col, addcovar, intcovar, perm.strata, : Dropping 165 individuals with missing phenotypes.
out_3_condi_chr16_operm <- scanone(f2_qtl, pheno.col = 13, n.perm = 100,
                                   addcovar = out_3_marker_covar_matrix,
                                   model = "normal", n.cluster = 10,
                                   method = "mr-imp")
#  -Running permutations via a cluster of 10 nodes.
save(out_3_condi_chr16_operm, file = "data/CC_SARS-1/out_3_condi_chr16_operm.RData")
load("data/CC_SARS-2/out_3_condi_chr16_operm.RData")
summary(out_3_condi_chr16[,1:3], perms = out_3_condi_chr16_operm[,1], alpha = 0.05, pvalues = TRUE)
#             chr  pos  lod pval
# UNC26651633  16 25.7 10.4    0
summary(out_3_condi_chr16_operm[,1], alpha=c(0.05))
# LOD thresholds (100 permutations)
#    lod
# 5% 4.1
summary(out_3_condi_chr16_operm[,1], alpha=c(0.1))
# LOD thresholds (100 permutations)
#      lod
# 10% 3.78

plot(out_3_condi_chr16, col = c("red"), main = "Log10_Lung_titer_4DPI_PFU_per_ml (QTL mapping conditional on Chr16 locus)", ylab = "LOD")
add.threshold(out_3_condi_chr16, perms = out_3_condi_chr16_operm, alpha = 0.05, col="magenta")
add.threshold(out_3_condi_chr16, perms = out_3_condi_chr16_operm, alpha = 0.1, col="blue")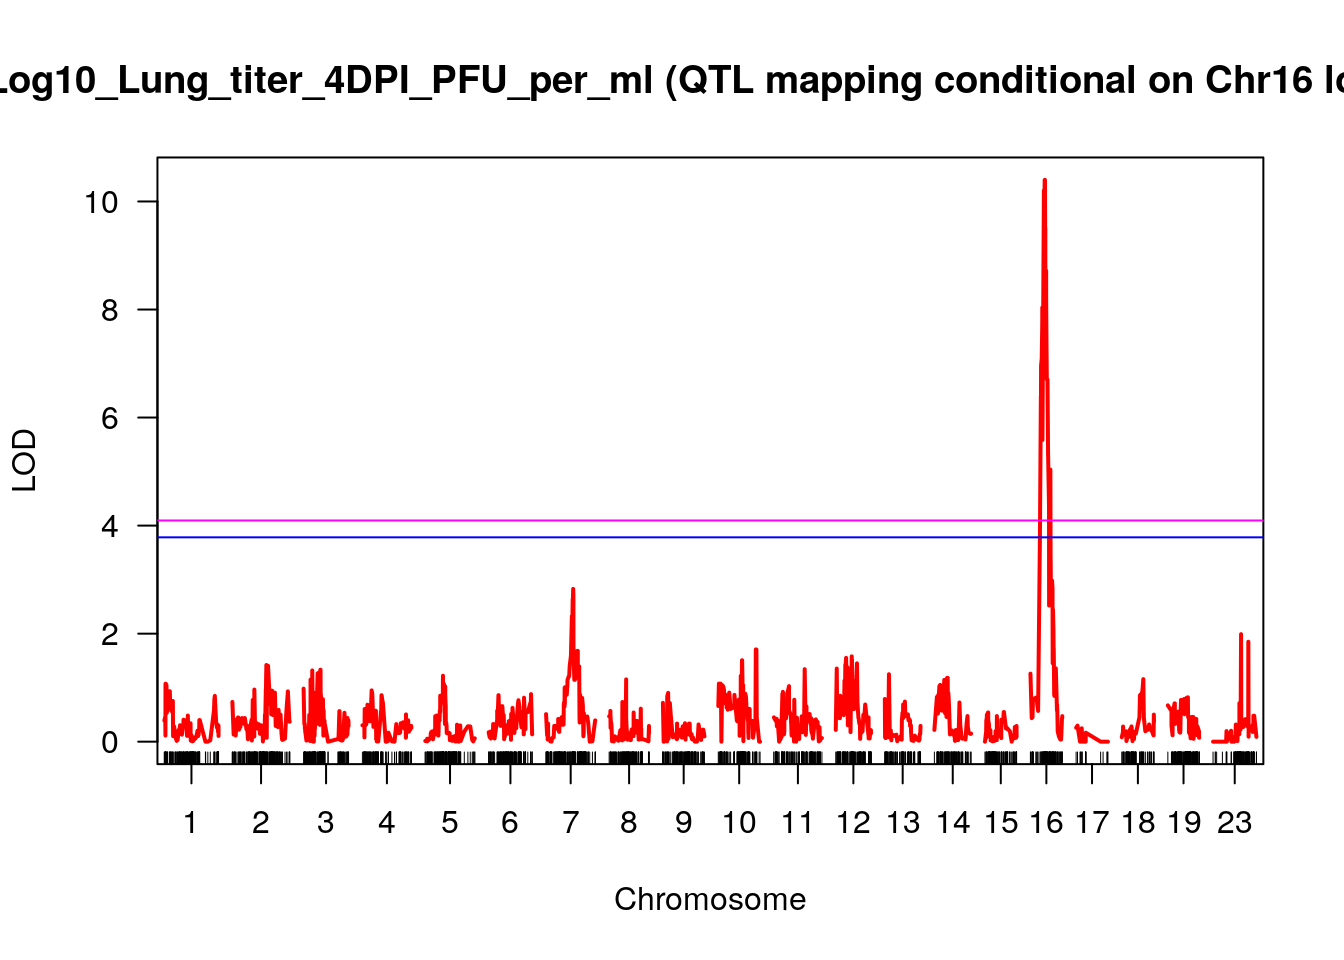
plot(out_3_condi_chr16, col = c("red"), chr = 16, ylab = "LOD")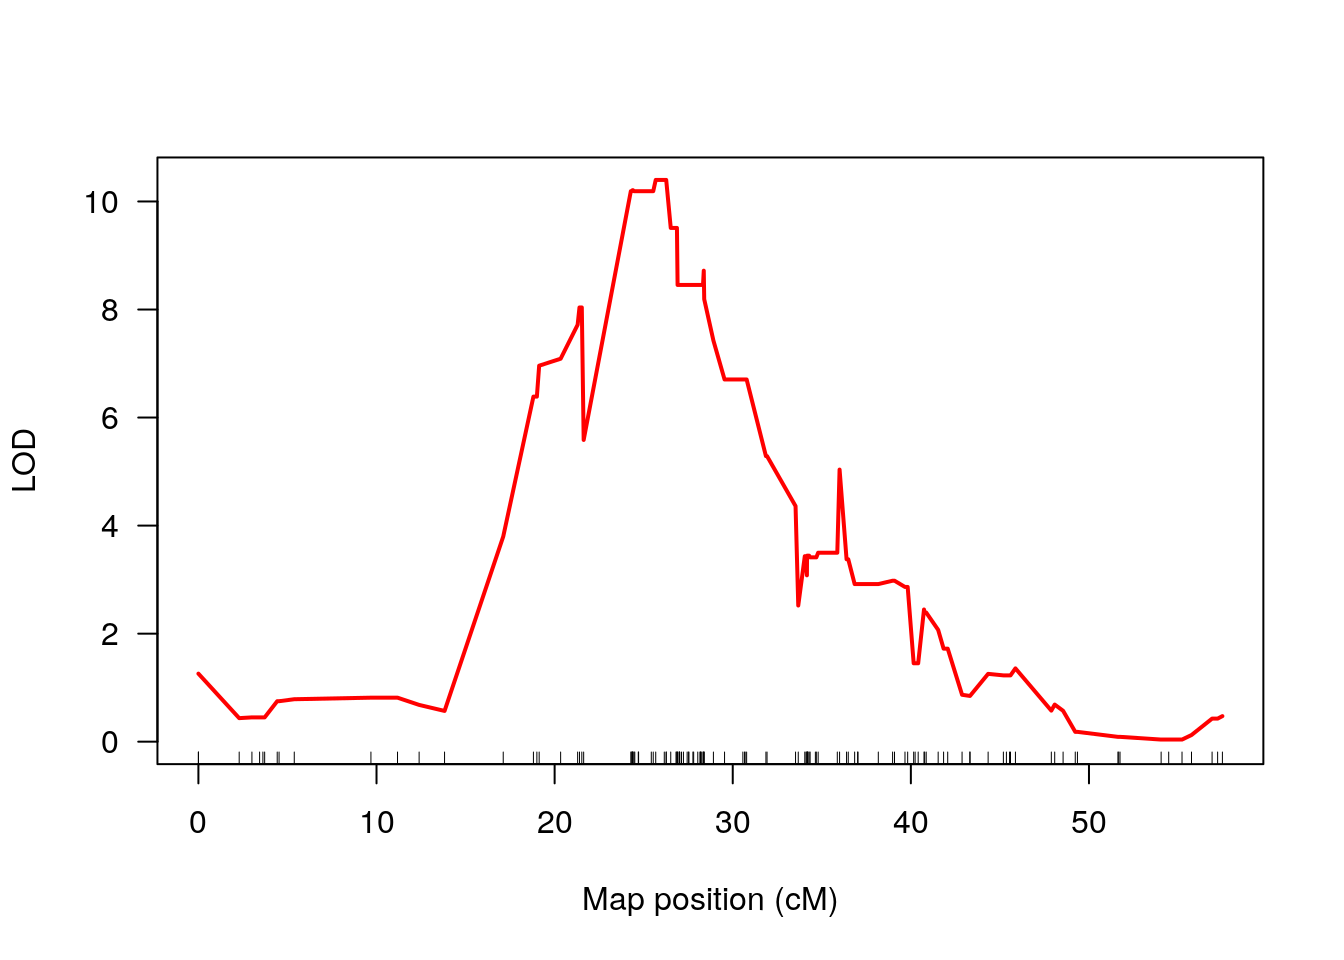
sessionInfo()
# R version 4.0.3 (2020-10-10)
# Platform: x86_64-pc-linux-gnu (64-bit)
# Running under: Ubuntu 20.04.2 LTS
#
# Matrix products: default
# BLAS/LAPACK: /usr/lib/x86_64-linux-gnu/openblas-pthread/libopenblasp-r0.3.8.so
#
# Random number generation:
#  RNG:     L'Ecuyer-CMRG
#  Normal:  Inversion
#  Sample:  Rejection
#
# locale:
#  [1] LC_CTYPE=en_US.UTF-8       LC_NUMERIC=C
#  [3] LC_TIME=en_US.UTF-8        LC_COLLATE=en_US.UTF-8
#  [5] LC_MONETARY=en_US.UTF-8    LC_MESSAGES=C
#  [7] LC_PAPER=en_US.UTF-8       LC_NAME=C
#  [9] LC_ADDRESS=C               LC_TELEPHONE=C
# [11] LC_MEASUREMENT=en_US.UTF-8 LC_IDENTIFICATION=C
#
# attached base packages:
# [1] parallel  stats     graphics  grDevices utils     datasets  methods
# [8] base
#
# other attached packages:
#  [1] vroom_1.5.4       biomaRt_2.46.3    DT_0.17           qtlcharts_0.12-10
#  [5] qtl2_0.24         broman_0.72-4     forcats_0.5.1     stringr_1.4.0
#  [9] dplyr_1.0.4       purrr_0.3.4       readr_1.4.0       tidyr_1.1.2
# [13] tibble_3.0.6      tidyverse_1.3.0   abind_1.4-5       regress_1.3-21
# [17] survival_3.2-7    qtl_1.47-9        GGally_2.1.0      gridExtra_2.3
# [21] ggplot2_3.3.3     workflowr_1.6.2
#
# loaded via a namespace (and not attached):
#  [1] fs_1.5.0             lubridate_1.7.9.2    bit64_4.0.5
#  [4] progress_1.2.2       RColorBrewer_1.1-2   httr_1.4.2
#  [7] rprojroot_2.0.2      tools_4.0.3          backports_1.2.1
# [10] R6_2.5.0             BiocGenerics_0.36.1  DBI_1.1.1
# [13] colorspace_2.0-0     withr_2.4.1          prettyunits_1.1.1
# [16] tidyselect_1.1.0     curl_4.3             bit_4.0.4
# [19] compiler_4.0.3       git2r_0.28.0         Biobase_2.50.0
# [22] cli_2.3.0            rvest_0.3.6          xml2_1.3.2
# [25] labeling_0.4.2       scales_1.1.1         askpass_1.1
# [28] rappdirs_0.3.3       digest_0.6.27        rmarkdown_2.6
# [31] pkgconfig_2.0.3      htmltools_0.5.1.1    highr_0.8
# [34] dbplyr_2.1.0         fastmap_1.1.0        htmlwidgets_1.5.3
# [37] rlang_1.0.2          readxl_1.3.1         rstudioapi_0.13
# [40] RSQLite_2.2.3        farver_2.0.3         generics_0.1.0
# [43] jsonlite_1.7.2       crosstalk_1.1.1      magrittr_2.0.1
# [46] Matrix_1.3-2         S4Vectors_0.28.1     Rcpp_1.0.6
# [49] munsell_0.5.0        lifecycle_1.0.0      stringi_1.5.3
# [52] whisker_0.4          yaml_2.2.1           BiocFileCache_1.14.0
# [55] plyr_1.8.6           grid_4.0.3           blob_1.2.1
# [58] promises_1.2.0.1     crayon_1.4.1         lattice_0.20-41
# [61] haven_2.3.1          splines_4.0.3        hms_1.0.0
# [64] knitr_1.31           pillar_1.4.7         reshape2_1.4.4
# [67] stats4_4.0.3         reprex_1.0.0         XML_3.99-0.5
# [70] glue_1.4.2           evaluate_0.14        data.table_1.13.6
# [73] modelr_0.1.8         tzdb_0.1.2           vctrs_0.3.6
# [76] httpuv_1.5.5         cellranger_1.1.0     openssl_1.4.3
# [79] gtable_0.3.0         reshape_0.8.8        assertthat_0.2.1
# [82] cachem_1.0.4         xfun_0.21            broom_0.7.4
# [85] later_1.1.0.1        IRanges_2.24.1       AnnotationDbi_1.52.0
# [88] memoise_2.0.0        ellipsis_0.3.1
This R Markdown site was created with workflowr