CC_SARS2
Hao He
2025-01-02
Last updated: 2025-01-02
Checks: 7 0
Knit directory: DO_Opioid/
This reproducible R Markdown analysis was created with workflowr (version 1.6.2). The Checks tab describes the reproducibility checks that were applied when the results were created. The Past versions tab lists the development history.
Great! Since the R Markdown file has been committed to the Git repository, you know the exact version of the code that produced these results.
Great job! The global environment was empty. Objects defined in the global environment can affect the analysis in your R Markdown file in unknown ways. For reproduciblity it’s best to always run the code in an empty environment.
The command set.seed(20200504) was run prior to running the code in the R Markdown file. Setting a seed ensures that any results that rely on randomness, e.g. subsampling or permutations, are reproducible.
Great job! Recording the operating system, R version, and package versions is critical for reproducibility.
Nice! There were no cached chunks for this analysis, so you can be confident that you successfully produced the results during this run.
Great job! Using relative paths to the files within your workflowr project makes it easier to run your code on other machines.
Great! You are using Git for version control. Tracking code development and connecting the code version to the results is critical for reproducibility.
The results in this page were generated with repository version 13ab8fe. See the Past versions tab to see a history of the changes made to the R Markdown and HTML files.
Note that you need to be careful to ensure that all relevant files for the analysis have been committed to Git prior to generating the results (you can use wflow_publish or wflow_git_commit). workflowr only checks the R Markdown file, but you know if there are other scripts or data files that it depends on. Below is the status of the Git repository when the results were generated:
Ignored files:
    Ignored:    .RData
    Ignored:    .Rhistory
    Ignored:    .Rproj.user/
    Ignored:    analysis/Picture1.png

Untracked files:
    Untracked:  Rplot_rz.png
    Untracked:  TIMBR.test.prop.bm.MN.RET.RData
    Untracked:  TIMBR.test.random.RData
    Untracked:  TIMBR.test.rz.transformed_TVb_ml.RData
    Untracked:  analysis/BOT_NTS_modQTL.R
    Untracked:  analysis/BOT_NTS_modQTL.Rout
    Untracked:  analysis/BOT_modQTL.R
    Untracked:  analysis/BOT_modQTL.sh
    Untracked:  analysis/BOT_modQTL.stderr
    Untracked:  analysis/BOT_modQTL.stdout
    Untracked:  analysis/DDO_morphine1_second_set_69k.stdout
    Untracked:  analysis/DO_Fentanyl.R
    Untracked:  analysis/DO_Fentanyl.err
    Untracked:  analysis/DO_Fentanyl.out
    Untracked:  analysis/DO_Fentanyl.sh
    Untracked:  analysis/DO_Fentanyl_69k.R
    Untracked:  analysis/DO_Fentanyl_69k.err
    Untracked:  analysis/DO_Fentanyl_69k.out
    Untracked:  analysis/DO_Fentanyl_69k.sh
    Untracked:  analysis/DO_Fentanyl_Cohort2_GCTA_herit.R
    Untracked:  analysis/DO_Fentanyl_Cohort2_gemma.R
    Untracked:  analysis/DO_Fentanyl_Cohort2_mapping.R
    Untracked:  analysis/DO_Fentanyl_Cohort2_mapping.err
    Untracked:  analysis/DO_Fentanyl_Cohort2_mapping.out
    Untracked:  analysis/DO_Fentanyl_Cohort2_mapping.sh
    Untracked:  analysis/DO_Fentanyl_GCTA_herit.R
    Untracked:  analysis/DO_Fentanyl_alternate_metrics_69k.R
    Untracked:  analysis/DO_Fentanyl_alternate_metrics_69k.err
    Untracked:  analysis/DO_Fentanyl_alternate_metrics_69k.out
    Untracked:  analysis/DO_Fentanyl_alternate_metrics_69k.sh
    Untracked:  analysis/DO_Fentanyl_alternate_metrics_array.R
    Untracked:  analysis/DO_Fentanyl_alternate_metrics_array.err
    Untracked:  analysis/DO_Fentanyl_alternate_metrics_array.out
    Untracked:  analysis/DO_Fentanyl_alternate_metrics_array.sh
    Untracked:  analysis/DO_Fentanyl_array.R
    Untracked:  analysis/DO_Fentanyl_array.err
    Untracked:  analysis/DO_Fentanyl_array.out
    Untracked:  analysis/DO_Fentanyl_array.sh
    Untracked:  analysis/DO_Fentanyl_combining2Cohort_GCTA_herit.R
    Untracked:  analysis/DO_Fentanyl_combining2Cohort_gemma.R
    Untracked:  analysis/DO_Fentanyl_combining2Cohort_mapping.R
    Untracked:  analysis/DO_Fentanyl_combining2Cohort_mapping.err
    Untracked:  analysis/DO_Fentanyl_combining2Cohort_mapping.out
    Untracked:  analysis/DO_Fentanyl_combining2Cohort_mapping.sh
    Untracked:  analysis/DO_Fentanyl_combining2Cohort_mapping_CoxPH.R
    Untracked:  analysis/DO_Fentanyl_finalreport_to_plink.sh
    Untracked:  analysis/DO_Fentanyl_gemma.R
    Untracked:  analysis/DO_Fentanyl_gemma.err
    Untracked:  analysis/DO_Fentanyl_gemma.out
    Untracked:  analysis/DO_Fentanyl_gemma.sh
    Untracked:  analysis/DO_morphine1.R
    Untracked:  analysis/DO_morphine1.Rout
    Untracked:  analysis/DO_morphine1.sh
    Untracked:  analysis/DO_morphine1.stderr
    Untracked:  analysis/DO_morphine1.stdout
    Untracked:  analysis/DO_morphine1_SNP.R
    Untracked:  analysis/DO_morphine1_SNP.Rout
    Untracked:  analysis/DO_morphine1_SNP.sh
    Untracked:  analysis/DO_morphine1_SNP.stderr
    Untracked:  analysis/DO_morphine1_SNP.stdout
    Untracked:  analysis/DO_morphine1_combined.R
    Untracked:  analysis/DO_morphine1_combined.Rout
    Untracked:  analysis/DO_morphine1_combined.sh
    Untracked:  analysis/DO_morphine1_combined.stderr
    Untracked:  analysis/DO_morphine1_combined.stdout
    Untracked:  analysis/DO_morphine1_combined_69k.R
    Untracked:  analysis/DO_morphine1_combined_69k.Rout
    Untracked:  analysis/DO_morphine1_combined_69k.sh
    Untracked:  analysis/DO_morphine1_combined_69k.stderr
    Untracked:  analysis/DO_morphine1_combined_69k.stdout
    Untracked:  analysis/DO_morphine1_combined_69k_m2.R
    Untracked:  analysis/DO_morphine1_combined_69k_m2.Rout
    Untracked:  analysis/DO_morphine1_combined_69k_m2.sh
    Untracked:  analysis/DO_morphine1_combined_69k_m2.stderr
    Untracked:  analysis/DO_morphine1_combined_69k_m2.stdout
    Untracked:  analysis/DO_morphine1_combined_weight_DOB.R
    Untracked:  analysis/DO_morphine1_combined_weight_DOB.Rout
    Untracked:  analysis/DO_morphine1_combined_weight_DOB.err
    Untracked:  analysis/DO_morphine1_combined_weight_DOB.out
    Untracked:  analysis/DO_morphine1_combined_weight_DOB.sh
    Untracked:  analysis/DO_morphine1_combined_weight_DOB.stderr
    Untracked:  analysis/DO_morphine1_combined_weight_DOB.stdout
    Untracked:  analysis/DO_morphine1_combined_weight_age.R
    Untracked:  analysis/DO_morphine1_combined_weight_age.err
    Untracked:  analysis/DO_morphine1_combined_weight_age.out
    Untracked:  analysis/DO_morphine1_combined_weight_age.sh
    Untracked:  analysis/DO_morphine1_combined_weight_age_GAMMT.R
    Untracked:  analysis/DO_morphine1_combined_weight_age_GAMMT.err
    Untracked:  analysis/DO_morphine1_combined_weight_age_GAMMT.out
    Untracked:  analysis/DO_morphine1_combined_weight_age_GAMMT.sh
    Untracked:  analysis/DO_morphine1_combined_weight_age_GAMMT_chr19.R
    Untracked:  analysis/DO_morphine1_combined_weight_age_GAMMT_chr19.err
    Untracked:  analysis/DO_morphine1_combined_weight_age_GAMMT_chr19.out
    Untracked:  analysis/DO_morphine1_combined_weight_age_GAMMT_chr19.sh
    Untracked:  analysis/DO_morphine1_cph.R
    Untracked:  analysis/DO_morphine1_cph.Rout
    Untracked:  analysis/DO_morphine1_cph.sh
    Untracked:  analysis/DO_morphine1_second_set.R
    Untracked:  analysis/DO_morphine1_second_set.Rout
    Untracked:  analysis/DO_morphine1_second_set.sh
    Untracked:  analysis/DO_morphine1_second_set.stderr
    Untracked:  analysis/DO_morphine1_second_set.stdout
    Untracked:  analysis/DO_morphine1_second_set_69k.R
    Untracked:  analysis/DO_morphine1_second_set_69k.Rout
    Untracked:  analysis/DO_morphine1_second_set_69k.sh
    Untracked:  analysis/DO_morphine1_second_set_69k.stderr
    Untracked:  analysis/DO_morphine1_second_set_SNP.R
    Untracked:  analysis/DO_morphine1_second_set_SNP.Rout
    Untracked:  analysis/DO_morphine1_second_set_SNP.sh
    Untracked:  analysis/DO_morphine1_second_set_SNP.stderr
    Untracked:  analysis/DO_morphine1_second_set_SNP.stdout
    Untracked:  analysis/DO_morphine1_second_set_weight_DOB.R
    Untracked:  analysis/DO_morphine1_second_set_weight_DOB.Rout
    Untracked:  analysis/DO_morphine1_second_set_weight_DOB.err
    Untracked:  analysis/DO_morphine1_second_set_weight_DOB.out
    Untracked:  analysis/DO_morphine1_second_set_weight_DOB.sh
    Untracked:  analysis/DO_morphine1_second_set_weight_DOB.stderr
    Untracked:  analysis/DO_morphine1_second_set_weight_DOB.stdout
    Untracked:  analysis/DO_morphine1_second_set_weight_age.R
    Untracked:  analysis/DO_morphine1_second_set_weight_age.Rout
    Untracked:  analysis/DO_morphine1_second_set_weight_age.err
    Untracked:  analysis/DO_morphine1_second_set_weight_age.out
    Untracked:  analysis/DO_morphine1_second_set_weight_age.sh
    Untracked:  analysis/DO_morphine1_second_set_weight_age.stderr
    Untracked:  analysis/DO_morphine1_second_set_weight_age.stdout
    Untracked:  analysis/DO_morphine1_weight_DOB.R
    Untracked:  analysis/DO_morphine1_weight_DOB.sh
    Untracked:  analysis/DO_morphine1_weight_age.R
    Untracked:  analysis/DO_morphine1_weight_age.sh
    Untracked:  analysis/DO_morphine_gemma.R
    Untracked:  analysis/DO_morphine_gemma.err
    Untracked:  analysis/DO_morphine_gemma.out
    Untracked:  analysis/DO_morphine_gemma.sh
    Untracked:  analysis/DO_morphine_gemma_firstmin.R
    Untracked:  analysis/DO_morphine_gemma_firstmin.err
    Untracked:  analysis/DO_morphine_gemma_firstmin.out
    Untracked:  analysis/DO_morphine_gemma_firstmin.sh
    Untracked:  analysis/DO_morphine_gemma_withpermu.R
    Untracked:  analysis/DO_morphine_gemma_withpermu.err
    Untracked:  analysis/DO_morphine_gemma_withpermu.out
    Untracked:  analysis/DO_morphine_gemma_withpermu.sh
    Untracked:  analysis/DO_morphine_gemma_withpermu_firstbatch_min.depression.R
    Untracked:  analysis/DO_morphine_gemma_withpermu_firstbatch_min.depression.err
    Untracked:  analysis/DO_morphine_gemma_withpermu_firstbatch_min.depression.out
    Untracked:  analysis/DO_morphine_gemma_withpermu_firstbatch_min.depression.sh
    Untracked:  analysis/Lisa_Tarantino_Interval_needs_mvar_annotation.R
    Untracked:  analysis/NTS_modQTL.R
    Untracked:  analysis/NTS_modQTL.sh
    Untracked:  analysis/NTS_modQTL.stderr
    Untracked:  analysis/NTS_modQTL.stdout
    Untracked:  analysis/PMCA.Rmd
    Untracked:  analysis/Plot_DO_morphine1_SNP.R
    Untracked:  analysis/Plot_DO_morphine1_SNP.Rout
    Untracked:  analysis/Plot_DO_morphine1_SNP.sh
    Untracked:  analysis/Plot_DO_morphine1_SNP.stderr
    Untracked:  analysis/Plot_DO_morphine1_SNP.stdout
    Untracked:  analysis/Plot_DO_morphine1_second_set_SNP.R
    Untracked:  analysis/Plot_DO_morphine1_second_set_SNP.Rout
    Untracked:  analysis/Plot_DO_morphine1_second_set_SNP.sh
    Untracked:  analysis/Plot_DO_morphine1_second_set_SNP.stderr
    Untracked:  analysis/Plot_DO_morphine1_second_set_SNP.stdout
    Untracked:  analysis/combined_modQTL.R
    Untracked:  analysis/combined_modQTL.sh
    Untracked:  analysis/combined_modQTL.stderr
    Untracked:  analysis/combined_modQTL.stdout
    Untracked:  analysis/download_GSE100356_sra.sh
    Untracked:  analysis/fentanyl_2cohorts_coxph.R
    Untracked:  analysis/fentanyl_2cohorts_coxph.err
    Untracked:  analysis/fentanyl_2cohorts_coxph.out
    Untracked:  analysis/fentanyl_2cohorts_coxph.sh
    Untracked:  analysis/fentanyl_scanone.cph.R
    Untracked:  analysis/fentanyl_scanone.cph.err
    Untracked:  analysis/fentanyl_scanone.cph.out
    Untracked:  analysis/fentanyl_scanone.cph.sh
    Untracked:  analysis/geo_rnaseq.R
    Untracked:  analysis/heritability_first_second_batch.R
    Untracked:  analysis/morphine_fentanyl_survival_time.R
    Untracked:  analysis/mvar_annotation.R
    Untracked:  analysis/mvar_annotation.Rout
    Untracked:  analysis/nf-rnaseq-b6.R
    Untracked:  analysis/pipeline_qtl2.R
    Untracked:  analysis/plot_fentanyl_2cohorts_coxph.R
    Untracked:  analysis/scripts/
    Untracked:  analysis/tibmr.R
    Untracked:  analysis/timbr_demo.R
    Untracked:  analysis/upset.R
    Untracked:  analysis/workflow_proc.R
    Untracked:  analysis/workflow_proc.sh
    Untracked:  analysis/workflow_proc.stderr
    Untracked:  analysis/workflow_proc.stdout
    Untracked:  analysis/x.R
    Untracked:  analysis/~.sh
    Untracked:  check_do.R
    Untracked:  code/PLINKtoCSVR.R
    Untracked:  code/additive_scan1_HPC.R
    Untracked:  code/cfw/
    Untracked:  code/combine_adjacency_matrices.R
    Untracked:  code/extract_edgelist_from_adjacency.R
    Untracked:  code/fit_lm_function.R
    Untracked:  code/gather_scan1_chunks.R
    Untracked:  code/gemma_plot.R
    Untracked:  code/get_edgelist.R
    Untracked:  code/process.sanger.snp.R
    Untracked:  code/reconst_utils.R
    Untracked:  code/scan1_permutation_HPC.R
    Untracked:  code/scan1_pvalue_ciseqtl.HPC.R
    Untracked:  code/utils.R
    Untracked:  complete_traits_20241212.csv
    Untracked:  data/69k_grid_pgmap.RData
    Untracked:  data/BOT_NTS_rnaseq_results/
    Untracked:  data/CC_SARS-1/
    Untracked:  data/CC_SARS-2/
    Untracked:  data/Composite Post Kevins Program Group 2 Fentanyl Prepped for Hao.xlsx
    Untracked:  data/Current CHr 11 Complete Query.csv
    Untracked:  data/DO_WBP_Data_JAB_to_map.xlsx
    Untracked:  data/DO_new_traits/
    Untracked:  data/Data_repository_Bubier/
    Untracked:  data/Fentanyl_alternate_metrics.xlsx
    Untracked:  data/FinalReport/
    Untracked:  data/GM/
    Untracked:  data/GM_covar.csv
    Untracked:  data/GM_covar_07092018_morphine.csv
    Untracked:  data/Jackson_Lab_Bubier_MURGIGV01/
    Untracked:  data/Lisa Tarantino Interval needs mvar.xlsx
    Untracked:  data/Lisa_Tarantino_Interval_needs_mvar_annotation.csv
    Untracked:  data/MPD_Upload_October.csv
    Untracked:  data/MPD_Upload_October_updated_sex.csv
    Untracked:  data/Master Fentanyl DO Study Sheet.xlsx
    Untracked:  data/MasterMorphine Second Set DO w DOB2.xlsx
    Untracked:  data/MasterMorphine Second Set DO.xlsx
    Untracked:  data/Morphine CC DO mice Updated with Published inbred strains.csv
    Untracked:  data/Morphine_CC_DO_mice_Updated_with_Published_inbred_strains.csv
    Untracked:  data/cc_variants.sqlite
    Untracked:  data/combined/
    Untracked:  data/fentanyl/
    Untracked:  data/fentanyl2/
    Untracked:  data/fentanyl_1_2/
    Untracked:  data/fentanyl_2cohorts_coxph_data.Rdata
    Untracked:  data/first/
    Untracked:  data/founder_geno.csv
    Untracked:  data/genetic_map.csv
    Untracked:  data/gm.json
    Untracked:  data/gwas.sh
    Untracked:  data/marker_grid_0.02cM_plus.txt
    Untracked:  data/metabolomics_mouse_fecal/
    Untracked:  data/mouse_genes_mgi.sqlite
    Untracked:  data/pheno.csv
    Untracked:  data/pheno_qtl2.csv
    Untracked:  data/pheno_qtl2_07092018_morphine.csv
    Untracked:  data/pheno_qtl2_w_dob.csv
    Untracked:  data/physical_map.csv
    Untracked:  data/rnaseq/
    Untracked:  data/sample_geno.csv
    Untracked:  data/second/
    Untracked:  figure/
    Untracked:  glimma-plots/
    Untracked:  head.pdf
    Untracked:  output/DO_Fentanyl_Cohort2_MinDepressionRR_coefplot.pdf
    Untracked:  output/DO_Fentanyl_Cohort2_MinDepressionRR_coefplot_blup.pdf
    Untracked:  output/DO_Fentanyl_Cohort2_RRDepressionRateHrSLOPE_coefplot.pdf
    Untracked:  output/DO_Fentanyl_Cohort2_RRRecoveryRateHrSLOPE_coefplot.pdf
    Untracked:  output/DO_Fentanyl_Cohort2_RRRecoveryRateHrSLOPE_coefplot_blup.pdf
    Untracked:  output/DO_Fentanyl_Cohort2_StartofRecoveryHr_coefplot.pdf
    Untracked:  output/DO_Fentanyl_Cohort2_StartofRecoveryHr_coefplot_blup.pdf
    Untracked:  output/DO_Fentanyl_Cohort2_Statusbin_coefplot.pdf
    Untracked:  output/DO_Fentanyl_Cohort2_Statusbin_coefplot_blup.pdf
    Untracked:  output/DO_Fentanyl_Cohort2_SteadyStateDepressionDurationHrINTERVAL_coefplot.pdf
    Untracked:  output/DO_Fentanyl_Cohort2_TimetoDead(Hr)_coefplot.pdf
    Untracked:  output/DO_Fentanyl_Cohort2_TimetoDeadHr_coefplot.pdf
    Untracked:  output/DO_Fentanyl_Cohort2_TimetoDeadHr_coefplot_blup.pdf
    Untracked:  output/DO_Fentanyl_Cohort2_TimetoProjectedRecoveryHr_coefplot.pdf
    Untracked:  output/DO_Fentanyl_Cohort2_TimetoProjectedRecoveryHr_coefplot_blup.pdf
    Untracked:  output/DO_Fentanyl_Cohort2_TimetoSteadyRRDepression(Hr)_coefplot.pdf
    Untracked:  output/DO_Fentanyl_Cohort2_TimetoSteadyRRDepressionHr_coefplot.pdf
    Untracked:  output/DO_Fentanyl_Cohort2_TimetoSteadyRRDepressionHr_coefplot_blup.pdf
    Untracked:  output/DO_Fentanyl_Cohort2_TimetoThresholdRecoveryHr_coefplot.pdf
    Untracked:  output/DO_Fentanyl_Cohort2_TimetoThresholdRecoveryHr_coefplot_blup.pdf
    Untracked:  output/DO_morphine_Min.depression.png
    Untracked:  output/DO_morphine_Min.depression22222_violin_chr5.pdf
    Untracked:  output/DO_morphine_Min.depression_coefplot.pdf
    Untracked:  output/DO_morphine_Min.depression_coefplot_blup.pdf
    Untracked:  output/DO_morphine_Min.depression_coefplot_blup_chr5.png
    Untracked:  output/DO_morphine_Min.depression_coefplot_blup_chrX.png
    Untracked:  output/DO_morphine_Min.depression_coefplot_chr5.png
    Untracked:  output/DO_morphine_Min.depression_coefplot_chrX.png
    Untracked:  output/DO_morphine_Min.depression_peak_genes_chr5.png
    Untracked:  output/DO_morphine_Min.depression_violin_chr5.png
    Untracked:  output/DO_morphine_Recovery.Time.png
    Untracked:  output/DO_morphine_Recovery.Time_coefplot.pdf
    Untracked:  output/DO_morphine_Recovery.Time_coefplot_blup.pdf
    Untracked:  output/DO_morphine_Recovery.Time_coefplot_blup_chr11.png
    Untracked:  output/DO_morphine_Recovery.Time_coefplot_blup_chr4.png
    Untracked:  output/DO_morphine_Recovery.Time_coefplot_blup_chr7.png
    Untracked:  output/DO_morphine_Recovery.Time_coefplot_blup_chr9.png
    Untracked:  output/DO_morphine_Recovery.Time_coefplot_chr11.png
    Untracked:  output/DO_morphine_Recovery.Time_coefplot_chr4.png
    Untracked:  output/DO_morphine_Recovery.Time_coefplot_chr7.png
    Untracked:  output/DO_morphine_Recovery.Time_coefplot_chr9.png
    Untracked:  output/DO_morphine_Status_bin.png
    Untracked:  output/DO_morphine_Status_bin_coefplot.pdf
    Untracked:  output/DO_morphine_Status_bin_coefplot_blup.pdf
    Untracked:  output/DO_morphine_Survival.Time.png
    Untracked:  output/DO_morphine_Survival.Time_coefplot.pdf
    Untracked:  output/DO_morphine_Survival.Time_coefplot_blup.pdf
    Untracked:  output/DO_morphine_Survival.Time_coefplot_blup_chr17.png
    Untracked:  output/DO_morphine_Survival.Time_coefplot_blup_chr8.png
    Untracked:  output/DO_morphine_Survival.Time_coefplot_chr17.png
    Untracked:  output/DO_morphine_Survival.Time_coefplot_chr8.png
    Untracked:  output/DO_morphine_combine_batch_peak_violin.pdf
    Untracked:  output/DO_morphine_combined_69k_m2_Min.depression.png
    Untracked:  output/DO_morphine_combined_69k_m2_Min.depression_coefplot.pdf
    Untracked:  output/DO_morphine_combined_69k_m2_Min.depression_coefplot_blup.pdf
    Untracked:  output/DO_morphine_combined_69k_m2_Recovery.Time.png
    Untracked:  output/DO_morphine_combined_69k_m2_Recovery.Time_coefplot.pdf
    Untracked:  output/DO_morphine_combined_69k_m2_Recovery.Time_coefplot_blup.pdf
    Untracked:  output/DO_morphine_combined_69k_m2_Status_bin.png
    Untracked:  output/DO_morphine_combined_69k_m2_Status_bin_coefplot.pdf
    Untracked:  output/DO_morphine_combined_69k_m2_Status_bin_coefplot_blup.pdf
    Untracked:  output/DO_morphine_combined_69k_m2_Survival.Time.png
    Untracked:  output/DO_morphine_combined_69k_m2_Survival.Time_coefplot.pdf
    Untracked:  output/DO_morphine_combined_69k_m2_Survival.Time_coefplot_blup.pdf
    Untracked:  output/DO_morphine_coxph_24hrs_kinship_QTL.png
    Untracked:  output/DO_morphine_cphout.RData
    Untracked:  output/DO_morphine_first_batch_peak_in_second_batch_violin.pdf
    Untracked:  output/DO_morphine_first_batch_peak_in_second_batch_violin_sidebyside.pdf
    Untracked:  output/DO_morphine_first_batch_peak_violin.pdf
    Untracked:  output/DO_morphine_operm.cph.RData
    Untracked:  output/DO_morphine_second_batch_on_first_batch_peak_violin.pdf
    Untracked:  output/DO_morphine_second_batch_peak_ch6surv_on_first_batchviolin.pdf
    Untracked:  output/DO_morphine_second_batch_peak_ch6surv_on_first_batchviolin2.pdf
    Untracked:  output/DO_morphine_second_batch_peak_in_first_batch_violin.pdf
    Untracked:  output/DO_morphine_second_batch_peak_in_first_batch_violin_sidebyside.pdf
    Untracked:  output/DO_morphine_second_batch_peak_violin.pdf
    Untracked:  output/DO_morphine_secondbatch_69k_Min.depression.png
    Untracked:  output/DO_morphine_secondbatch_69k_Min.depression_coefplot.pdf
    Untracked:  output/DO_morphine_secondbatch_69k_Min.depression_coefplot_blup.pdf
    Untracked:  output/DO_morphine_secondbatch_69k_Recovery.Time.png
    Untracked:  output/DO_morphine_secondbatch_69k_Recovery.Time_coefplot.pdf
    Untracked:  output/DO_morphine_secondbatch_69k_Recovery.Time_coefplot_blup.pdf
    Untracked:  output/DO_morphine_secondbatch_69k_Status_bin.png
    Untracked:  output/DO_morphine_secondbatch_69k_Status_bin_coefplot.pdf
    Untracked:  output/DO_morphine_secondbatch_69k_Status_bin_coefplot_blup.pdf
    Untracked:  output/DO_morphine_secondbatch_69k_Survival.Time.png
    Untracked:  output/DO_morphine_secondbatch_69k_Survival.Time_coefplot.pdf
    Untracked:  output/DO_morphine_secondbatch_69k_Survival.Time_coefplot_blup.pdf
    Untracked:  output/DO_morphine_secondbatch_Min.depression.png
    Untracked:  output/DO_morphine_secondbatch_Min.depression_coefplot.pdf
    Untracked:  output/DO_morphine_secondbatch_Min.depression_coefplot_blup.pdf
    Untracked:  output/DO_morphine_secondbatch_Recovery.Time.png
    Untracked:  output/DO_morphine_secondbatch_Recovery.Time_coefplot.pdf
    Untracked:  output/DO_morphine_secondbatch_Recovery.Time_coefplot_blup.pdf
    Untracked:  output/DO_morphine_secondbatch_Status_bin.png
    Untracked:  output/DO_morphine_secondbatch_Status_bin_coefplot.pdf
    Untracked:  output/DO_morphine_secondbatch_Status_bin_coefplot_blup.pdf
    Untracked:  output/DO_morphine_secondbatch_Survival.Time.png
    Untracked:  output/DO_morphine_secondbatch_Survival.Time_coefplot.pdf
    Untracked:  output/DO_morphine_secondbatch_Survival.Time_coefplot_blup.pdf
    Untracked:  output/Fentanyl/
    Untracked:  output/KPNA3.pdf
    Untracked:  output/PMCA/
    Untracked:  output/SSC4D.pdf
    Untracked:  output/TIMBR.test.RData
    Untracked:  output/apr_69kchr_combined.RData
    Untracked:  output/apr_69kchr_k_loco_combined.rds
    Untracked:  output/apr_69kchr_second_set.RData
    Untracked:  output/combine_batch_variation.RData
    Untracked:  output/combined_gm.RData
    Untracked:  output/combined_gm.k_loco.rds
    Untracked:  output/combined_gm.k_overall.rds
    Untracked:  output/combined_gm.probs_8state.rds
    Untracked:  output/coxph/
    Untracked:  output/do.morphine.RData
    Untracked:  output/do.morphine.k_loco.rds
    Untracked:  output/do.morphine.probs_36state.rds
    Untracked:  output/do.morphine.probs_8state.rds
    Untracked:  output/do_Fentanyl_combine2cohort_MeanDepressionBR_coefplot.pdf
    Untracked:  output/do_Fentanyl_combine2cohort_MeanDepressionBR_coefplot_blup.pdf
    Untracked:  output/do_Fentanyl_combine2cohort_MinDepressionBR_coefplot.pdf
    Untracked:  output/do_Fentanyl_combine2cohort_MinDepressionBR_coefplot_blup.pdf
    Untracked:  output/do_Fentanyl_combine2cohort_MinDepressionRR_coefplot.pdf
    Untracked:  output/do_Fentanyl_combine2cohort_MinDepressionRR_coefplot_blup.pdf
    Untracked:  output/do_Fentanyl_combine2cohort_RRRecoveryRateHr_coefplot.pdf
    Untracked:  output/do_Fentanyl_combine2cohort_RRRecoveryRateHr_coefplot_blup.pdf
    Untracked:  output/do_Fentanyl_combine2cohort_StartofRecoveryHr_coefplot.pdf
    Untracked:  output/do_Fentanyl_combine2cohort_StartofRecoveryHr_coefplot_blup.pdf
    Untracked:  output/do_Fentanyl_combine2cohort_Statusbin_coefplot.pdf
    Untracked:  output/do_Fentanyl_combine2cohort_Statusbin_coefplot_blup.pdf
    Untracked:  output/do_Fentanyl_combine2cohort_SteadyStateDepressionDurationHr_coefplot.pdf
    Untracked:  output/do_Fentanyl_combine2cohort_SteadyStateDepressionDurationHr_coefplot_blup.pdf
    Untracked:  output/do_Fentanyl_combine2cohort_SurvivalTime_coefplot.pdf
    Untracked:  output/do_Fentanyl_combine2cohort_SurvivalTime_coefplot_blup.pdf
    Untracked:  output/do_Fentanyl_combine2cohort_TimetoDeadHr_coefplot.pdf
    Untracked:  output/do_Fentanyl_combine2cohort_TimetoDeadHr_coefplot_blup.pdf
    Untracked:  output/do_Fentanyl_combine2cohort_TimetoMostlyDeadHr_coefplot.pdf
    Untracked:  output/do_Fentanyl_combine2cohort_TimetoMostlyDeadHr_coefplot_blup.pdf
    Untracked:  output/do_Fentanyl_combine2cohort_TimetoProjectedRecoveryHr_coefplot.pdf
    Untracked:  output/do_Fentanyl_combine2cohort_TimetoProjectedRecoveryHr_coefplot_blup.pdf
    Untracked:  output/do_Fentanyl_combine2cohort_TimetoRecoveryHr_coefplot.pdf
    Untracked:  output/do_Fentanyl_combine2cohort_TimetoRecoveryHr_coefplot_blup.pdf
    Untracked:  output/first_batch_variation.RData
    Untracked:  output/first_second_survival_peak_chr.xlsx
    Untracked:  output/hsq_1_first_batch_herit_qtl2.RData
    Untracked:  output/hsq_2_second_batch_herit_qtl2.RData
    Untracked:  output/meta.csv
    Untracked:  output/morphine_fentanyl_survival_time.pdf
    Untracked:  output/old_temp/
    Untracked:  output/out_1_operm.RData
    Untracked:  output/pr_69kchr_combined.RData
    Untracked:  output/pr_69kchr_second_set.RData
    Untracked:  output/qtl.morphine.69k.out.combined.RData
    Untracked:  output/qtl.morphine.69k.out.combined_m2.RData
    Untracked:  output/qtl.morphine.69k.out.second_set.RData
    Untracked:  output/qtl.morphine.operm.RData
    Untracked:  output/qtl.morphine.out.RData
    Untracked:  output/qtl.morphine.out.combined_gm.RData
    Untracked:  output/qtl.morphine.out.combined_gm.female.RData
    Untracked:  output/qtl.morphine.out.combined_gm.male.RData
    Untracked:  output/qtl.morphine.out.combined_weight_DOB.RData
    Untracked:  output/qtl.morphine.out.combined_weight_age.RData
    Untracked:  output/qtl.morphine.out.female.RData
    Untracked:  output/qtl.morphine.out.male.RData
    Untracked:  output/qtl.morphine.out.second_set.RData
    Untracked:  output/qtl.morphine.out.second_set.female.RData
    Untracked:  output/qtl.morphine.out.second_set.male.RData
    Untracked:  output/qtl.morphine.out.second_set.weight_DOB.RData
    Untracked:  output/qtl.morphine.out.second_set.weight_age.RData
    Untracked:  output/qtl.morphine.out.weight_DOB.RData
    Untracked:  output/qtl.morphine.out.weight_age.RData
    Untracked:  output/qtl.morphine1.snpout.RData
    Untracked:  output/qtl.morphine2.snpout.RData
    Untracked:  output/sample_all_infor.csv
    Untracked:  output/sample_all_infor.txt
    Untracked:  output/second_batch_pheno.csv
    Untracked:  output/second_batch_variation.RData
    Untracked:  output/second_set_apr_69kchr_k_loco.rds
    Untracked:  output/second_set_gm.RData
    Untracked:  output/second_set_gm.k_loco.rds
    Untracked:  output/second_set_gm.probs_36state.rds
    Untracked:  output/second_set_gm.probs_8state.rds
    Untracked:  output/topSNP_chr5_mindepression.csv
    Untracked:  output/zoompeak_Min.depression_9.pdf
    Untracked:  output/zoompeak_Recovery.Time_16.pdf
    Untracked:  output/zoompeak_Status_bin_11.pdf
    Untracked:  output/zoompeak_Survival.Time_1.pdf
    Untracked:  output/zoompeak_fentanyl_Survival.Time_2.pdf
    Untracked:  sra-tools_v2.10.7.sif

Unstaged changes:
    Modified:   .gitignore
    Modified:   _workflowr.yml
    Deleted:    analysis/CC_SARS-2.Rmd
    Modified:   analysis/CC_SARS.Rmd
    Modified:   analysis/DEG_analysis_BOT_vs_NTS.Rmd
    Modified:   analysis/marker_violin.Rmd
    Modified:   output/CC_SARS_Chr16_QTL_interval.pdf
    Modified:   output/CC_SARS_Chr16_plotGeno.pdf
    Modified:   output/CC_SARS_Chr16_plotGeno.png
Note that any generated files, e.g. HTML, png, CSS, etc., are not included in this status report because it is ok for generated content to have uncommitted changes.
These are the previous versions of the repository in which changes were made to the R Markdown (analysis/CC_SARS2.Rmd) and HTML (docs/CC_SARS2.html) files. If you’ve configured a remote Git repository (see ?wflow_git_remote), click on the hyperlinks in the table below to view the files as they were in that past version.
| File | Version | Author | Date | Message |
|---|---|---|---|---|
| Rmd | 13ab8fe | xhyuo | 2025-01-02 | peak table young vs old |
| html | e298b32 | xhyuo | 2023-10-15 | Build site. |
| Rmd | 45cfde6 | xhyuo | 2023-10-15 | qtl mapping conditional gene map |
| html | ad4d1c9 | xhyuo | 2023-10-02 | Build site. |
| Rmd | e430f61 | xhyuo | 2023-10-02 | qtl mapping chr7 |
| html | 5739792 | xhyuo | 2023-09-29 | Build site. |
| Rmd | 9d5740a | xhyuo | 2023-09-29 | qtl mapping overlay |
| html | 0d66d81 | xhyuo | 2023-09-29 | Build site. |
| Rmd | acc8369 | xhyuo | 2023-09-29 | qtl mapping conditional on Chr16 young |
| html | e03b40d | xhyuo | 2023-09-19 | Build site. |
| Rmd | b8bb91a | xhyuo | 2023-09-19 | qtl mapping conditional on Chr16 |
| html | 1bf1450 | xhyuo | 2023-09-01 | Build site. |
| Rmd | 9f2fe4c | xhyuo | 2023-09-01 | qtl mapping dpi |
| html | 346bed3 | xhyuo | 2023-08-22 | Build site. |
| Rmd | 98f9971 | xhyuo | 2023-08-22 | CC_SARS2 update |
Last update: 2025-01-02
Loading libraries
library(ggplot2)
library(gridExtra)
library(GGally)
library(parallel)
library(qtl)
library(parallel)
library(survival)
library(regress)
library(abind)
library(tidyverse)
library(broman)
library(qtl2)
library(qtlcharts)
library(DT)
library(biomaRt)
source("code/PLINKtoCSVR.R")

rz.transform <- function(y) {
  rankY=rank(y, ties.method="average", na.last="keep")
  rzT=qnorm(rankY/(length(na.exclude(rankY))+1))
  return(rzT)
}
Read phenotype data
# Read phenotype data -----------------------------------------------------
pheno <- readxl::read_xlsx(path = "data/CC_SARS-2/Menachery 2023 SARS-1 QTL Study WEIGHTS + TITERS - Aged Mice.xlsx", skip = 2, sheet = 1)
pheno <- pheno %>%
  dplyr::mutate(across(6:15, as.numeric))
# Warning in mask$eval_all_mutate(quo): NAs introduced by coercion

# Warning in mask$eval_all_mutate(quo): NAs introduced by coercion

# Warning in mask$eval_all_mutate(quo): NAs introduced by coercion

# Warning in mask$eval_all_mutate(quo): NAs introduced by coercion

# Warning in mask$eval_all_mutate(quo): NAs introduced by coercion

# Warning in mask$eval_all_mutate(quo): NAs introduced by coercion

# Warning in mask$eval_all_mutate(quo): NAs introduced by coercion

# Warning in mask$eval_all_mutate(quo): NAs introduced by coercion
colnames(pheno)[1] <- "AnimalID"
colnames(pheno)[2] <- "Gender"
colnames(pheno)[6:10] <- paste0("DPI-g.", 0:4)
colnames(pheno)[11:15] <- paste0("DPI-perct.", 0:4)
colnames(pheno)[16] <- "Lung_titer_4DPI_PFU_per_ml"
colnames(pheno)[17] <- "Log10_Lung_titer_4DPI_PFU_per_ml"
colnames(pheno)[18] <- "Note"
#add another column for log10 (+1) so that it will not be NA
pheno <- pheno %>%
  dplyr::mutate(Lung_titer_4DPI_PFU_per_ml = as.numeric(Lung_titer_4DPI_PFU_per_ml)) %>%
  dplyr::mutate(Log10_1_Lung_titer_4DPI_PFU_per_ml = log10(Lung_titer_4DPI_PFU_per_ml + 1), .before = Note)
# Warning in mask$eval_all_mutate(quo): NAs introduced by coercion

#
pheno <- pheno %>%
  #dplyr::mutate(strain = str_sub(Strain, 1, 4), .after = Strain) %>%
  tidyr::separate(Parents, c("MID", "FID")) %>%
  tidyr::unite(IID, c("Gender", "AnimalID"), sep = "_", remove = FALSE)


#boxplot
p1 <- ggplot(pheno, aes(x=Gender, y=Lung_titer_4DPI_PFU_per_ml, group = Gender, fill = Gender, alpha = 0.9)) +
  geom_boxplot(show.legend = F , outlier.size = 1.5, notchwidth = 0.85) +
  geom_jitter(color="black", size=0.8, alpha=0.9) +
  scale_fill_brewer(palette="Blues") +
  ylab("Lung titer 4DPI [PFU/ml]") +
  xlab("Gender") +
  labs(fill = "") +
  theme(legend.position = "none",
        panel.grid.major = element_blank(),
        panel.grid.minor = element_blank(),
        panel.background = element_blank(),
        axis.line = element_line(colour = "black"),
        text = element_text(size=16),
        axis.title=element_text(size=16)) +
  guides(shape = guide_legend(override.aes = list(size = 12)))
p1
# Warning: Removed 20 rows containing non-finite values (stat_boxplot).
# Warning: Removed 20 rows containing missing values (geom_point).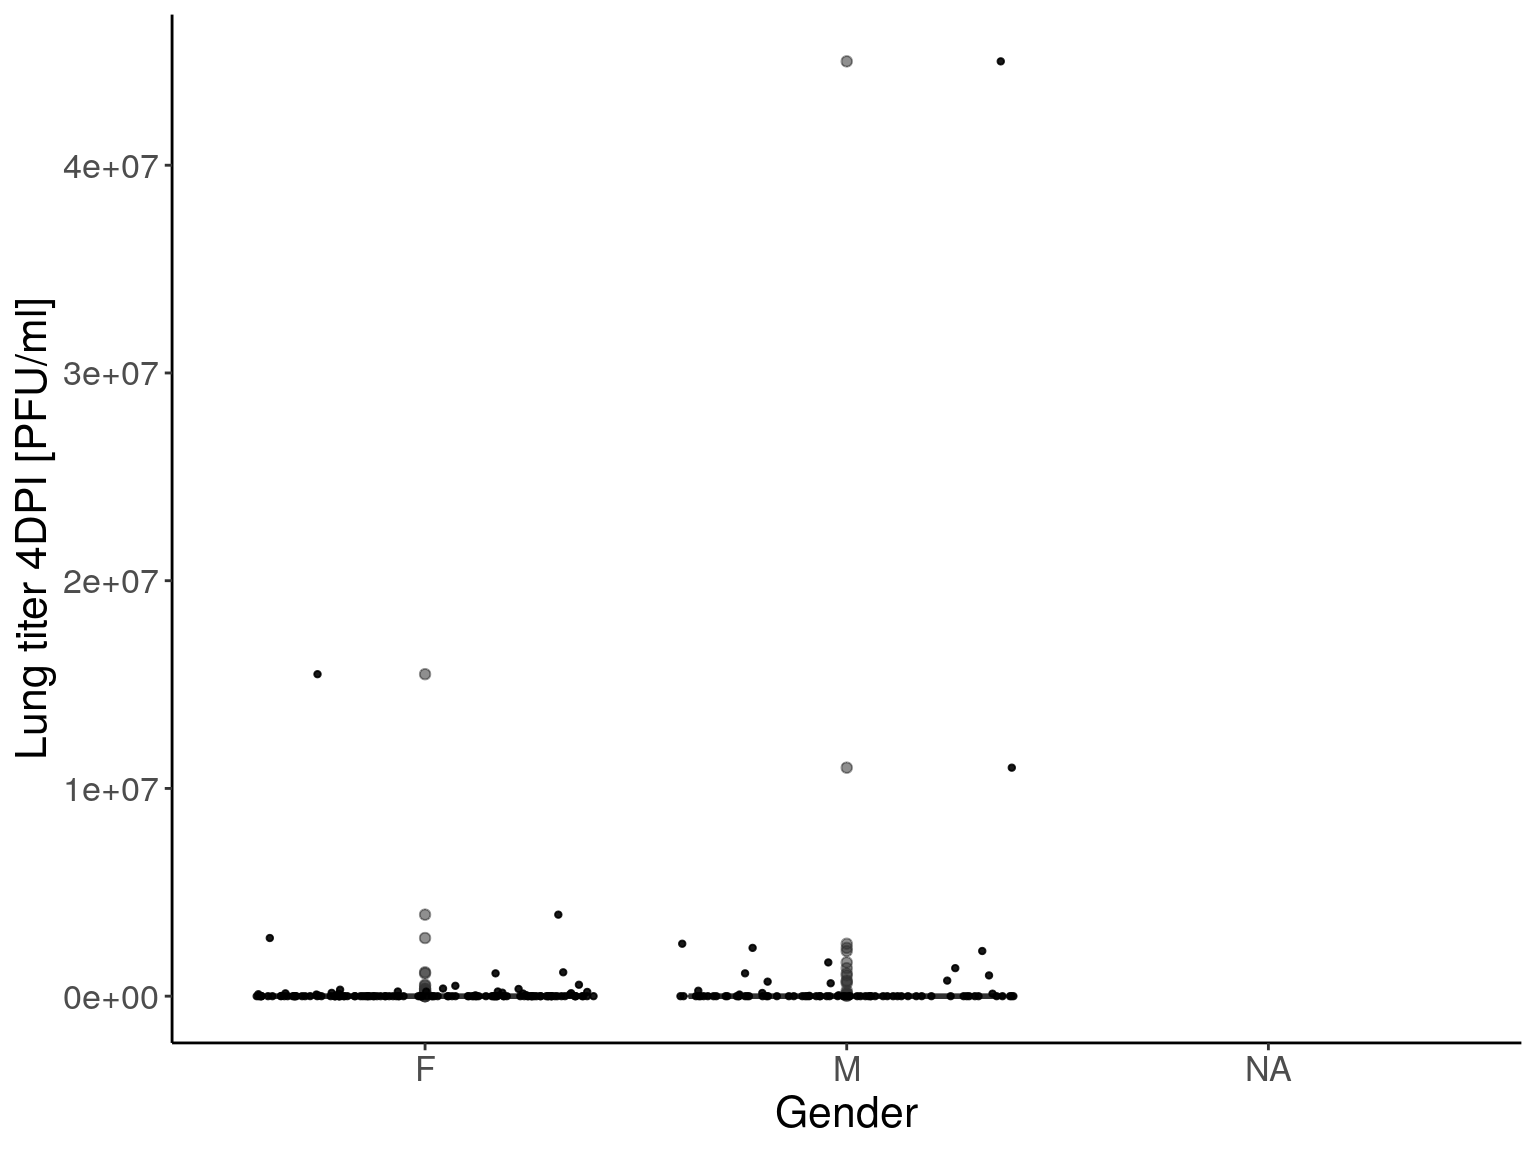
| Version | Author | Date |
|---|---|---|
| 346bed3 | xhyuo | 2023-08-22 |
p2 <- ggplot(pheno, aes(x=Gender, y=Log10_1_Lung_titer_4DPI_PFU_per_ml, group = Gender, fill = Gender, alpha = 0.9)) +
  geom_boxplot(show.legend = F , outlier.size = 1.5, notchwidth = 0.85) +
  geom_jitter(color="black", size=0.8, alpha=0.9) +
  scale_fill_brewer(palette="Blues") +
  ylab("Log10 (Lung titer)") +
  xlab("Gender") +
  labs(fill = "") +
  theme(legend.position = "none",
        panel.grid.major = element_blank(),
        panel.grid.minor = element_blank(),
        panel.background = element_blank(),
        axis.line = element_line(colour = "black"),
        text = element_text(size=16),
        axis.title=element_text(size=16)) +
  guides(shape = guide_legend(override.aes = list(size = 12)))
p2
# Warning: Removed 20 rows containing non-finite values (stat_boxplot).

# Warning: Removed 20 rows containing missing values (geom_point).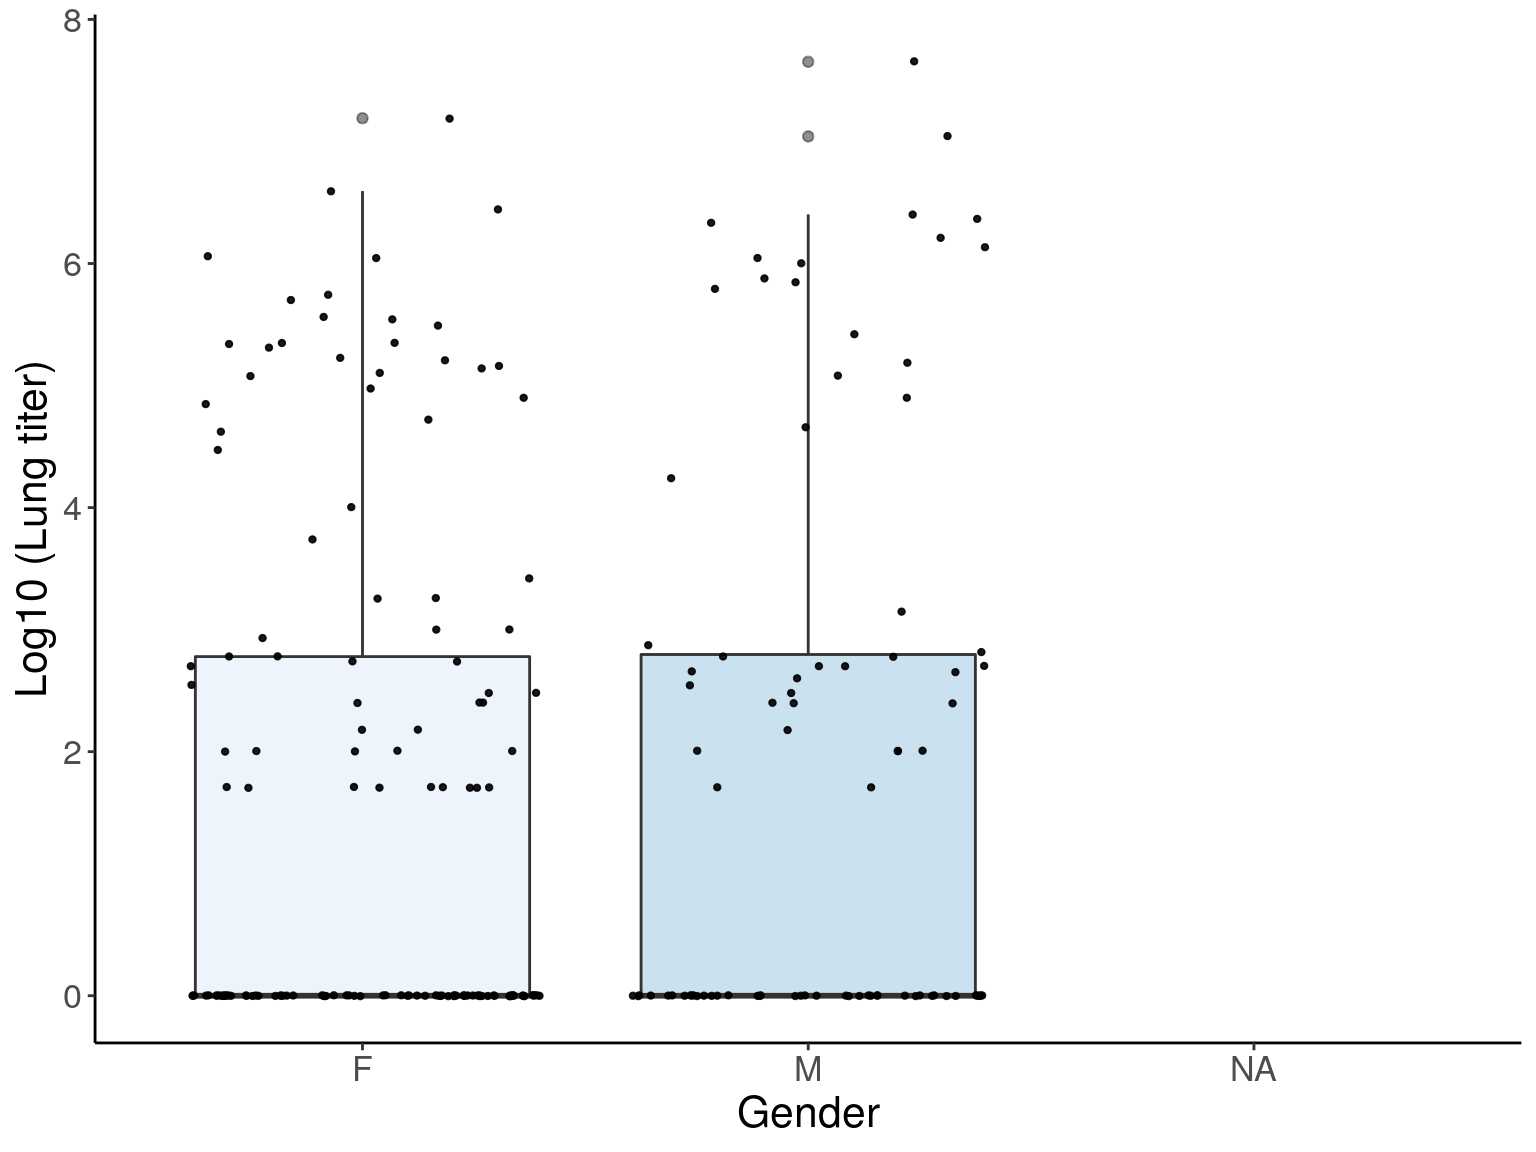
| Version | Author | Date |
|---|---|---|
| 346bed3 | xhyuo | 2023-08-22 |
QC on the genotype data
batch.name <- list.files("data/CC_SARS-2/", pattern = "*-raw-genotypes.txt", full.names = TRUE)

#read data
geno <- map_dfr(batch.name, ~read.table(.x, header = TRUE, sep = "\t"))
geno <- geno %>%
  dplyr::mutate(Sample.Name = substr(Sample.Name, 6, nchar(Sample.Name)))

#missing
percent_missing <- geno %>%
  dplyr::filter(Allele1...Forward == "-" & Allele2...Forward == "-") %>%
  group_by(Sample.Name) %>%
  tally() %>%
  dplyr::mutate(Percent_missing_genotype_data = 100*n/n_distinct(geno$SNP.Name)) %>%
  dplyr::mutate(Mouse=seq_along(Sample.Name))

#iplot
iplot(percent_missing$Mouse,
      percent_missing$Percent_missing_genotype_data,
      indID=paste0(percent_missing$Sample.Name, " (", round(percent_missing$Percent_missing_genotype_data,2), "%)"),
      chartOpts=list(xlab="Mouse",  ylab="Percent missing genotype data", ylim=c(0, 100)))
Sex
#sex
#xint and yint
#Xint
Xint <- geno %>%
  dplyr::filter(Chromosome == "X") %>%
  dplyr::mutate(xint = (X+Y)/2) %>%
  reshape2::dcast(. , Sample.Name ~ SNP.Name, value.var = "xint") %>%
  column_to_rownames(var = "Sample.Name")
#Yint
Yint <- geno %>%
  dplyr::filter(Chromosome == "Y") %>%
  dplyr::mutate(yint = (X+Y)/2) %>%
  reshape2::dcast(. , Sample.Name ~ SNP.Name, value.var = "yint") %>%
  column_to_rownames(var = "Sample.Name")

#sex order
all.equal(rownames(Xint), rownames(Yint))
# [1] TRUE
sex <- substr(rownames(Xint), 1, 1)

x_pval <- apply(Xint, 2, function(a) t.test(a ~ sex)$p.value)
y_pval <- apply(Yint, 2, function(a) t.test(a ~ sex)$p.value)

xint_ave <- rowMeans(Xint[, x_pval < 0.05/length(x_pval)], na.rm=TRUE)
yint_ave <- rowMeans(Yint[, y_pval < 0.05/length(y_pval)], na.rm=TRUE)

point_colors <- as.character( brocolors("web")[c("green", "purple")] )
all.equal(names(xint_ave), (percent_missing$Sample.Name))
# [1] TRUE
labels <- paste0(names(xint_ave), "(", round(percent_missing$Percent_missing_genotype_data,2), "%)")
iplot(xint_ave, yint_ave, group=sex, indID=labels,
      chartOpts=list(pointcolor=point_colors, pointsize=4,
                     xlab="Average X chr intensity", ylab="Average Y chr intensity"))
Genotype format on PLINK and R/qtl
minimuga <- read.csv("https://raw.githubusercontent.com/kbroman/MUGAarrays/c4e92e32300d97055408fbc26c84e0005a873d4a/UWisc/mini_uwisc_v2.csv")

bad.id = pull(percent_missing[percent_missing$Percent_missing_genotype_data >= 10, "Sample.Name"])
#remove bad samples with percent_missing > 10%
pheno <- pheno %>%
  dplyr::filter(!(IID %in% bad.id))
geno <- geno %>%
  dplyr::filter(!(Sample.Name %in% bad.id)) %>%
  dplyr::filter(!(Chromosome %in% c("Y", "MT", "PAR", "0"))) %>%
  dplyr::left_join(., minimuga[, c(1,4)], by = c("SNP.Name"  = "marker"))

#chromosome (1-22, X, Y or 0 if unplaced)
#rs# or snp identifier
#Genetic distance (morgans)
#Base-pair position (bp units)

map <- geno %>%
  dplyr::select(Chromosome, SNP.Name, cM_cox, bp = Position) %>%
  # dplyr::mutate(morgan = 0, .before = bp) %>%
  # dplyr::filter(Chromosome %in% c("Y", "MT", "PAR", "0")) %>%
  distinct()

ped.pheno <- geno %>%
  tidyr::unite("geno", Allele1...Forward, Allele2...Forward, sep = " ", remove = FALSE) %>%
  dplyr::select(Sample.Name, SNP.Name, geno) %>%
  dplyr::mutate(geno = case_when(
    geno == "- -" ~ "0 0",
    TRUE ~ as.character(geno)
  )) %>%
  reshape2::dcast(. , Sample.Name ~ SNP.Name, value.var = "geno") %>%
  inner_join(x = pheno[, c(1,3,5,6,8:12, 14:20)], y = ., by = c("IID" = "Sample.Name")) %>%
  dplyr::mutate(FFID = paste0(FID, "_", MID), .before = 1)

#qc on the marker
qc_marker <- data.frame(name = colnames(ped.pheno)[-1:-17],
                        letter = map_chr(18:ncol(ped.pheno), function(x){
                          paste0(unique(unlist(strsplit(pull(ped.pheno[,x]), " "))), collapse = "")
                        }),
                        length = map_dbl(18:ncol(ped.pheno), function(x){
                          y  = unique(unlist(strsplit(pull(ped.pheno[,x]), " ")))
                          length(y[y != "-"])
                        })
)
#select marker with length > 1
ped.pheno <- cbind(ped.pheno[, 1:17], ped.pheno[, qc_marker[qc_marker$length > 1, "name"]])
#update map
map <- map %>%
  dplyr::filter(SNP.Name %in% qc_marker[qc_marker$length > 1, "name"])
all.equal(map$SNP.Name, colnames(ped.pheno)[-1:-17])
# [1] TRUE
write.table(map, file = "data/CC_SARS-2/cc_sars.map", sep = " ", quote = F, col.names = FALSE, row.names = FALSE)

#ped
ped <- ped.pheno %>%
  dplyr::mutate(Gender = if_else(Gender == "M", 1, 2)) %>%
  dplyr::select(FFID, IID, FID, MID, Gender, 17:last_col())
write.table(ped, file = "data/CC_SARS-2/cc_sars.ped", sep = " ", quote = F, col.names = FALSE, row.names = FALSE)
#pheno
write.table(ped.pheno[, c(1, 2, 6:8)], file = "data/CC_SARS-2/cc_sars.pheno", sep = " ", quote = F, col.names = TRUE, row.names = FALSE)

#read plink format
system("cd /projects/compsci/vmp/USERS/heh/DO_Opioid/data/CC_SARS-2; /projects/csna/csna_workflow/code/plink-1.07-x86_64/plink --noweb --file cc_sars --missing-phenotype NA --mind 0.1 --geno 0.1 --recode --out cc_sars_qc")
QTL mapping with removing non-informative markers
cross <- PLINKtoCSVR(ped = "data/CC_SARS-2/cc_sars_qc.ped",
                     map = "data/CC_SARS-2/cc_sars_qc.map",
                     out = "data/CC_SARS-2/cross.csvr")
#  --Read the following data:
#    198  individuals
#    3272  markers
#    2  phenotypes
# Warning in summary.cross(cross): Some markers at the same position on chr
# 1,2,3,5,6,7,8,9,10,11,12,13,14,15,16,17,18,19,23; use jittermap().
#  --Cross type: f2
cross$pheno <- cbind(cross$pheno, ped.pheno[, c(6:17)])
#rankz on DPI
cross$pheno <- cross$pheno %>%
  dplyr::mutate(across(3:11, ~rz.transform(.x)))
#convert to cross2
cross2 <- convert2cross2(cross)

plotMap(cross) 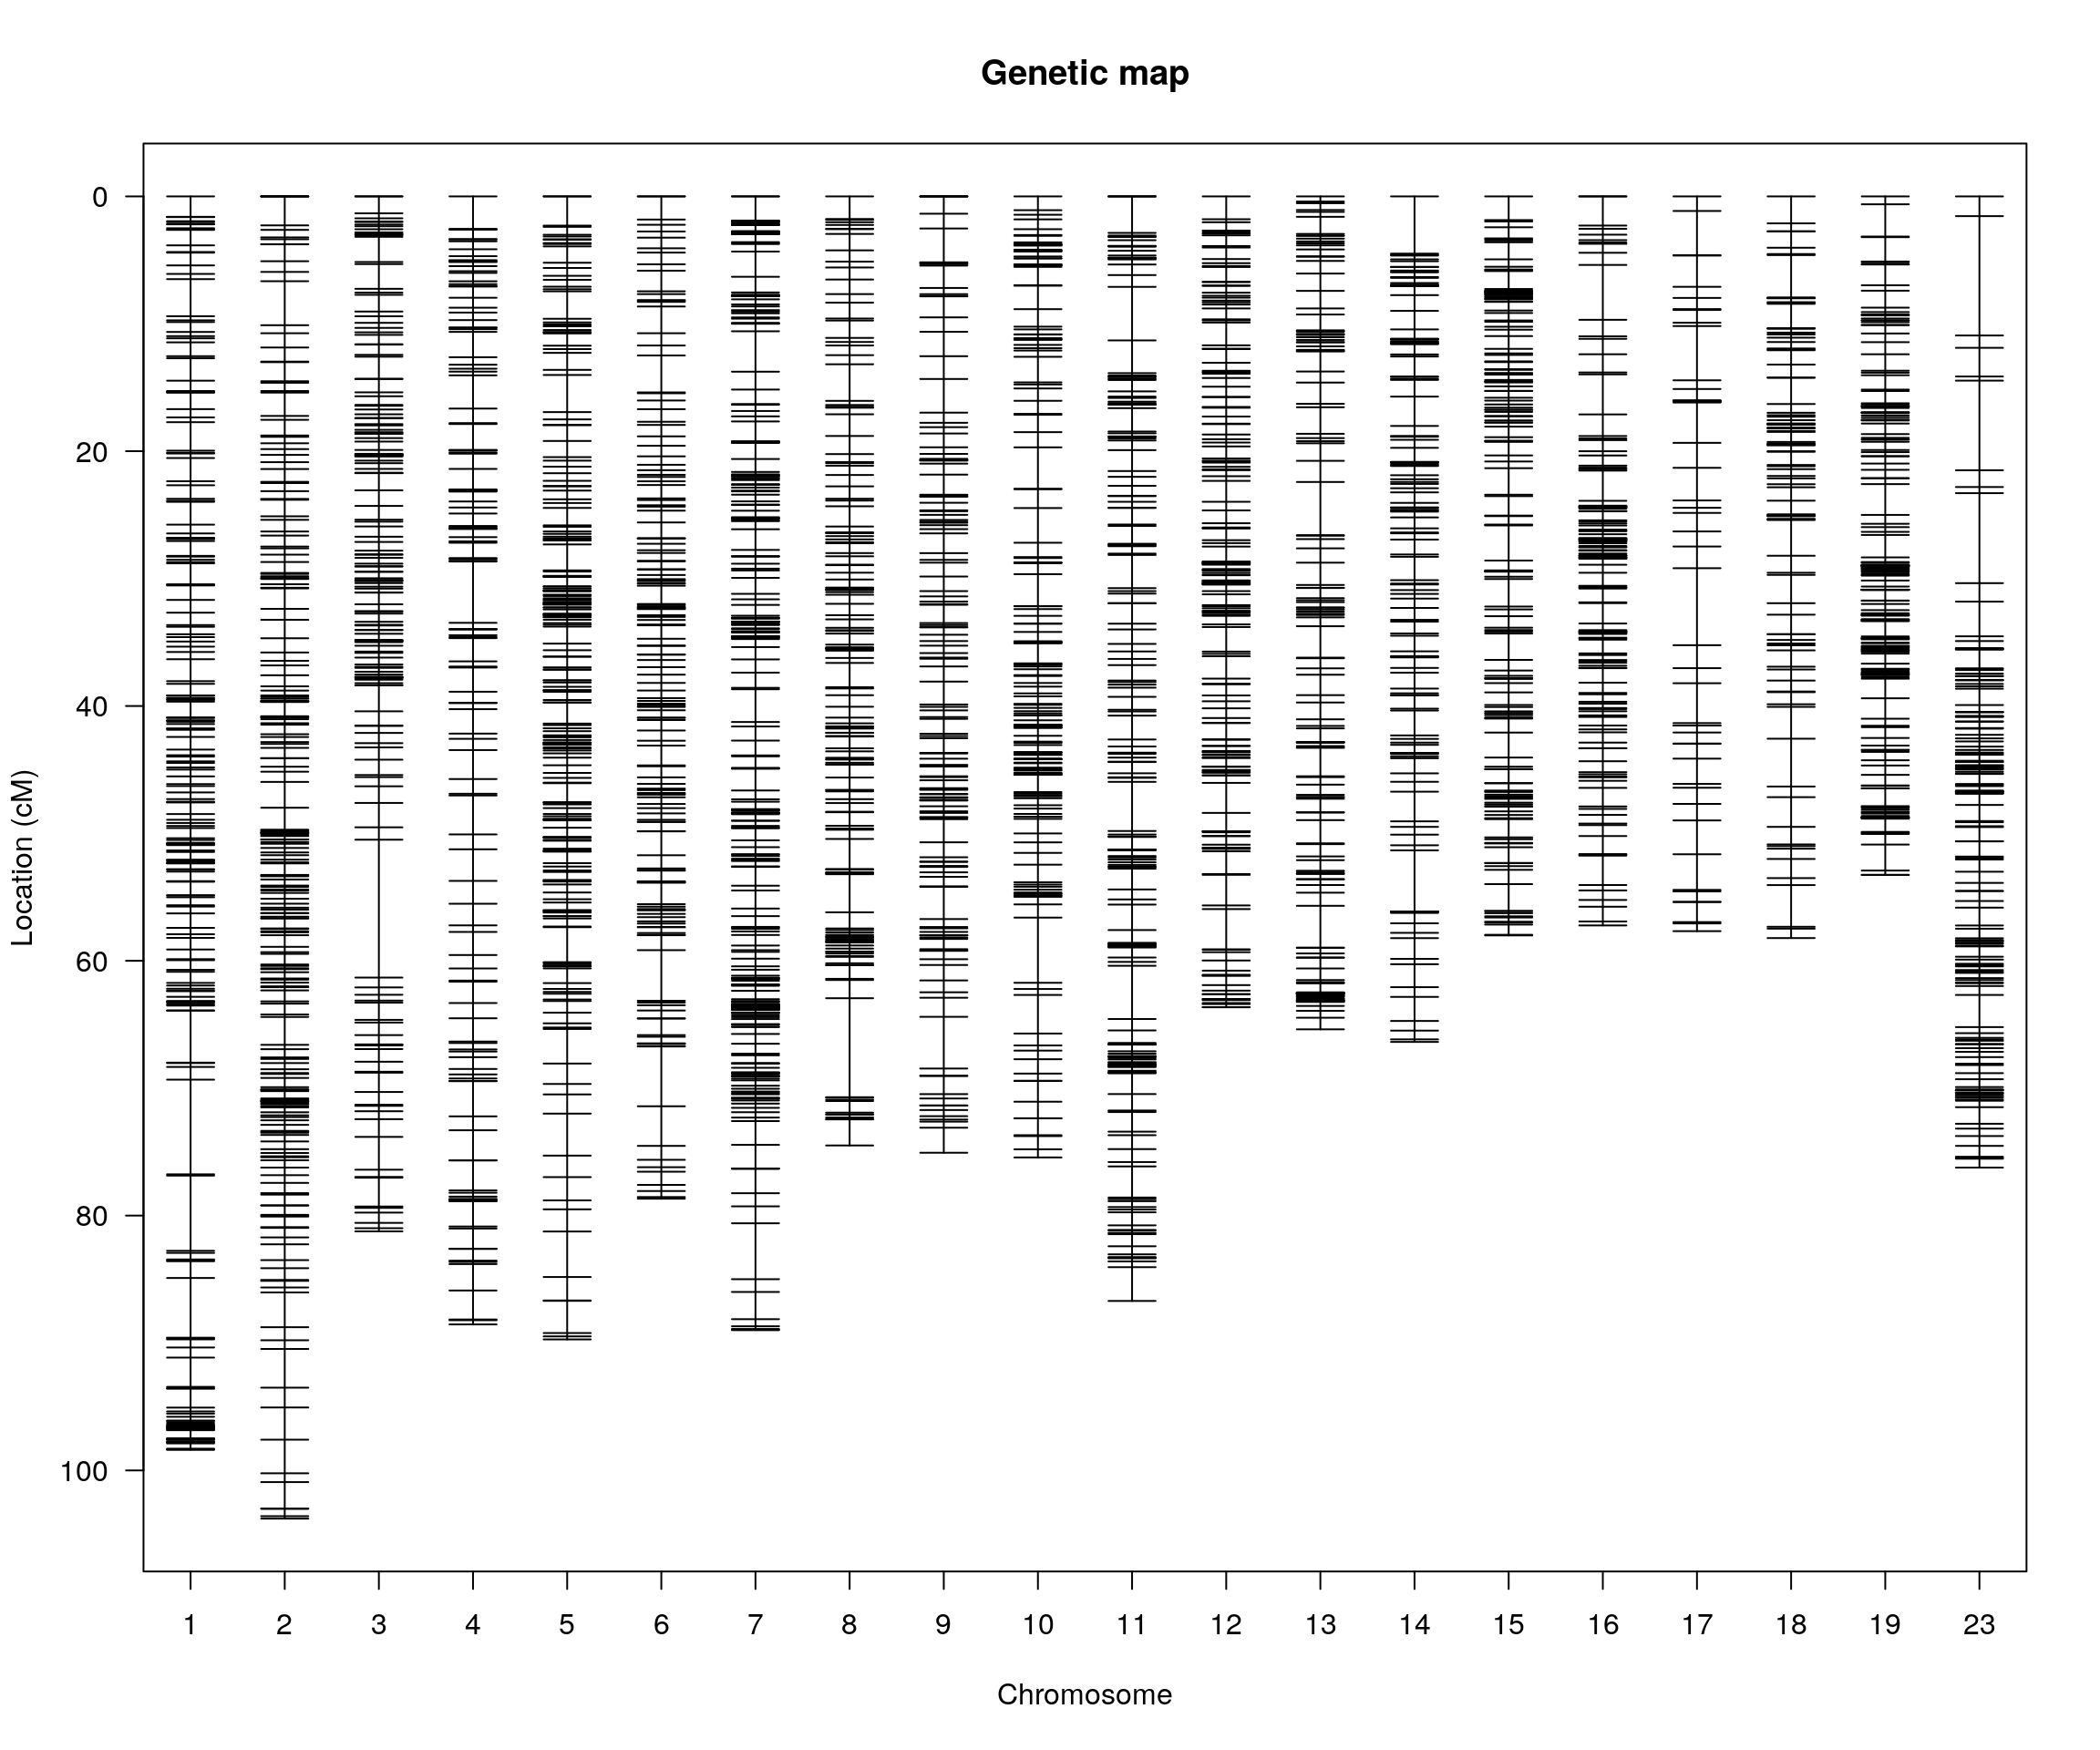
plotPheno(cross, pheno.col = 14, xlab = "", main = "Log10_1_Lung_titer_4DPI_PFU_per_ml")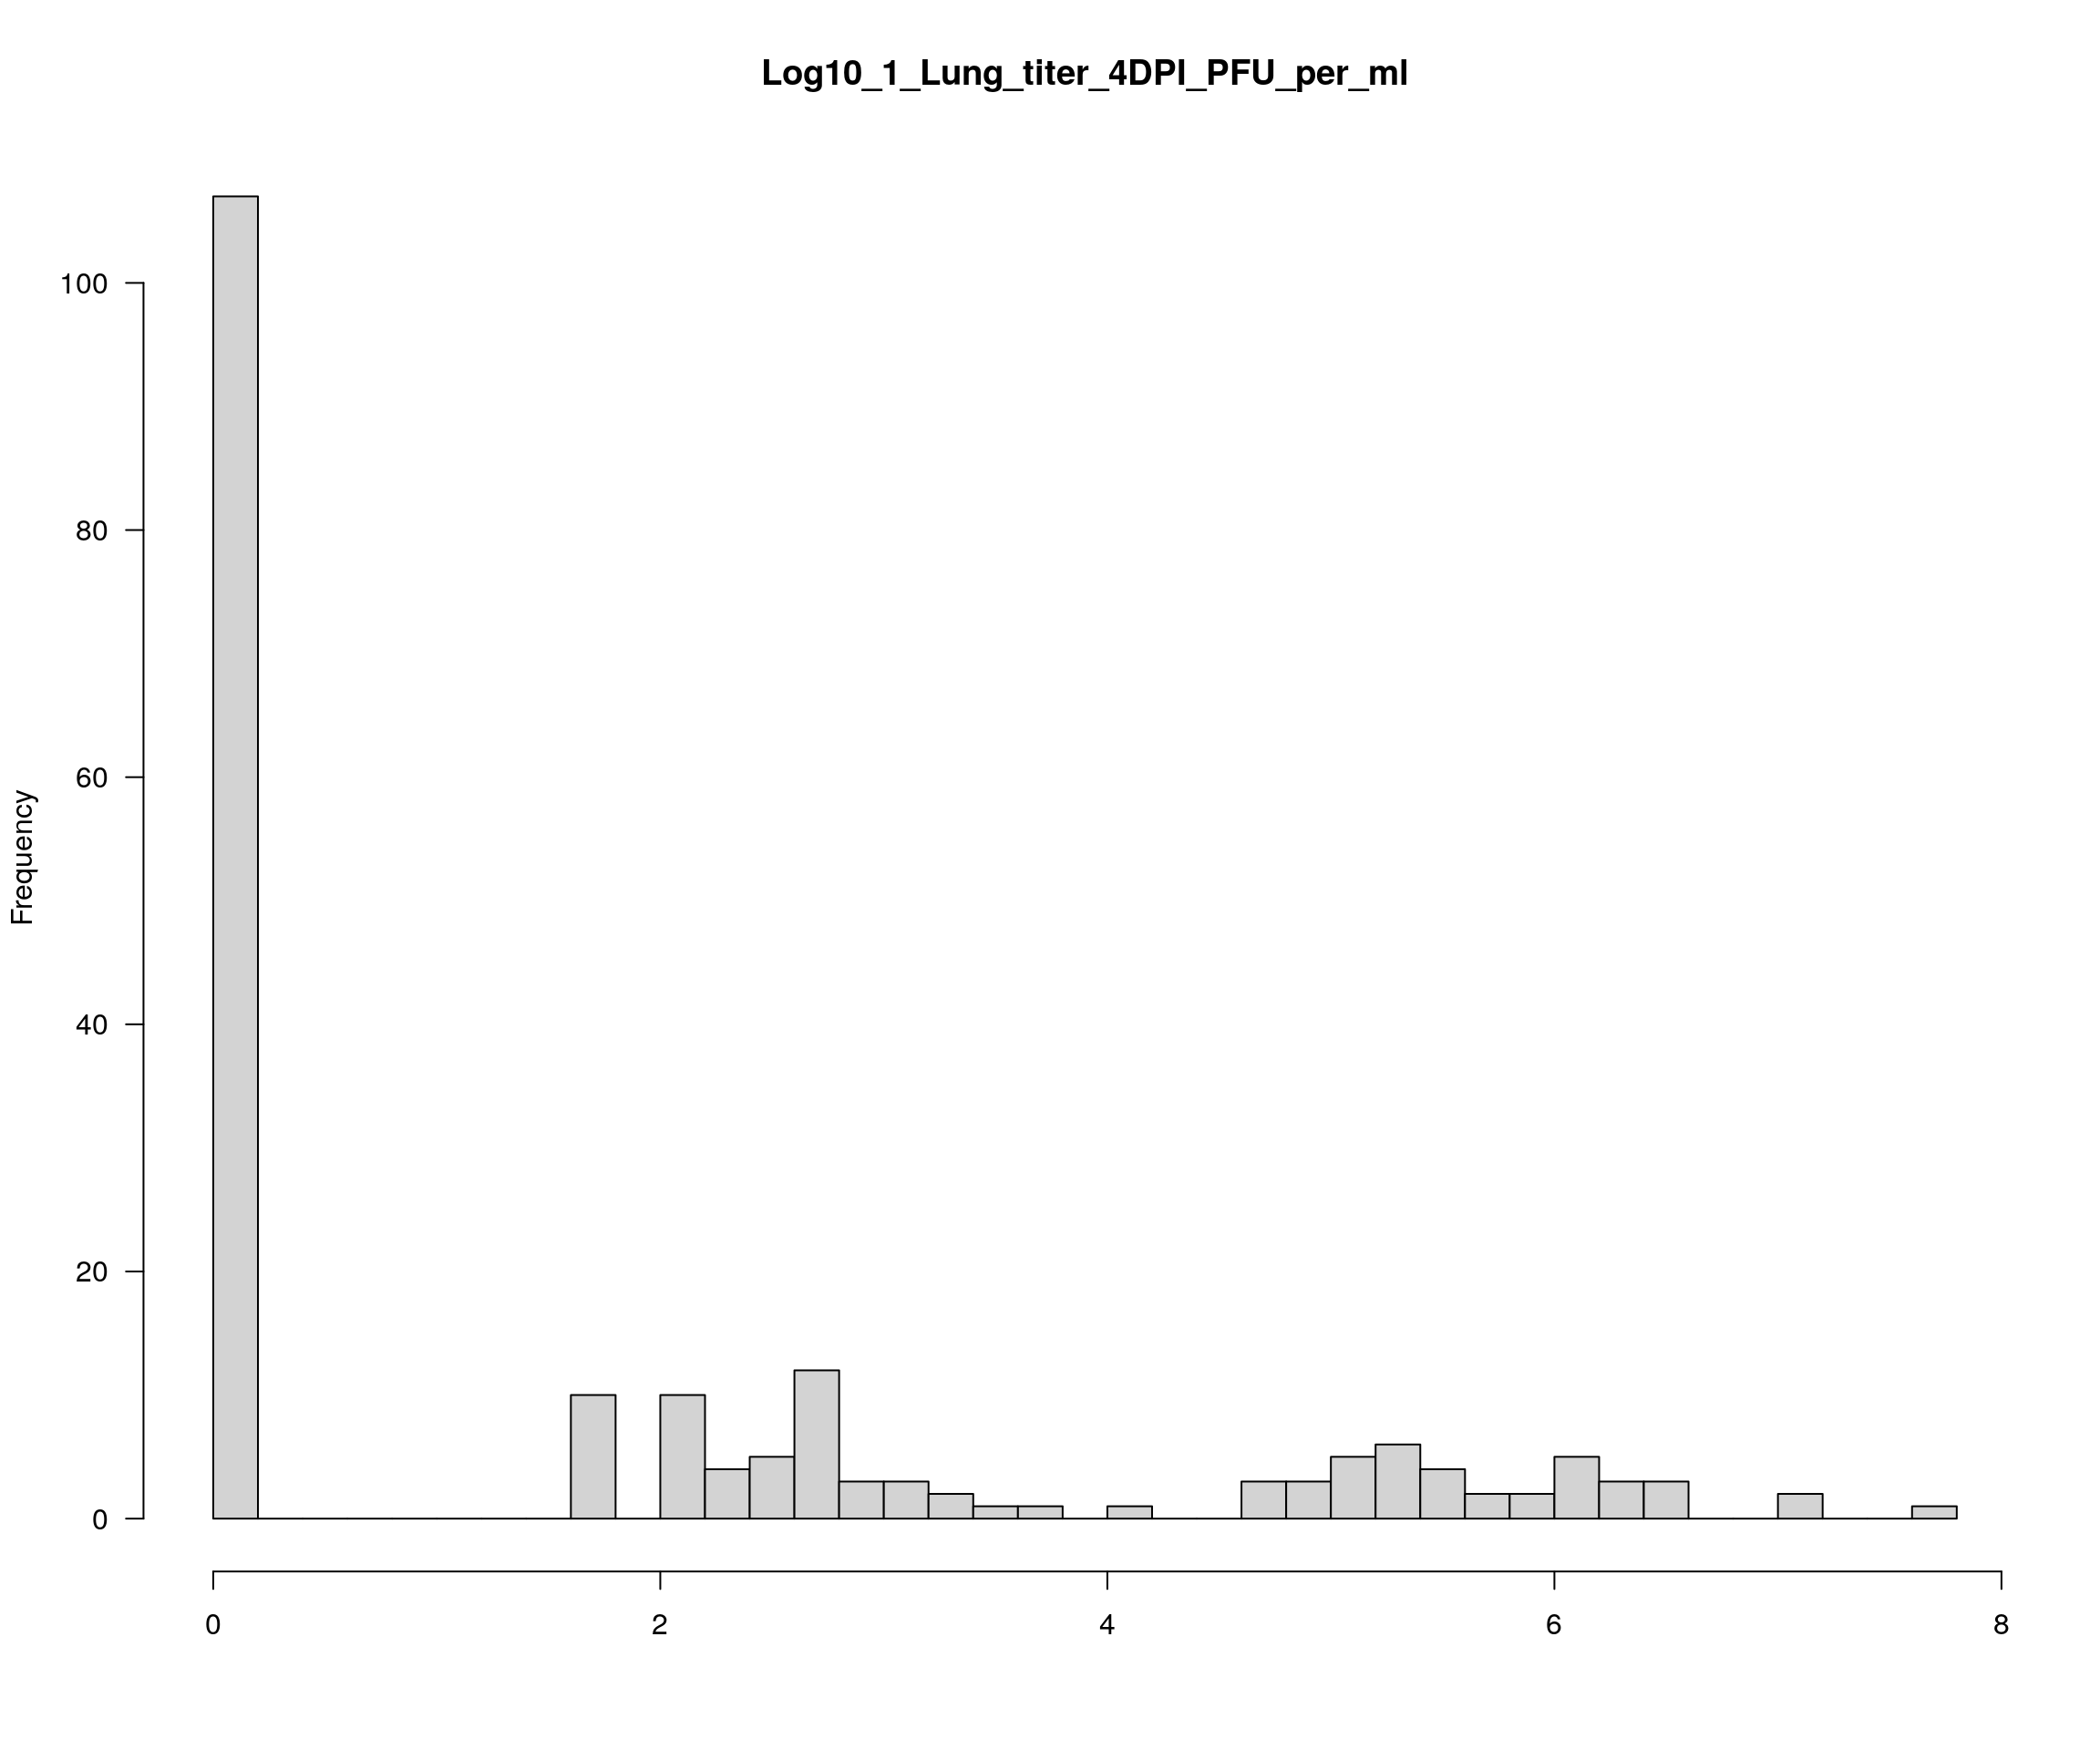
plotPheno(cross, pheno.col = 12, xlab = "", main = "Lung_titer_4DPI_PFU_per_ml")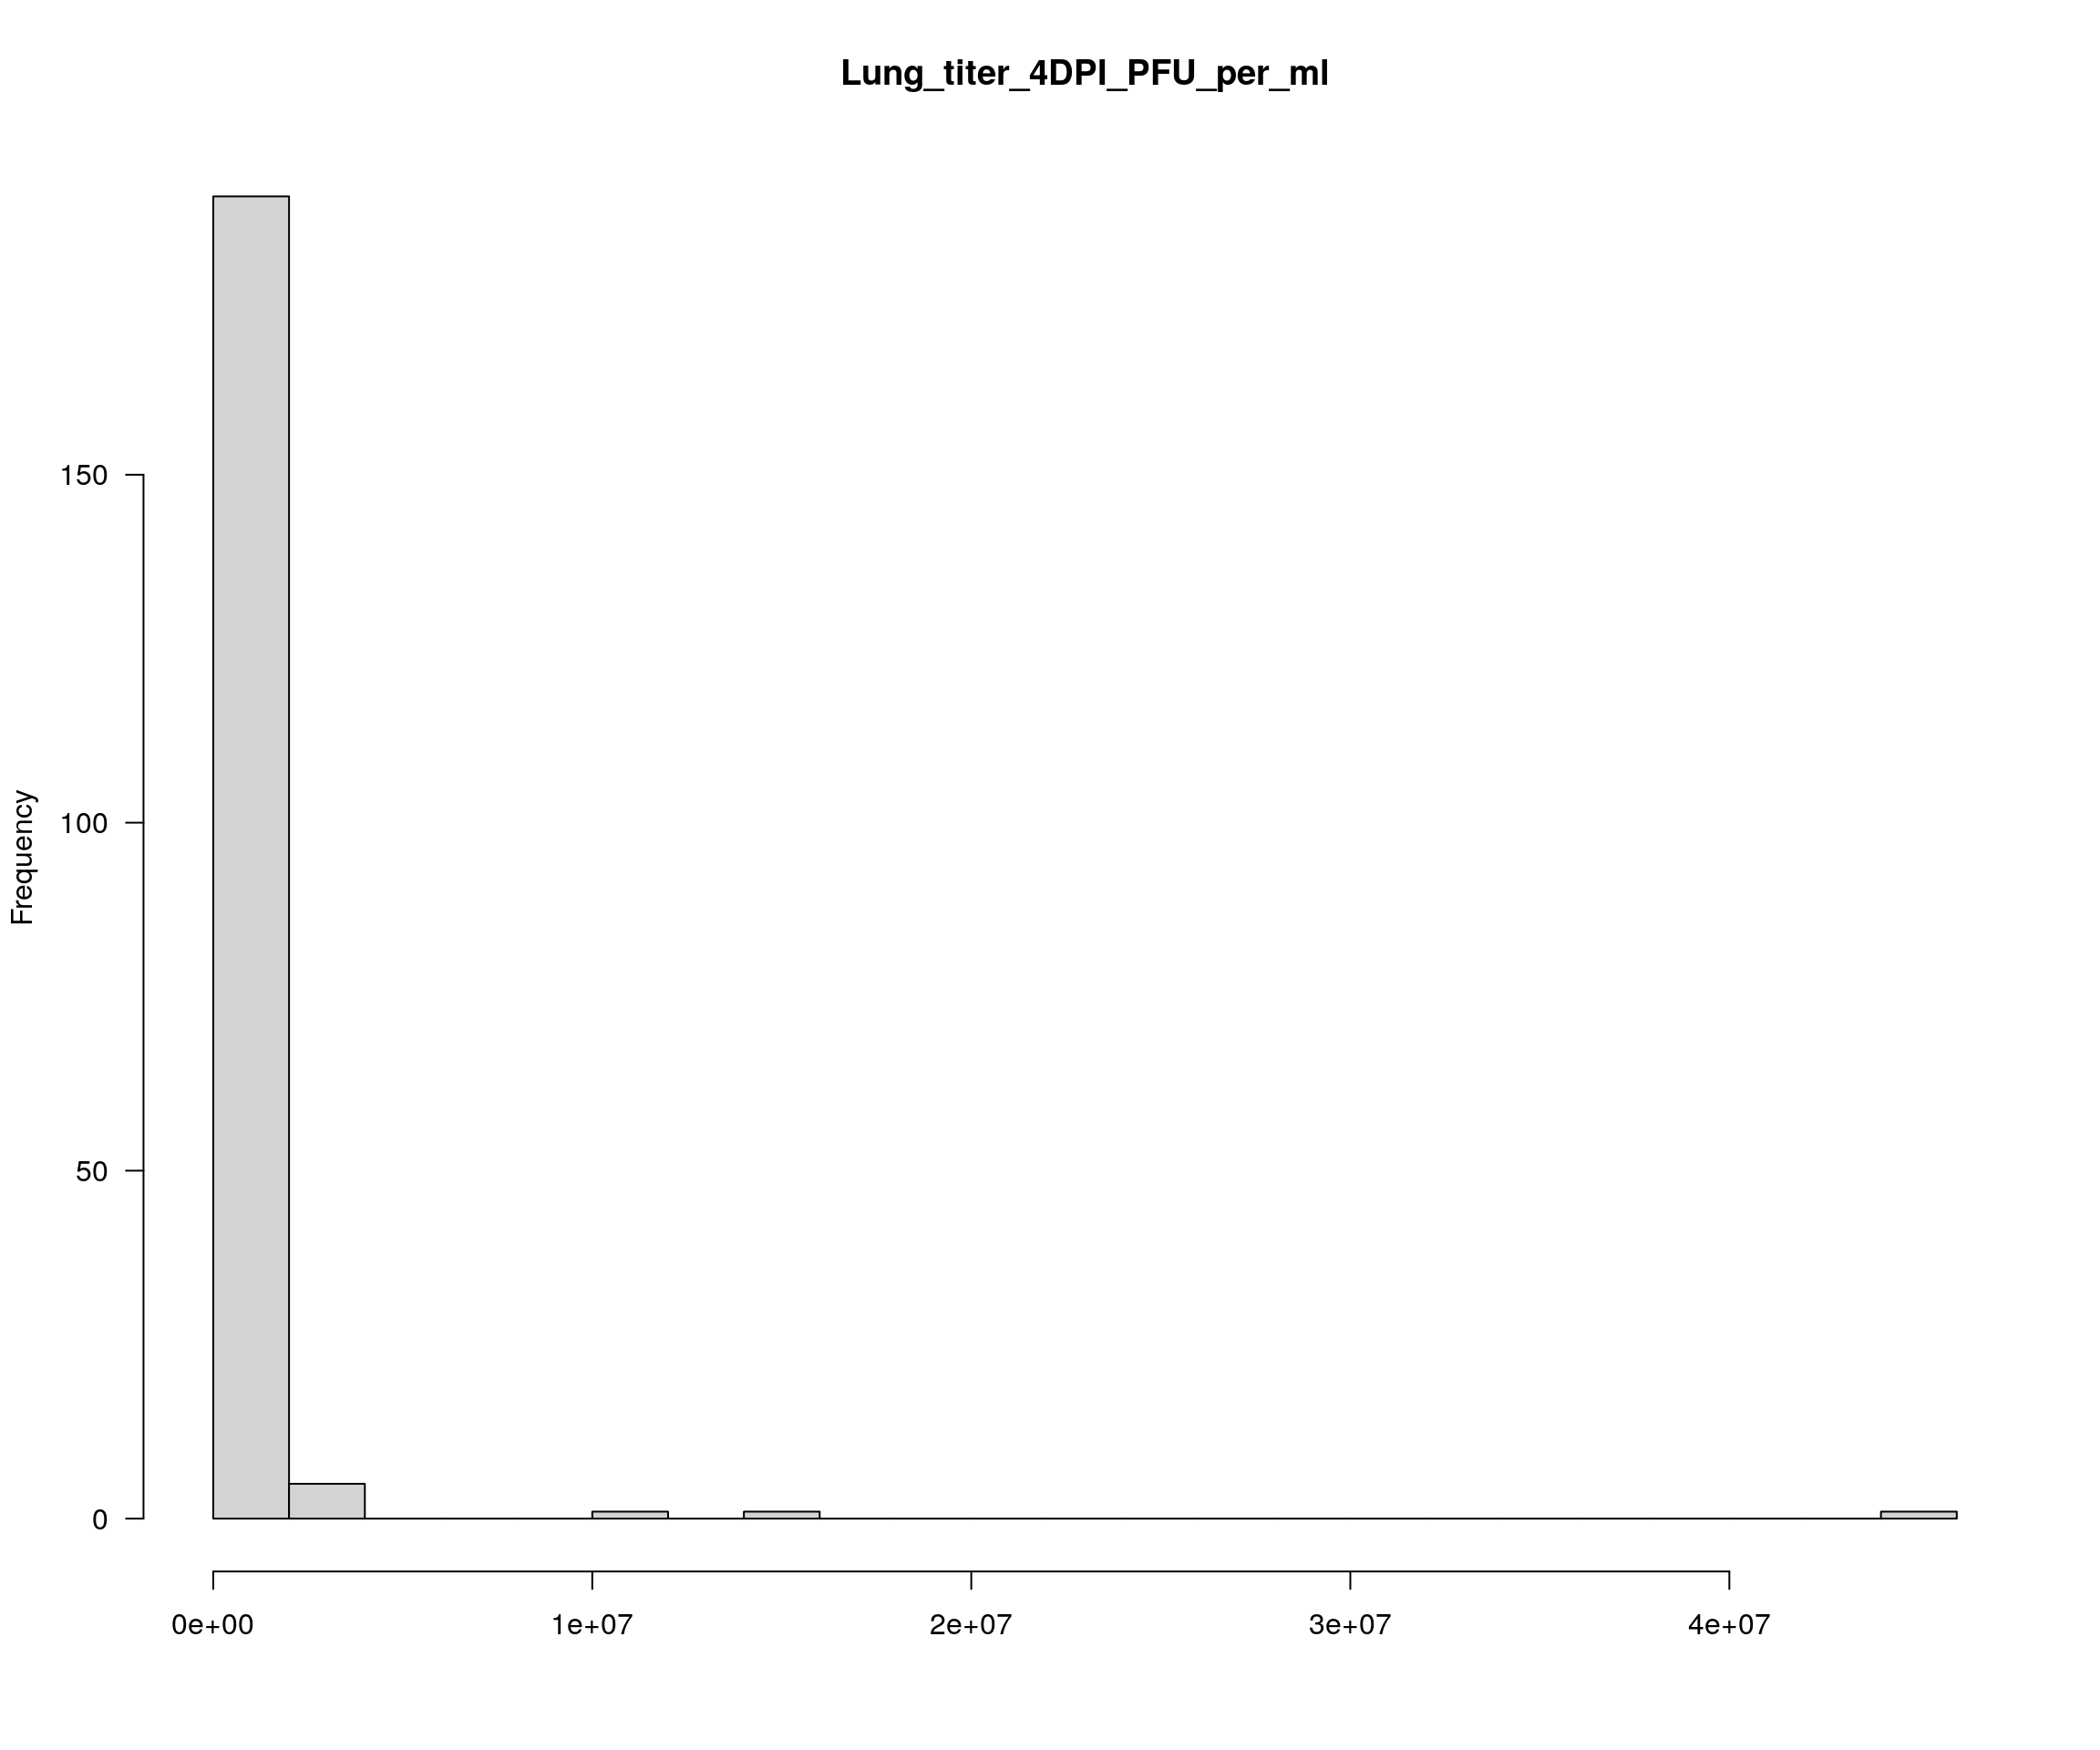
| Version | Author | Date |
|---|---|---|
| 346bed3 | xhyuo | 2023-08-22 |
plotPheno(cross, pheno.col = 13, xlab = "", main = "Log10_Lung_titer_4DPI_PFU_per_ml")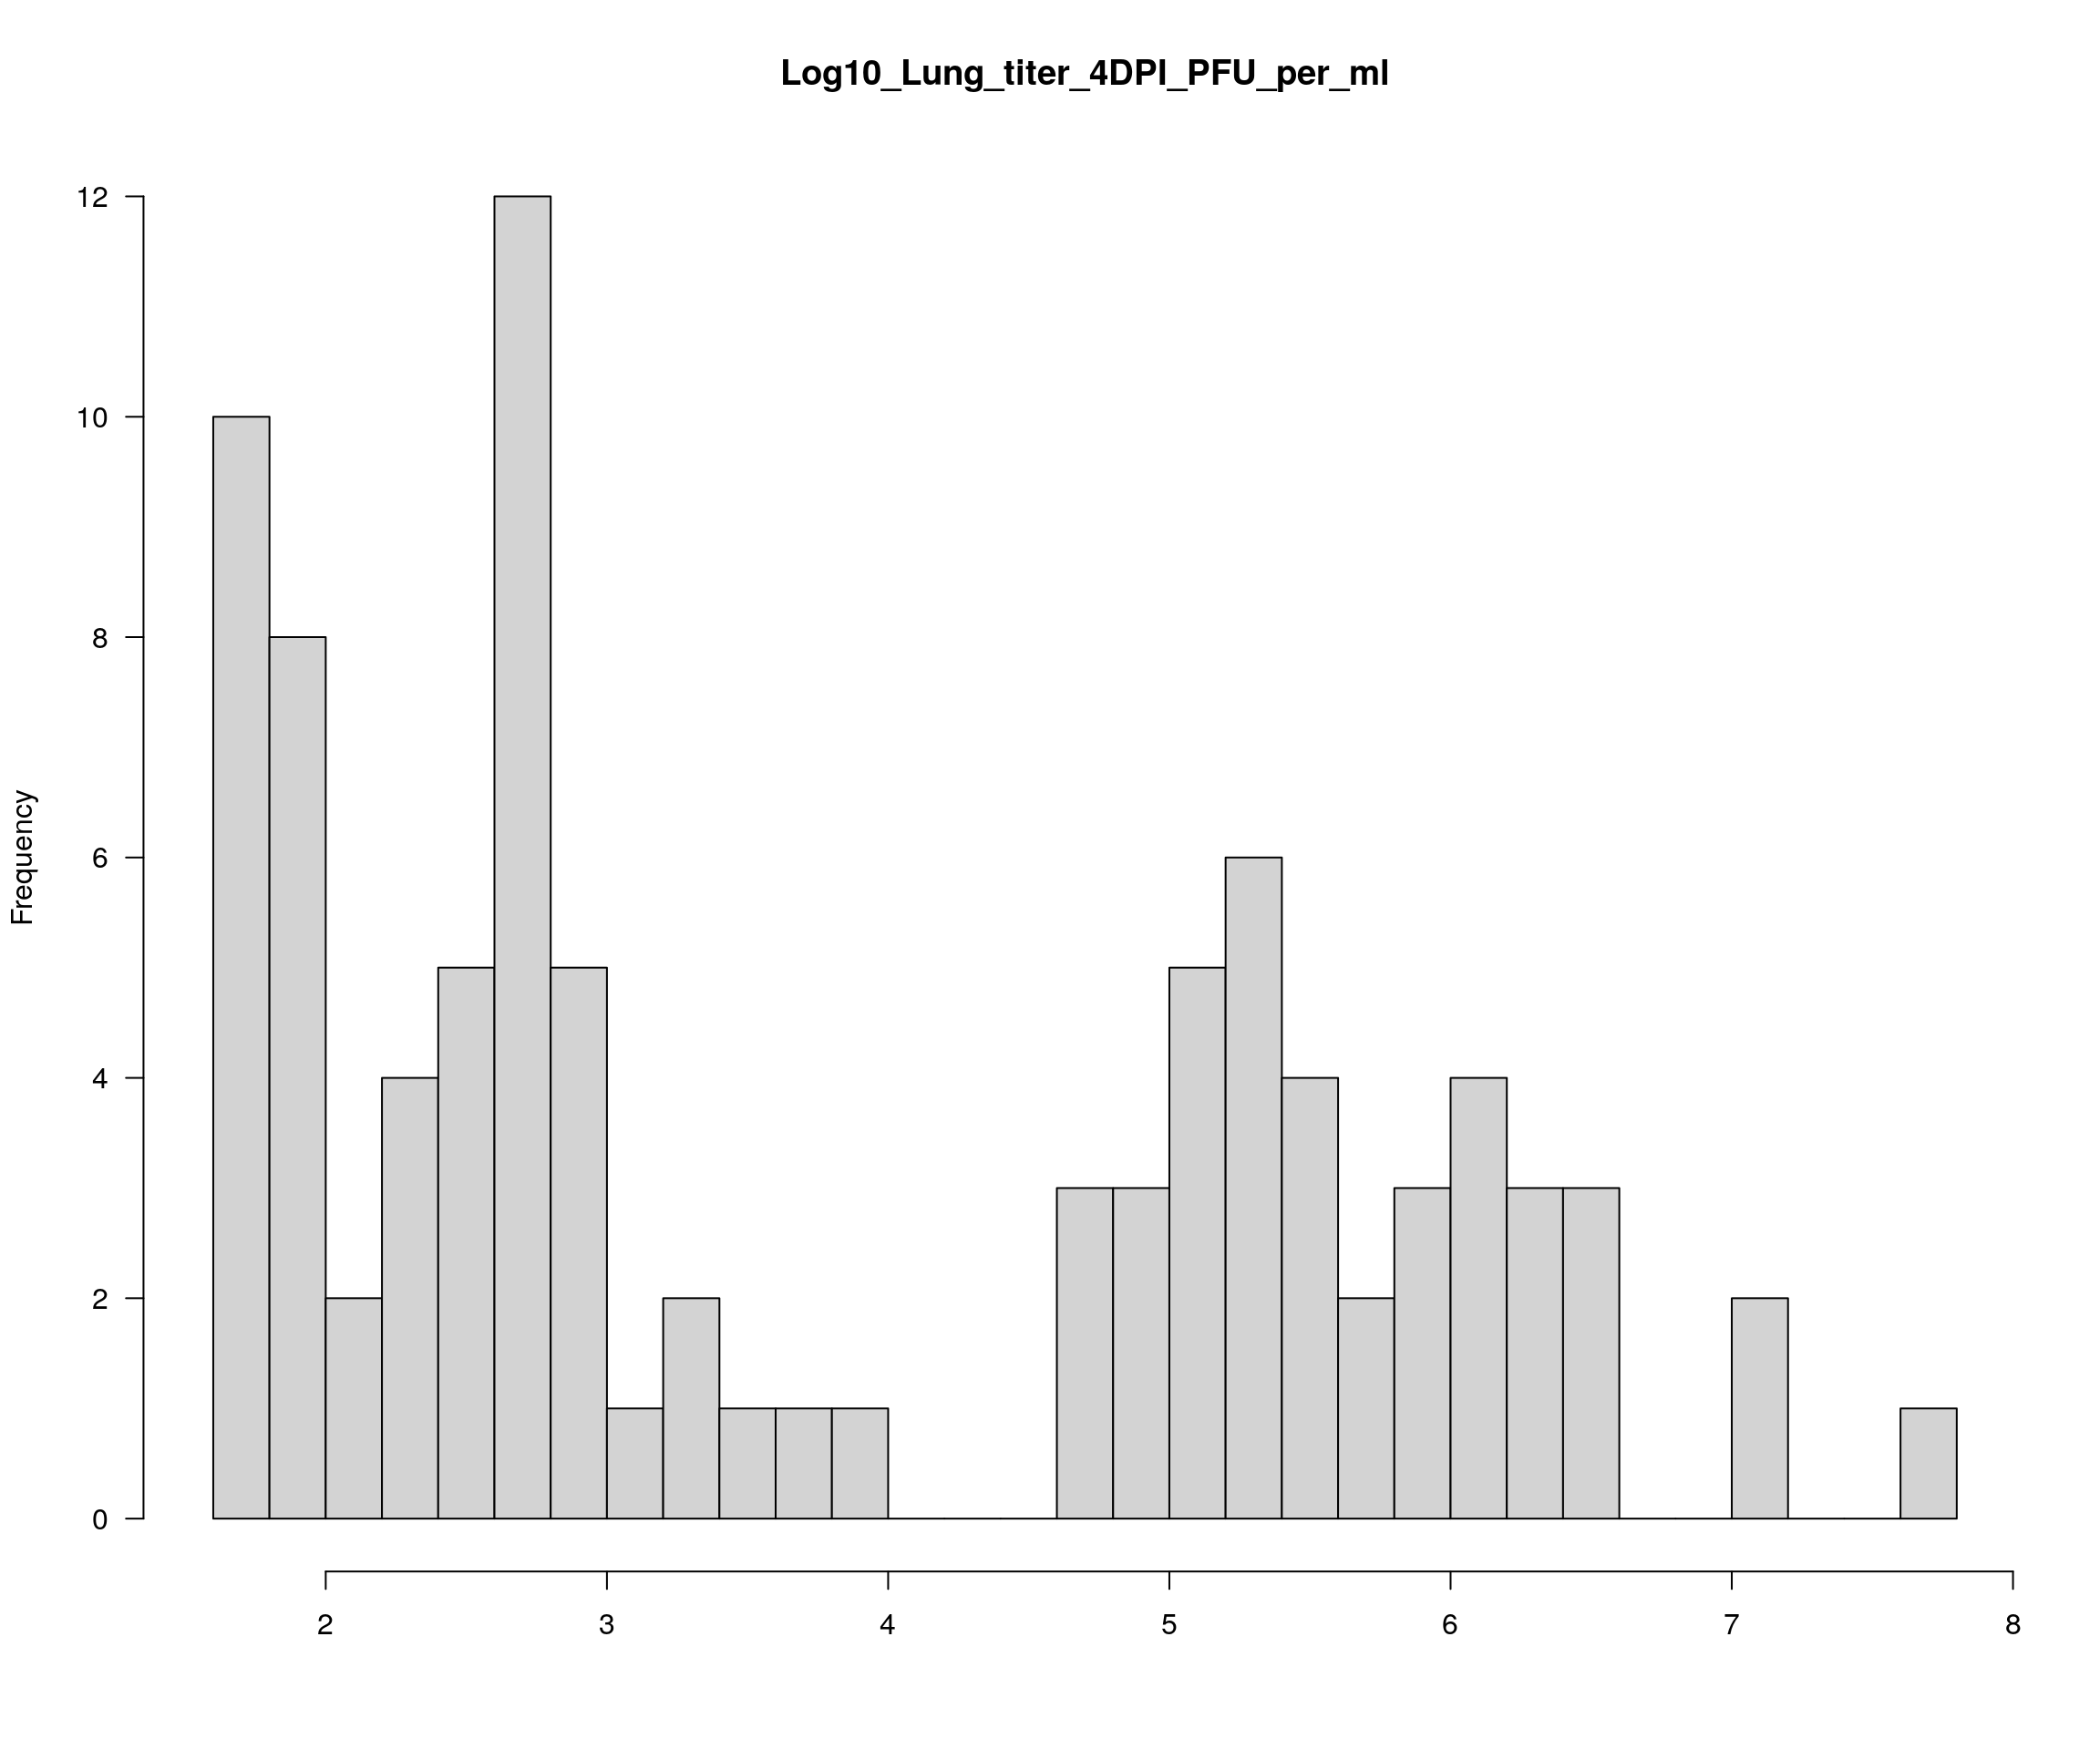
| Version | Author | Date |
|---|---|---|
| 346bed3 | xhyuo | 2023-08-22 |
#0/1 for females/males
covars <- model.matrix(~ sex, cross$pheno)[,-1]
f2_qtl <- calc.genoprob(cross)

#1
out_1 <- scanone(f2_qtl, pheno.col = 14, model = "2part", n.cluster = 10)
# out_1_operm <- scanone(f2_qtl, pheno.col = 14, model = "2part", n.perm = 100, n.cluster = 10)
# save(out_1_operm, file = "data/CC_SARS-2/out_1_operm.RData")
load("data/CC_SARS-2/out_1_operm.RData")
summary(out_1[,1:3], perms = out_1_operm[,1], alpha = 0.05, pvalues = TRUE)
#              chr  pos lod.p.mu pval
# gUNC26646526  16 25.4     39.4    0
summary(out_1_operm[,1], alpha=c(0.05))
# LOD thresholds (100 permutations)
#    lod.p.mu
# 5%     13.9

#3
out_3 <- scanone(f2_qtl, pheno.col = 13, model = "normal", n.cluster = 10)
# Warning in checkcovar(cross, pheno.col, addcovar, intcovar, perm.strata, : Dropping 107 individuals with missing phenotypes.
#
plot(out_1, col = c("red"), main = "Log10_1_Lung_titer_4DPI_PFU_per_ml", ylab = "LOD")
add.threshold(out_1, perms = out_1_operm, alpha = 0.05, col="magenta")
add.threshold(out_1, perms = out_1_operm, alpha = 0.1, col="blue")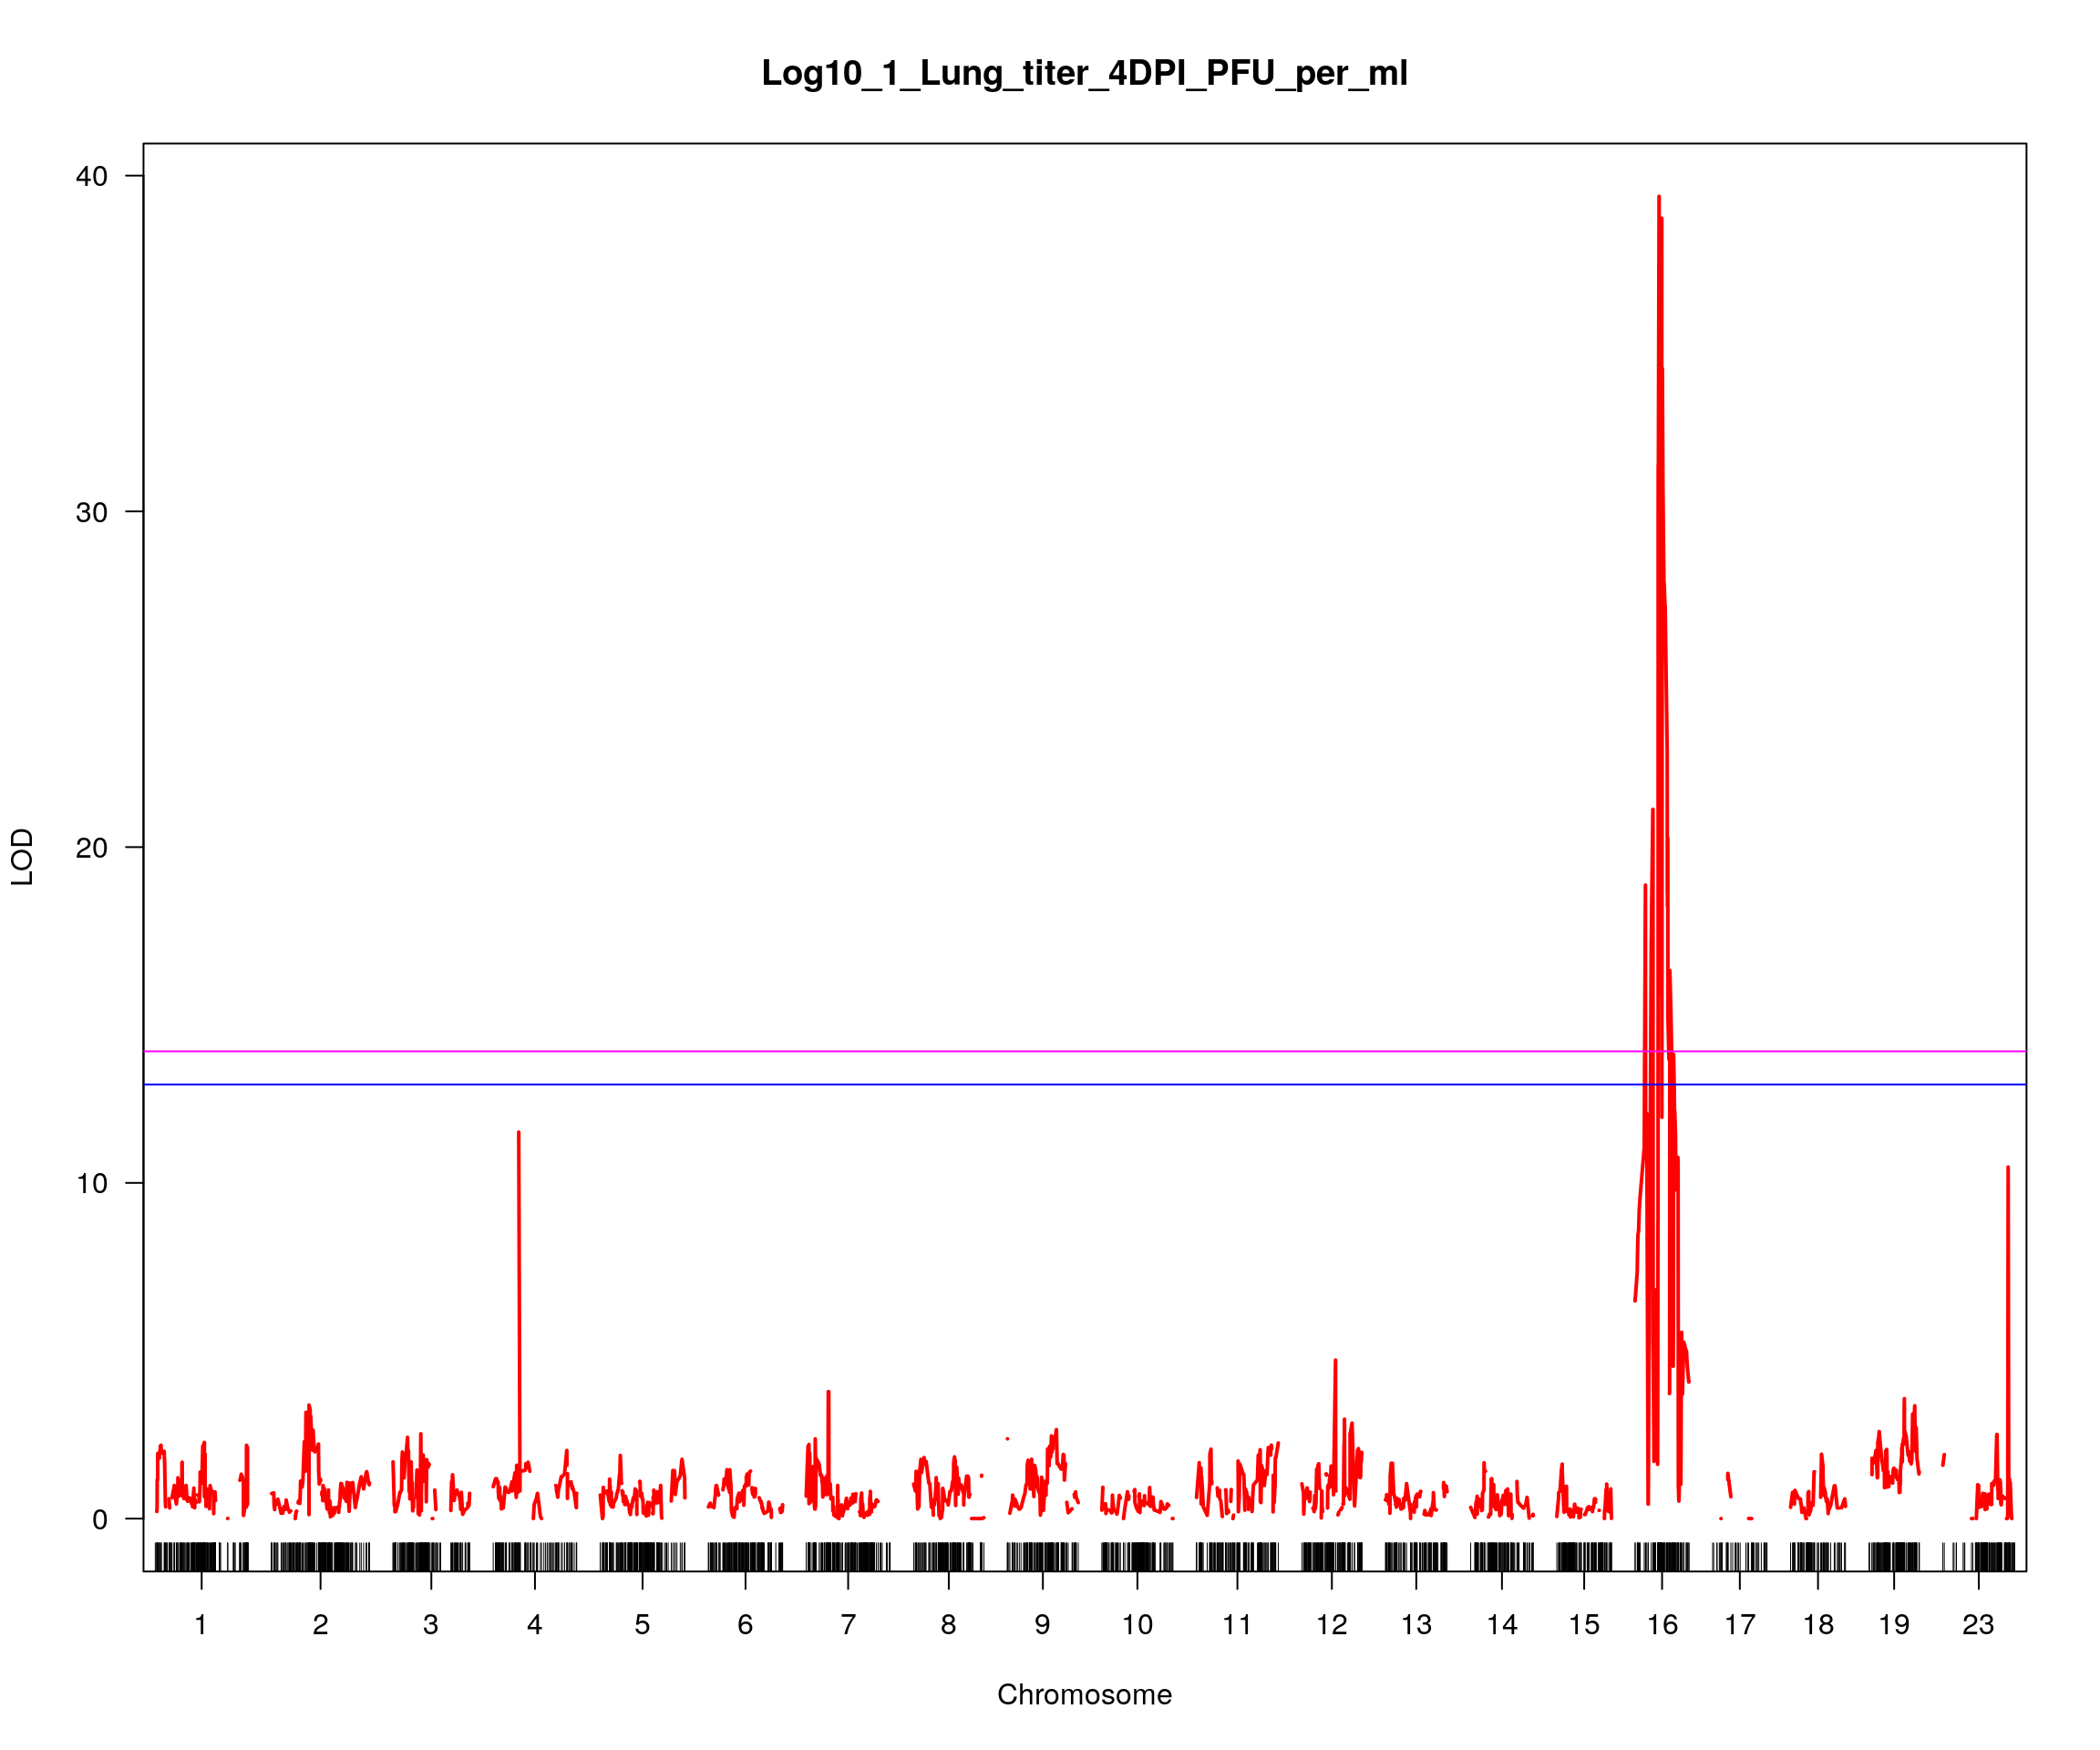
plot(out_3, col = c("gray"), main = "Log10_Lung_titer_4DPI_PFU_per_ml", ylab = "LOD")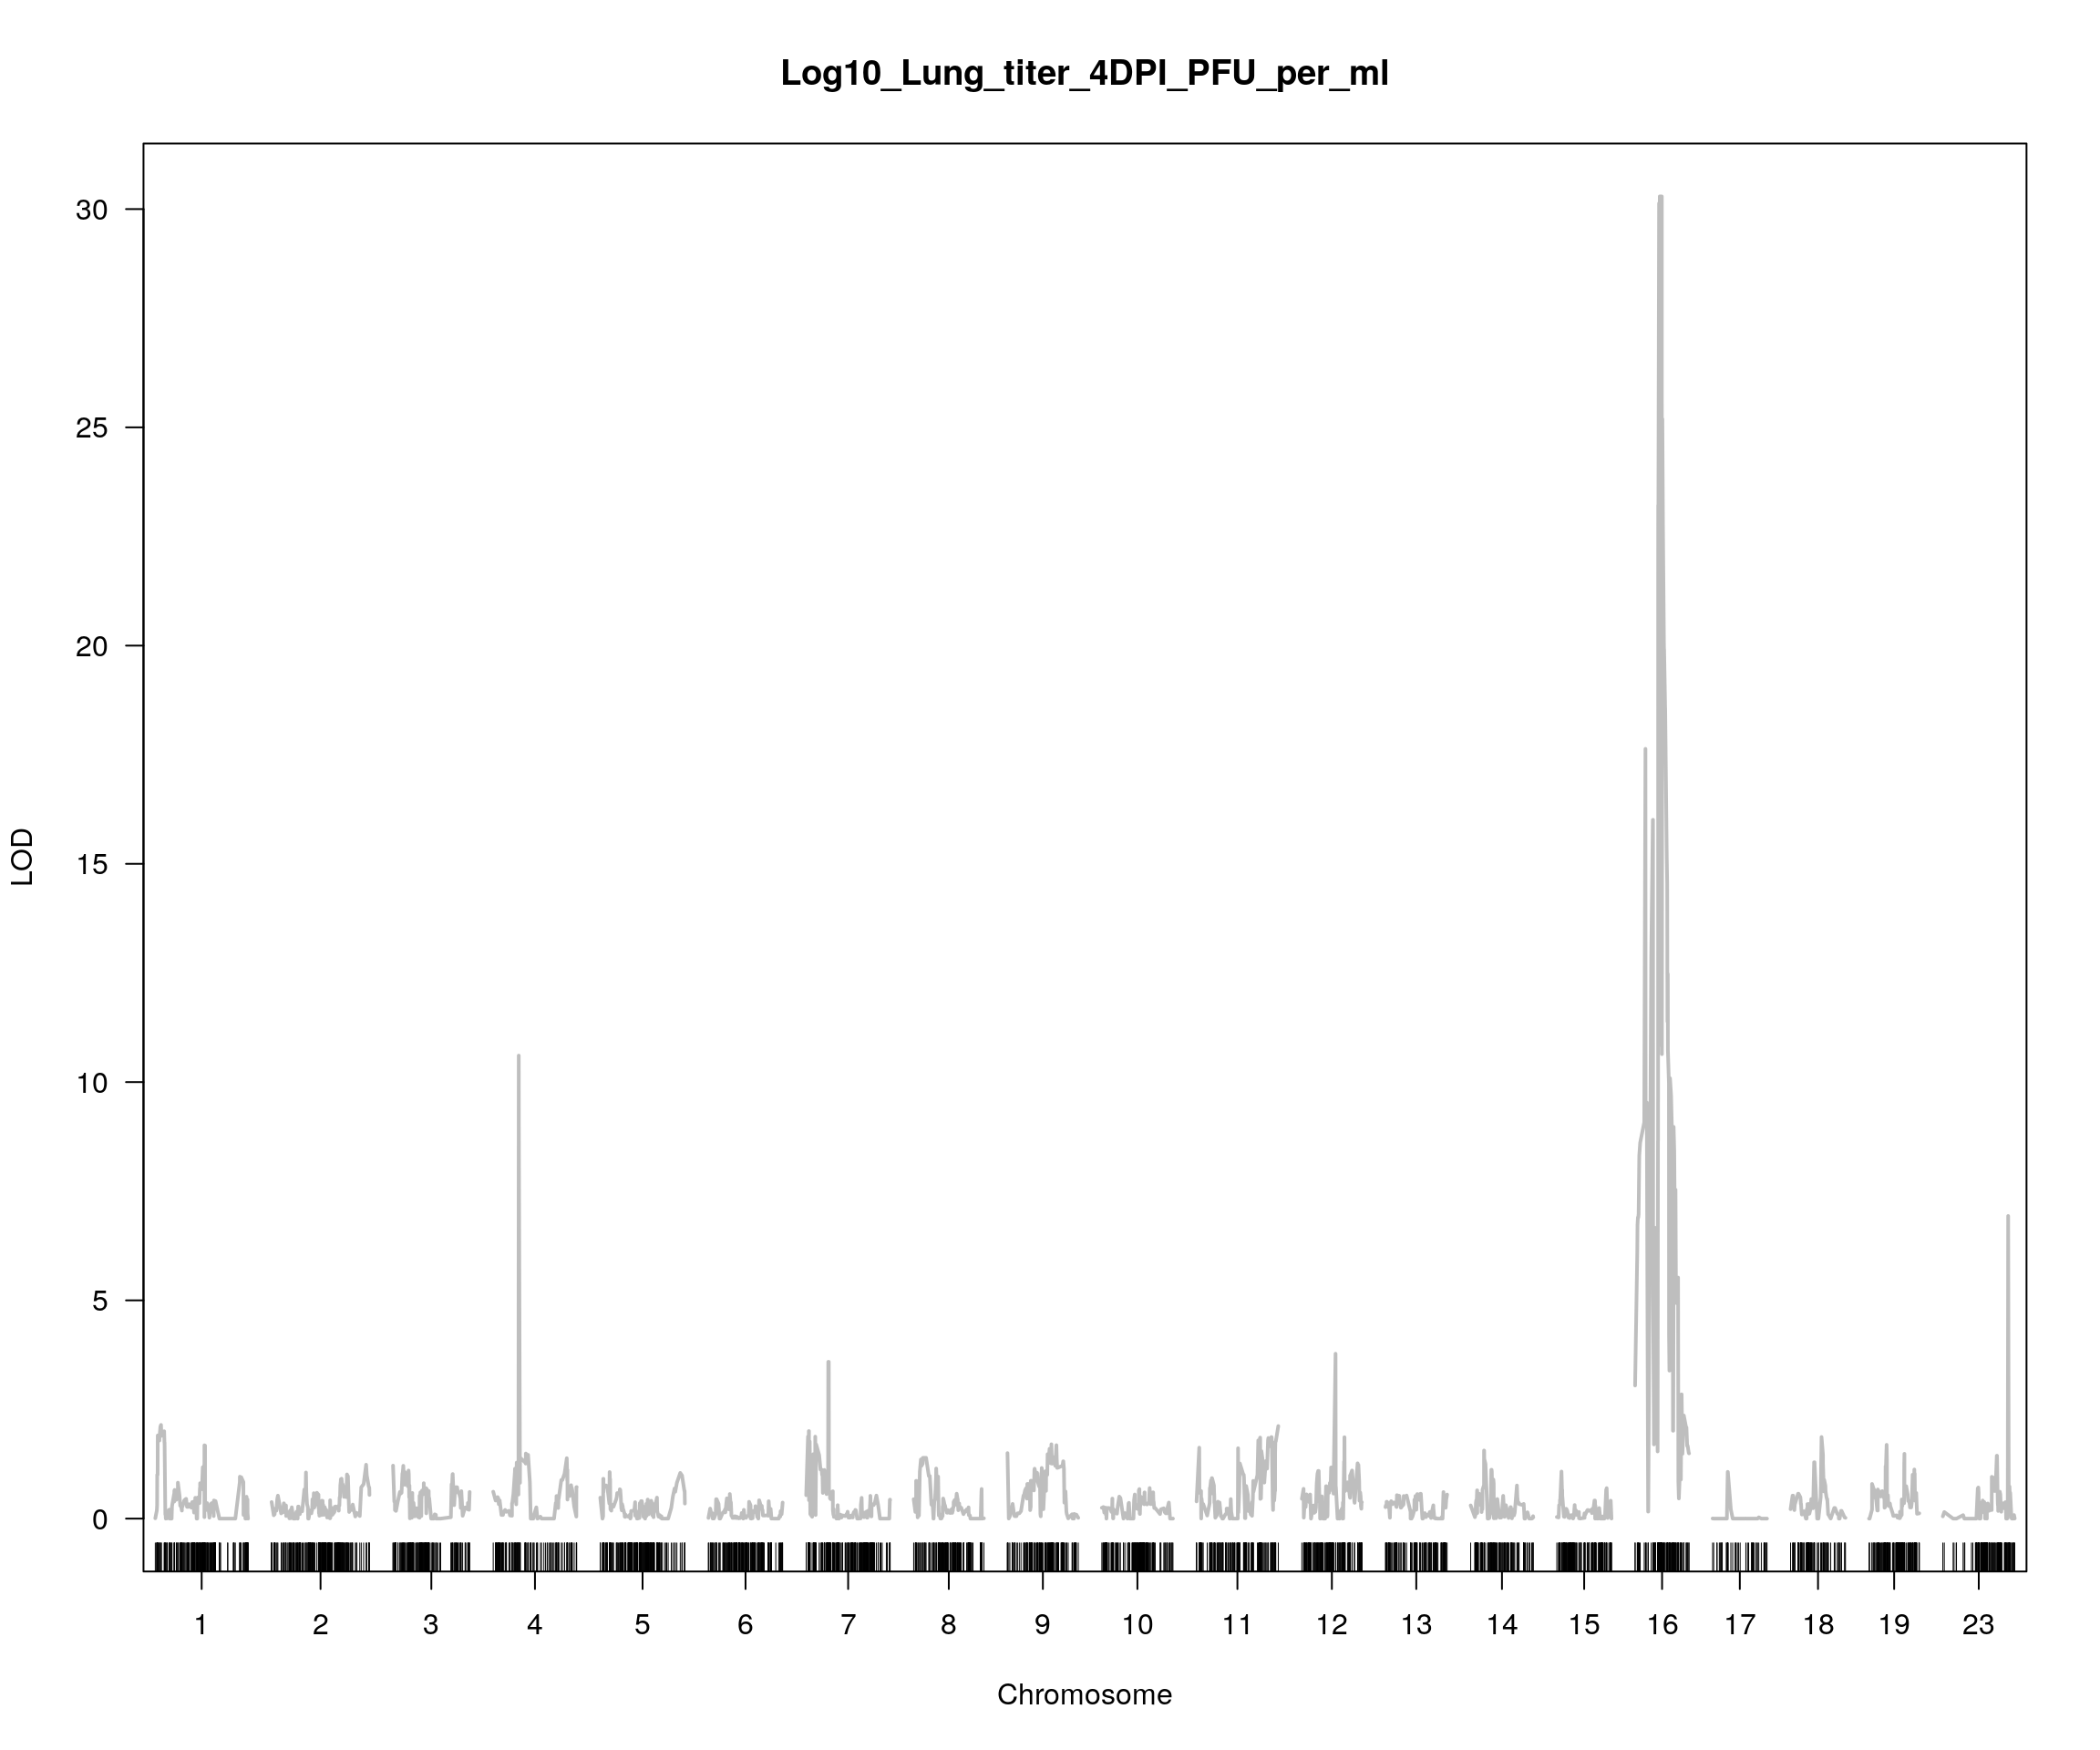
#1.5 drop interval on cM
drop_interval = find_peaks(out_1[, 3, drop = F], map = cross2$gmap, drop = 1.5, threshold = 13.8)
drop_interval
#   lodindex lodcolumn chr    pos      lod  ci_lo  ci_hi
# 1        1  lod.p.mu  16 25.427 39.38122 24.714 28.373

#chr16
plot(out_1, col = c("red"), chr = drop_interval$chr, ylab = "LOD")
plot(out_3, col = c("gray"), chr = drop_interval$chr, add = TRUE, ylab = "LOD")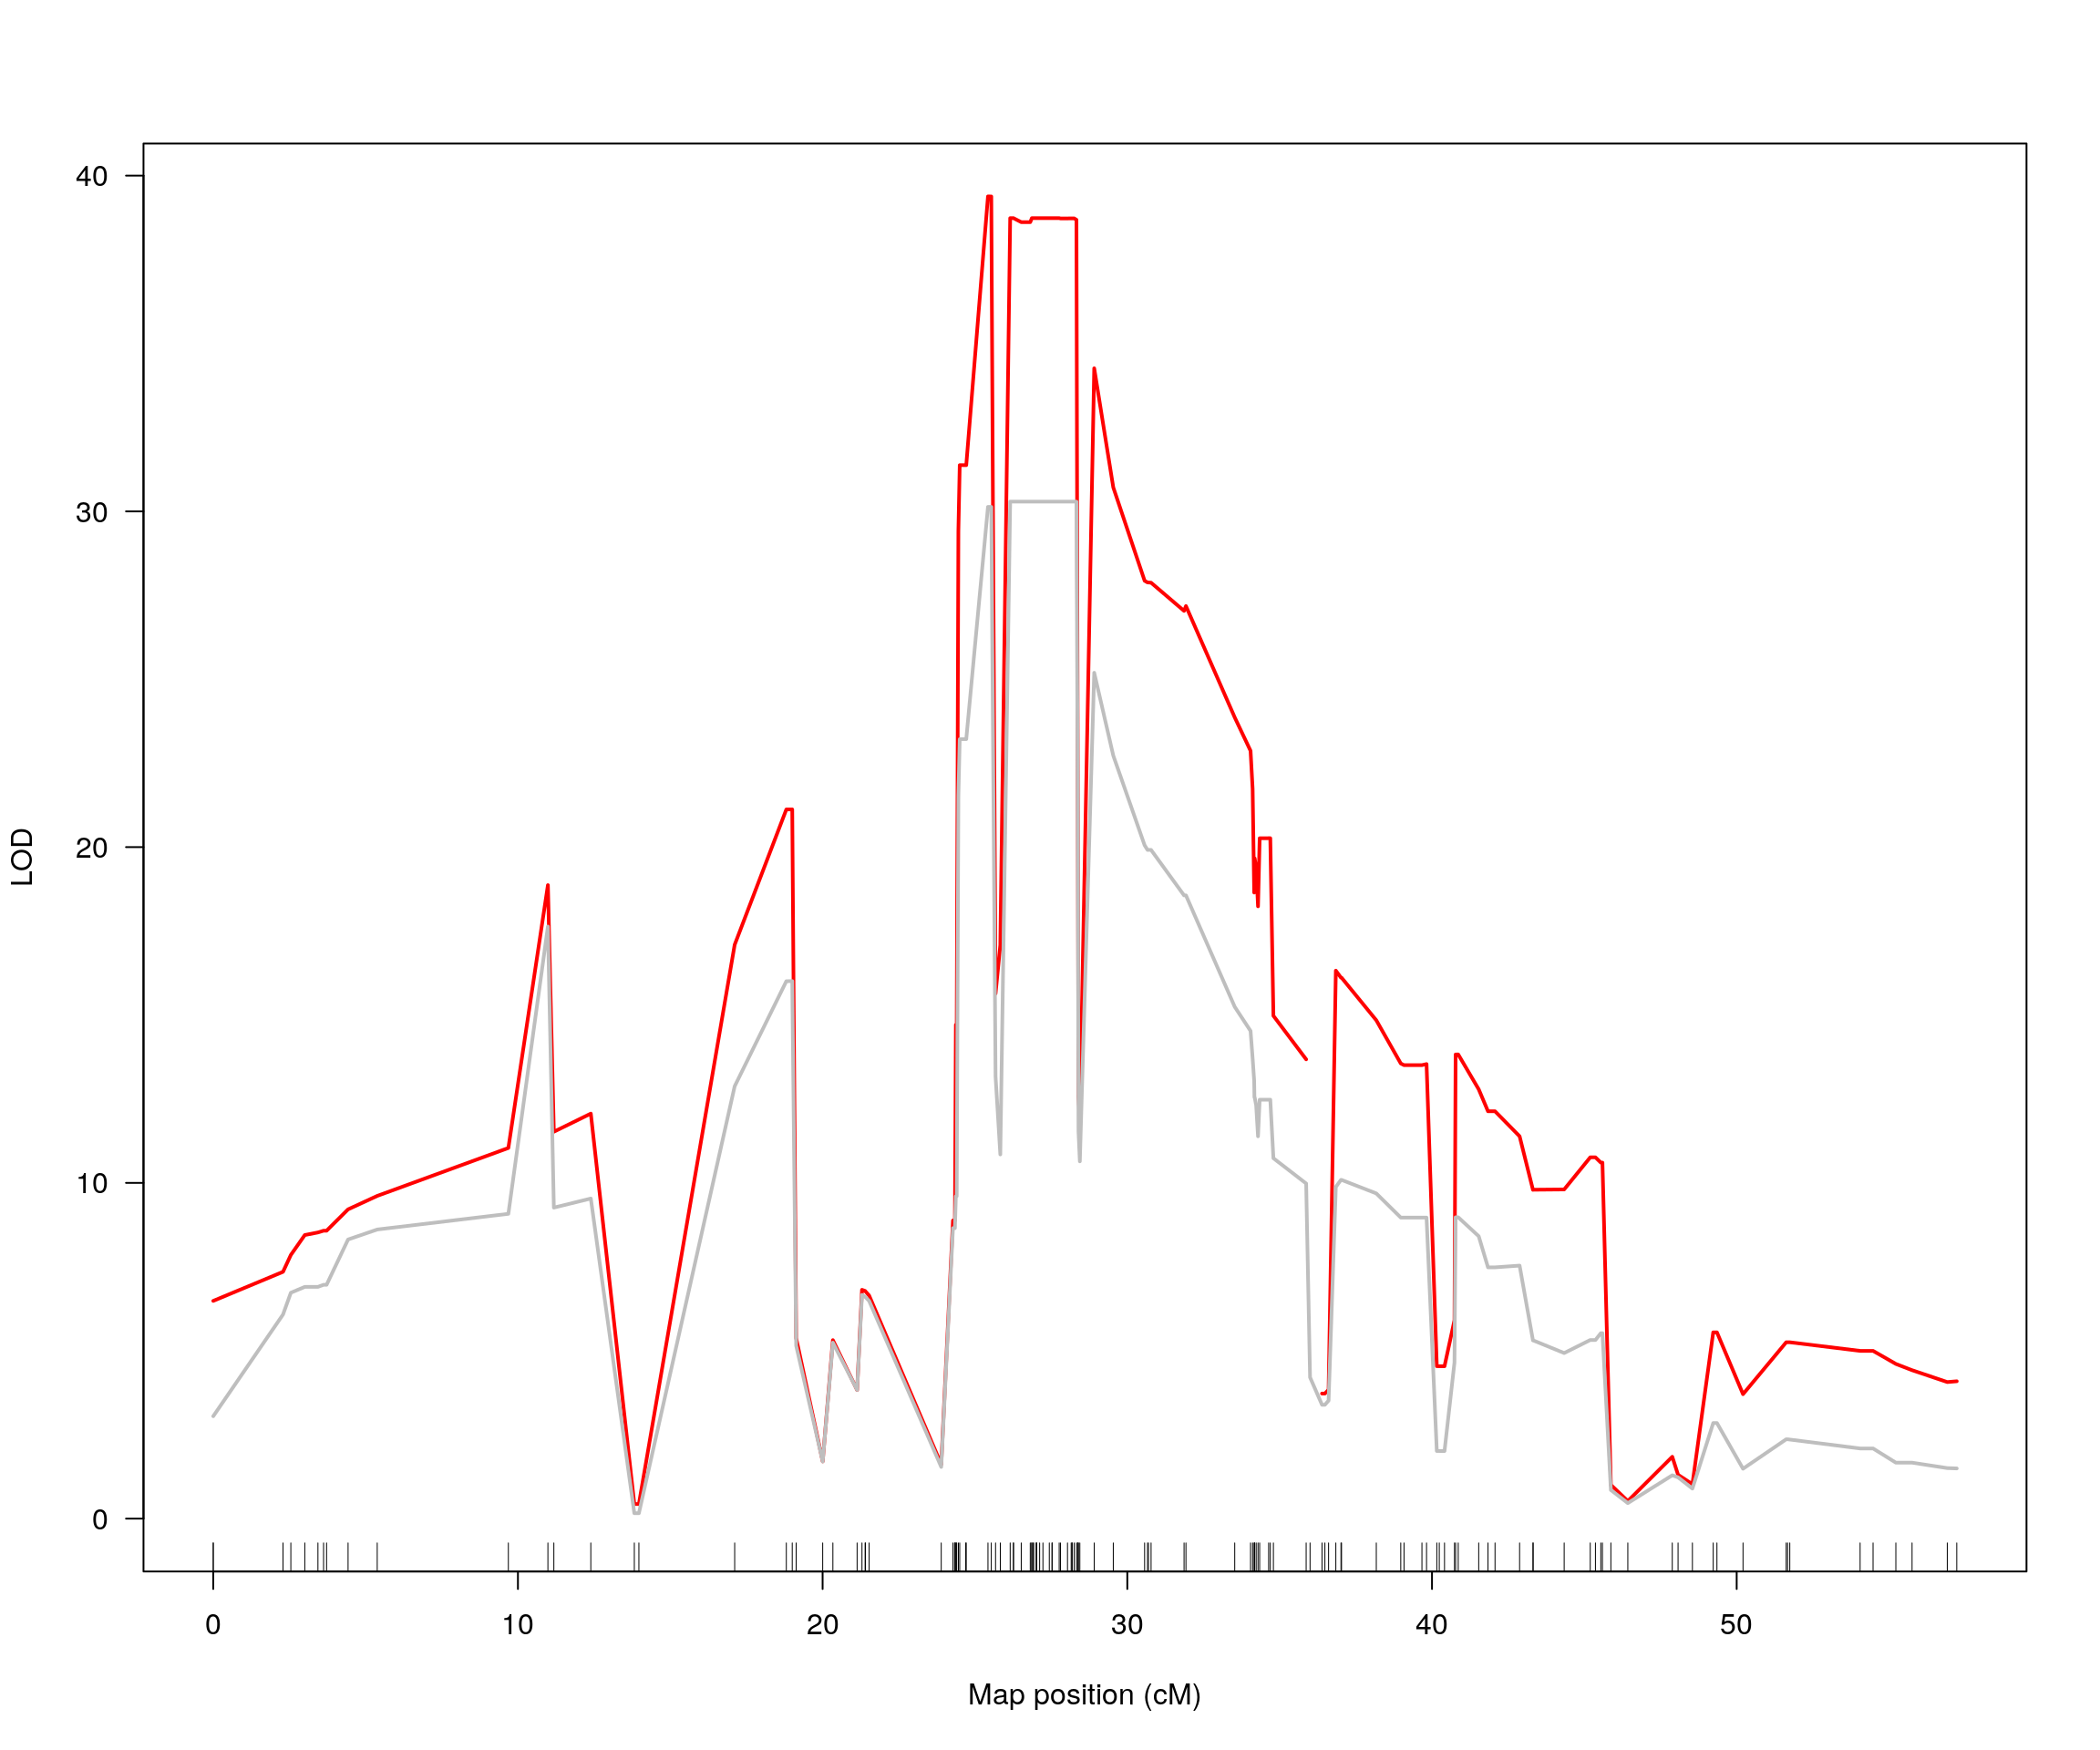
#peak
peak = lodint(out_1, chr = drop_interval$chr)
peak
#              chr    pos lod.p.mu     lod.p   lod.mu
# gUNC26636079  16 24.714 31.37650 8.1497336 23.22698
# gUNC26646526  16 25.427 39.38122 9.2301229 30.14591
# gJAX00068769  16 28.373 22.08531 0.4598105 19.97900
#peak marker
marker = rownames(peak)[which.max(peak$lod.p.mu)]
par(mar=c(3, 5, 4, 3))
plotPXG(f2_qtl, marker = marker, jitter = 0.25, pheno.col = 1, infer = F,
        main = marker, ylab = "Log10_1_Lung_titer_4DPI_PFU_per_ml",
        mgp = c(3.4,1,0))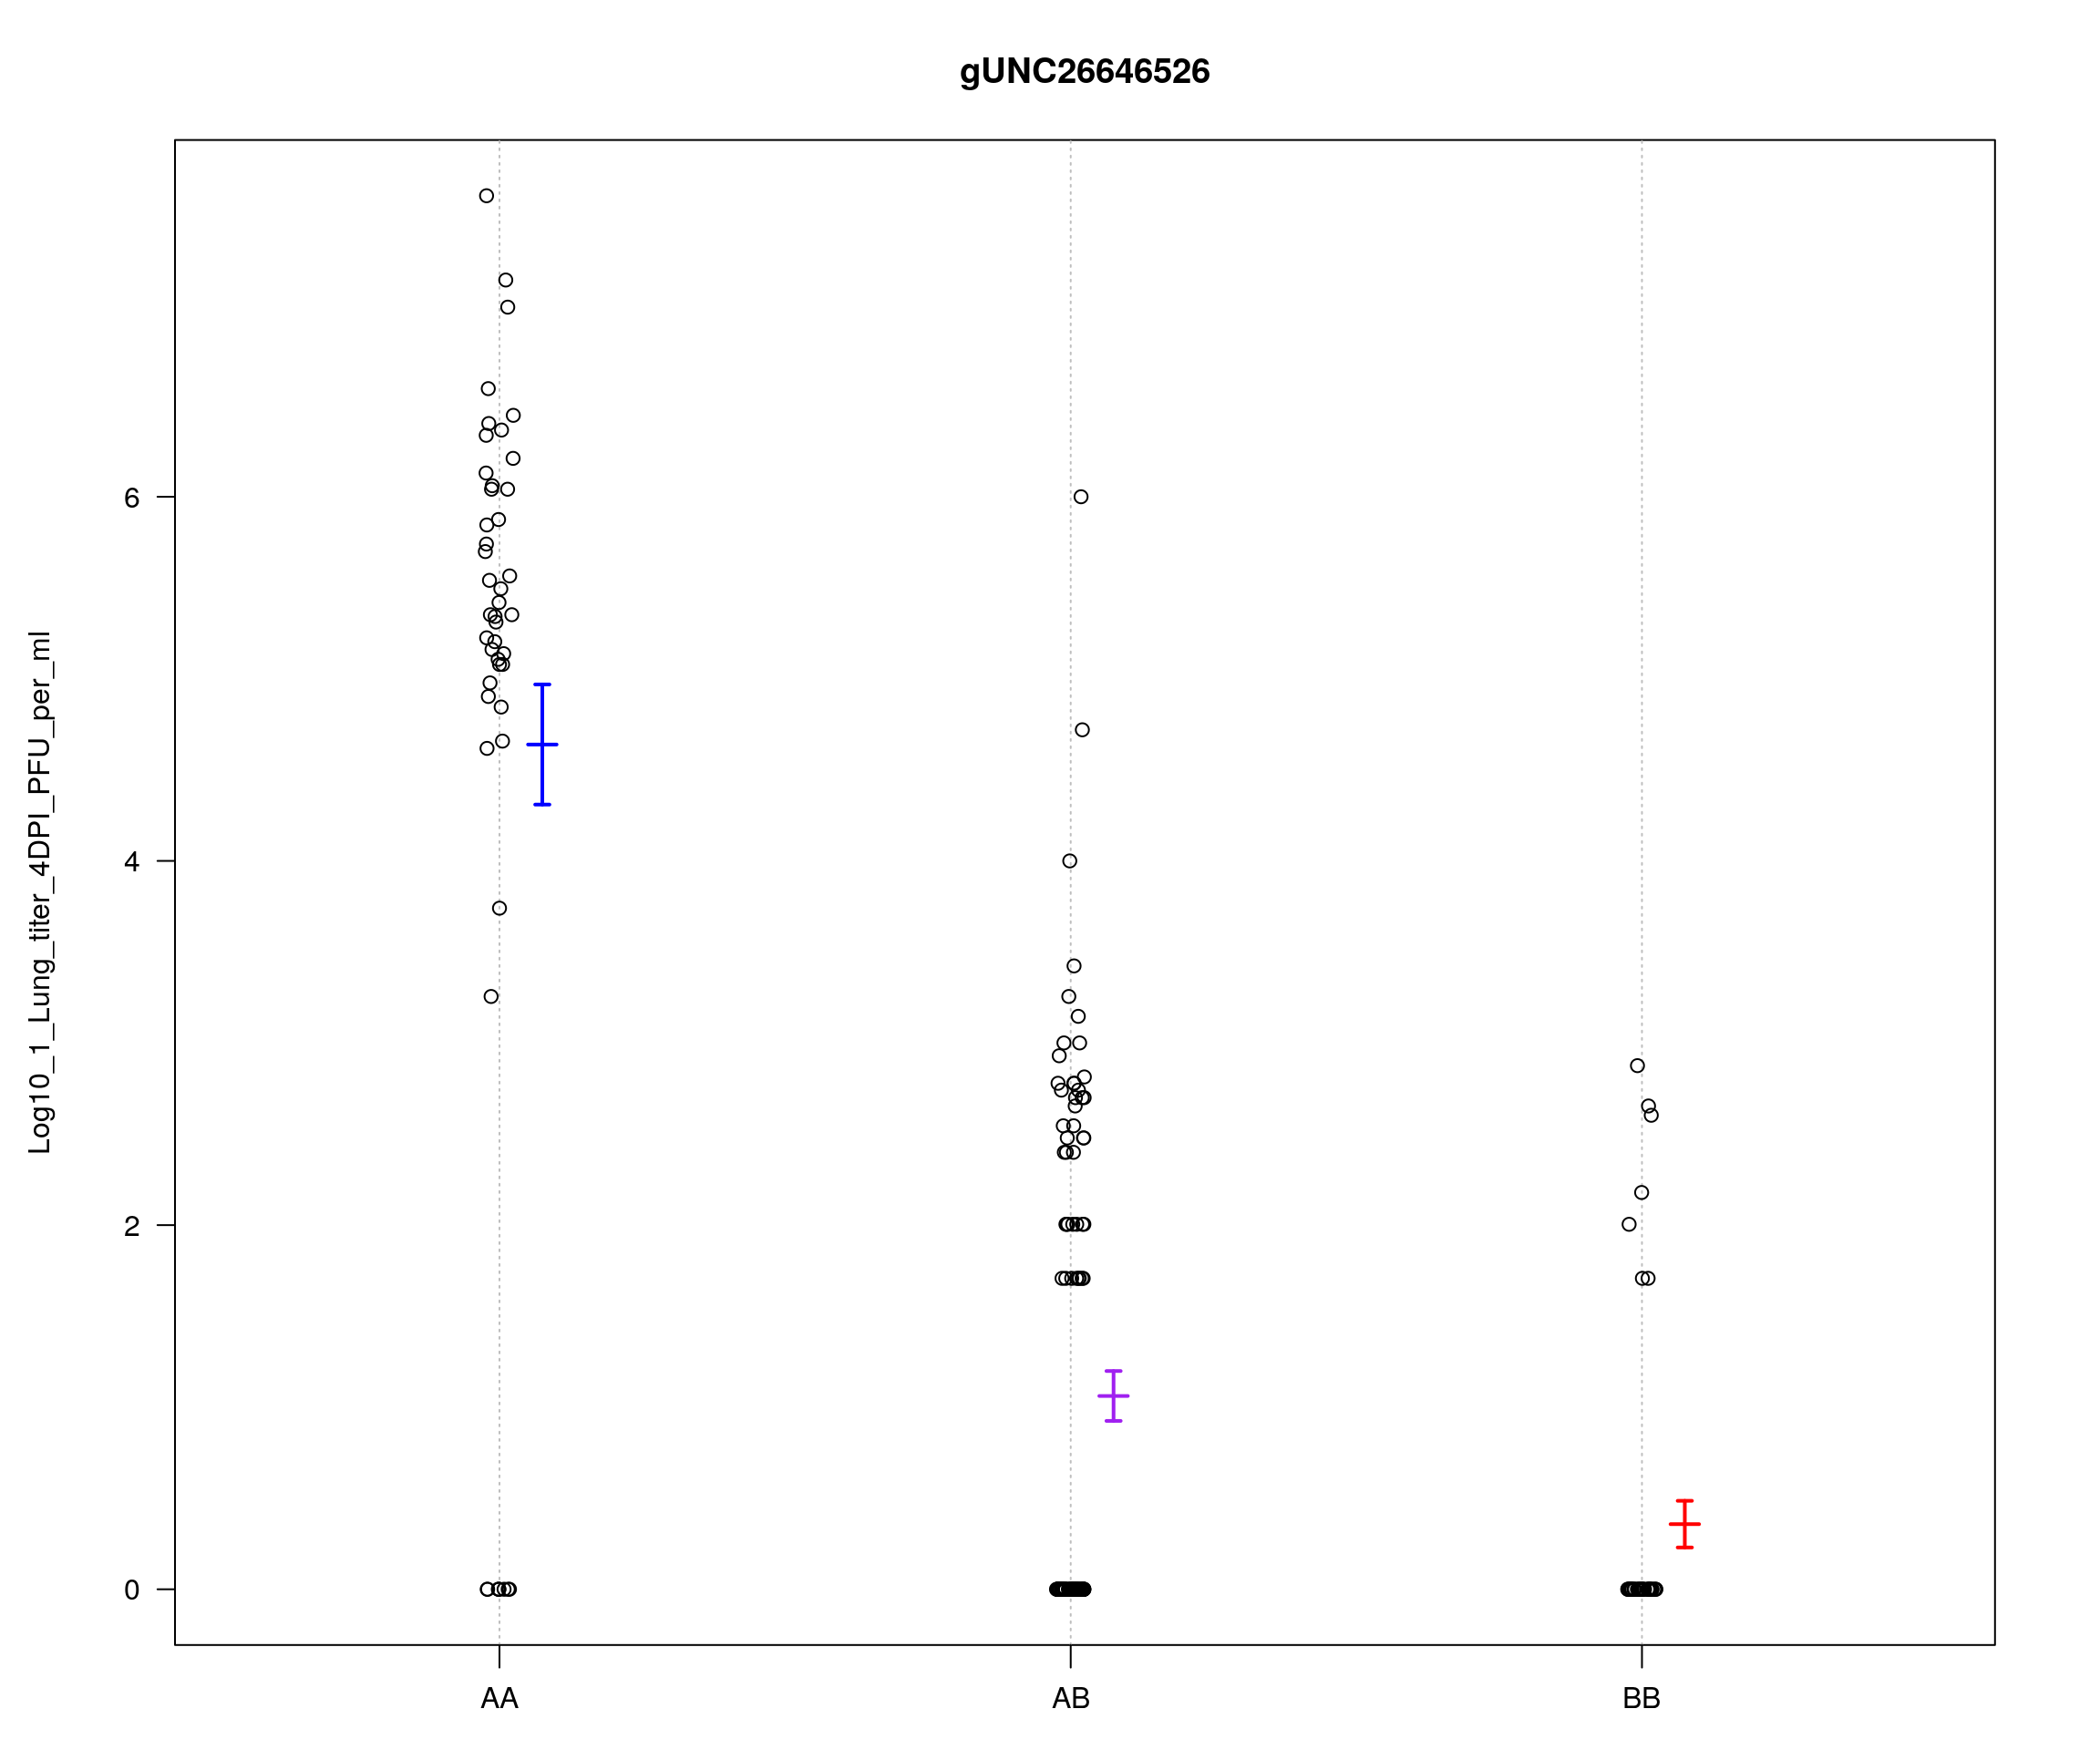
# Calculate error LOD scores
# cross <- calc.errorlod(cross, error.prob = 0.01)
# save(cross, file = "data/CC_SARS-2/cross.RData")
load("data/CC_SARS-2/cross.RData")

#chr16 1.5 drop interval on bp-----------------------------------------------------------------------
peak_bp = map[map$Chromosome == drop_interval$chr & map$cM_cox == drop_interval$pos & !is.na(map$cM_cox), "bp"]/10^6
peak_bp
# [1] 35.91377

start = map[map$Chromosome == drop_interval$chr & map$cM_cox == drop_interval$ci_lo & !is.na(map$cM_cox), "bp"]/10^6
start
# [1] 35.15812
end   = map[map$Chromosome == drop_interval$chr & map$cM_cox == drop_interval$ci_hi & !is.na(map$cM_cox), "bp"]/10^6
end  = end[[1]]
#genes in the qtl region
query_variants <- create_variant_query_func("data/cc_variants.sqlite")
query_genes <- create_gene_query_func("data/mouse_genes_mgi.sqlite")
chr16_gene <- query_genes(chr = 16, start, end)

#add bp
out_1_bp <- out_1 %>%
  rownames_to_column(.) %>%
  left_join(minimuga[, c(1,3,4)], by = c("rowname" = "marker")) %>%
  dplyr::mutate(pos = bp_mm10/10^6) %>%
  column_to_rownames()
class(out_1_bp) <- c("scanone","data.frame")

#plot
layout(mat = matrix(c(1:2),
                    nrow = 2,
                    ncol = 1),
       heights = c(1, 2))    # Heights of the two rows
# Plot 1
par(mar = c(0.01, 5, 2, 0.5))
#Create the base plot
plot(out_1_bp, col = c("red"), chr = 16, main = "CC_SARS Chr16 QTL interval", xlab = "", ylab = "LOD", xlim = c(start, end), ylim = c(0, 60))
text(peak_bp, 25, paste0(drop_interval$chr, "@", drop_interval$pos, "cM"), cex = 0.75)
segments(x0 = peak_bp,
         x1 = peak_bp,
         y0 = 0,
         y1 = drop_interval$lod,
         col="black", lty=2, lwd=1)
# Plot 2
par(mar = c(5.10, 5, 0, 0.5))
plot_genes(chr16_gene, bgcolor="white", xlim = c(start, end))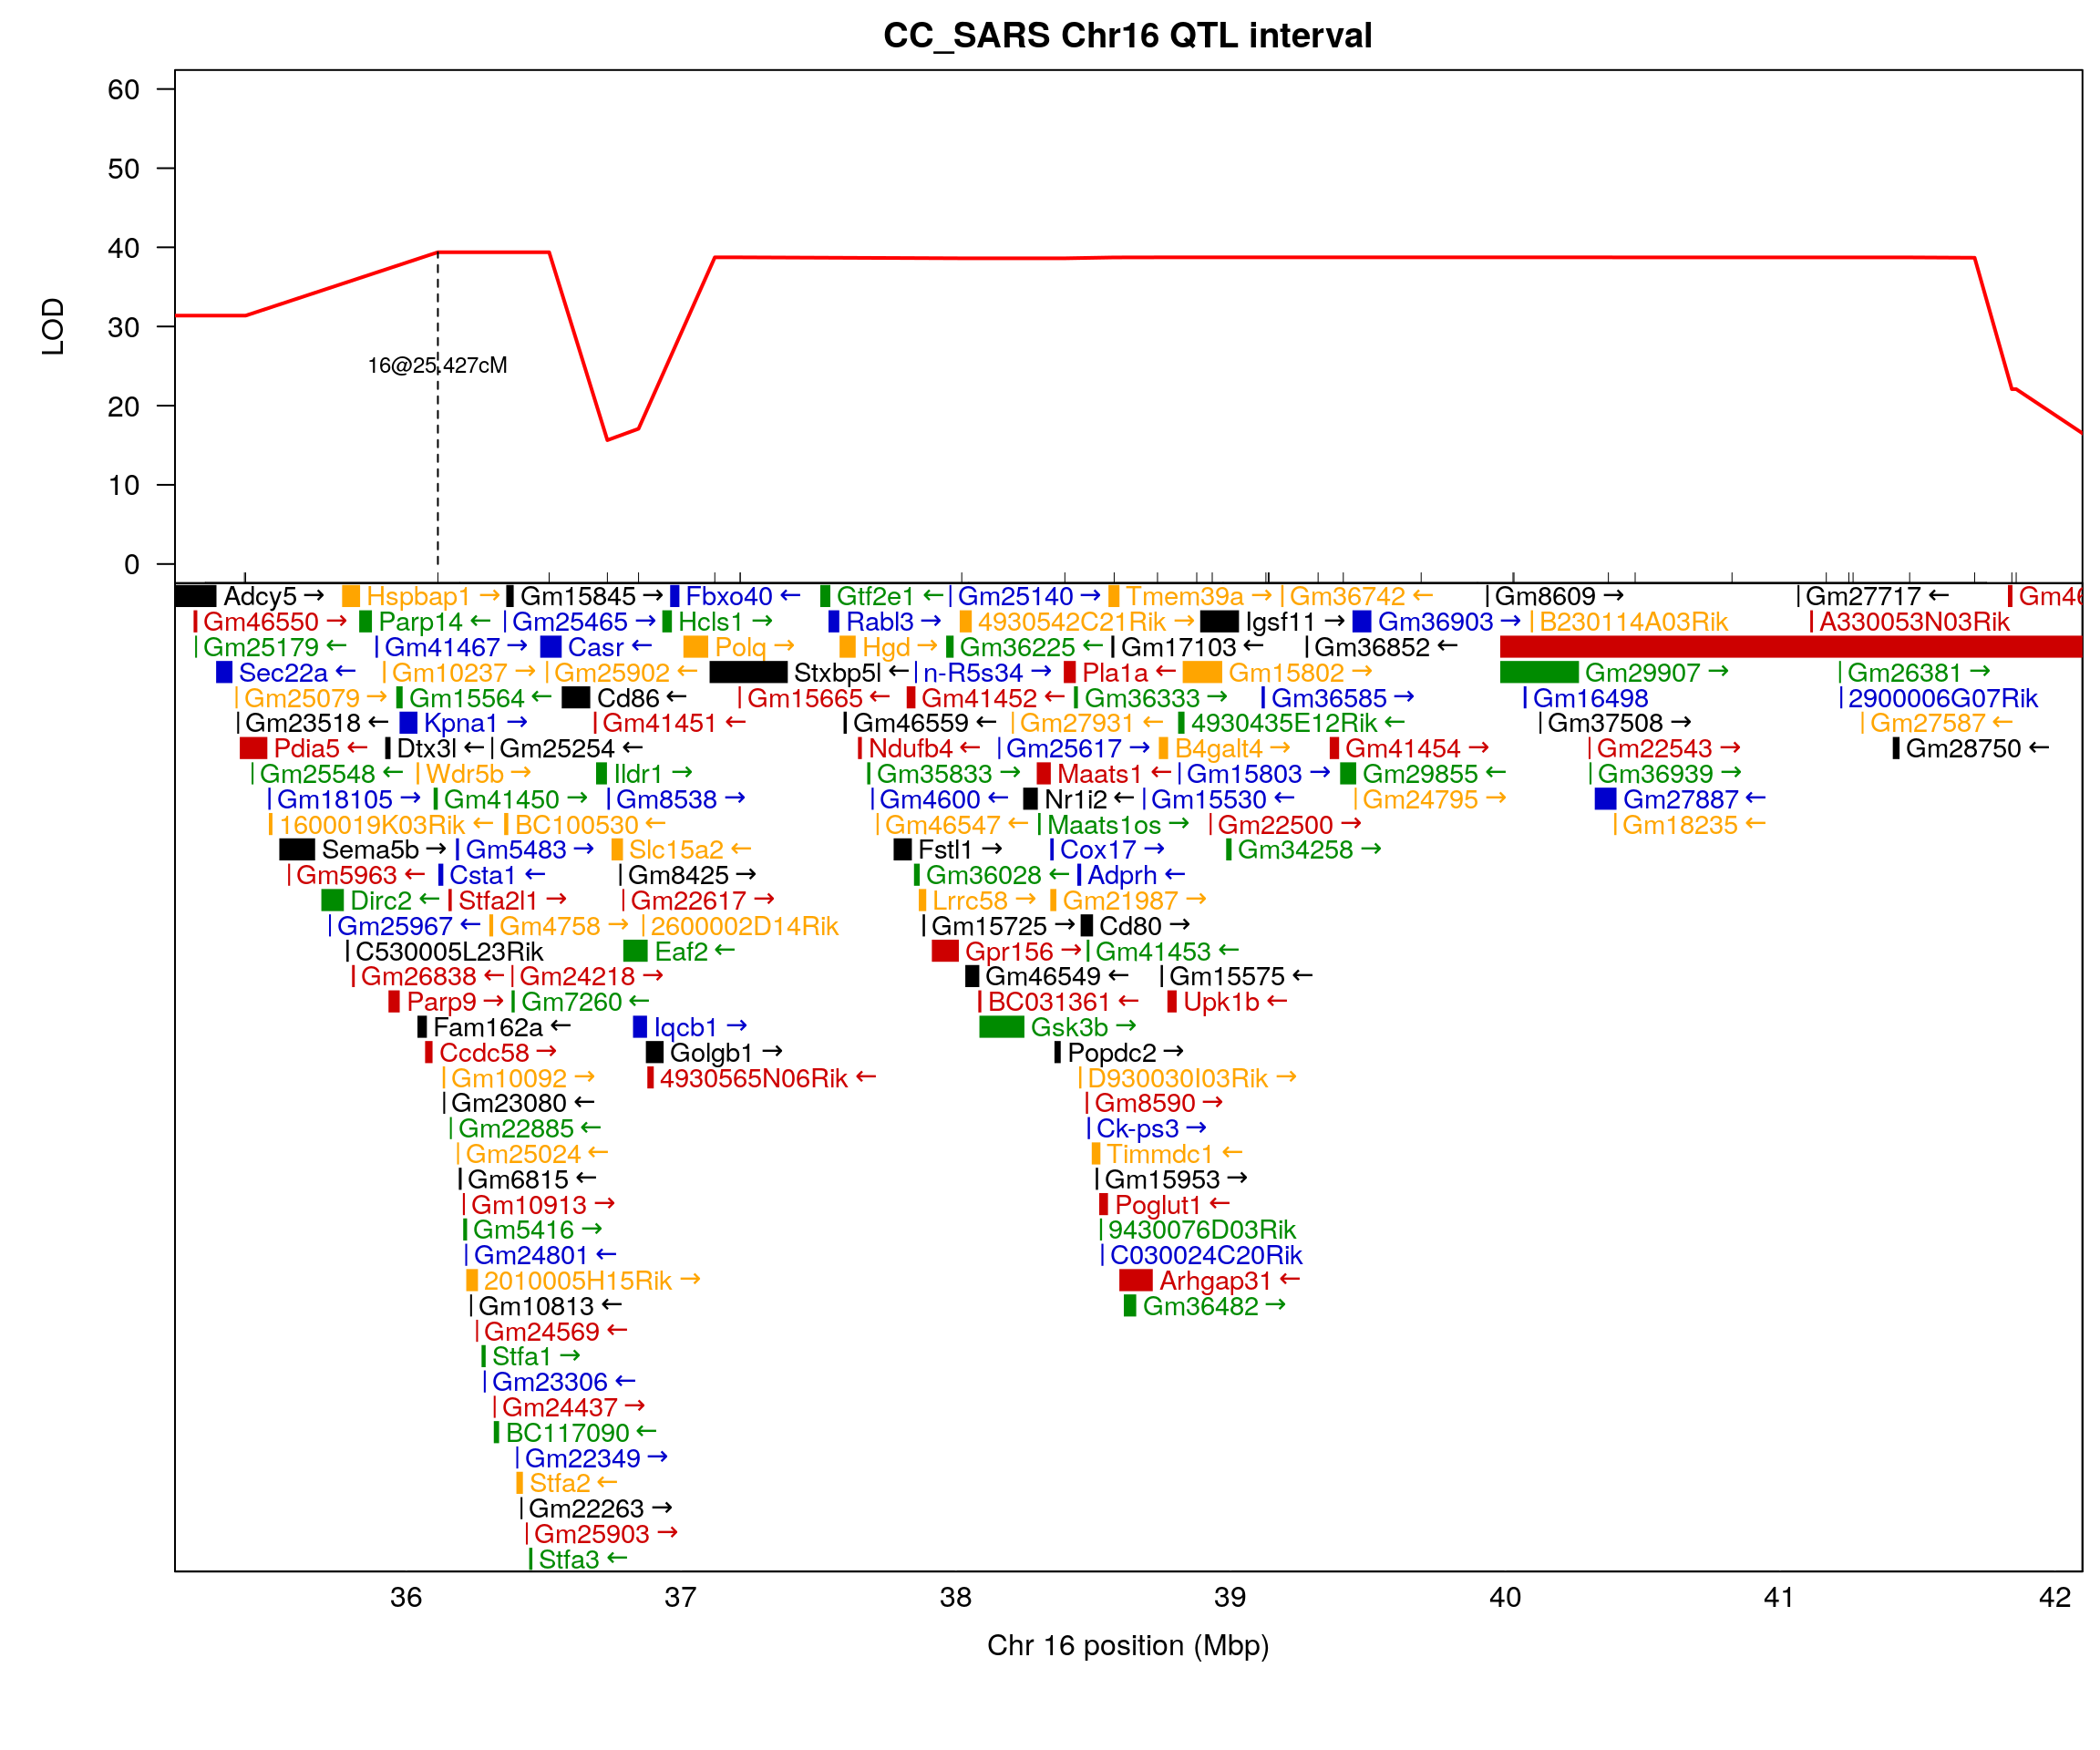
#save plot
pdf(file = "data/CC_SARS-2/CC_SARS_Chr16_QTL_interval.pdf", width = 6, height = 6)
#plot
layout(mat = matrix(c(1:2),
                    nrow = 2,
                    ncol = 1),
       heights = c(1, 2))    # Heights of the two rows
# Plot 1
par(mar = c(0.01, 5, 2, 0.5))
#Create the base plot
plot(out_1_bp, col = c("red"), chr = 16, main = "CC_SARS Chr16 QTL interval", xlab = "", ylab = "LOD", xlim = c(start, end), ylim = c(0, 60))
text(peak_bp, 25, paste0(drop_interval$chr, "@", drop_interval$pos, "cM"), cex = 0.75)
segments(x0 = peak_bp,
         x1 = peak_bp,
         y0 = 0,
         y1 = drop_interval$lod,
         col="black", lty=2, lwd=1)
# Plot 2
par(mar = c(5.10, 5, 0, 0.5))
plot_genes(chr16_gene, bgcolor="white", xlim = c(start, end))
dev.off()
# png
#   2
Interactive qtl plot
#interactive qtl plot
iplotScanone(out_1, f2_qtl,chr = drop_interval$chr)
QTL mapping on DPI
# dpi_out <- scanone(f2_qtl, pheno.col = 3:11, n.cluster = 20)
# save(dpi_out, file = "data/CC_SARS-2/dpi_out.RData")
# dpi_operm <- scanone(f2_qtl, pheno.col = 3:11, n.cluster = 20, n.perm = 1000)
# save(dpi_operm, file = "data/CC_SARS-2/dpi_operm.RData")
load("data/CC_SARS-2/dpi_out.RData")
load("data/CC_SARS-2/dpi_operm.RData")
load("data/CC_SARS-2/cross.RData")
query_variants <- create_variant_query_func("data/cc_variants.sqlite")
query_genes <- create_gene_query_func("data/mouse_genes_mgi.sqlite")
variants <- list()
for(i in 1:9){
  print(paste0("pheno = ", i))
  plot(dpi_out, lodcolumn = i, col = c("blue"), ylim = c(0, max(max(dpi_out[, i + 2]),
                                                                summary(dpi_operm[,i], alpha=c(0.05))[[1]])))
  add.threshold(dpi_out, lodcolumn = i, perms = dpi_operm, alpha = 0.05, col="red")
  add.threshold(dpi_out, lodcolumn = i, perms = dpi_operm, alpha = 0.1, col="blue")
  #1.5 drop interval on cM
  drop_interval = find_peaks(dpi_out[,i+2, drop=F], map = cross2$gmap, drop = 1.5, threshold =
                               summary(dpi_operm[,i], alpha=c(0.05))[[1]])
  print(drop_interval)
  if(nrow(drop_interval) != 0){
    for(j in 1:nrow(drop_interval)){
      print(paste0("row = ", j))
      chr = drop_interval[j, "chr"]
      pos = drop_interval[j, "pos"]
      ci_lo = drop_interval[j, "ci_lo"]
      ci_hi = drop_interval[j, "ci_hi"]
      lod = drop_interval[j, "lod"]
      # 1.5 drop interval on bp
      peak_bp = map[map$Chromosome == chr & map$cM_cox == pos & !is.na(map$cM_cox), "bp"]/10^6
      print(peak_bp)
      start = unique(map[map$Chromosome == chr & map$cM_cox == ci_lo & !is.na(map$cM_cox), "bp"]/10^6)
      print(start)
      end   = unique(map[map$Chromosome == chr & map$cM_cox == ci_hi & !is.na(map$cM_cox), "bp"]/10^6)
      print(end)
      #genes in the qtl region
      chr_gene <- query_genes(chr, start, end)
      snp <- query_variants(chr, start, end)
      variants[[i]] <- snp %>%
        dplyr::mutate(Pheno = colnames(dpi_out)[[i+2]], .before = 1)

      # #add bp
      # out_bp <- dpi_out[, c(1,2,i+2)] %>%
      #   rownames_to_column(.) %>%
      #   left_join(minimuga[, c(1,3,4)], by = c("rowname" = "marker")) %>%
      #   dplyr::mutate(pos = bp_mm10/10^6) %>%
      #   column_to_rownames()
      # class(out_bp) <- c("scanone","data.frame")

      #plot
      # if((ci_hi - ci_lo) < 30){
      #   layout(mat = matrix(c(1:2),
      #                       nrow = 2,
      #                       ncol = 1),
      #          heights = c(1, 2))    # Heights of the two rows
      #   # Plot 1
      #   par(mar = c(0.01, 5, 2, 0.5))
      #   #Create the base plot
      #   plot(out_bp, col = c("red"), chr = chr, main = paste0("CC_SARS Chr", chr, " QTL interval"), xlab = "", ylab = "LOD", xlim = c(start, end), ylim = c(0, max(max(dpi_out[, i + 2]),
      #                                                                                                                                                              summary(dpi_operm[,i], alpha=c(0.05))[[1]])))
      #   text(peak_bp, peak_bp-5, paste0(chr, "@", pos, "cM"), cex = 0.75)
      #   segments(x0 = peak_bp,
      #            x1 = peak_bp,
      #            y0 = 0,
      #            y1 = lod,
      #            col="black", lty=2, lwd=1)
      #   # Plot 2
      #   par(mar = c(5.10, 5, 0, 0.5))
      #   plot_genes(chr_gene, bgcolor="white", xlim = c(start, end))
      # }
    }
  }
}
# [1] "pheno = 1"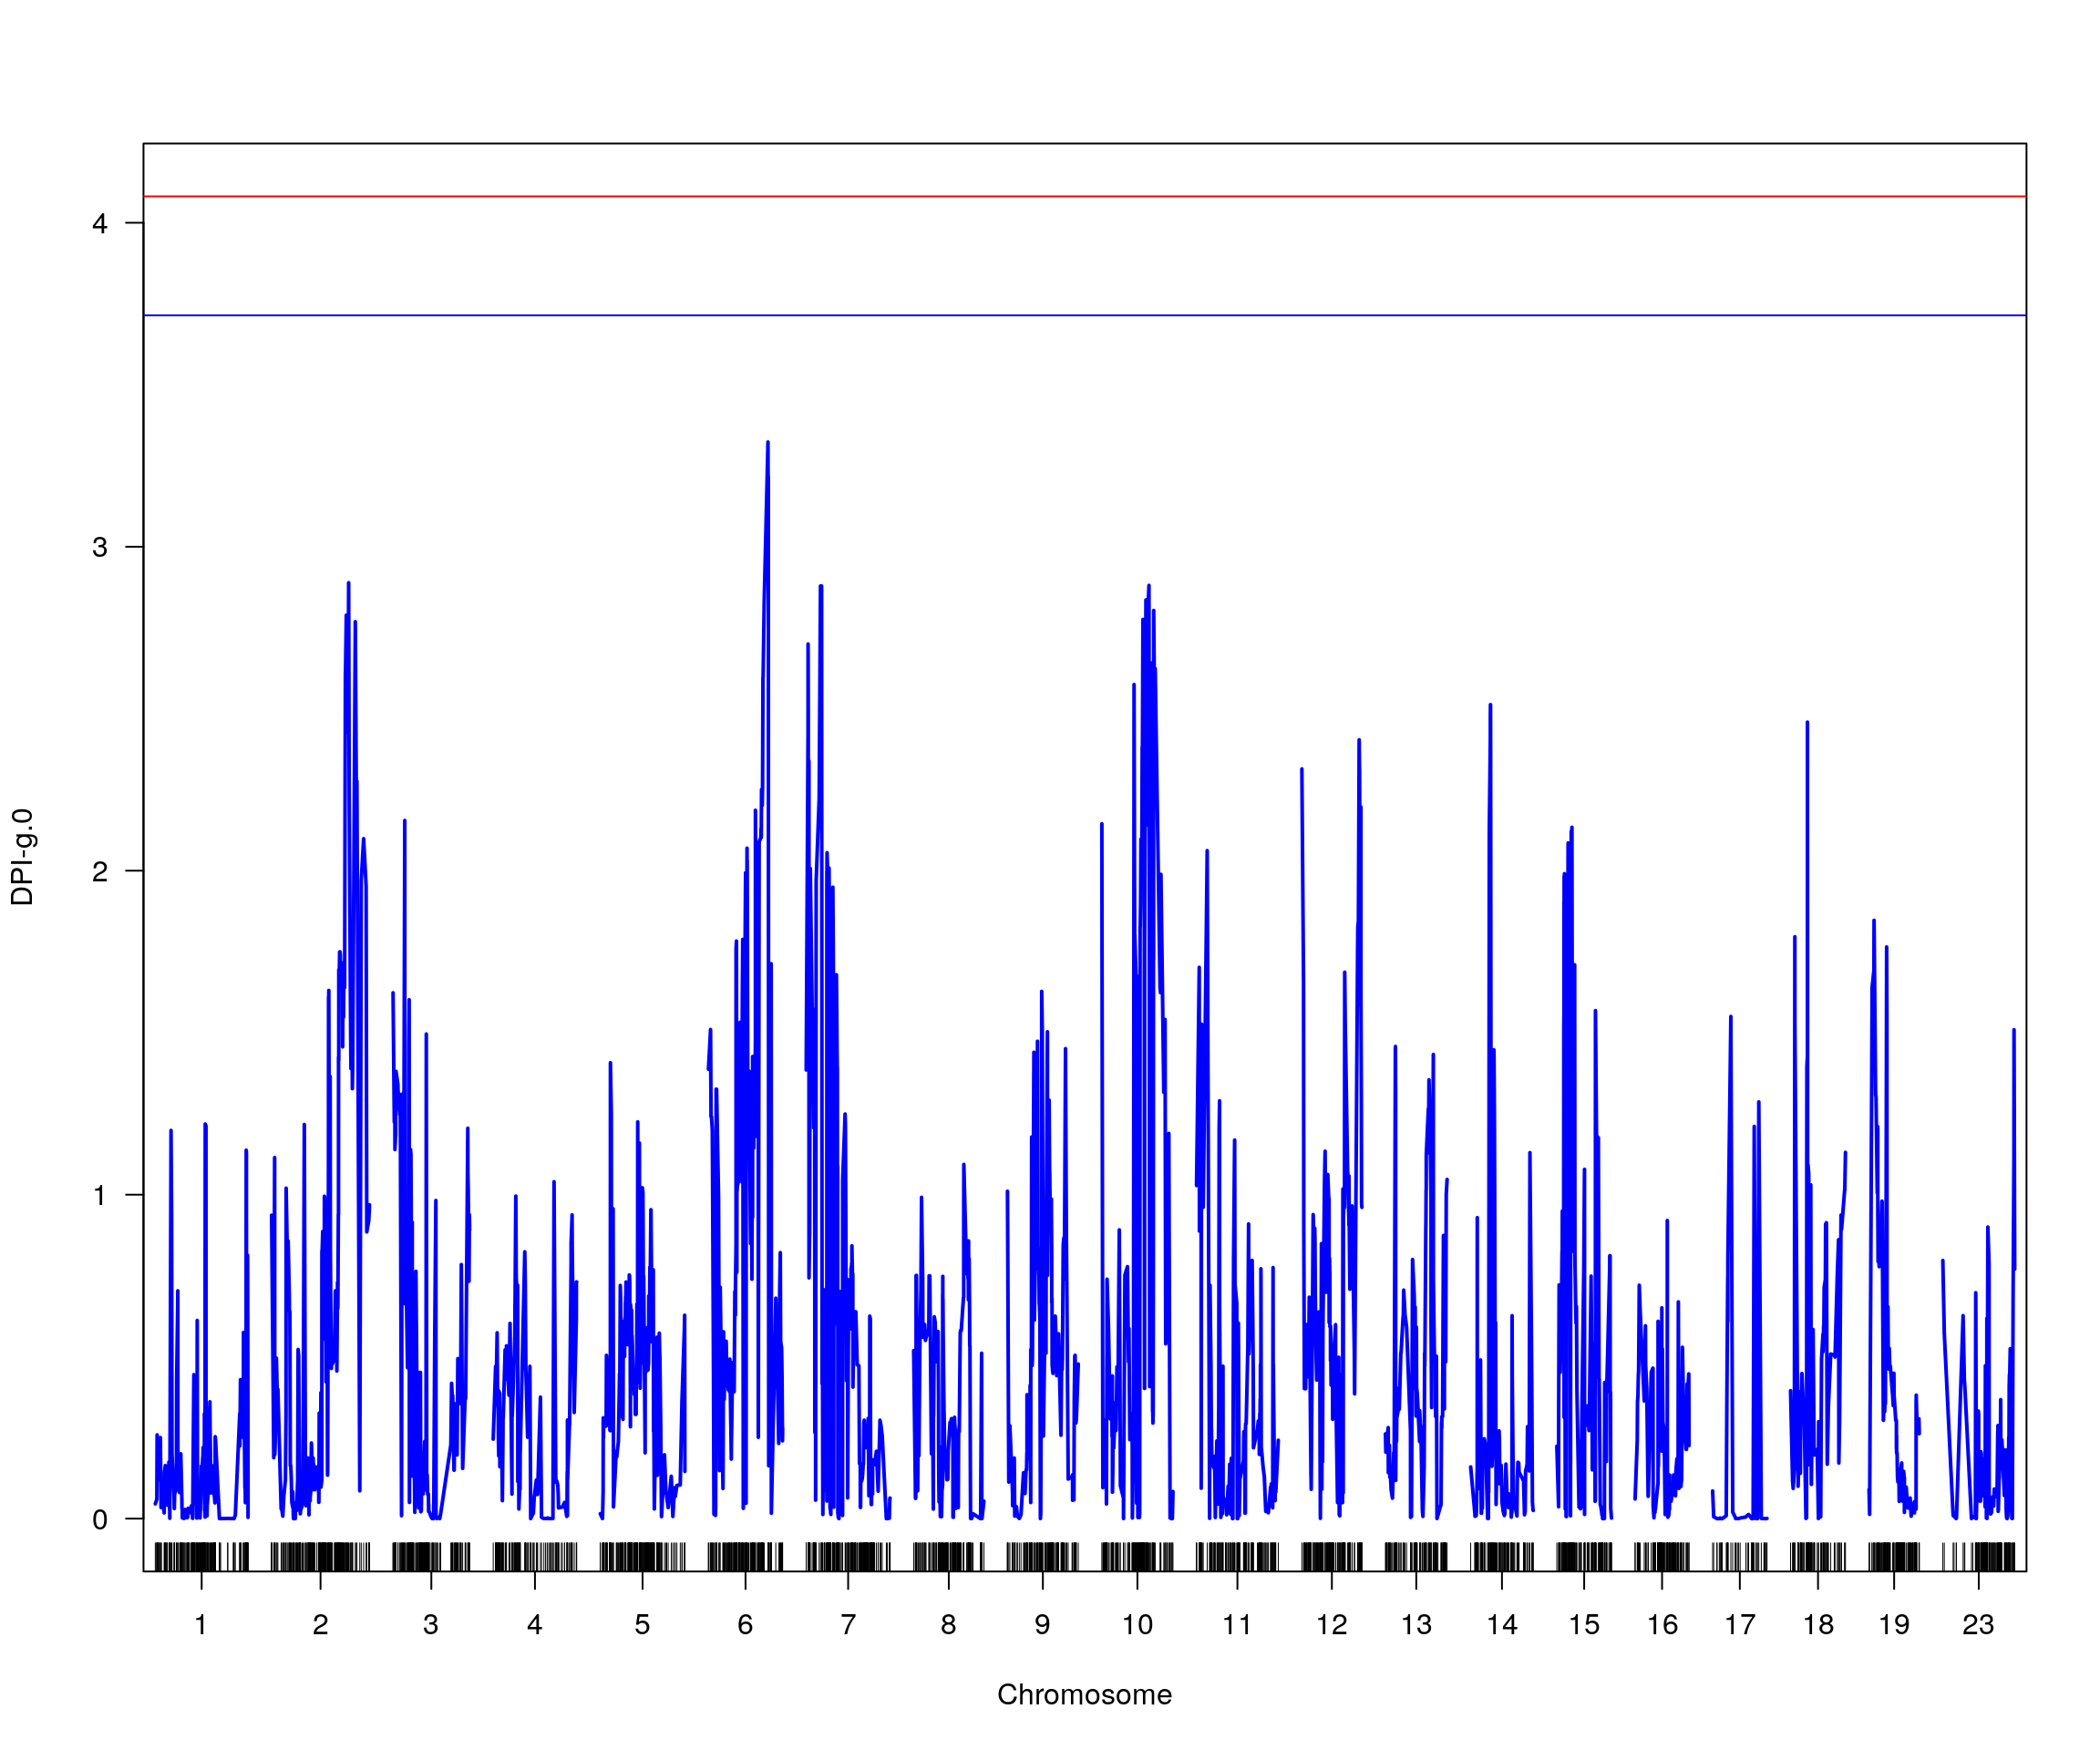
# [1] lodindex  lodcolumn chr       pos       lod       ci_lo     ci_hi
# <0 rows> (or 0-length row.names)
# [1] "pheno = 2"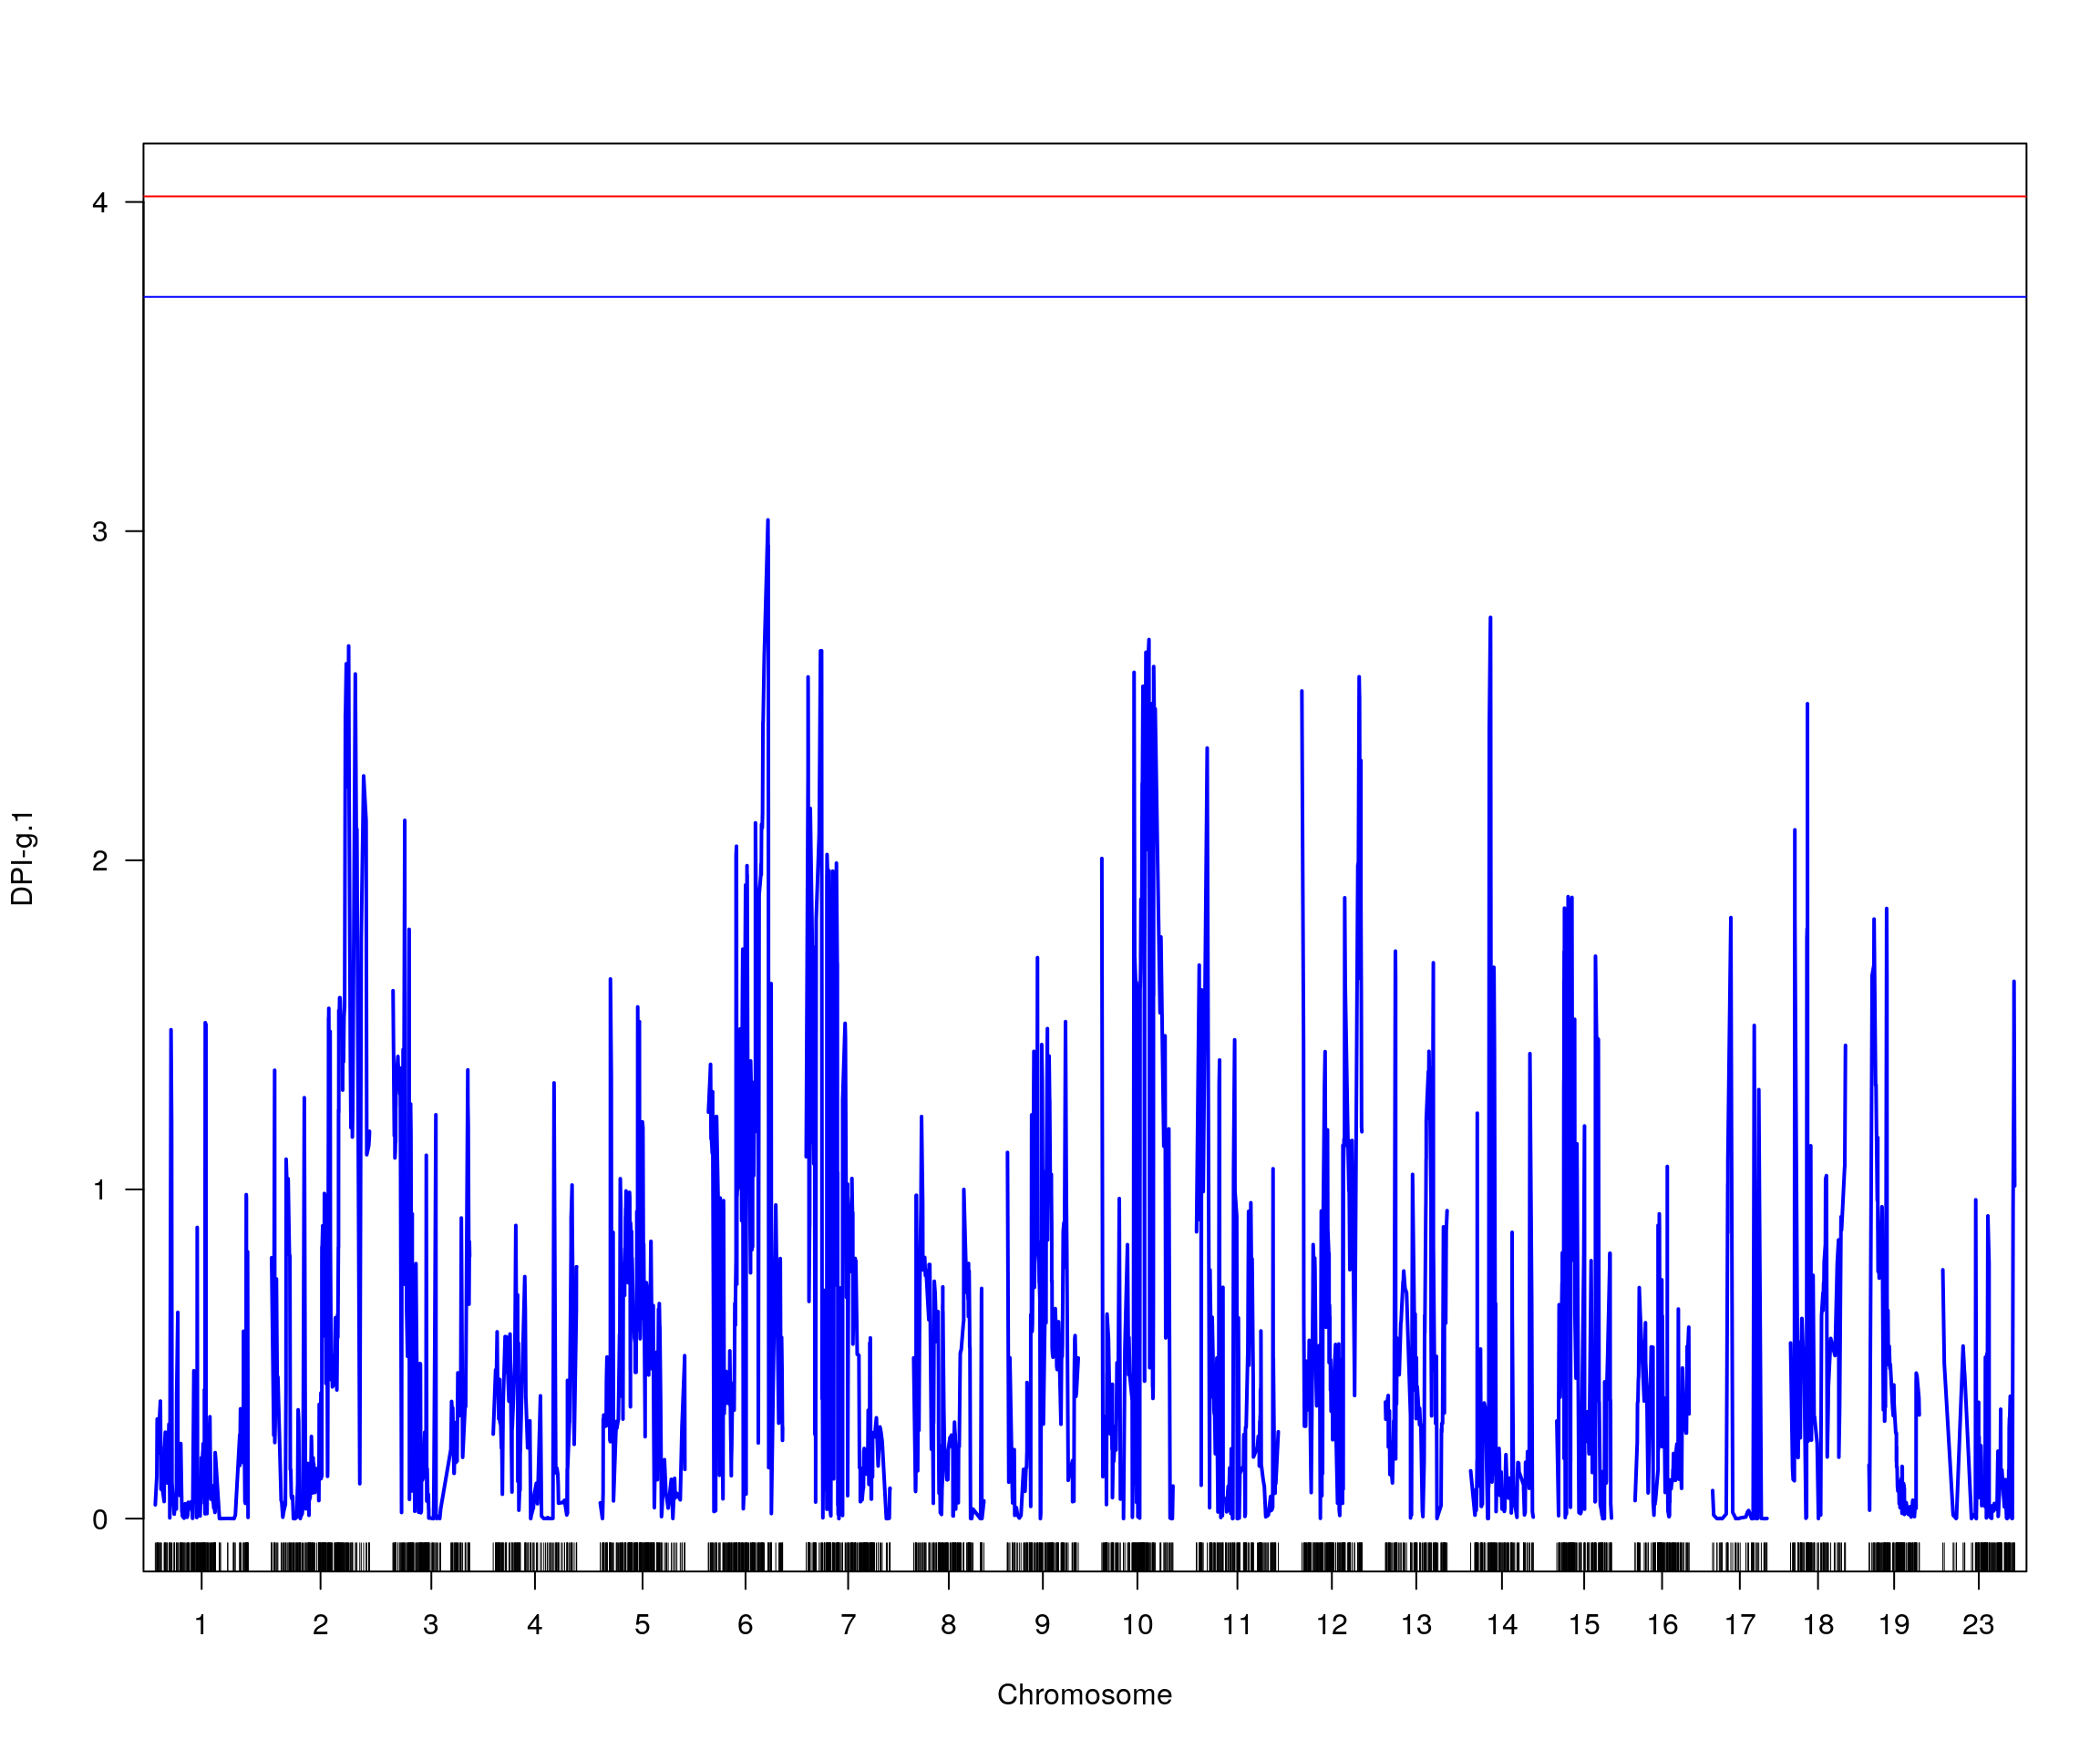
# [1] lodindex  lodcolumn chr       pos       lod       ci_lo     ci_hi
# <0 rows> (or 0-length row.names)
# [1] "pheno = 3"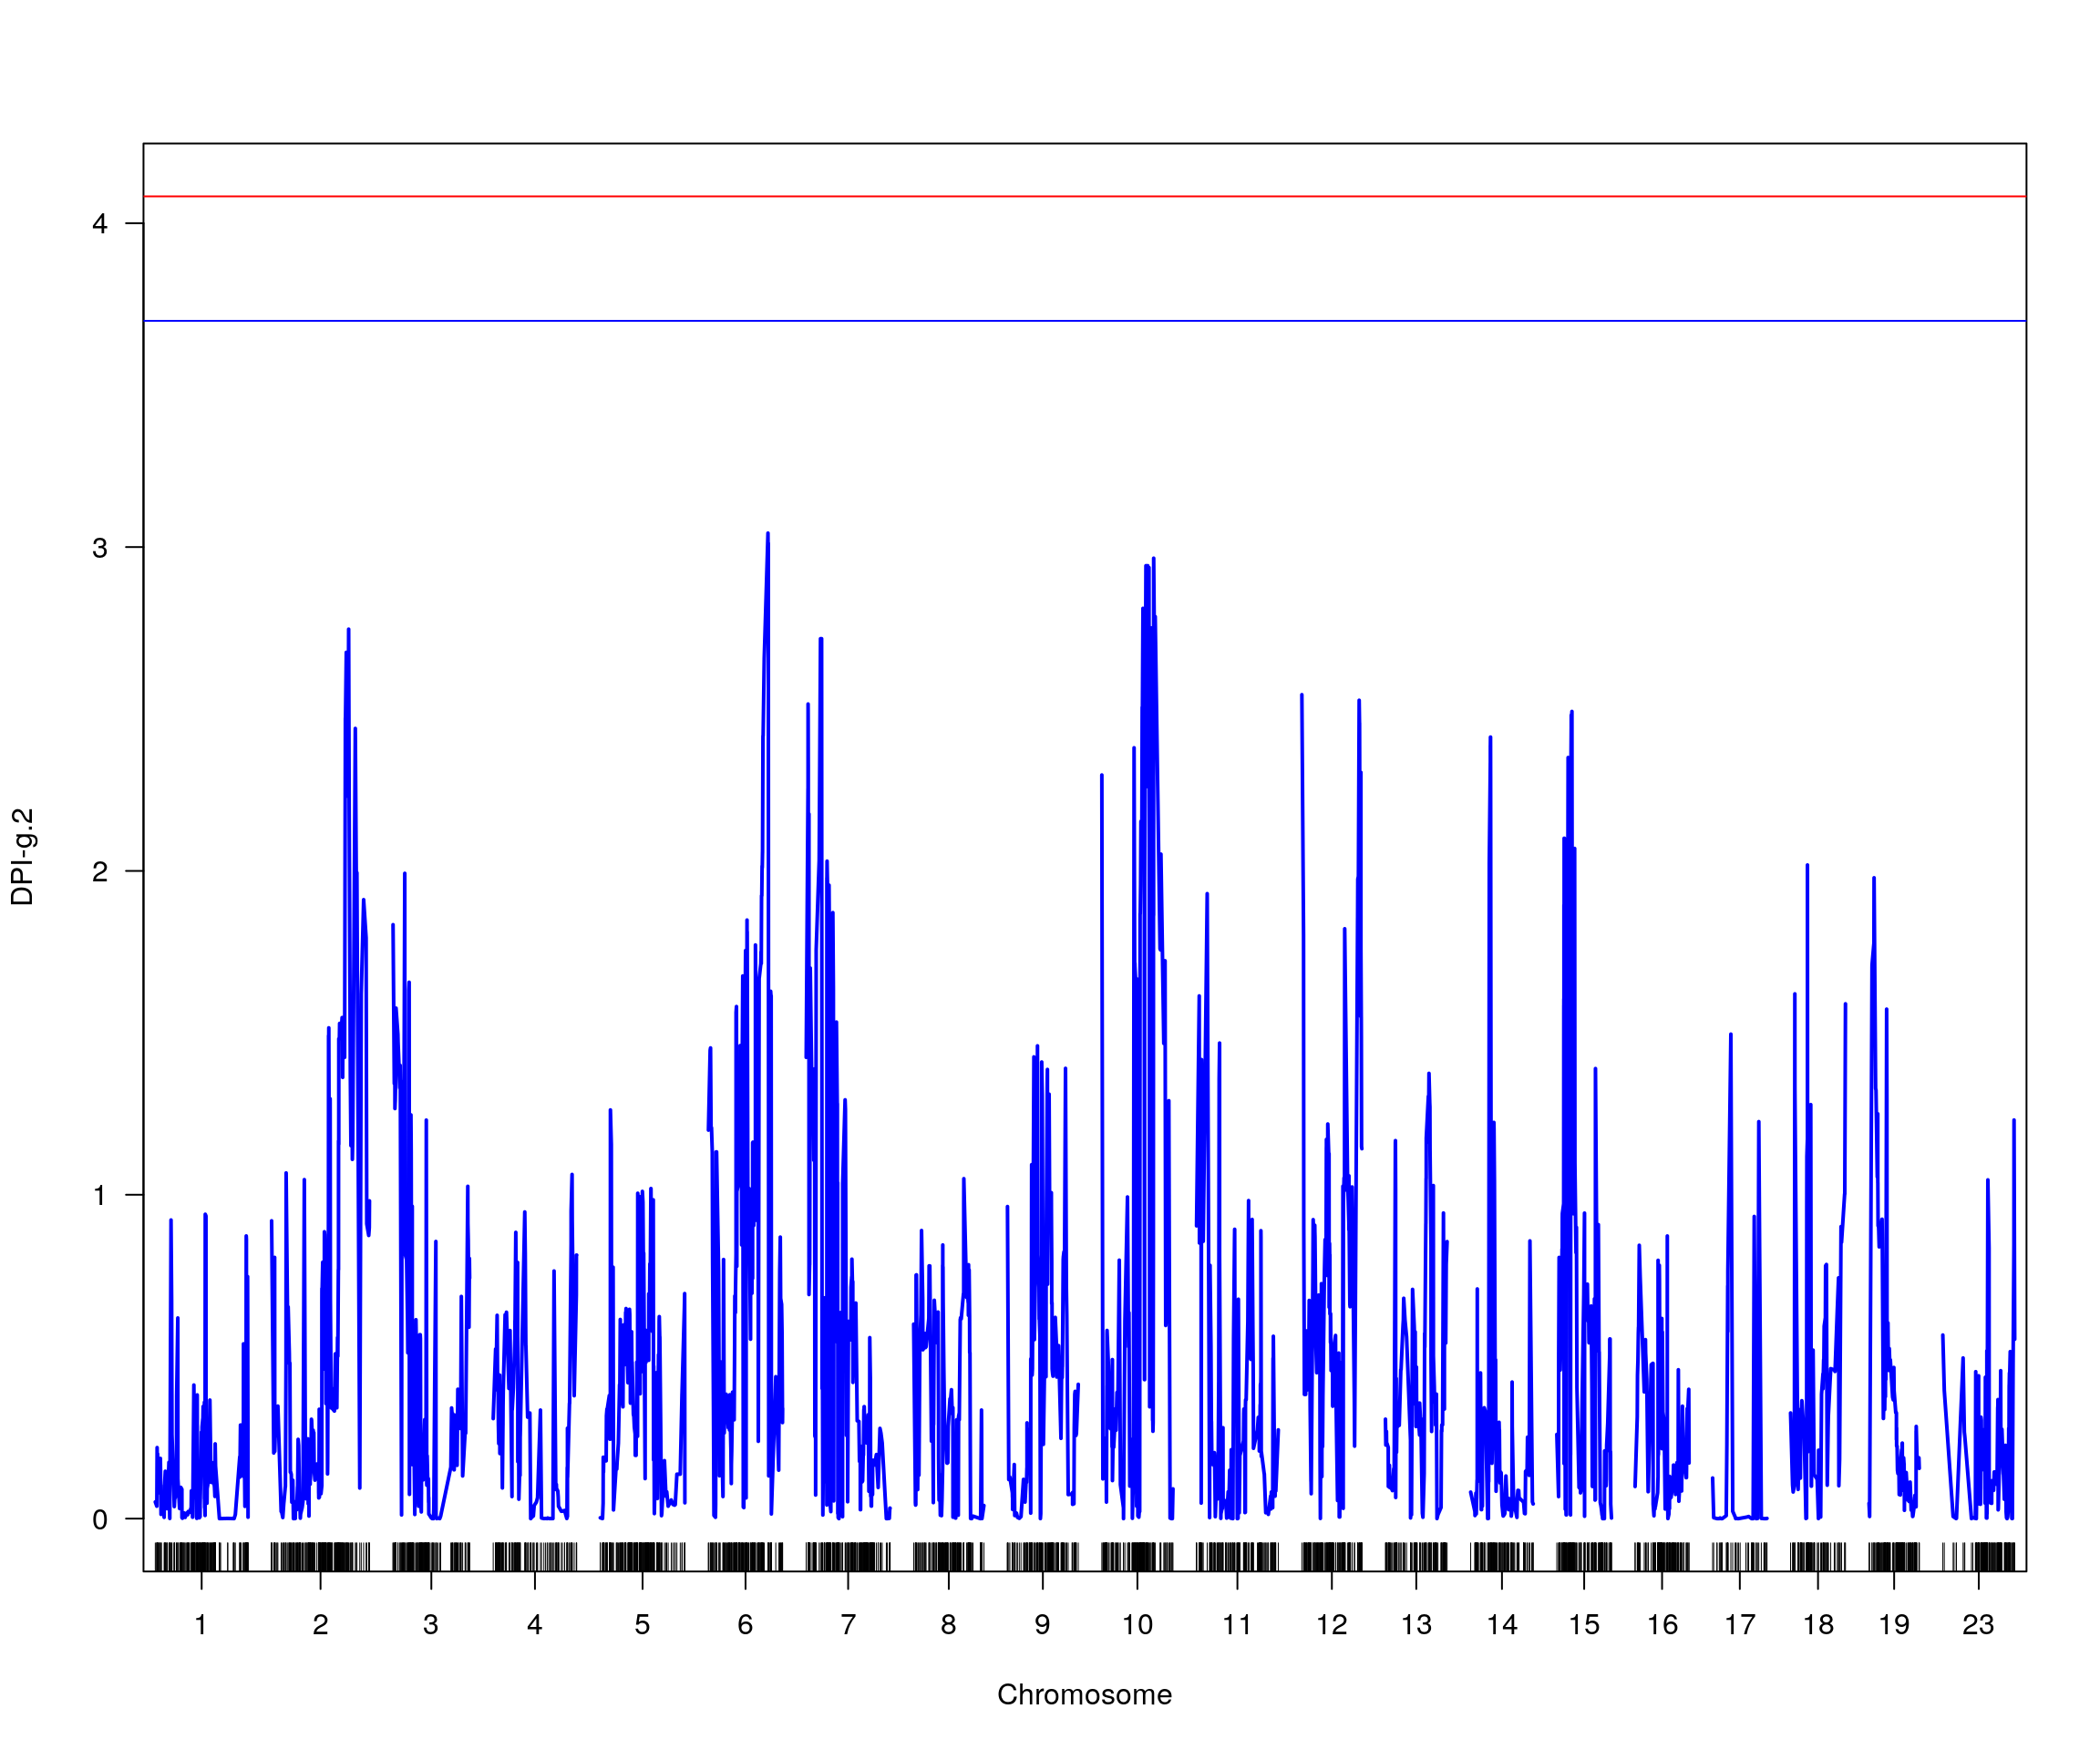
# [1] lodindex  lodcolumn chr       pos       lod       ci_lo     ci_hi
# <0 rows> (or 0-length row.names)
# [1] "pheno = 4"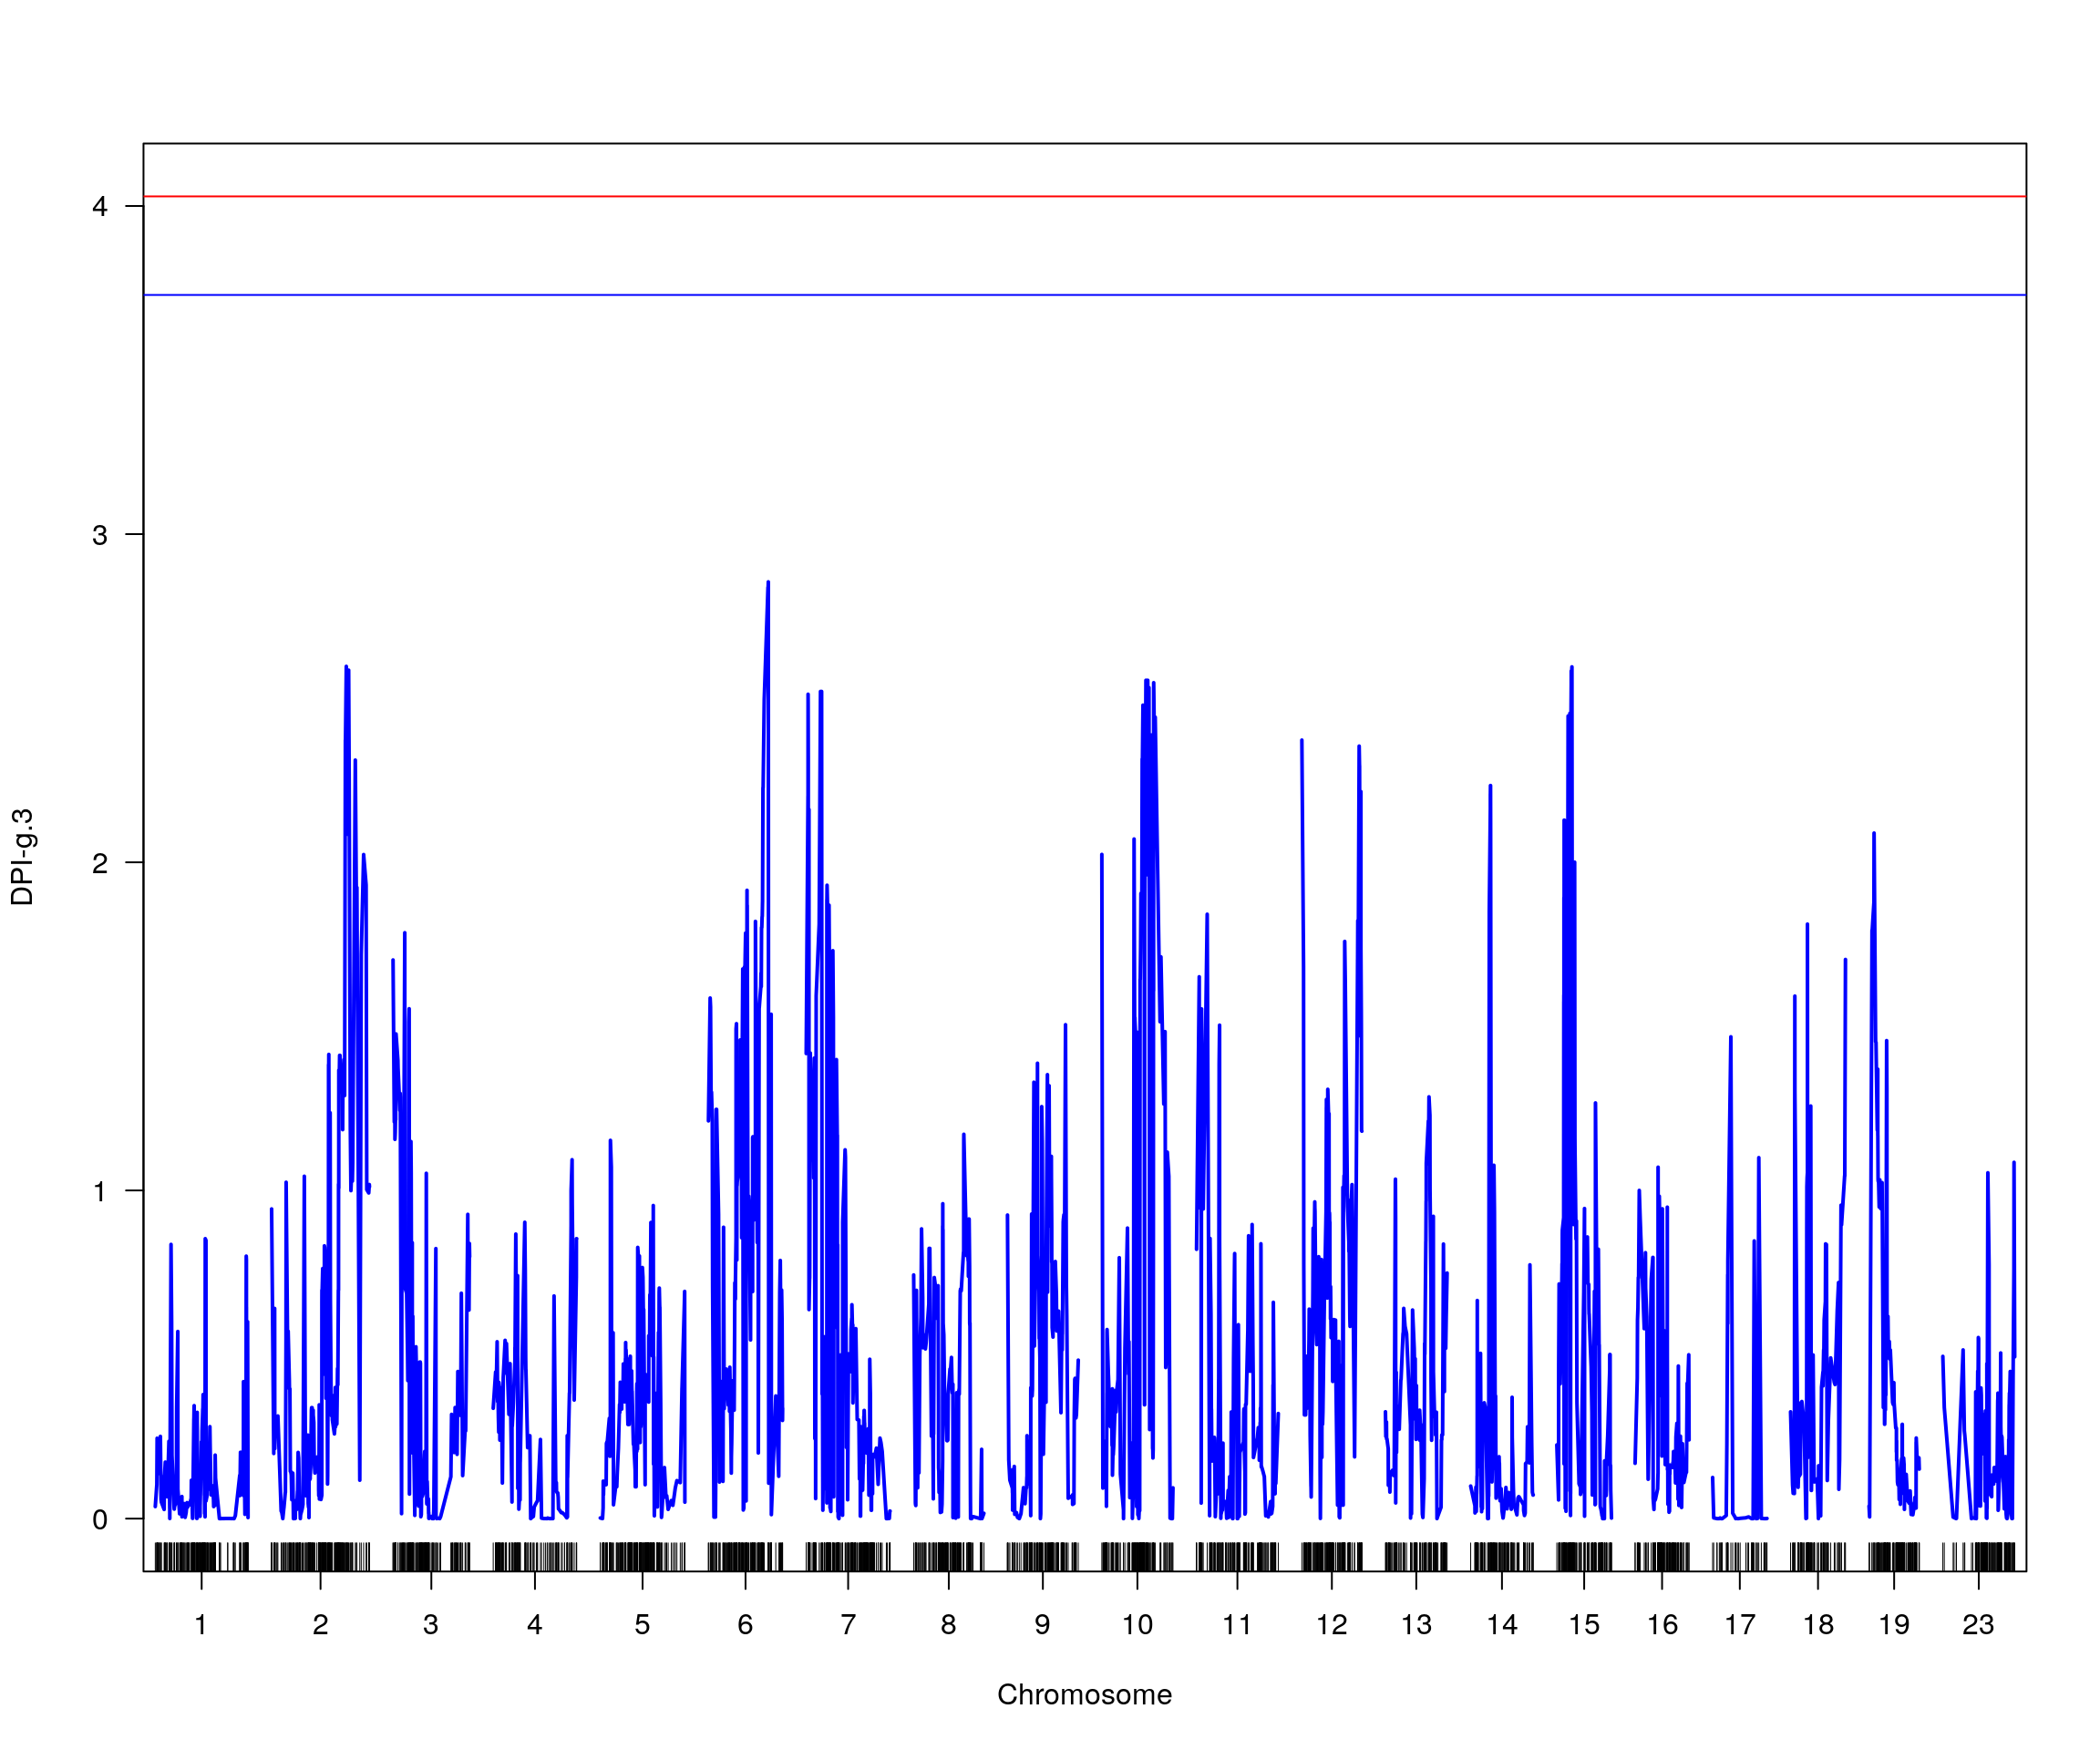
# [1] lodindex  lodcolumn chr       pos       lod       ci_lo     ci_hi
# <0 rows> (or 0-length row.names)
# [1] "pheno = 5"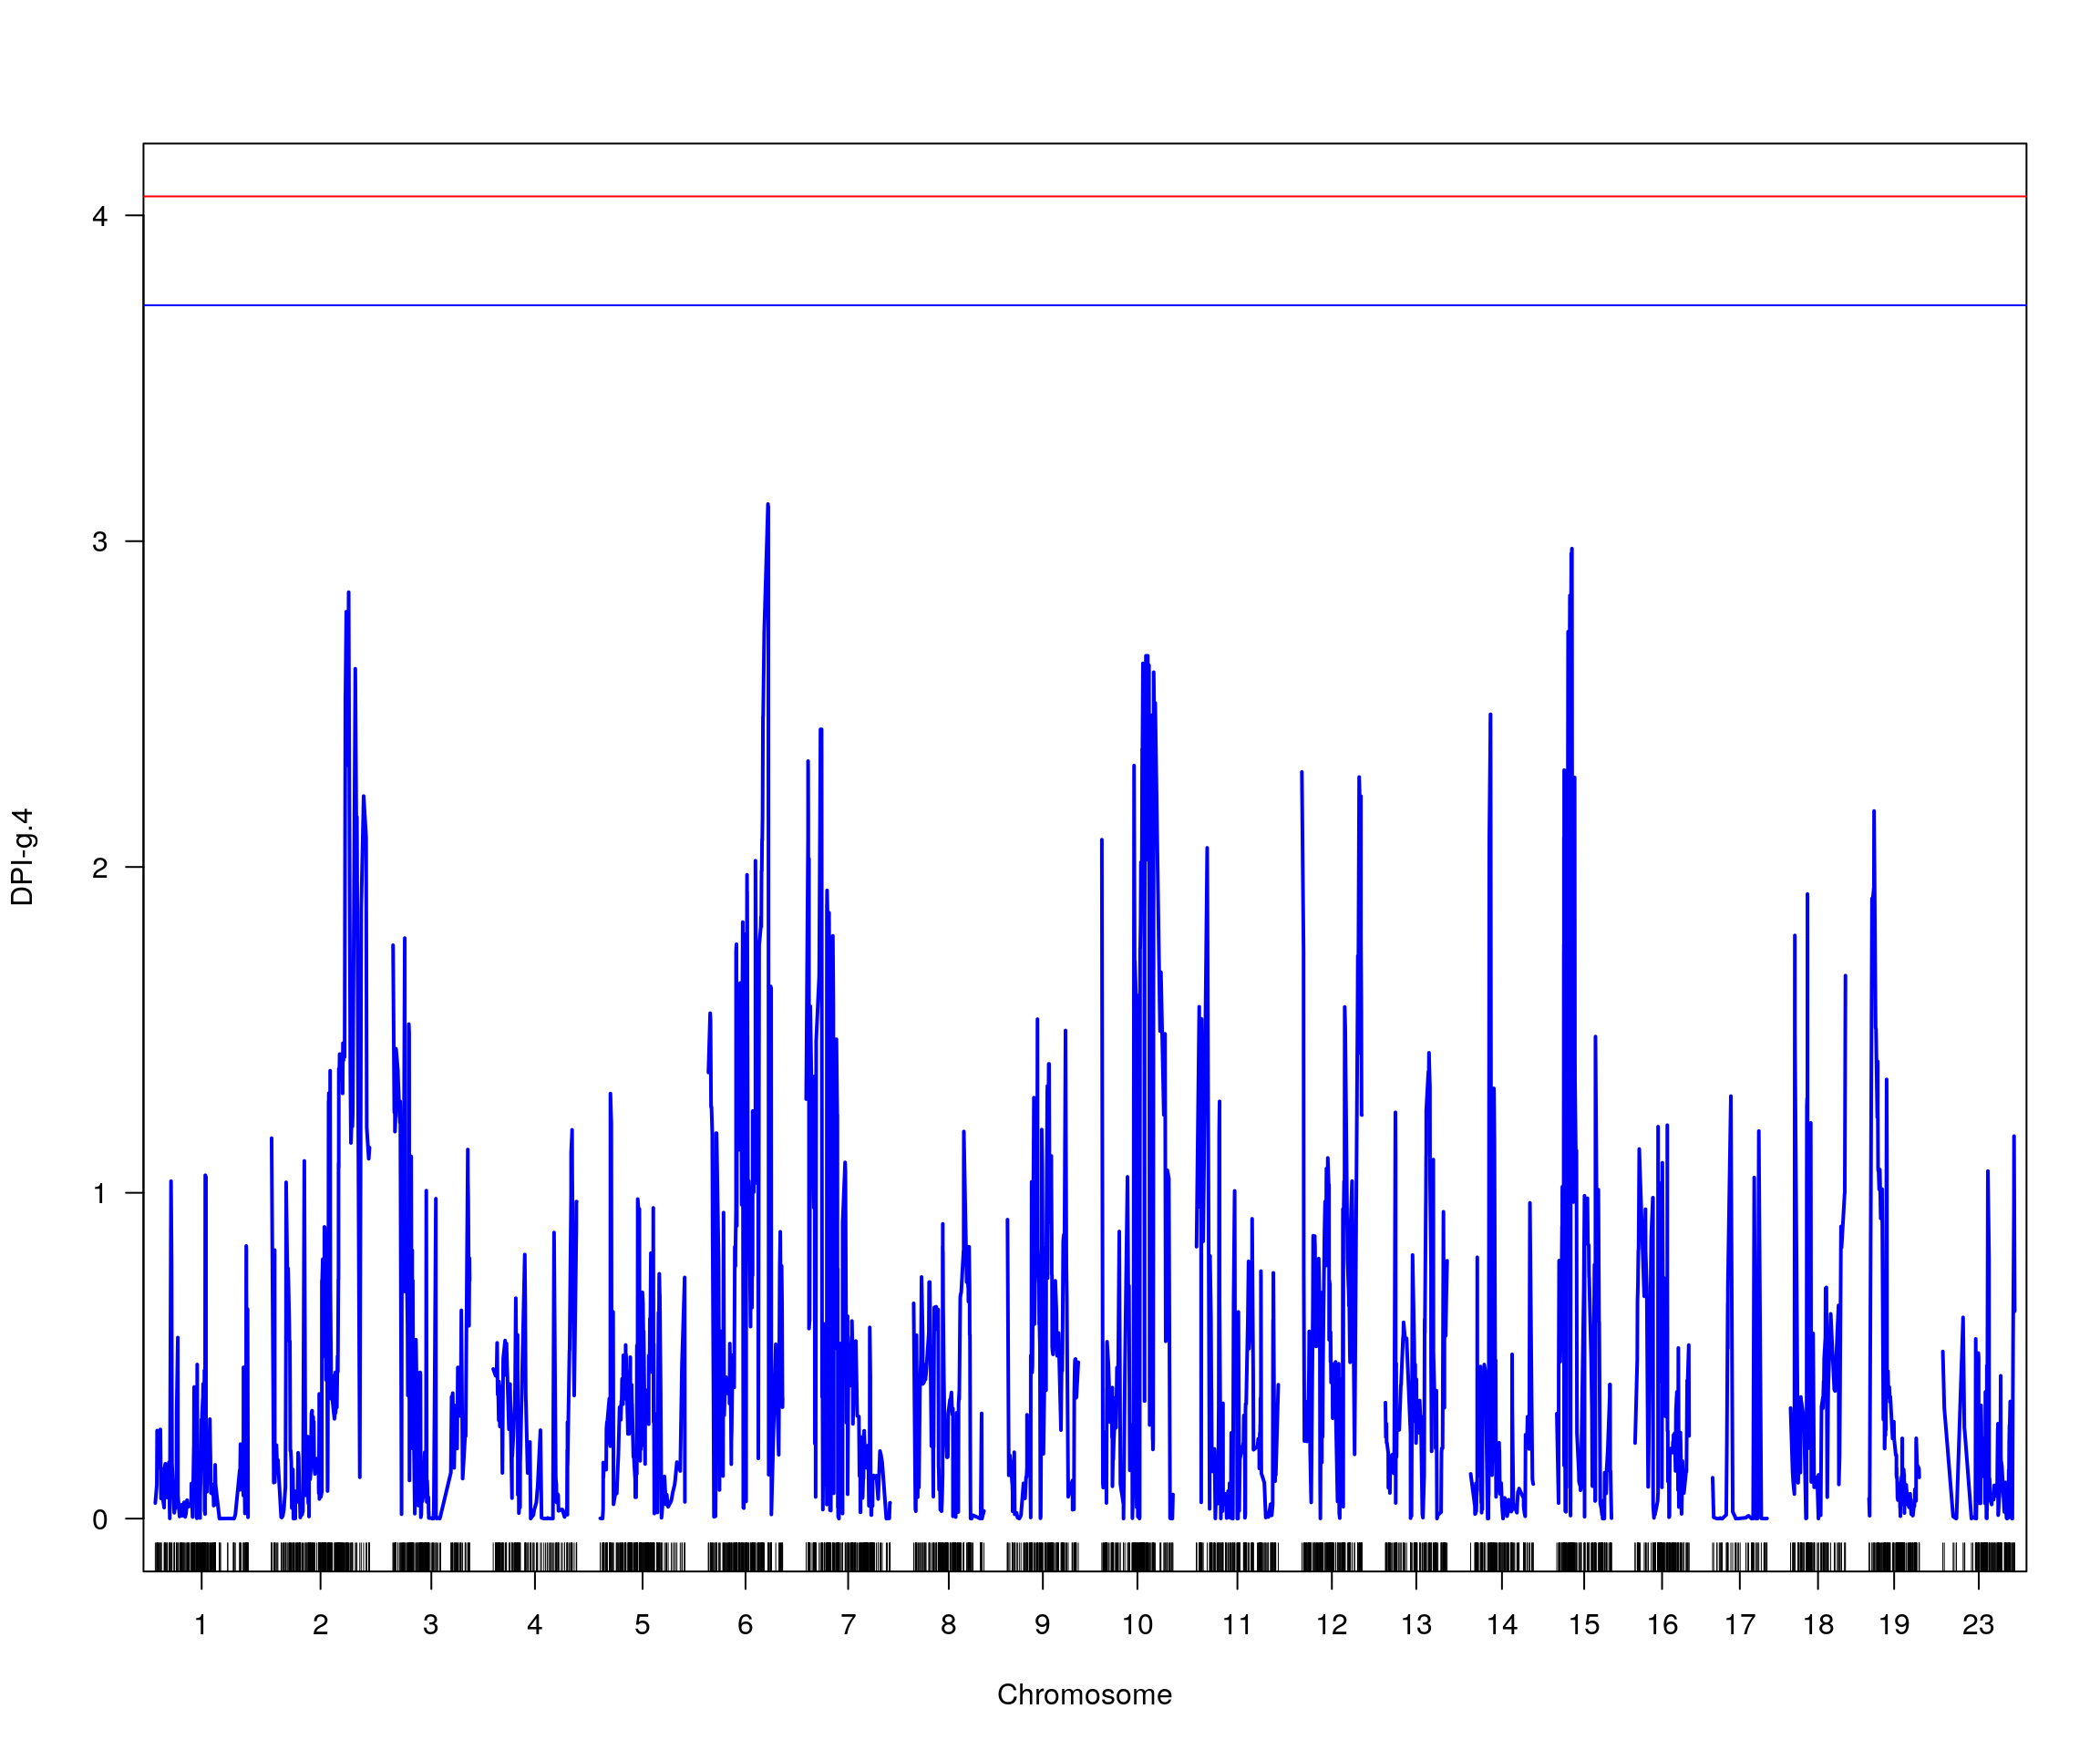
# [1] lodindex  lodcolumn chr       pos       lod       ci_lo     ci_hi
# <0 rows> (or 0-length row.names)
# [1] "pheno = 6"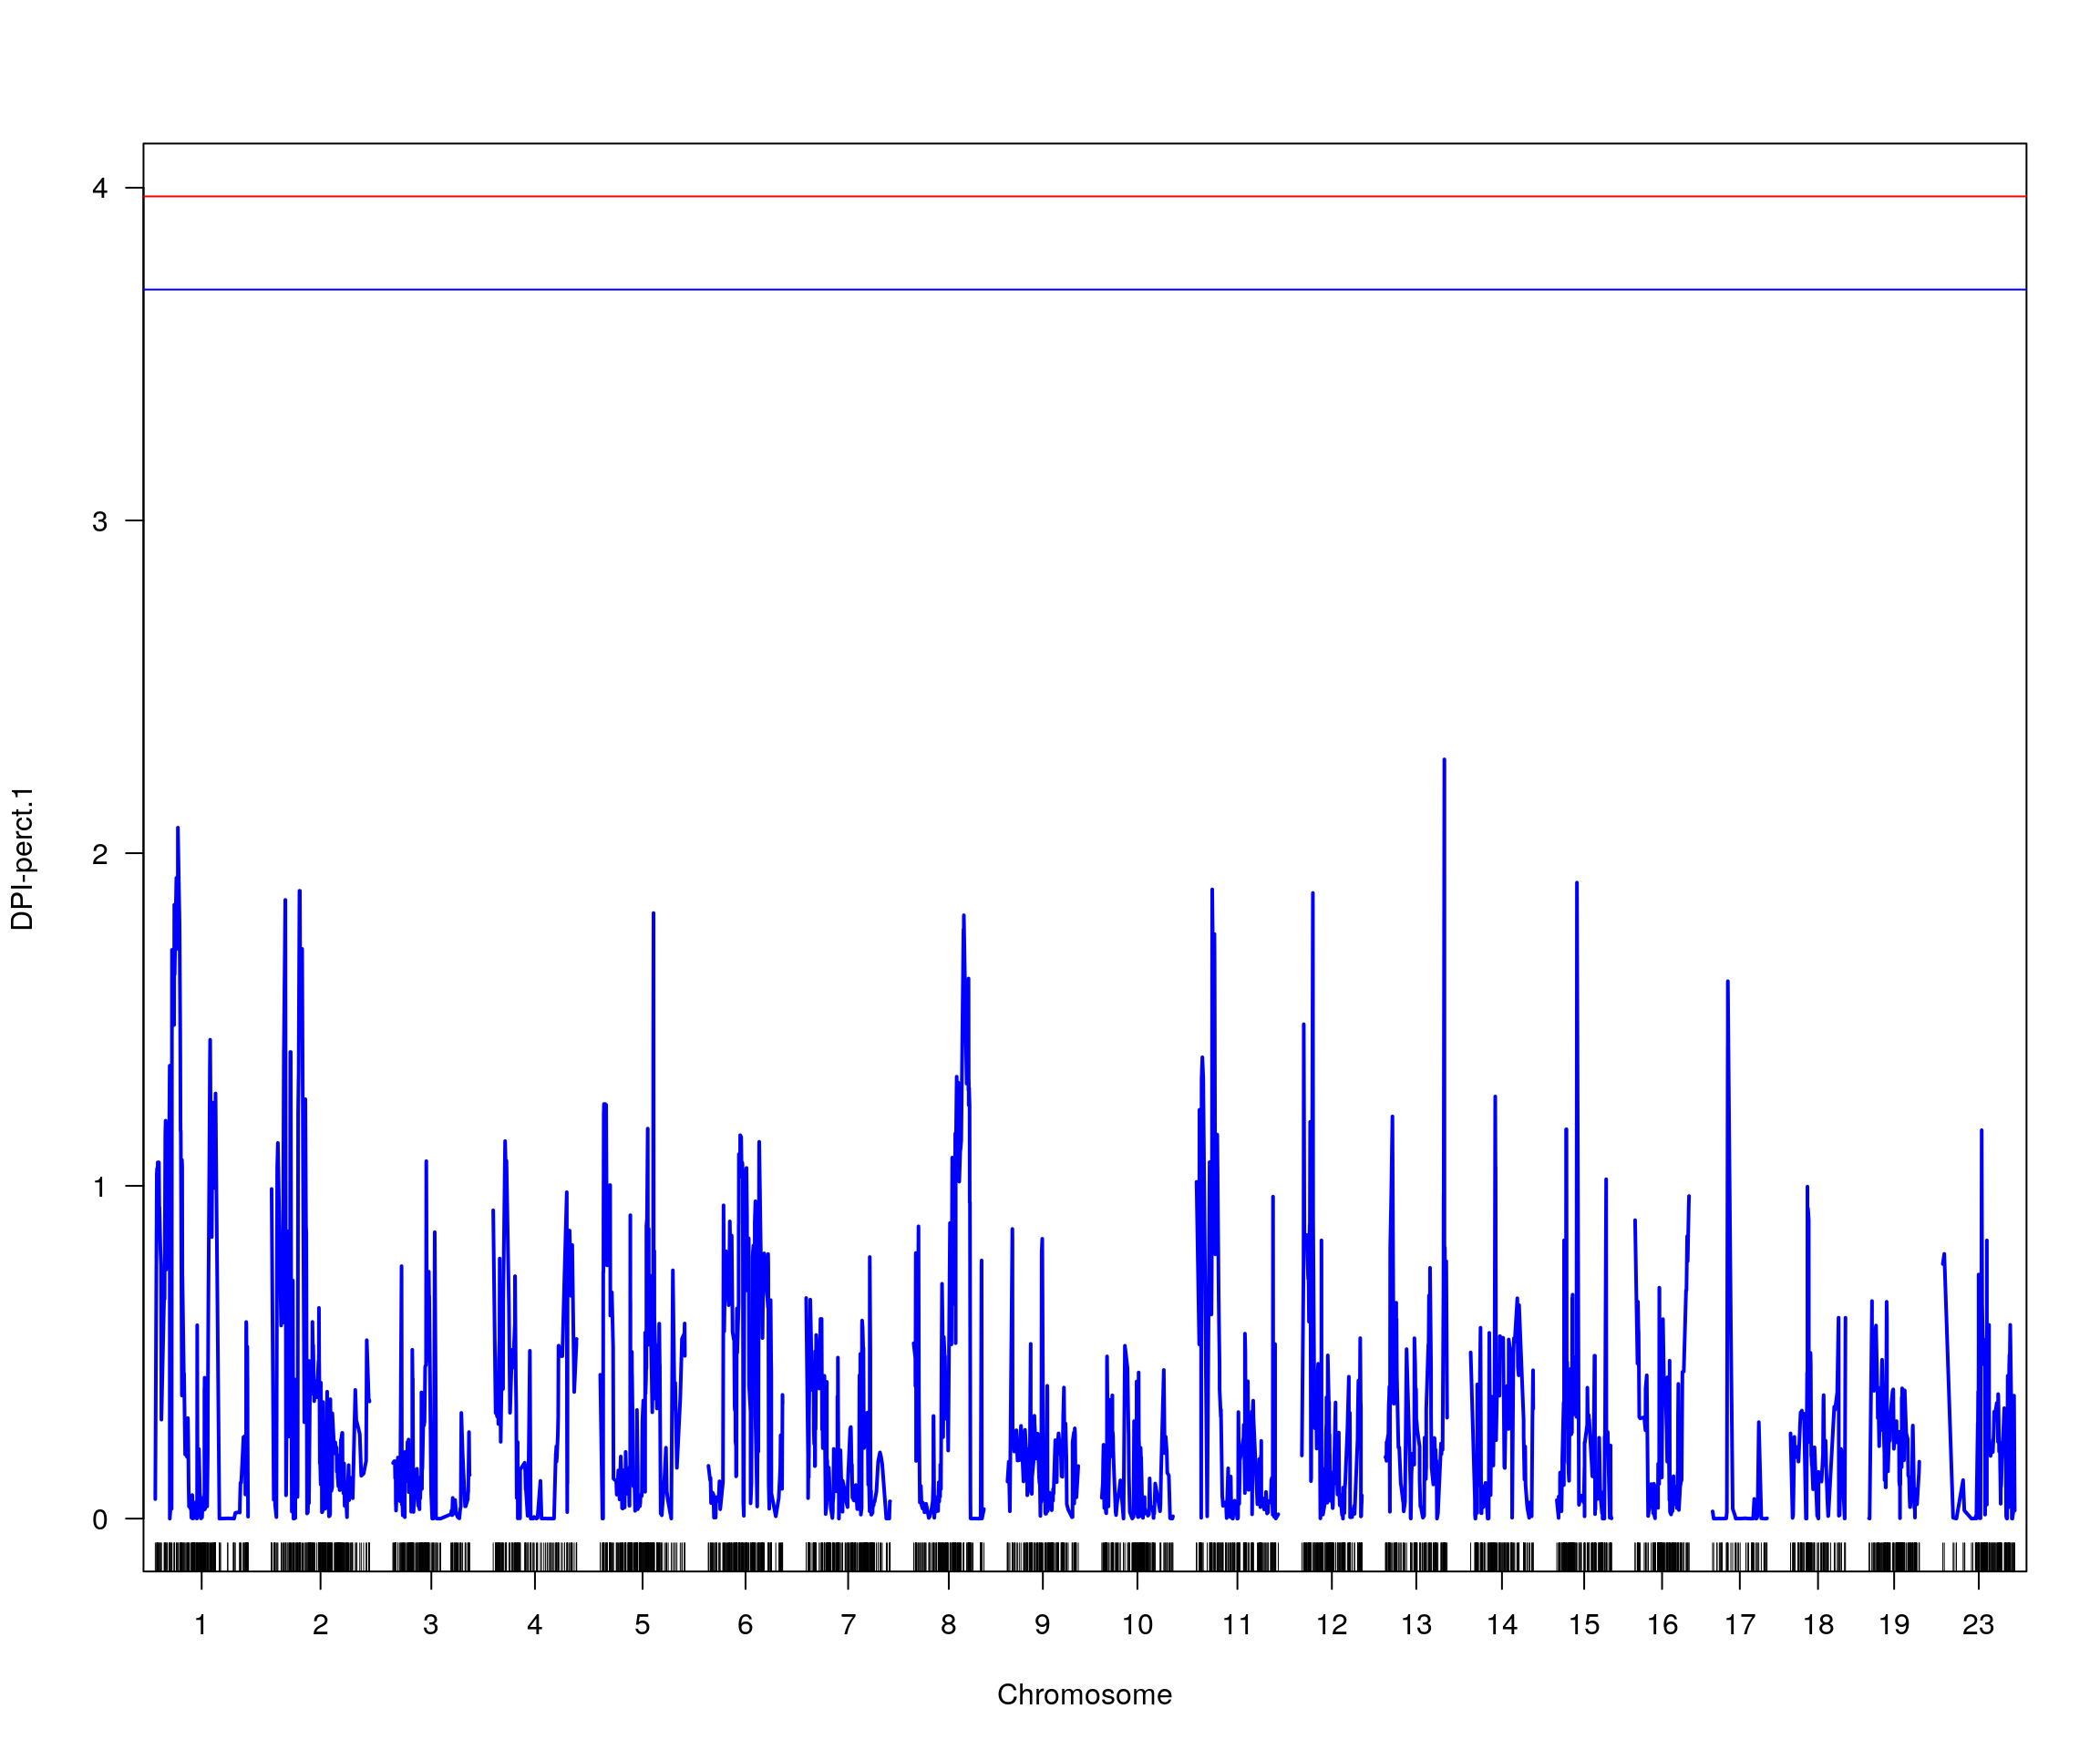
# [1] lodindex  lodcolumn chr       pos       lod       ci_lo     ci_hi
# <0 rows> (or 0-length row.names)
# [1] "pheno = 7"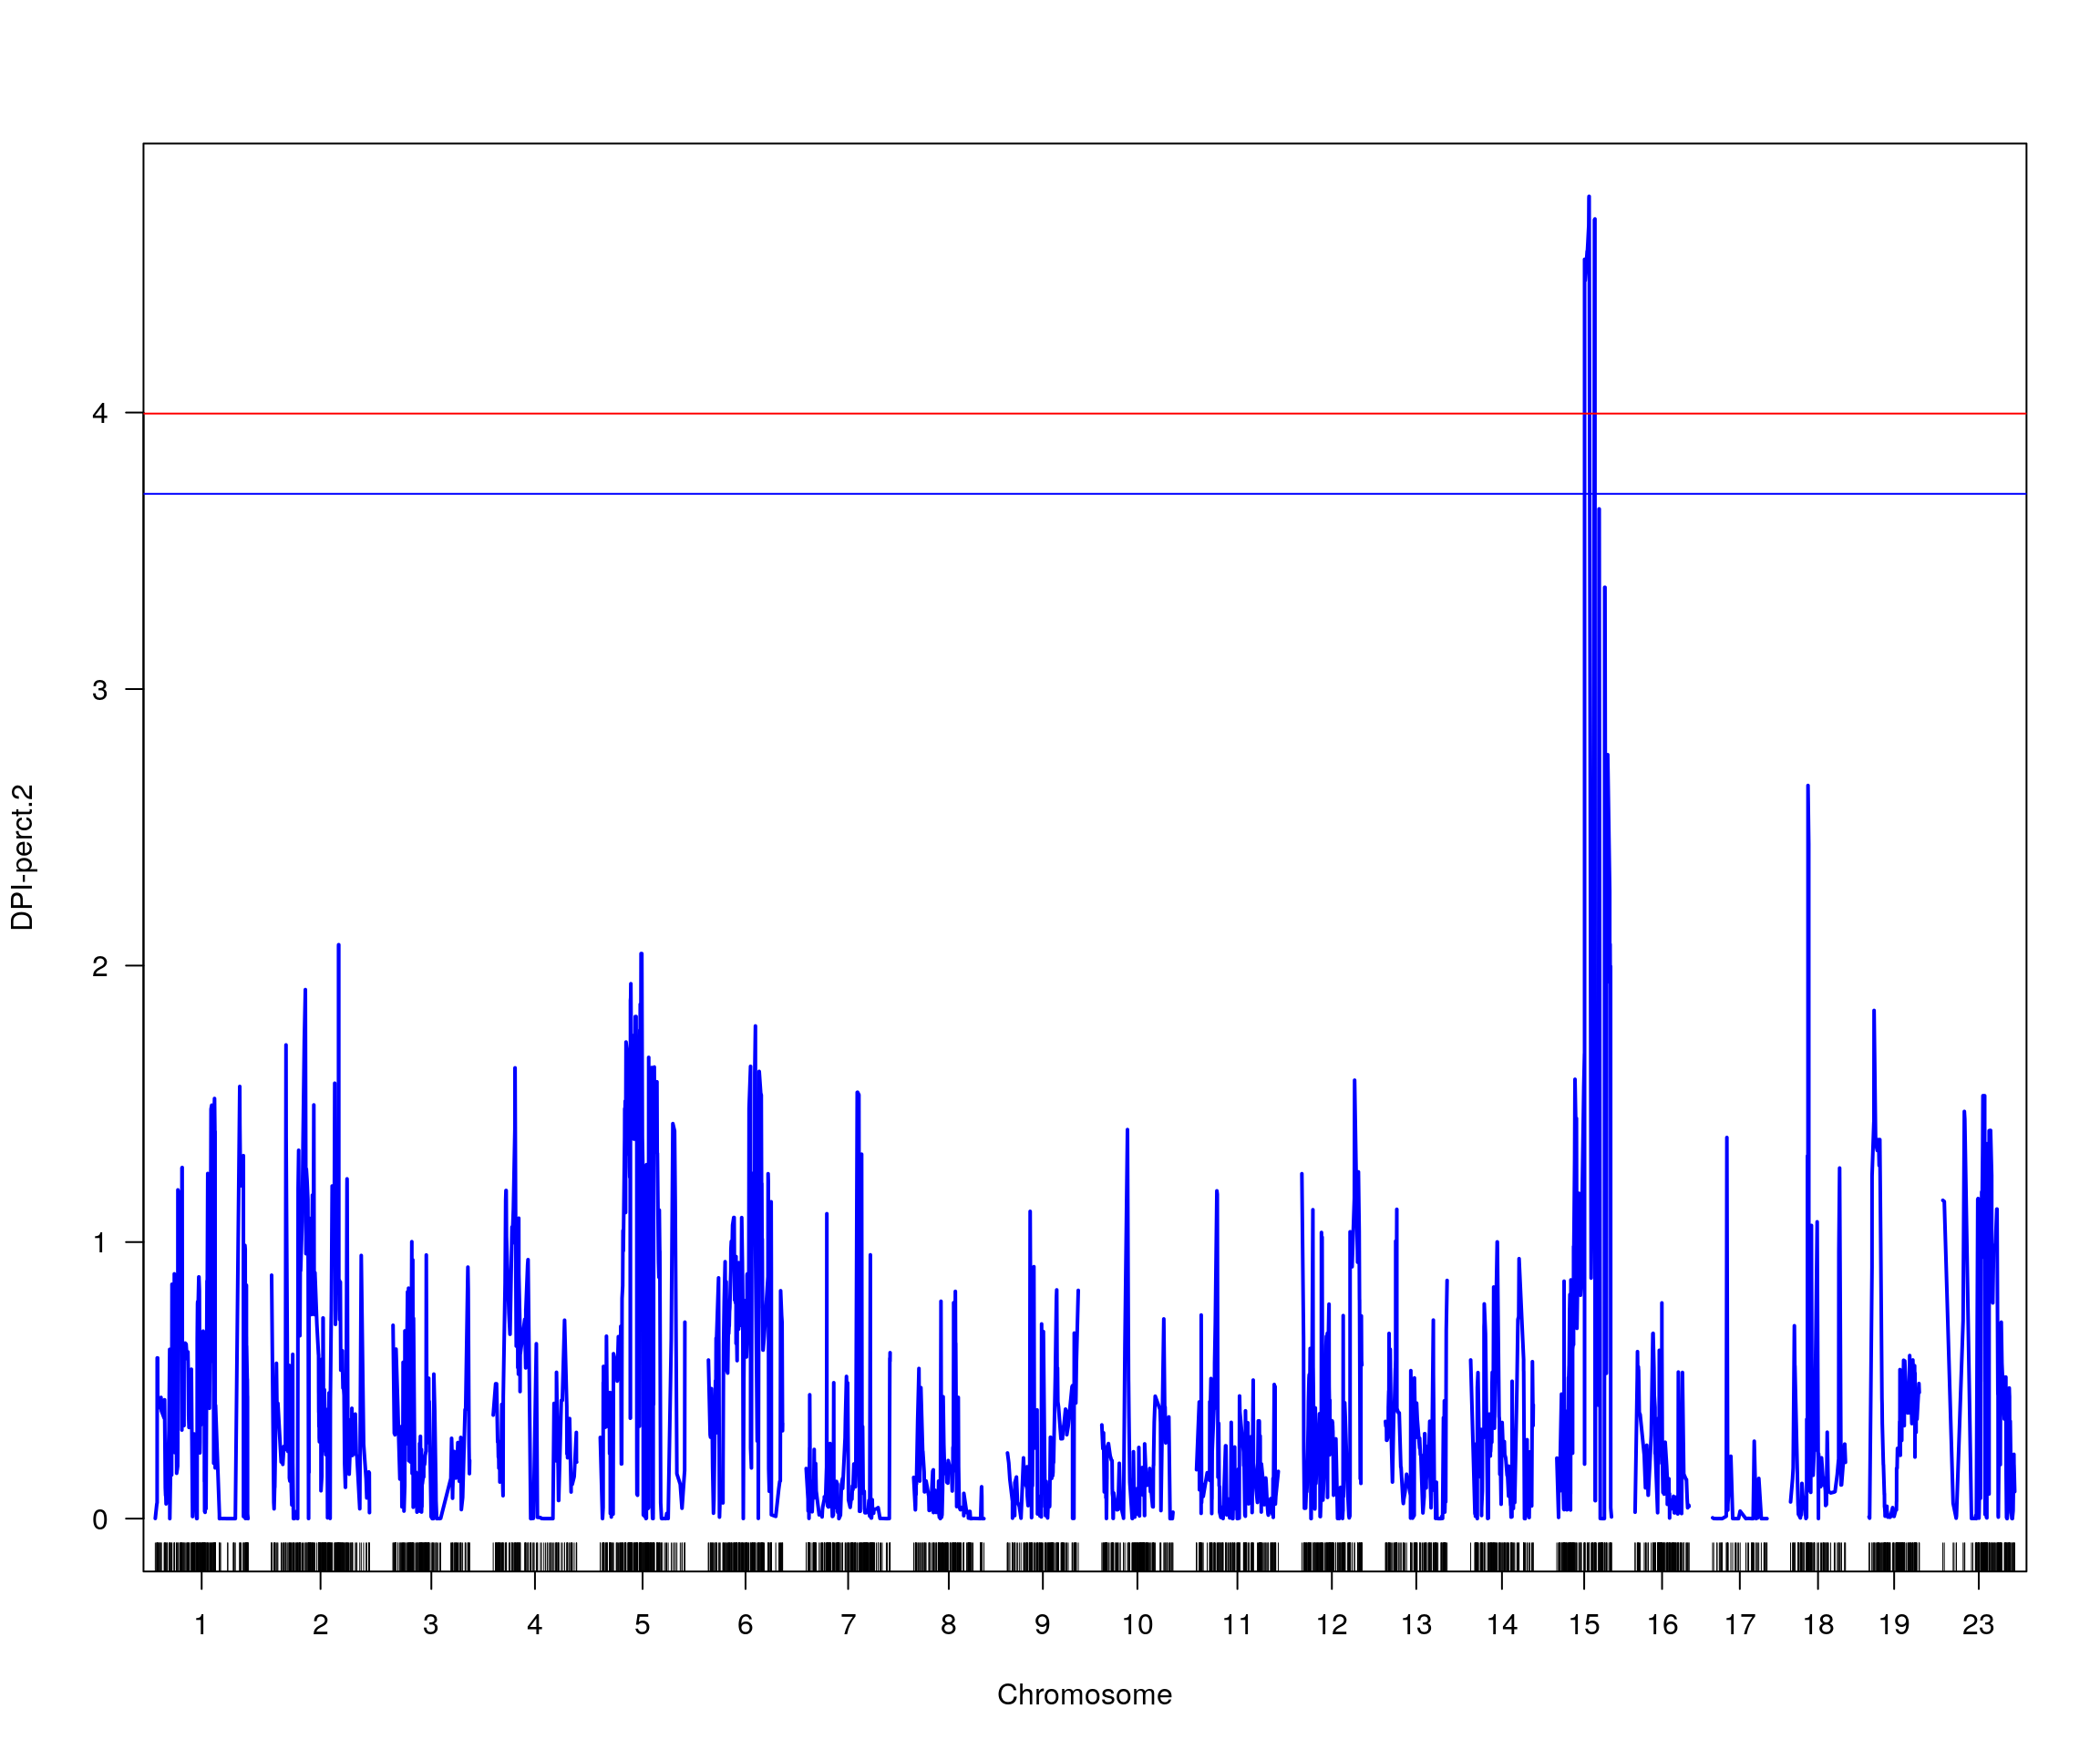
#   lodindex   lodcolumn chr   pos      lod ci_lo  ci_hi
# 1        1 DPI-perct.2  15 34.31 4.781735 29.43 52.324
# [1] "row = 1"
# [1] 75.1805
# [1] 67.99041
# [1] 96.20785
# [1] "pheno = 8"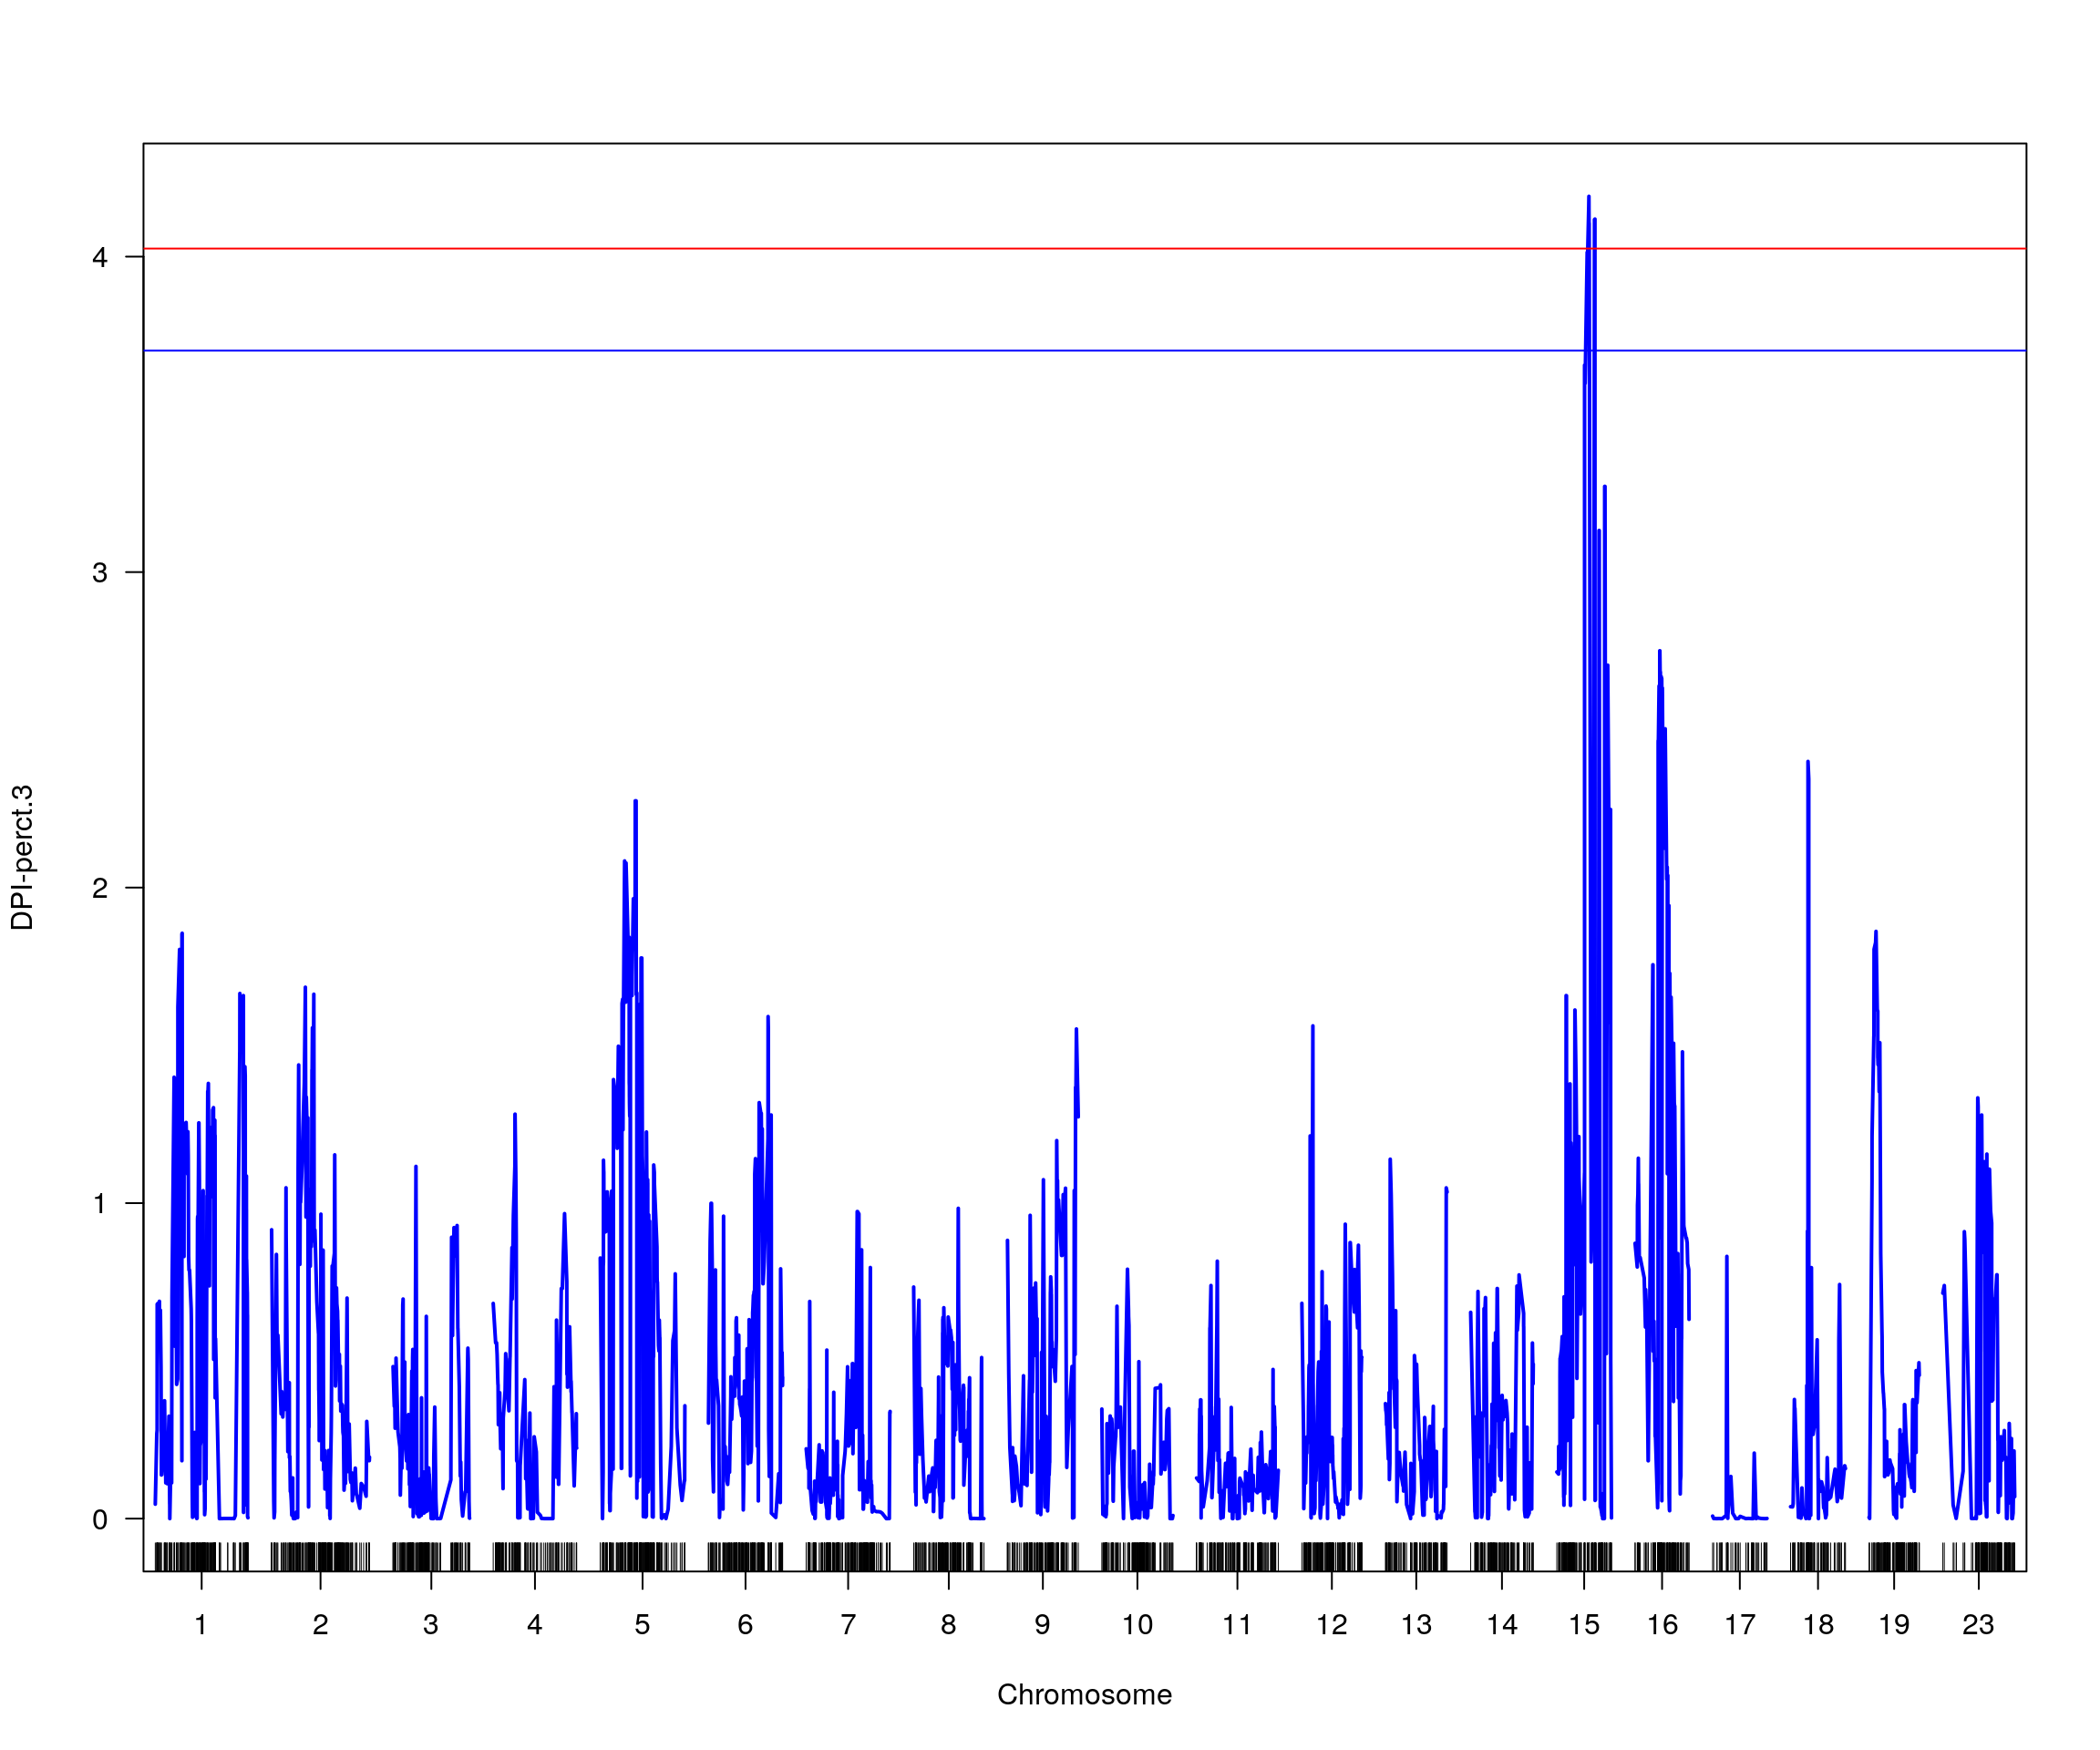
#   lodindex   lodcolumn chr   pos     lod ci_lo ci_hi
# 1        1 DPI-perct.3  15 34.04 4.19079 29.43 56.09
# [1] "row = 1"
# [1] 73.77232
# [1] 67.99041
# [1] 99.48852
# [1] "pheno = 9"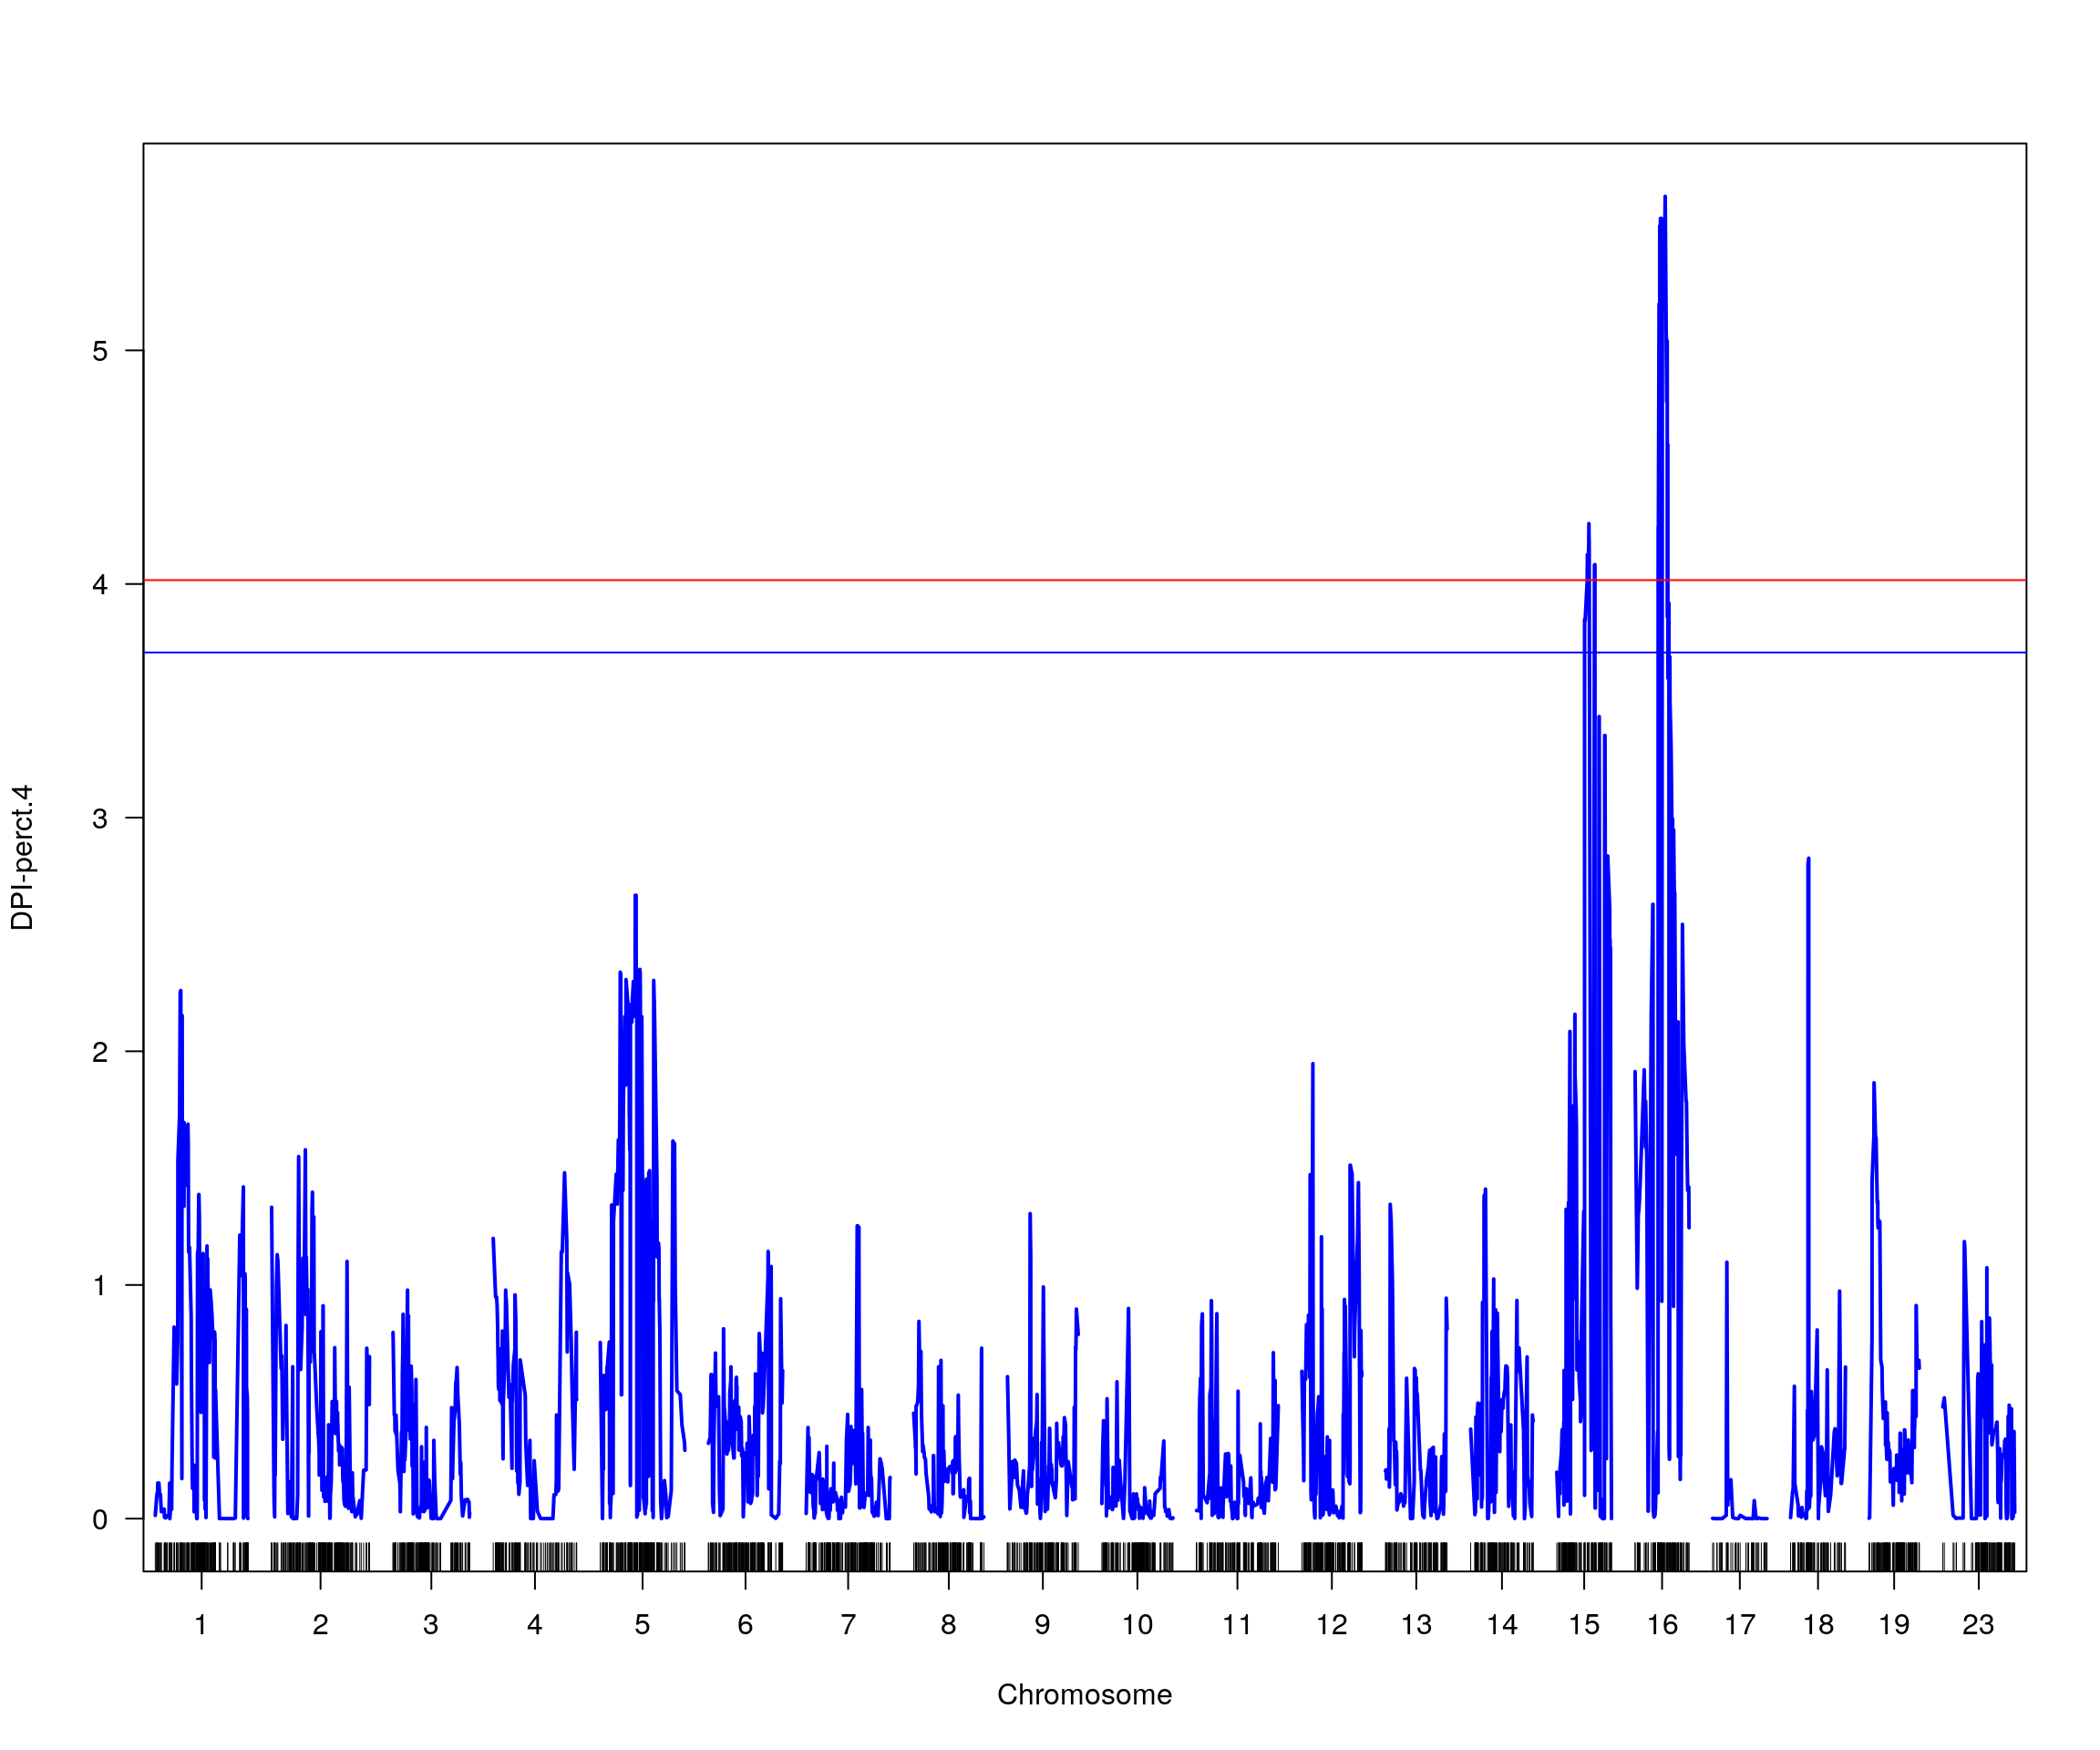
#   lodindex   lodcolumn chr    pos      lod  ci_lo  ci_hi
# 1        1 DPI-perct.4  15 34.040 4.258488 29.430 56.090
# 2        1 DPI-perct.4  16 31.925 5.658874 24.456 34.795
# [1] "row = 1"
# [1] 73.77232
# [1] 67.99041
# [1] 99.48852
# [1] "row = 2"
# [1] 51.11719
# [1] 34.65974
# [1] 59.05526
variants_all <- bind_rows(variants)
#display variants_all
vroom::vroom_write(variants_all, "data/CC_SARS-2/variants_all.csv", delim = ",", col_names = TRUE, quote = "none", num_threads = 10)
QTL mapping conditioning on 16 locus
#pull out the top marker in out_3
out_3_peak <- find_peaks(out_3[, 3, drop = F], map = cross2$gmap, drop = 1.5)
out_3_marker <- find.marker(cross, 16, 26.156)
out_3_marker_covar = as.data.frame(pull.markers(cross, out_3_marker)$geno$`16`$data[,1, drop=F])
out_3_marker_covar_matrix = model.matrix(~SAH161480087, out_3_marker_covar)[,-1]
out_3_condi_chr16 <- scanone(f2_qtl, pheno.col = 13, addcovar = out_3_marker_covar_matrix,
                             model = "normal", n.cluster = 10,
                             method = "mr-imp")
# Warning in checkcovar(cross, pheno.col, addcovar, intcovar, perm.strata, : Dropping 107 individuals with missing phenotypes.
# out_3_condi_chr16_operm <- scanone(f2_qtl, pheno.col = 13, n.perm = 100,
#                                    addcovar = out_3_marker_covar_matrix,
#                                    model = "normal", n.cluster = 10,
#                                    method = "mr-imp")
# save(out_3_condi_chr16_operm, file = "data/CC_SARS-2/out_3_condi_chr16_operm.RData")
load("data/CC_SARS-2/out_3_condi_chr16_operm.RData")
summary(out_3_condi_chr16[,1:3], perms = out_3_condi_chr16_operm[,1], alpha = 0.05, pvalues = TRUE)
#              chr   pos  lod pval
# gUNC12382380   7  2.93 4.89    0
# UNC26651633   16 25.68 9.08    0
summary(out_3_condi_chr16_operm[,1], alpha=c(0.05))
# LOD thresholds (100 permutations)
#    lod
# 5% 4.1
summary(out_3_condi_chr16_operm[,1], alpha=c(0.1))
# LOD thresholds (100 permutations)
#      lod
# 10% 3.78

plot(out_3_condi_chr16, col = c("red"), main = "Log10_Lung_titer_4DPI_PFU_per_ml (QTL mapping conditional on Chr16 locus)", ylab = "LOD")
add.threshold(out_3_condi_chr16, perms = out_3_condi_chr16_operm, alpha = 0.05, col="magenta")
add.threshold(out_3_condi_chr16, perms = out_3_condi_chr16_operm, alpha = 0.1, col="blue")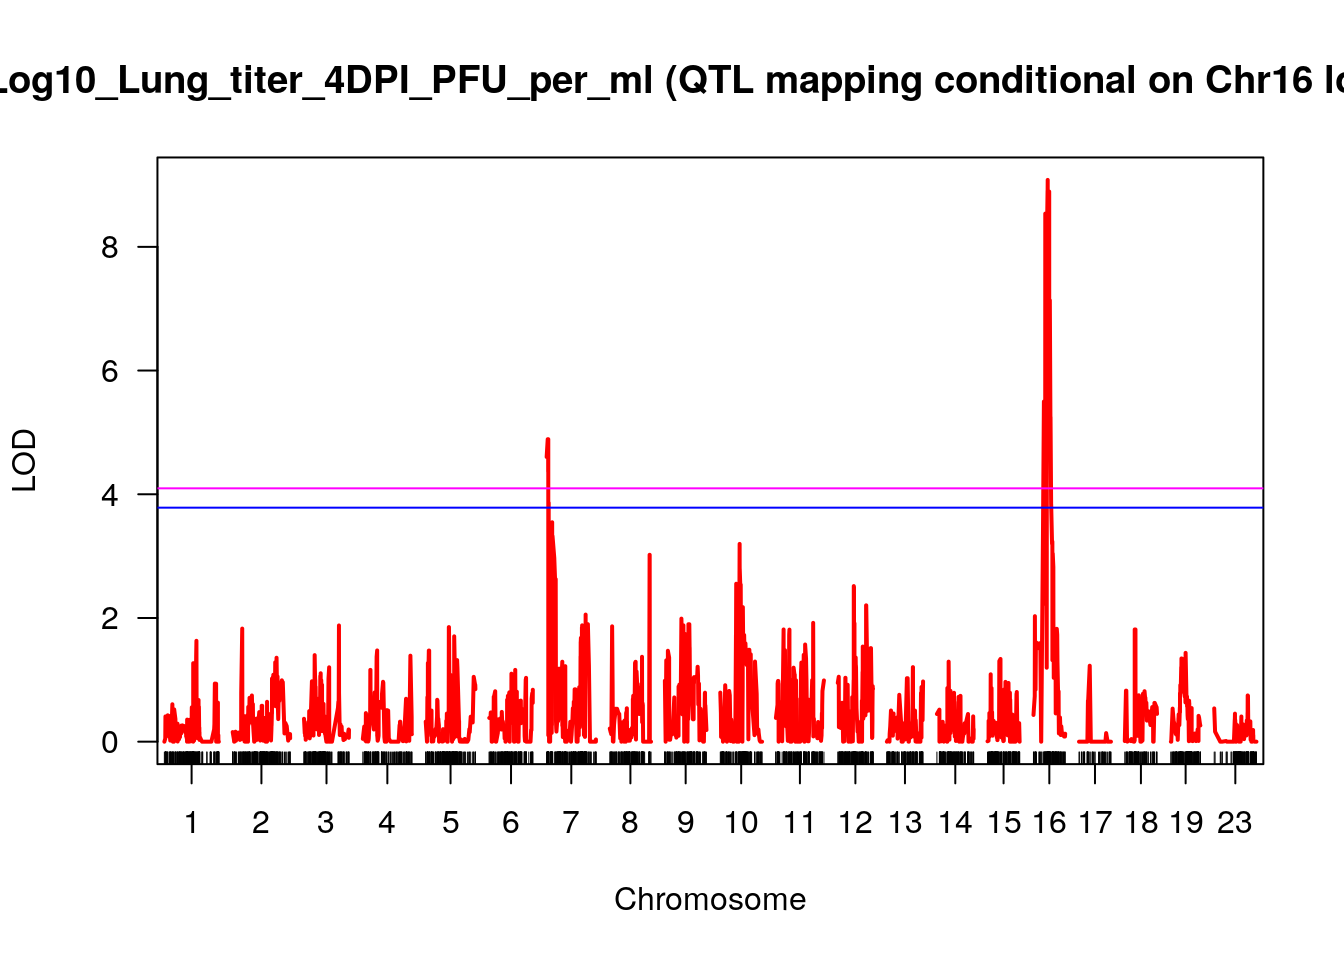
| Version | Author | Date |
|---|---|---|
| e03b40d | xhyuo | 2023-09-19 |
plot(out_3_condi_chr16, col = c("red"), chr = 16, ylab = "LOD")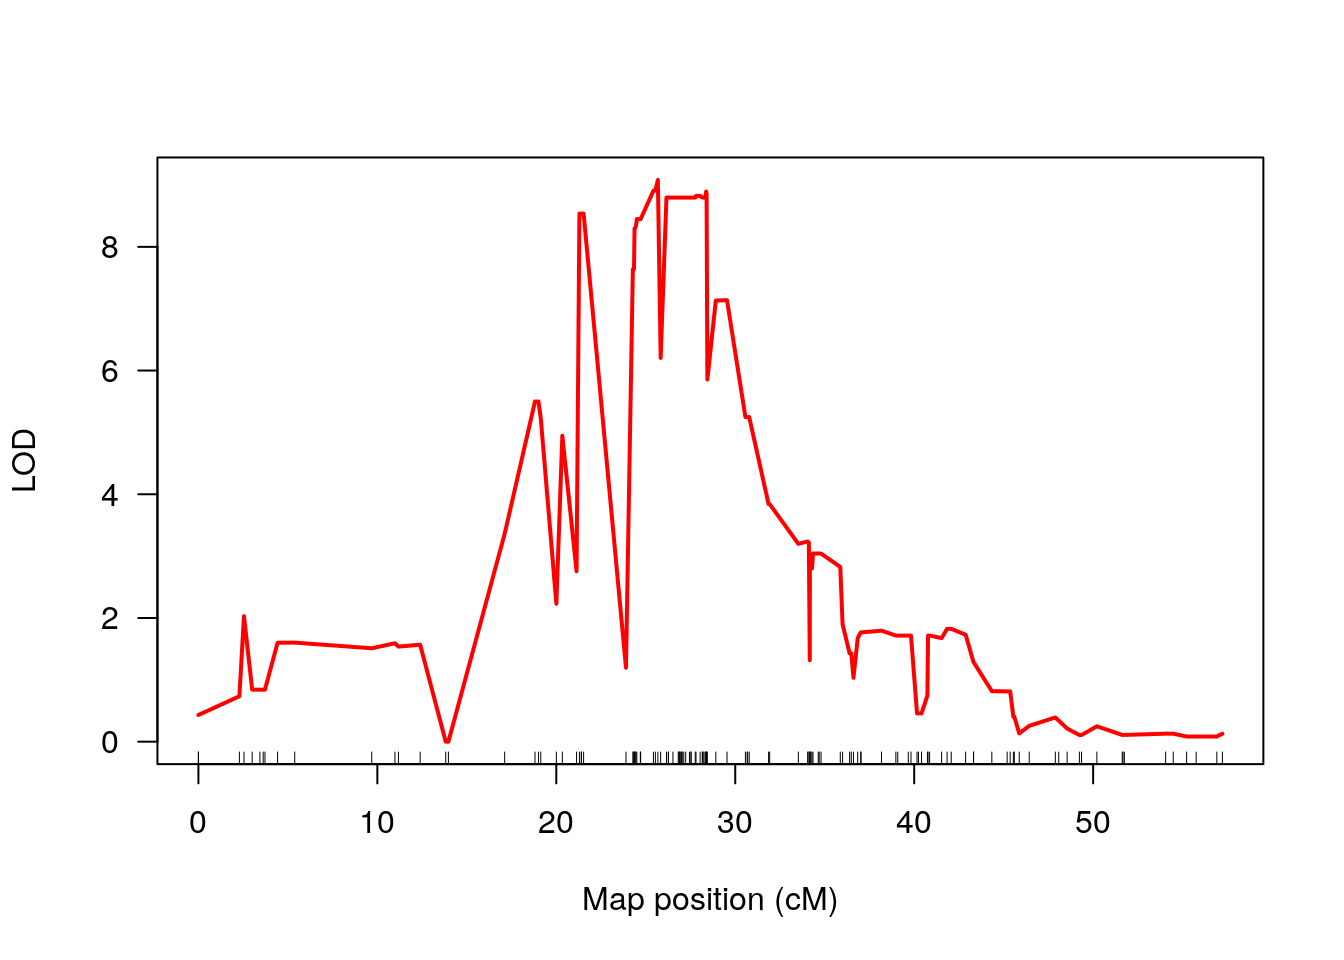
| Version | Author | Date |
|---|---|---|
| 0d66d81 | xhyuo | 2023-09-29 |
###--------------out_3_condi_chr16 on chr16---------------
drop_interval = find_peaks(out_3_condi_chr16[, 3, drop = F], map = cross2$gmap, drop = 1.5, threshold = 9)
drop_interval
#   lodindex lodcolumn chr    pos      lod  ci_lo  ci_hi
# 1        1       lod  16 25.676 9.081946 21.132 28.442

peak_bp = map[map$Chromosome == drop_interval$chr & map$cM_cox == drop_interval$pos & !is.na(map$cM_cox), "bp"]/10^6
peak_bp
# [1] 36.57991

start = map[map$Chromosome == drop_interval$chr & map$cM_cox == drop_interval$ci_lo & !is.na(map$cM_cox), "bp"]/10^6
start
# [1] 30.31507
# [1] 35.15812
end   = map[map$Chromosome == drop_interval$chr & map$cM_cox == drop_interval$ci_hi & !is.na(map$cM_cox), "bp"]/10^6
end
# [1] 43.37599

#genes in the qtl region
query_variants <- create_variant_query_func("data/cc_variants.sqlite")
query_genes <- create_gene_query_func("data/mouse_genes_mgi.sqlite")
chr16_gene <- query_genes(chr = as.character(drop_interval$chr), start, end)


#add bp
out_3_condi_chr16_bp <- out_3_condi_chr16 %>%
  rownames_to_column(.) %>%
  left_join(minimuga[, c(1,3,4)], by = c("rowname" = "marker")) %>%
  dplyr::mutate(pos = bp_mm10/10^6) %>%
  column_to_rownames()
class(out_3_condi_chr16_bp) <- c("scanone","data.frame")

#plot
layout(mat = matrix(c(1:2),
                    nrow = 2,
                    ncol = 1),
       heights = c(1, 2))    # Heights of the two rows
# Plot 1
par(mar = c(0.01, 5, 2, 0.5))
#Create the base plot
plot(out_3_condi_chr16_bp, col = c("red"), chr = 16, main = "CC_SARS Conditioning Chr16 QTL interval", xlab = "", ylab = "LOD", xlim = c(start, end), ylim = c(0, 10))
text(peak_bp, 9.5, paste0(drop_interval$chr, "@", drop_interval$pos, "cM"), cex = 0.75)
segments(x0 = peak_bp,
         x1 = peak_bp,
         y0 = 0,
         y1 = drop_interval$lod,
         col="black", lty=2, lwd=1)
# Plot 2
par(mar = c(5.10, 5, 0, 0.5))
plot_genes(chr16_gene, bgcolor="white", xlim = c(start, end))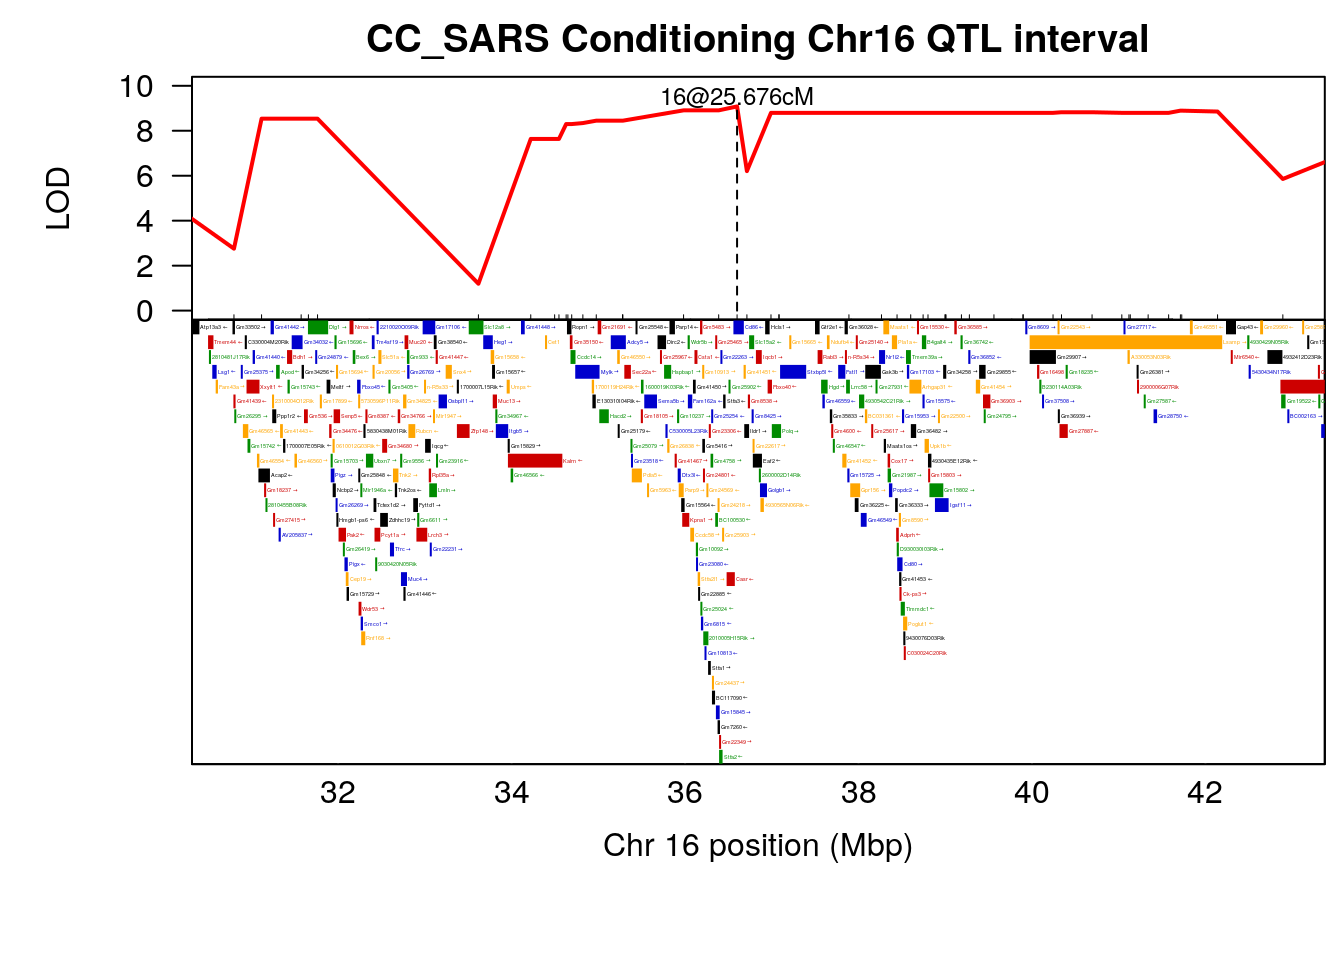
plot(out_3_condi_chr16, col = c("red"), chr = 7, ylab = "LOD")
###--------------out_3_condi_chr16 on chr7---------------
drop_interval = find_peaks(out_3_condi_chr16[, 3, drop = F], map = cross2$gmap, drop = 1.5, threshold = 6)
drop_interval = drop_interval[1,]

peak_bp = map[map$Chromosome == drop_interval$chr & map$cM_cox == drop_interval$pos & !is.na(map$cM_cox), "bp"]/10^6
peak_bp
# [1] 36.57991

start = map[map$Chromosome == drop_interval$chr & map$cM_cox == drop_interval$ci_lo & !is.na(map$cM_cox), "bp"]/10^6
start = 3
# [1] 35.15812
end   = map[map$Chromosome == drop_interval$chr & map$cM_cox == drop_interval$ci_hi & !is.na(map$cM_cox), "bp"]/10^6
end
# [1] 43.37599
#genes in the qtl region
query_variants <- create_variant_query_func("data/cc_variants.sqlite")
query_genes <- create_gene_query_func("data/mouse_genes_mgi.sqlite")
chr16_gene <- query_genes(chr = as.character(drop_interval$chr), start, end)

#add bp
out_3_condi_chr16_bp <- out_3_condi_chr16 %>%
  rownames_to_column(.) %>%
  left_join(minimuga[, c(1,3,4)], by = c("rowname" = "marker")) %>%
  dplyr::mutate(pos = bp_mm10/10^6) %>%
  column_to_rownames()
class(out_3_condi_chr16_bp) <- c("scanone","data.frame")

#plot
layout(mat = matrix(c(1:2),
                    nrow = 2,
                    ncol = 1),
       heights = c(1, 2))    # Heights of the two rows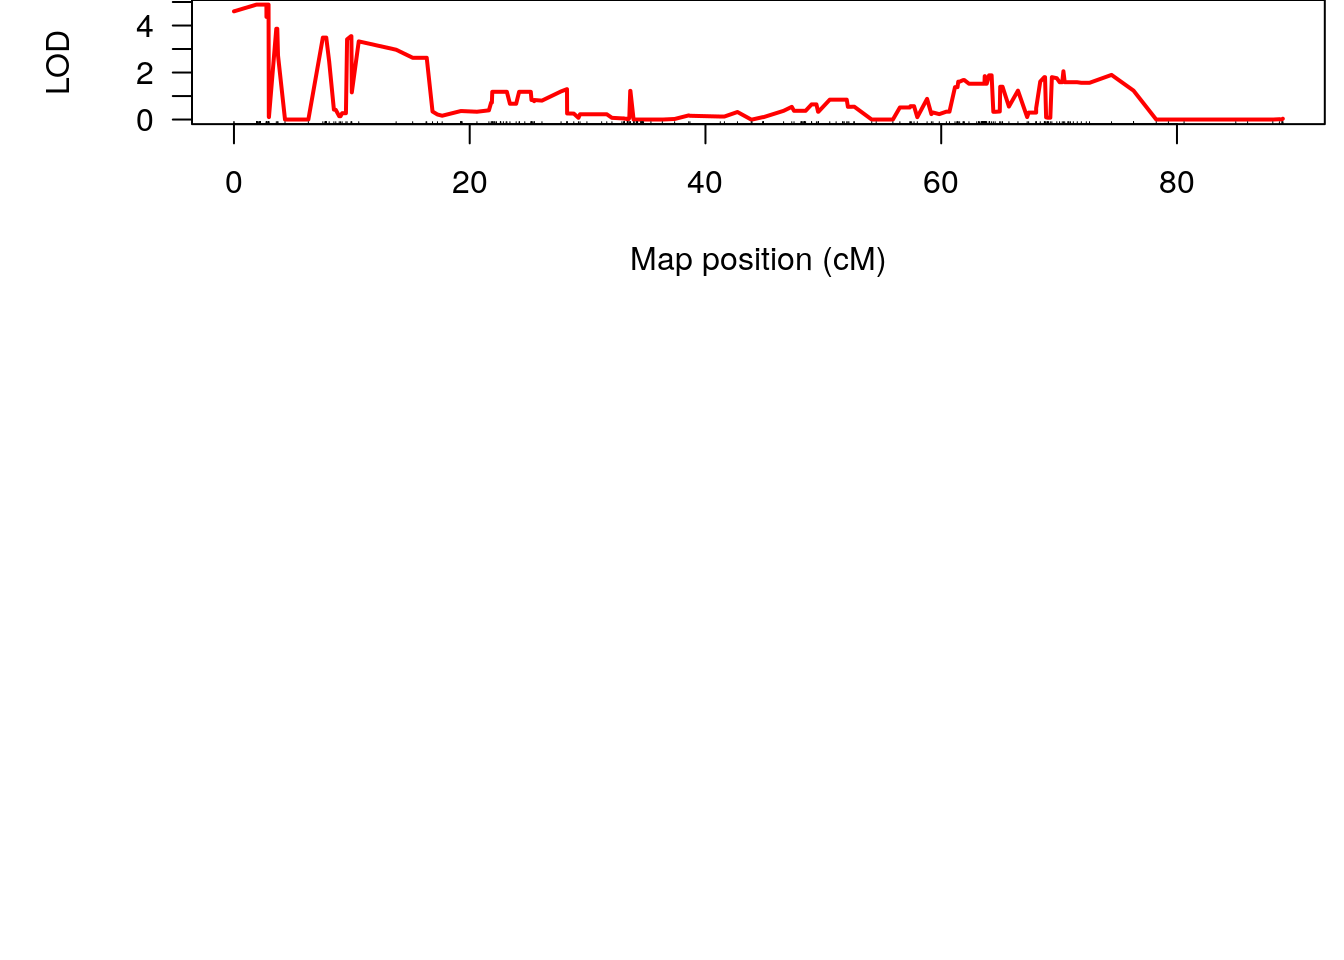
# Plot 1
par(mar = c(0.01, 5, 2, 0.5))
#Create the base plot
plot(out_3_condi_chr16_bp, col = c("red"), chr = 7, main = "CC_SARS Conditioning Chr7 QTL interval", xlab = "", ylab = "LOD", xlim = c(start, end), ylim = c(0, 10))
text(peak_bp, 7, paste0(drop_interval$chr, "@", drop_interval$pos, "cM"), cex = 0.75)
segments(x0 = peak_bp,
         x1 = peak_bp,
         y0 = 0,
         y1 = drop_interval$lod,
         col="black", lty=2, lwd=1)
# Plot 2
par(mar = c(5.10, 5, 0, 0.5))
plot_genes(chr16_gene, bgcolor="white", xlim = c(start, end))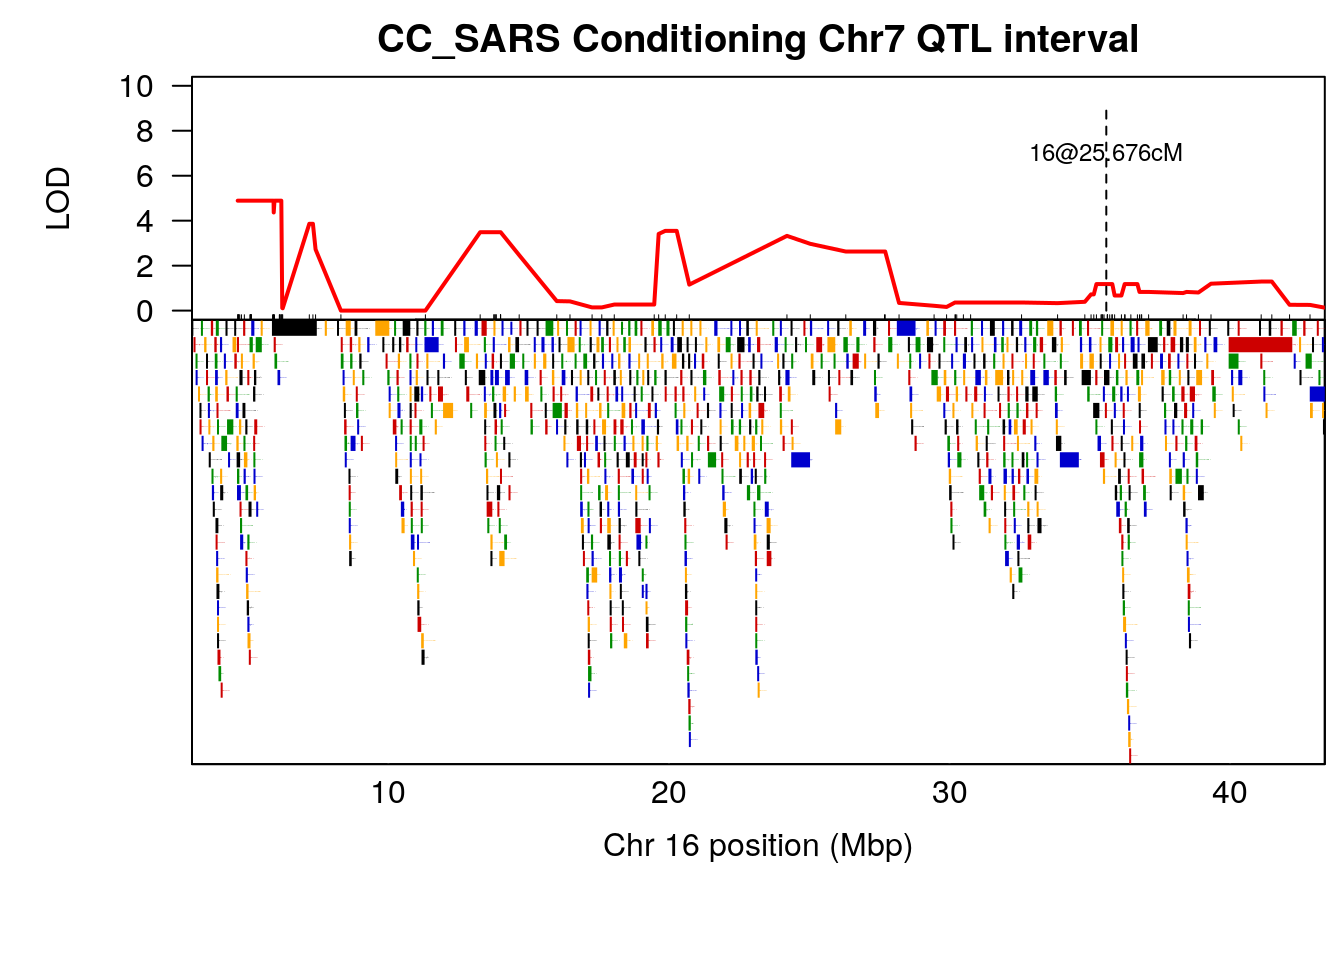
| Version | Author | Date |
|---|---|---|
| e298b32 | xhyuo | 2023-10-15 |
find_peaks(out_3_condi_chr16[,3,drop=F], map = cross2$gmap, drop = 1.5, threshold = 13.8)
# [1] lodindex  lodcolumn chr       pos       lod       ci_lo     ci_hi
# <0 rows> (or 0-length row.names)

#peak
peak = lodint(out_3_condi_chr16, chr = 7)
#peak marker
marker = rownames(peak)[which.max(peak$lod.p.mu)]
marker = "SBJ070127230"
par(mar=c(3, 5, 4, 3))
plotPXG(f2_qtl, marker = marker, jitter = 0.25, pheno.col = 13, infer = F,
        main = marker, ylab = "Log10_Lung_titer_4DPI_PFU_per_ml",
        mgp = c(3.4,1,0))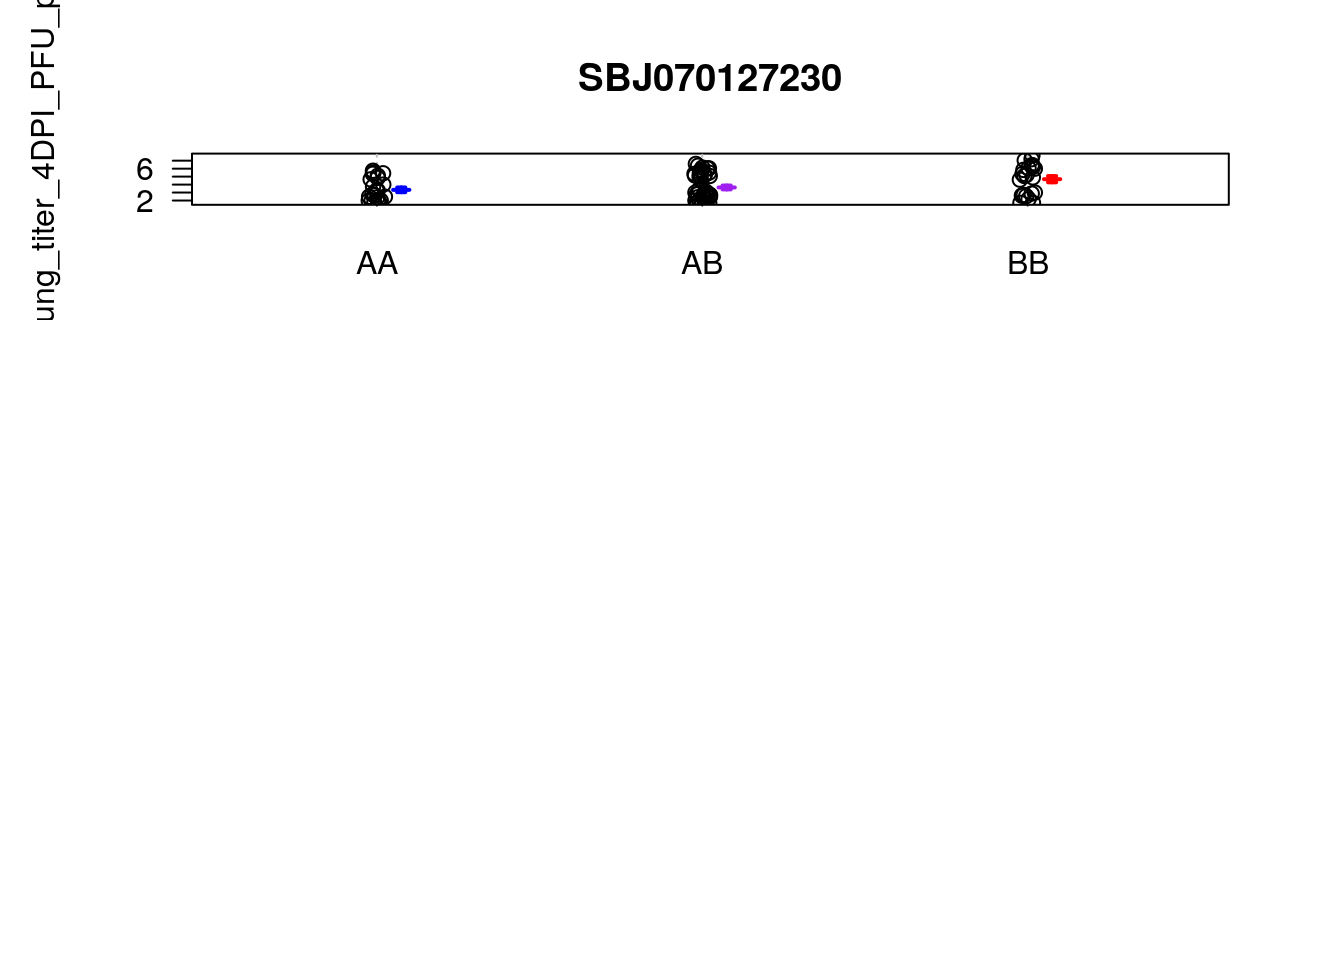
| Version | Author | Date |
|---|---|---|
| e298b32 | xhyuo | 2023-10-15 |
overlay between sars-1 and sars-2 on dpi
load("data/CC_SARS-2/dpi_out.RData")
load("data/CC_SARS-2/dpi_operm.RData")
load("data/CC_SARS-2/cross.RData")
dpi_out2 = dpi_out
levels(dpi_out2$chr)[levels(dpi_out2$chr) == "23"] = "X"
dpi_operm2 = dpi_operm
cross2 = cross
#old peaks
old_peak = map_dfr(1:9, function(i){
  x = find_peaks(dpi_out2[,i+2, drop=F],
                 map = convert2cross2(cross2)$gmap,
                 drop = 1.5,
                 threshold = summary(dpi_operm2[,i], alpha=c(0.05))[[1]]) %>%
    dplyr::mutate(Group = "Old mice", .before = 1) %>%
    dplyr::mutate(p.value = map_dbl(lod, function(x){mean(dpi_operm2[,i] >= x)}), .after = "lod") %>%
    dplyr::mutate(marker = map2_chr(chr, pos, function(x, y){
      find.marker(cross2, x, y)
    }), .after = pos) %>%
    dplyr::select(-2)
  })

#sars1
load("data/CC_SARS-1/dpi_out.RData")
load("data/CC_SARS-1/dpi_operm.RData")
load("data/CC_SARS-1/cross.RData")

#young peaks
young_peak = map_dfr(1:9, function(i){
  x = find_peaks(dpi_out[,i+2, drop=F],
                 map = convert2cross2(cross)$gmap,
                 drop = 1.5,
                 threshold = summary(dpi_operm[,i], alpha=c(0.05))[[1]]) %>%
    dplyr::mutate(Group = "young mice", .before = 1) %>%
    dplyr::mutate(p.value = map_dbl(lod, function(x){mean(dpi_operm[,i] >= x)}), .after = "lod") %>%
    dplyr::mutate(marker = map2_chr(chr, pos, function(x, y){
      find.marker(cross, x, y)
    }), .after = pos) %>%
    dplyr::select(-2)
})

for(i in 1:9){
  print(paste0("pheno = ", i))
  plot(dpi_out2, lodcolumn = i, col = c("slateblue"), ylim = c(0, 7))
  add.threshold(dpi_out2, lodcolumn = i, perms = dpi_operm2, alpha = 0.05, col="red")
  add.threshold(dpi_out2, lodcolumn = i, perms = dpi_operm2, alpha = 0.1, col="blue")
  #sars1
  plot(dpi_out, lodcolumn = i, col = c("violetred"), add = TRUE, ylim = c(0, 7), xaxt = "n")
  legend("topleft", lwd=2, col=c("slateblue", "violetred"), c("Old mice", "Young mice"), bg="gray90")
}
# [1] "pheno = 1"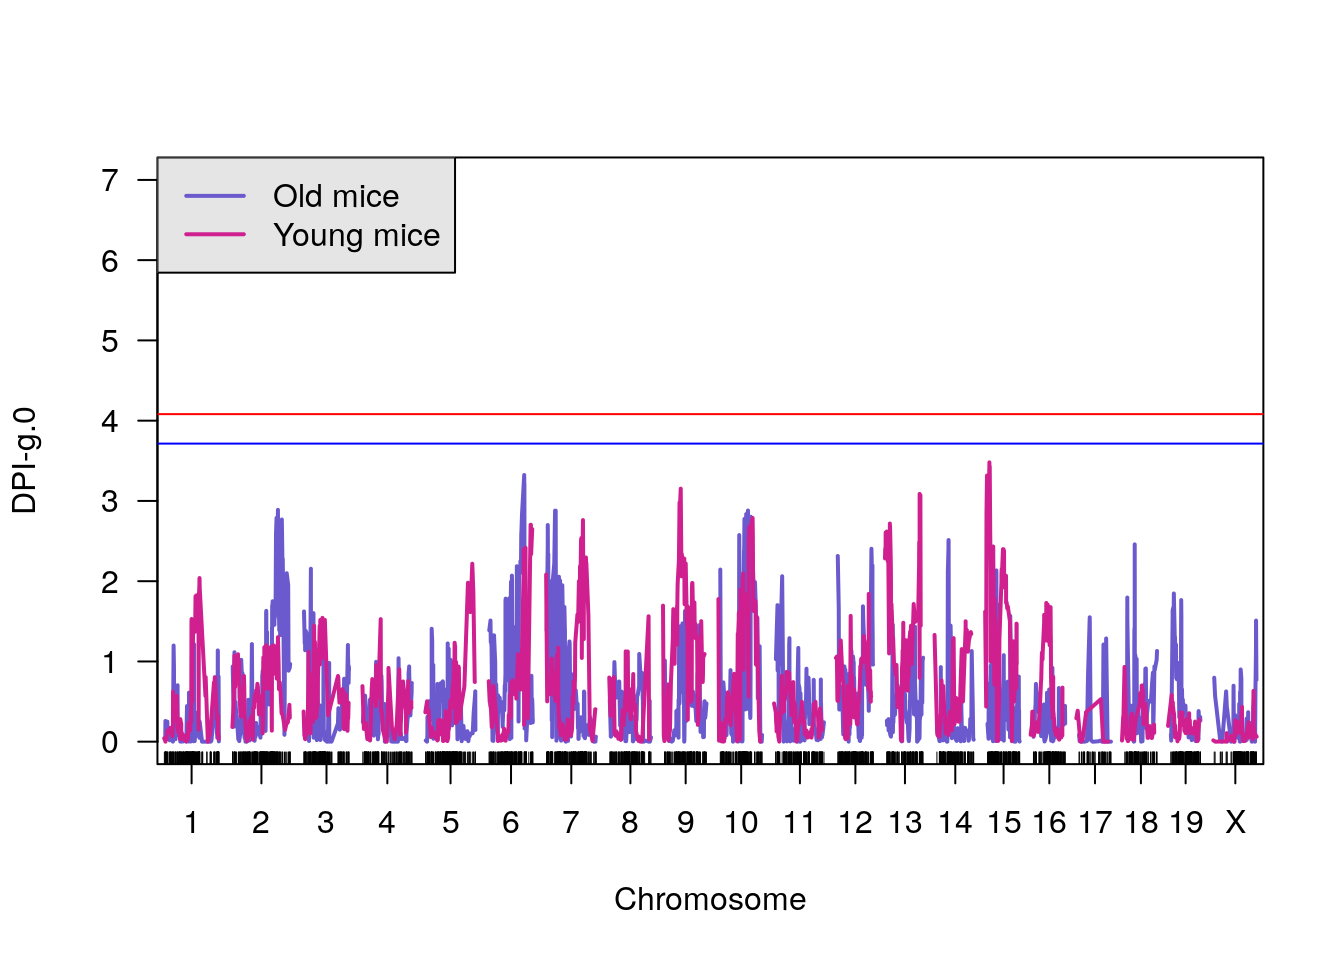
| Version | Author | Date |
|---|---|---|
| 0d66d81 | xhyuo | 2023-09-29 |
# [1] "pheno = 2"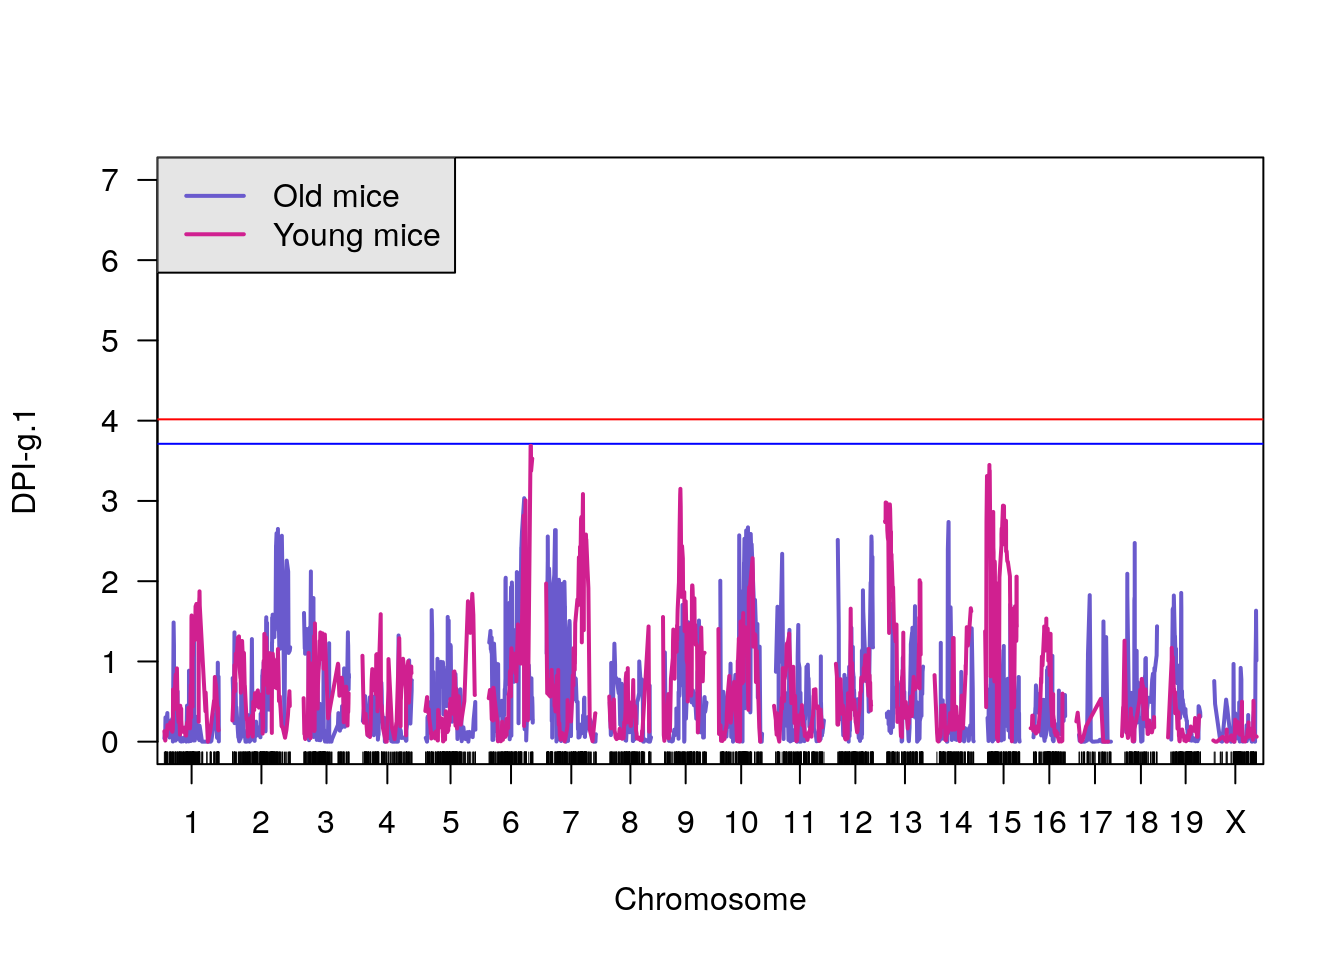
| Version | Author | Date |
|---|---|---|
| 0d66d81 | xhyuo | 2023-09-29 |
# [1] "pheno = 3"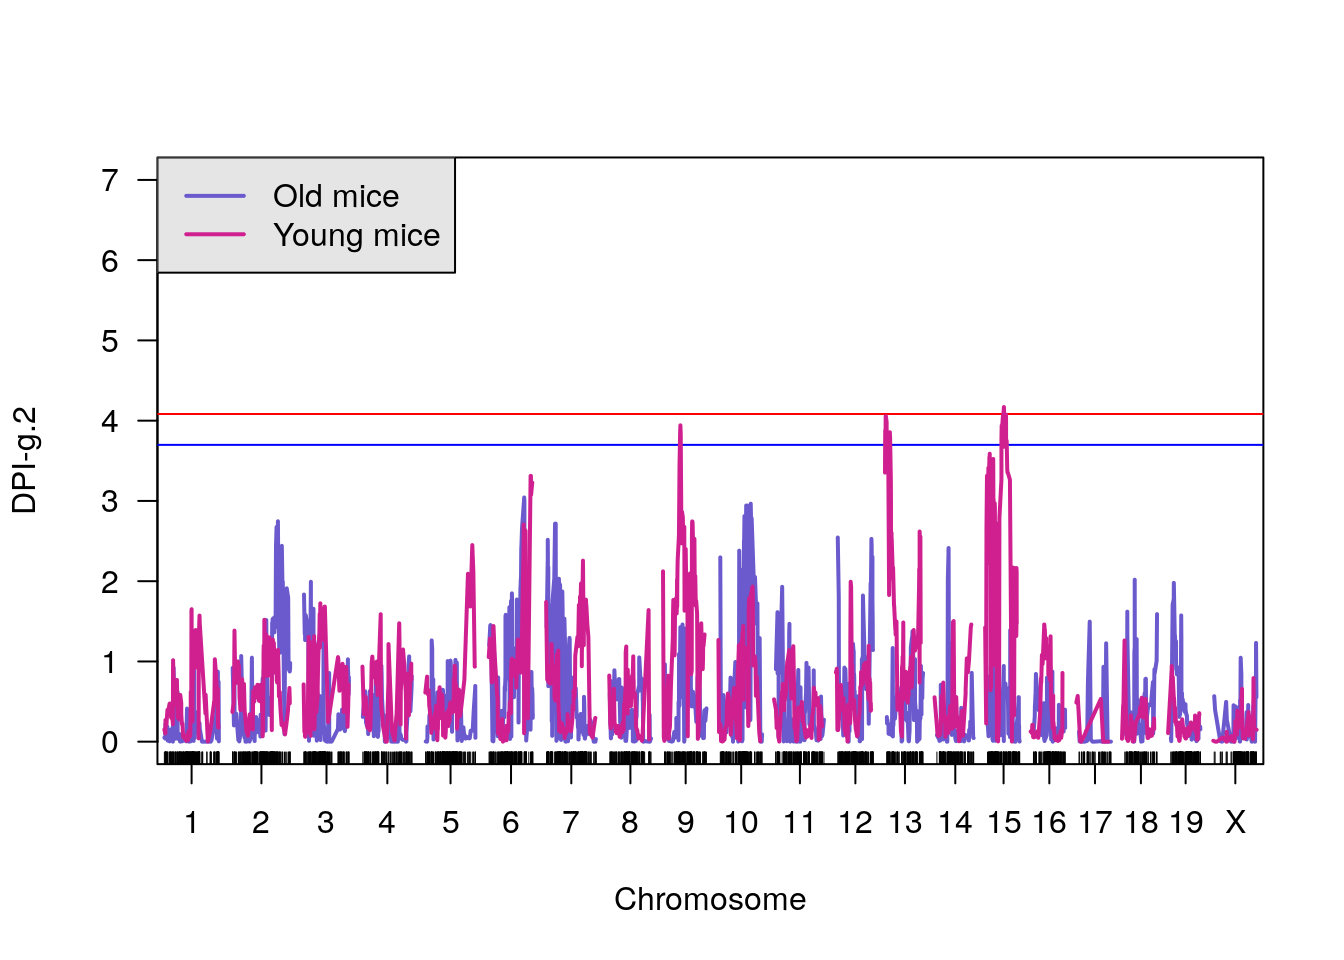
| Version | Author | Date |
|---|---|---|
| 0d66d81 | xhyuo | 2023-09-29 |
# [1] "pheno = 4"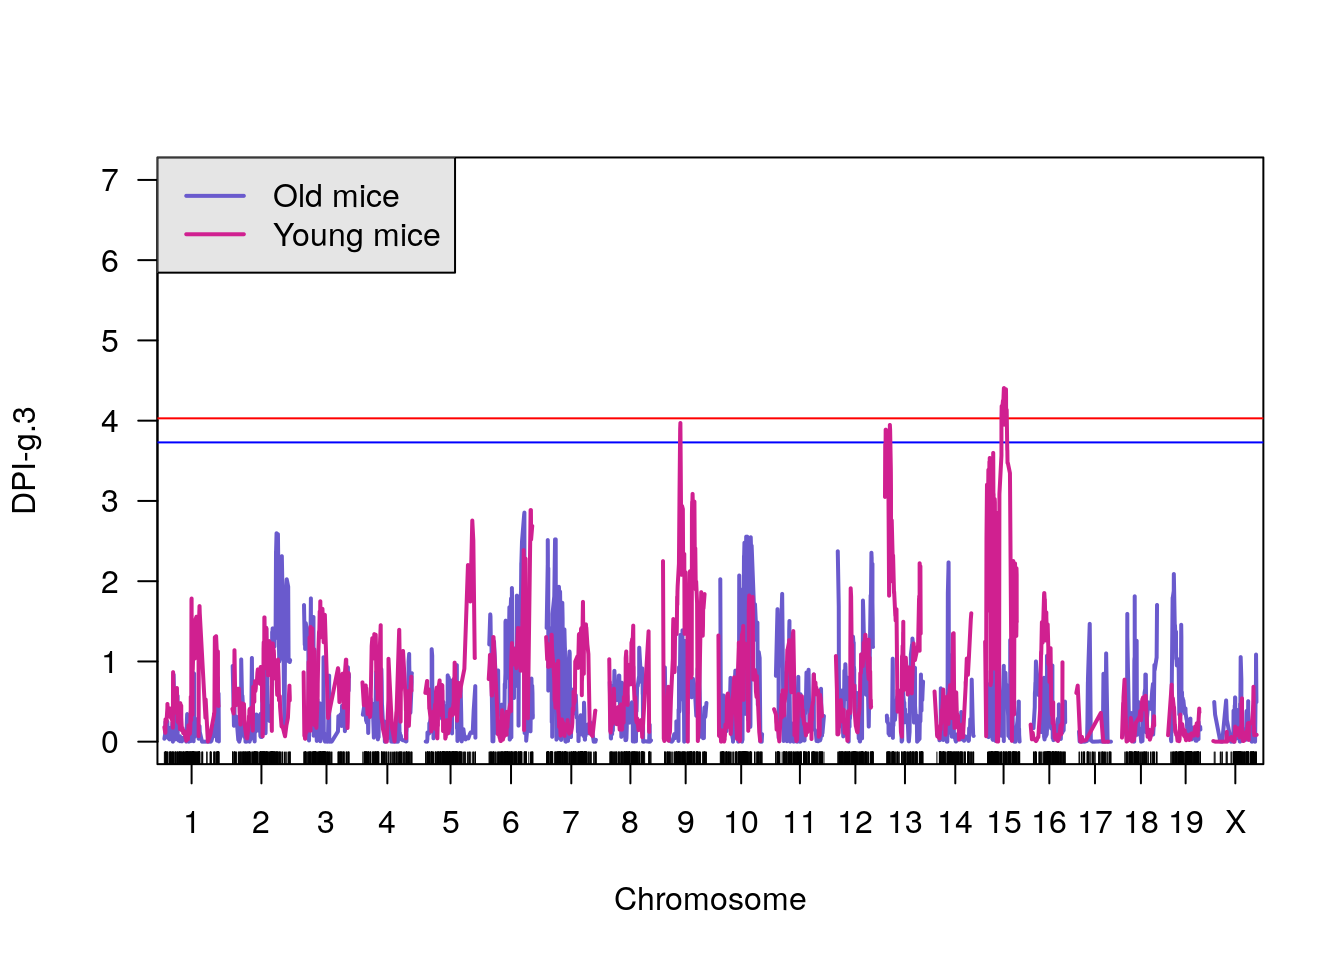
| Version | Author | Date |
|---|---|---|
| 0d66d81 | xhyuo | 2023-09-29 |
# [1] "pheno = 5"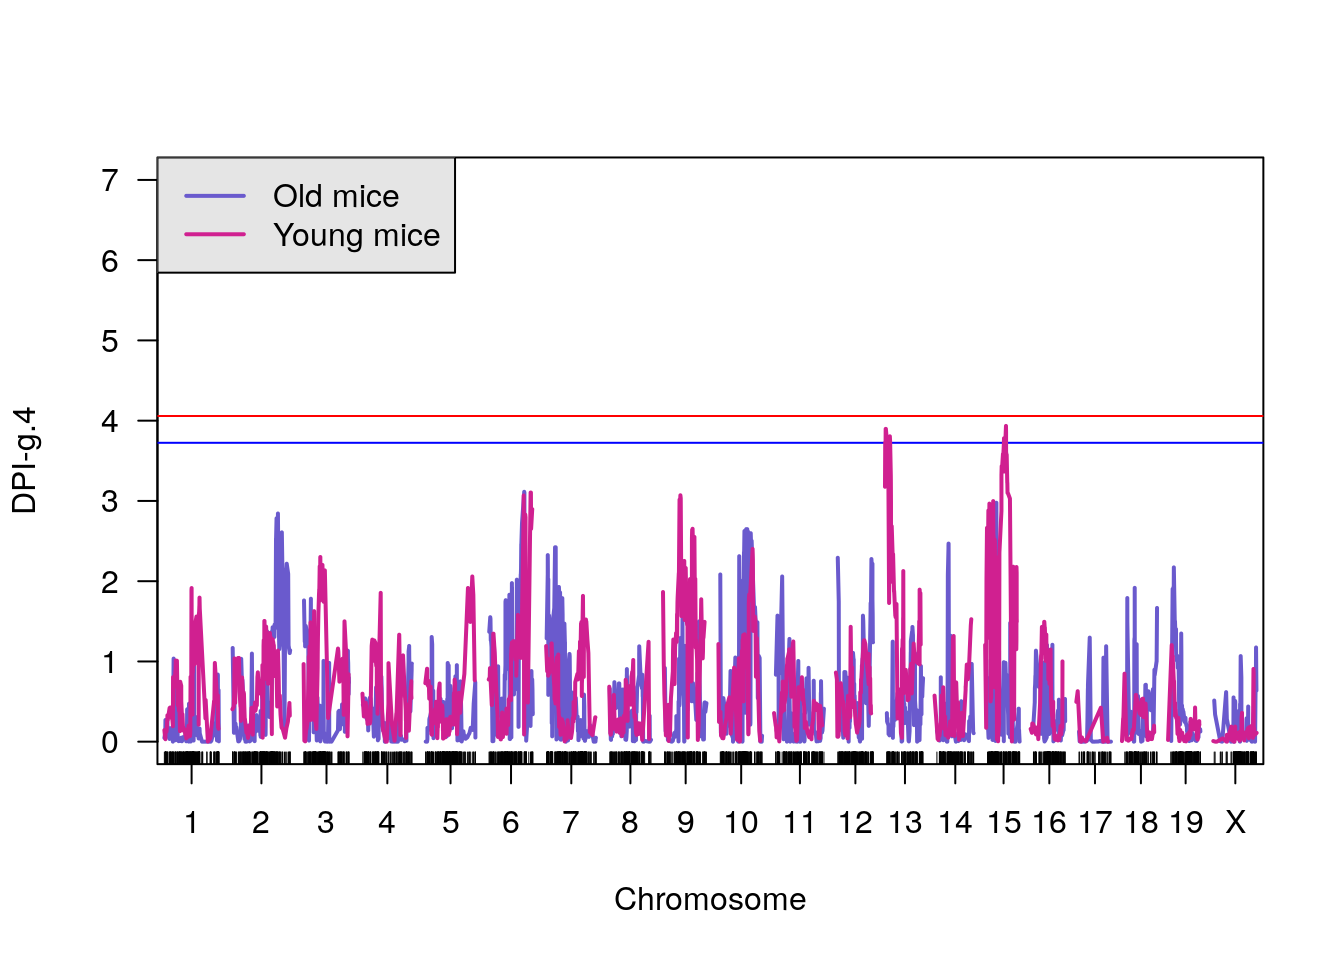
| Version | Author | Date |
|---|---|---|
| 0d66d81 | xhyuo | 2023-09-29 |
# [1] "pheno = 6"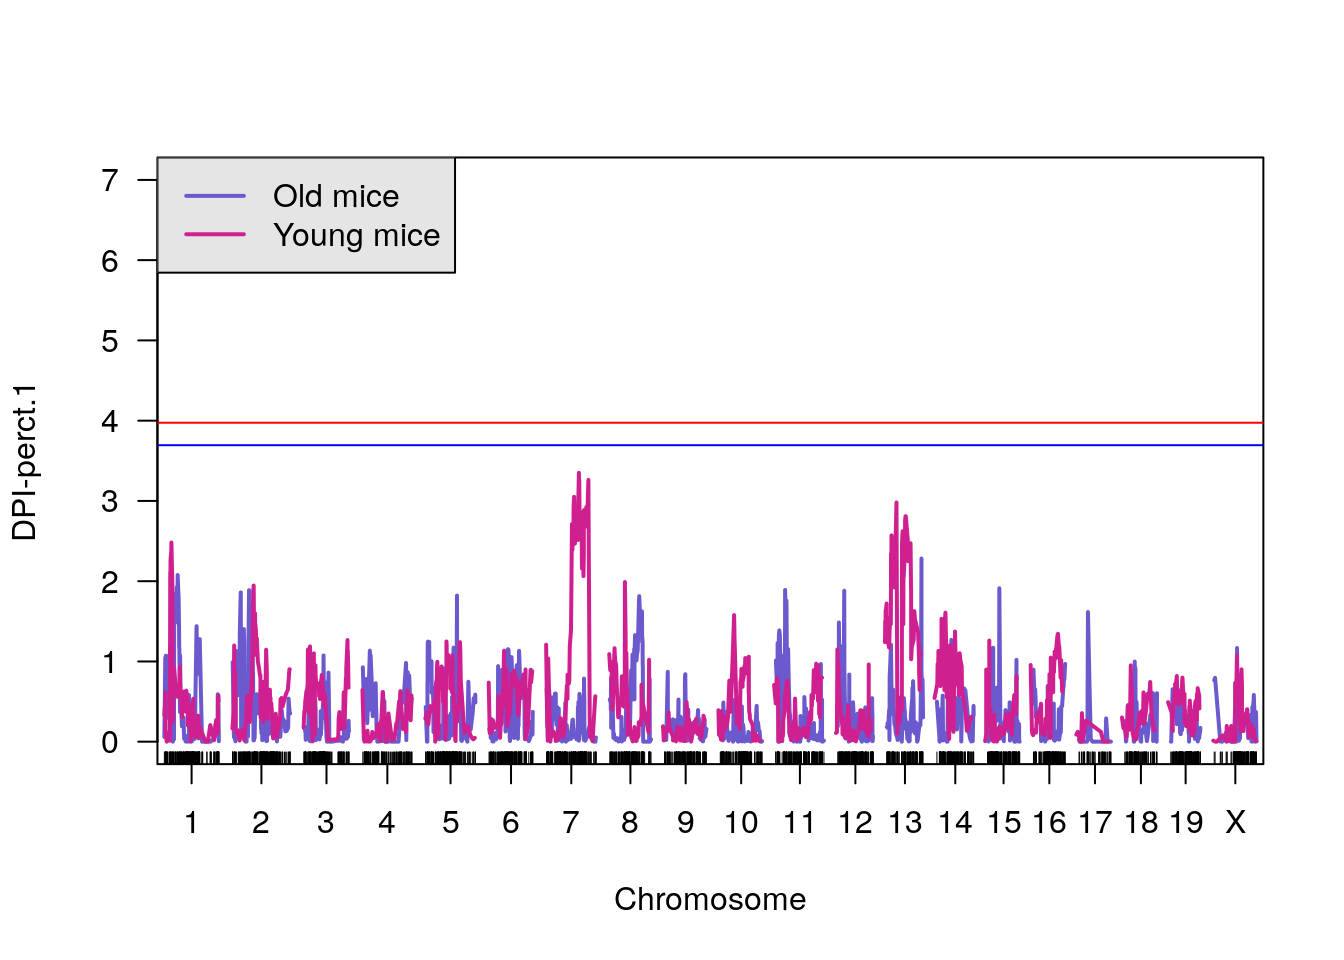
| Version | Author | Date |
|---|---|---|
| 0d66d81 | xhyuo | 2023-09-29 |
# [1] "pheno = 7"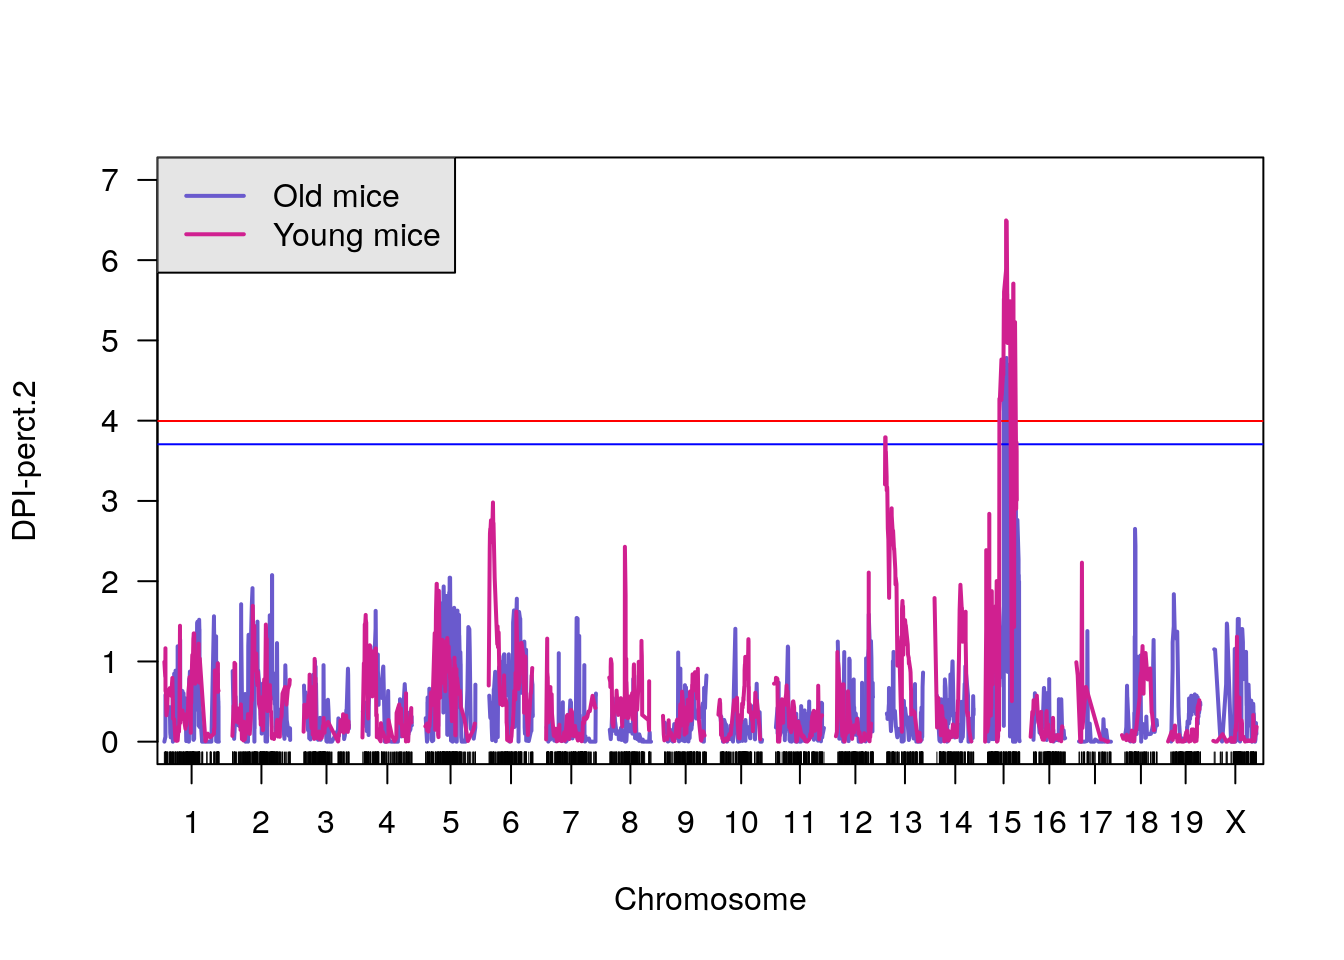
| Version | Author | Date |
|---|---|---|
| 0d66d81 | xhyuo | 2023-09-29 |
# [1] "pheno = 8"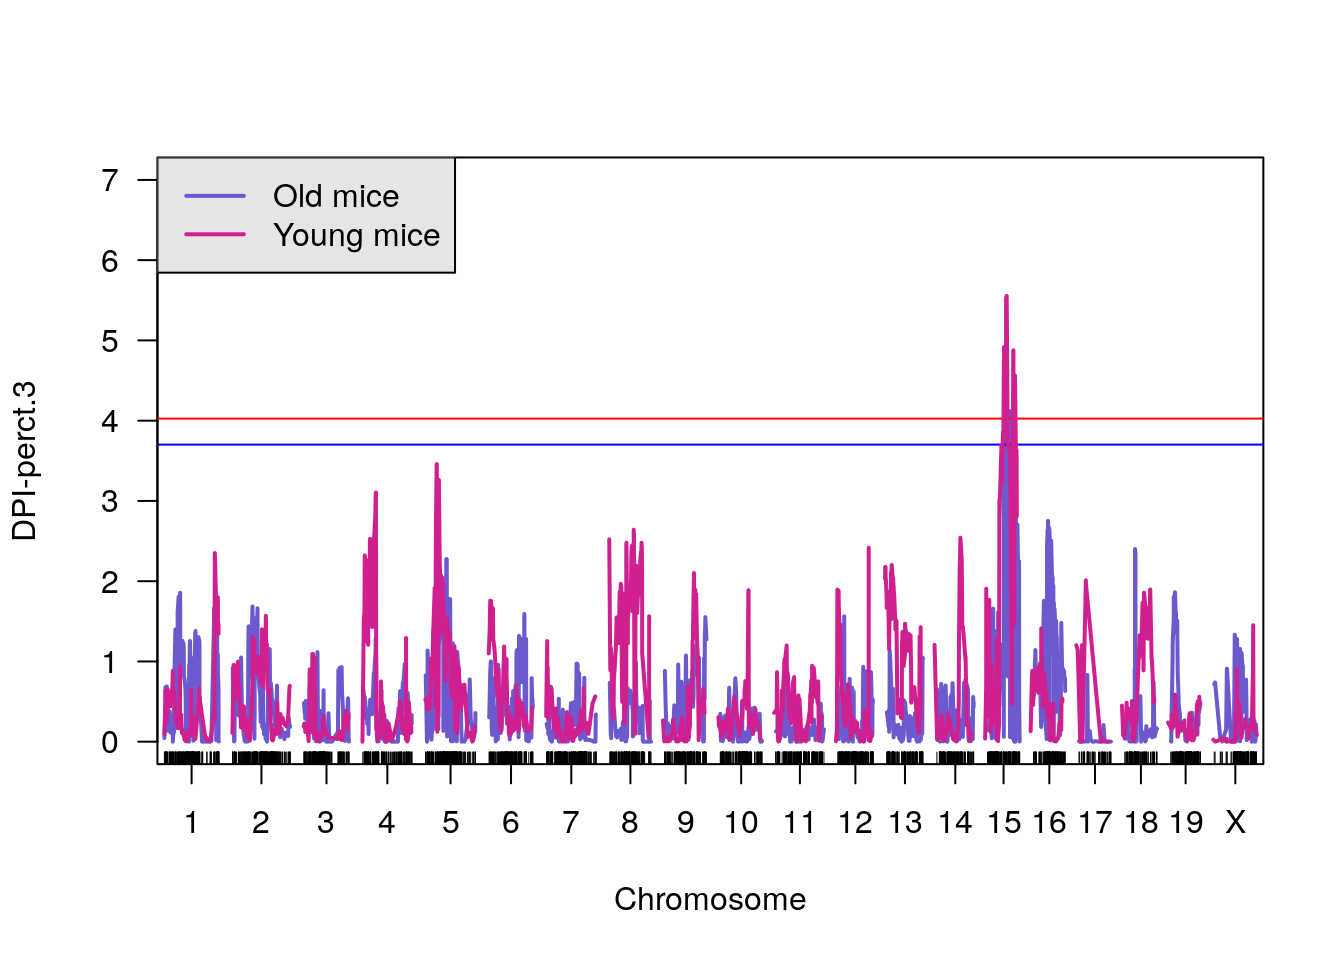
| Version | Author | Date |
|---|---|---|
| 0d66d81 | xhyuo | 2023-09-29 |
# [1] "pheno = 9"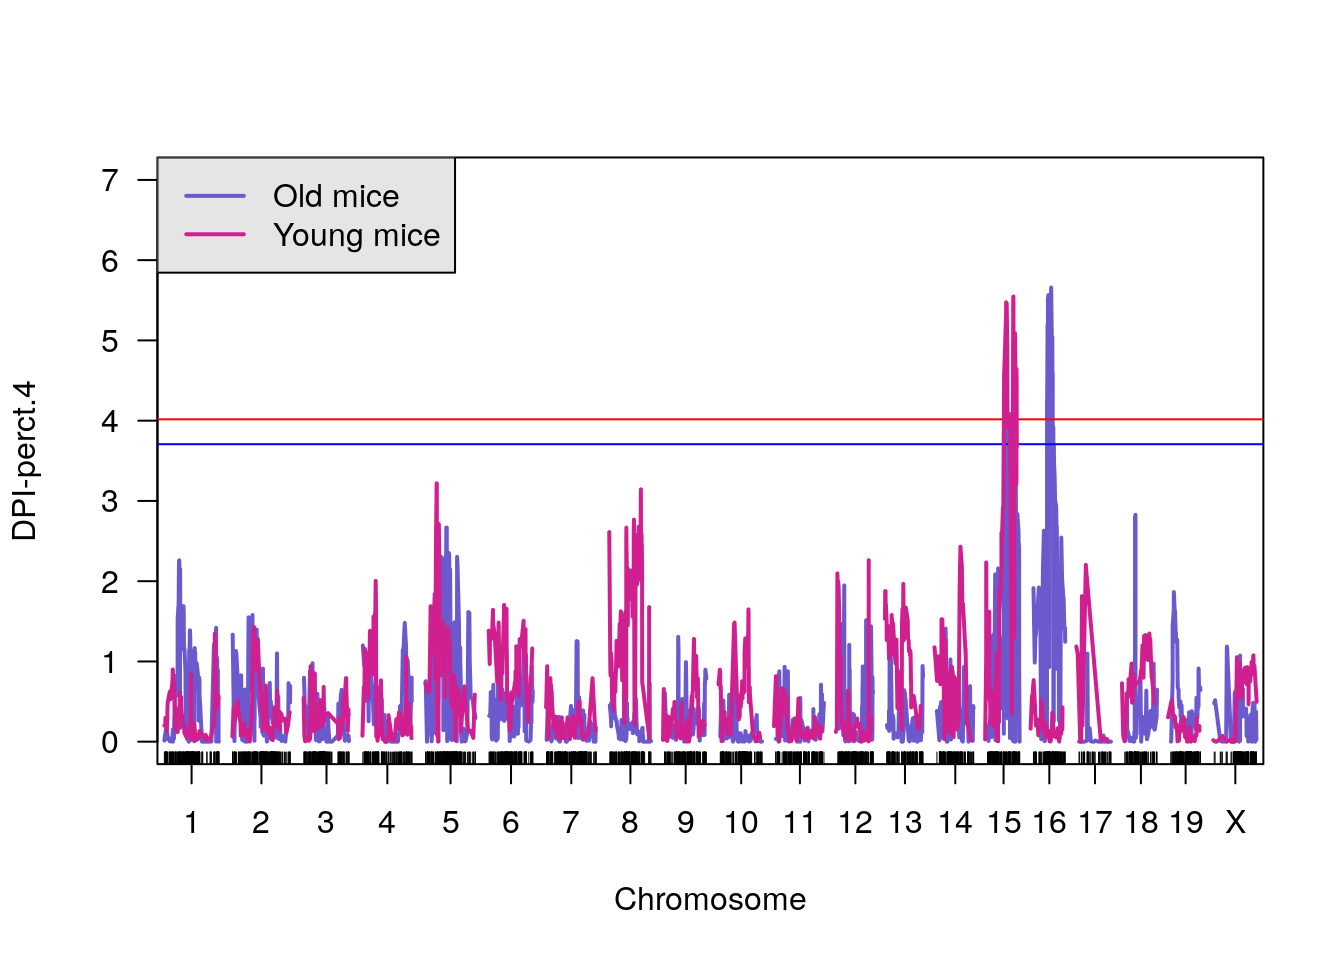
| Version | Author | Date |
|---|---|---|
| 0d66d81 | xhyuo | 2023-09-29 |
#display
DT::datatable(bind_rows(young_peak, old_peak),
              filter = list(position = 'top', clear = FALSE),
              extensions = 'Buttons',
              options = list(dom = 'Blfrtip',
                             buttons = c('csv', 'excel'),
                             lengthMenu = list(c(10,25,50,-1),
                                               c(10,25,50,"All")),
                             pageLength = 40,
                             scrollY = "300px",
                             scrollX = "40px"),
              caption = htmltools::tags$caption(style = 'caption-side: top; text-align: left; color:black; font-size:200% ;','Table of LOD, p value, peak marker, confidence interval'))
sessionInfo()
# R version 4.0.3 (2020-10-10)
# Platform: x86_64-pc-linux-gnu (64-bit)
# Running under: Ubuntu 20.04.2 LTS
#
# Matrix products: default
# BLAS/LAPACK: /usr/lib/x86_64-linux-gnu/openblas-pthread/libopenblasp-r0.3.8.so
#
# locale:
#  [1] LC_CTYPE=en_US.UTF-8       LC_NUMERIC=C
#  [3] LC_TIME=en_US.UTF-8        LC_COLLATE=en_US.UTF-8
#  [5] LC_MONETARY=en_US.UTF-8    LC_MESSAGES=C
#  [7] LC_PAPER=en_US.UTF-8       LC_NAME=C
#  [9] LC_ADDRESS=C               LC_TELEPHONE=C
# [11] LC_MEASUREMENT=en_US.UTF-8 LC_IDENTIFICATION=C
#
# attached base packages:
# [1] parallel  stats     graphics  grDevices utils     datasets  methods
# [8] base
#
# other attached packages:
#  [1] biomaRt_2.46.3    DT_0.17           qtlcharts_0.12-10 qtl2_0.24
#  [5] broman_0.72-4     forcats_0.5.1     stringr_1.4.0     dplyr_1.0.4
#  [9] purrr_0.3.4       readr_1.4.0       tidyr_1.1.2       tibble_3.0.6
# [13] tidyverse_1.3.0   abind_1.4-5       regress_1.3-21    survival_3.2-7
# [17] qtl_1.47-9        GGally_2.1.0      gridExtra_2.3     ggplot2_3.3.3
# [21] workflowr_1.6.2
#
# loaded via a namespace (and not attached):
#  [1] fs_1.5.0             lubridate_1.7.9.2    bit64_4.0.5
#  [4] progress_1.2.2       RColorBrewer_1.1-2   httr_1.4.2
#  [7] rprojroot_2.0.2      tools_4.0.3          backports_1.2.1
# [10] R6_2.5.0             BiocGenerics_0.36.1  DBI_1.1.1
# [13] colorspace_2.0-0     withr_2.4.1          prettyunits_1.1.1
# [16] tidyselect_1.1.0     curl_4.3             bit_4.0.4
# [19] compiler_4.0.3       git2r_0.28.0         Biobase_2.50.0
# [22] cli_2.3.0            rvest_0.3.6          xml2_1.3.2
# [25] labeling_0.4.2       scales_1.1.1         askpass_1.1
# [28] rappdirs_0.3.3       digest_0.6.27        rmarkdown_2.6
# [31] pkgconfig_2.0.3      htmltools_0.5.1.1    highr_0.8
# [34] dbplyr_2.1.0         fastmap_1.1.0        htmlwidgets_1.5.3
# [37] rlang_0.4.10         readxl_1.3.1         rstudioapi_0.13
# [40] RSQLite_2.2.3        farver_2.0.3         generics_0.1.0
# [43] jsonlite_1.7.2       crosstalk_1.1.1      vroom_1.4.0
# [46] magrittr_2.0.1       Matrix_1.2-18        S4Vectors_0.28.1
# [49] Rcpp_1.0.6           munsell_0.5.0        lifecycle_1.0.0
# [52] stringi_1.5.3        whisker_0.4          yaml_2.2.1
# [55] BiocFileCache_1.14.0 plyr_1.8.6           grid_4.0.3
# [58] blob_1.2.1           promises_1.2.0.1     crayon_1.4.1
# [61] lattice_0.20-41      haven_2.3.1          splines_4.0.3
# [64] hms_1.0.0            knitr_1.31           pillar_1.4.7
# [67] reshape2_1.4.4       stats4_4.0.3         reprex_1.0.0
# [70] XML_3.99-0.5         glue_1.4.2           evaluate_0.14
# [73] data.table_1.13.6    modelr_0.1.8         vctrs_0.3.6
# [76] httpuv_1.5.5         cellranger_1.1.0     openssl_1.4.3
# [79] gtable_0.3.0         reshape_0.8.8        assertthat_0.2.1
# [82] cachem_1.0.4         xfun_0.21            broom_0.7.4
# [85] later_1.1.0.1        IRanges_2.24.1       AnnotationDbi_1.52.0
# [88] memoise_2.0.0        ellipsis_0.3.1
This R Markdown site was created with workflowr