DEG_analysis_BOT_M_vs_F
Last updated: 2023-12-23
Checks: 6 1
Knit directory: DO_Opioid/
This reproducible R Markdown analysis was created with workflowr (version 1.6.2). The Checks tab describes the reproducibility checks that were applied when the results were created. The Past versions tab lists the development history.
Great! Since the R Markdown file has been committed to the Git repository, you know the exact version of the code that produced these results.
Great job! The global environment was empty. Objects defined in the global environment can affect the analysis in your R Markdown file in unknown ways. For reproduciblity it’s best to always run the code in an empty environment.
The command set.seed(20200504) was run prior to running the code in the R Markdown file. Setting a seed ensures that any results that rely on randomness, e.g. subsampling or permutations, are reproducible.
Great job! Recording the operating system, R version, and package versions is critical for reproducibility.
Nice! There were no cached chunks for this analysis, so you can be confident that you successfully produced the results during this run.
Using absolute paths to the files within your workflowr project makes it difficult for you and others to run your code on a different machine. Change the absolute path(s) below to the suggested relative path(s) to make your code more reproducible.
| absolute | relative |
|---|---|
| /projects/compsci/vmp/USERS/heh/DO_Opioid/data/BOT_NTS_rnaseq_results/ | data/BOT_NTS_rnaseq_results |
Great! You are using Git for version control. Tracking code development and connecting the code version to the results is critical for reproducibility.
The results in this page were generated with repository version 883216f. See the Past versions tab to see a history of the changes made to the R Markdown and HTML files.
Note that you need to be careful to ensure that all relevant files for the analysis have been committed to Git prior to generating the results (you can use wflow_publish or wflow_git_commit). workflowr only checks the R Markdown file, but you know if there are other scripts or data files that it depends on. Below is the status of the Git repository when the results were generated:
Ignored files:
    Ignored:    .RData
    Ignored:    .Rhistory
    Ignored:    .Rproj.user/
    Ignored:    analysis/Picture1.png

Untracked files:
    Untracked:  Rplot_rz.png
    Untracked:  TIMBR.test.prop.bm.MN.RET.RData
    Untracked:  TIMBR.test.random.RData
    Untracked:  TIMBR.test.rz.transformed_TVb_ml.RData
    Untracked:  analysis/DDO_morphine1_second_set_69k.stdout
    Untracked:  analysis/DO_Fentanyl.R
    Untracked:  analysis/DO_Fentanyl.err
    Untracked:  analysis/DO_Fentanyl.out
    Untracked:  analysis/DO_Fentanyl.sh
    Untracked:  analysis/DO_Fentanyl_69k.R
    Untracked:  analysis/DO_Fentanyl_69k.err
    Untracked:  analysis/DO_Fentanyl_69k.out
    Untracked:  analysis/DO_Fentanyl_69k.sh
    Untracked:  analysis/DO_Fentanyl_Cohort2_GCTA_herit.R
    Untracked:  analysis/DO_Fentanyl_Cohort2_gemma.R
    Untracked:  analysis/DO_Fentanyl_Cohort2_mapping.R
    Untracked:  analysis/DO_Fentanyl_Cohort2_mapping.err
    Untracked:  analysis/DO_Fentanyl_Cohort2_mapping.out
    Untracked:  analysis/DO_Fentanyl_Cohort2_mapping.sh
    Untracked:  analysis/DO_Fentanyl_GCTA_herit.R
    Untracked:  analysis/DO_Fentanyl_alternate_metrics_69k.R
    Untracked:  analysis/DO_Fentanyl_alternate_metrics_69k.err
    Untracked:  analysis/DO_Fentanyl_alternate_metrics_69k.out
    Untracked:  analysis/DO_Fentanyl_alternate_metrics_69k.sh
    Untracked:  analysis/DO_Fentanyl_alternate_metrics_array.R
    Untracked:  analysis/DO_Fentanyl_alternate_metrics_array.err
    Untracked:  analysis/DO_Fentanyl_alternate_metrics_array.out
    Untracked:  analysis/DO_Fentanyl_alternate_metrics_array.sh
    Untracked:  analysis/DO_Fentanyl_array.R
    Untracked:  analysis/DO_Fentanyl_array.err
    Untracked:  analysis/DO_Fentanyl_array.out
    Untracked:  analysis/DO_Fentanyl_array.sh
    Untracked:  analysis/DO_Fentanyl_combining2Cohort_GCTA_herit.R
    Untracked:  analysis/DO_Fentanyl_combining2Cohort_gemma.R
    Untracked:  analysis/DO_Fentanyl_combining2Cohort_mapping.R
    Untracked:  analysis/DO_Fentanyl_combining2Cohort_mapping.err
    Untracked:  analysis/DO_Fentanyl_combining2Cohort_mapping.out
    Untracked:  analysis/DO_Fentanyl_combining2Cohort_mapping.sh
    Untracked:  analysis/DO_Fentanyl_combining2Cohort_mapping_CoxPH.R
    Untracked:  analysis/DO_Fentanyl_finalreport_to_plink.sh
    Untracked:  analysis/DO_Fentanyl_gemma.R
    Untracked:  analysis/DO_Fentanyl_gemma.err
    Untracked:  analysis/DO_Fentanyl_gemma.out
    Untracked:  analysis/DO_Fentanyl_gemma.sh
    Untracked:  analysis/DO_morphine1.R
    Untracked:  analysis/DO_morphine1.Rout
    Untracked:  analysis/DO_morphine1.sh
    Untracked:  analysis/DO_morphine1.stderr
    Untracked:  analysis/DO_morphine1.stdout
    Untracked:  analysis/DO_morphine1_SNP.R
    Untracked:  analysis/DO_morphine1_SNP.Rout
    Untracked:  analysis/DO_morphine1_SNP.sh
    Untracked:  analysis/DO_morphine1_SNP.stderr
    Untracked:  analysis/DO_morphine1_SNP.stdout
    Untracked:  analysis/DO_morphine1_combined.R
    Untracked:  analysis/DO_morphine1_combined.Rout
    Untracked:  analysis/DO_morphine1_combined.sh
    Untracked:  analysis/DO_morphine1_combined.stderr
    Untracked:  analysis/DO_morphine1_combined.stdout
    Untracked:  analysis/DO_morphine1_combined_69k.R
    Untracked:  analysis/DO_morphine1_combined_69k.Rout
    Untracked:  analysis/DO_morphine1_combined_69k.sh
    Untracked:  analysis/DO_morphine1_combined_69k.stderr
    Untracked:  analysis/DO_morphine1_combined_69k.stdout
    Untracked:  analysis/DO_morphine1_combined_69k_m2.R
    Untracked:  analysis/DO_morphine1_combined_69k_m2.Rout
    Untracked:  analysis/DO_morphine1_combined_69k_m2.sh
    Untracked:  analysis/DO_morphine1_combined_69k_m2.stderr
    Untracked:  analysis/DO_morphine1_combined_69k_m2.stdout
    Untracked:  analysis/DO_morphine1_combined_weight_DOB.R
    Untracked:  analysis/DO_morphine1_combined_weight_DOB.Rout
    Untracked:  analysis/DO_morphine1_combined_weight_DOB.err
    Untracked:  analysis/DO_morphine1_combined_weight_DOB.out
    Untracked:  analysis/DO_morphine1_combined_weight_DOB.sh
    Untracked:  analysis/DO_morphine1_combined_weight_DOB.stderr
    Untracked:  analysis/DO_morphine1_combined_weight_DOB.stdout
    Untracked:  analysis/DO_morphine1_combined_weight_age.R
    Untracked:  analysis/DO_morphine1_combined_weight_age.err
    Untracked:  analysis/DO_morphine1_combined_weight_age.out
    Untracked:  analysis/DO_morphine1_combined_weight_age.sh
    Untracked:  analysis/DO_morphine1_combined_weight_age_GAMMT.R
    Untracked:  analysis/DO_morphine1_combined_weight_age_GAMMT.err
    Untracked:  analysis/DO_morphine1_combined_weight_age_GAMMT.out
    Untracked:  analysis/DO_morphine1_combined_weight_age_GAMMT.sh
    Untracked:  analysis/DO_morphine1_combined_weight_age_GAMMT_chr19.R
    Untracked:  analysis/DO_morphine1_combined_weight_age_GAMMT_chr19.err
    Untracked:  analysis/DO_morphine1_combined_weight_age_GAMMT_chr19.out
    Untracked:  analysis/DO_morphine1_combined_weight_age_GAMMT_chr19.sh
    Untracked:  analysis/DO_morphine1_cph.R
    Untracked:  analysis/DO_morphine1_cph.Rout
    Untracked:  analysis/DO_morphine1_cph.sh
    Untracked:  analysis/DO_morphine1_second_set.R
    Untracked:  analysis/DO_morphine1_second_set.Rout
    Untracked:  analysis/DO_morphine1_second_set.sh
    Untracked:  analysis/DO_morphine1_second_set.stderr
    Untracked:  analysis/DO_morphine1_second_set.stdout
    Untracked:  analysis/DO_morphine1_second_set_69k.R
    Untracked:  analysis/DO_morphine1_second_set_69k.Rout
    Untracked:  analysis/DO_morphine1_second_set_69k.sh
    Untracked:  analysis/DO_morphine1_second_set_69k.stderr
    Untracked:  analysis/DO_morphine1_second_set_SNP.R
    Untracked:  analysis/DO_morphine1_second_set_SNP.Rout
    Untracked:  analysis/DO_morphine1_second_set_SNP.sh
    Untracked:  analysis/DO_morphine1_second_set_SNP.stderr
    Untracked:  analysis/DO_morphine1_second_set_SNP.stdout
    Untracked:  analysis/DO_morphine1_second_set_weight_DOB.R
    Untracked:  analysis/DO_morphine1_second_set_weight_DOB.Rout
    Untracked:  analysis/DO_morphine1_second_set_weight_DOB.err
    Untracked:  analysis/DO_morphine1_second_set_weight_DOB.out
    Untracked:  analysis/DO_morphine1_second_set_weight_DOB.sh
    Untracked:  analysis/DO_morphine1_second_set_weight_DOB.stderr
    Untracked:  analysis/DO_morphine1_second_set_weight_DOB.stdout
    Untracked:  analysis/DO_morphine1_second_set_weight_age.R
    Untracked:  analysis/DO_morphine1_second_set_weight_age.Rout
    Untracked:  analysis/DO_morphine1_second_set_weight_age.err
    Untracked:  analysis/DO_morphine1_second_set_weight_age.out
    Untracked:  analysis/DO_morphine1_second_set_weight_age.sh
    Untracked:  analysis/DO_morphine1_second_set_weight_age.stderr
    Untracked:  analysis/DO_morphine1_second_set_weight_age.stdout
    Untracked:  analysis/DO_morphine1_weight_DOB.R
    Untracked:  analysis/DO_morphine1_weight_DOB.sh
    Untracked:  analysis/DO_morphine1_weight_age.R
    Untracked:  analysis/DO_morphine1_weight_age.sh
    Untracked:  analysis/DO_morphine_gemma.R
    Untracked:  analysis/DO_morphine_gemma.err
    Untracked:  analysis/DO_morphine_gemma.out
    Untracked:  analysis/DO_morphine_gemma.sh
    Untracked:  analysis/DO_morphine_gemma_firstmin.R
    Untracked:  analysis/DO_morphine_gemma_firstmin.err
    Untracked:  analysis/DO_morphine_gemma_firstmin.out
    Untracked:  analysis/DO_morphine_gemma_firstmin.sh
    Untracked:  analysis/DO_morphine_gemma_withpermu.R
    Untracked:  analysis/DO_morphine_gemma_withpermu.err
    Untracked:  analysis/DO_morphine_gemma_withpermu.out
    Untracked:  analysis/DO_morphine_gemma_withpermu.sh
    Untracked:  analysis/DO_morphine_gemma_withpermu_firstbatch_min.depression.R
    Untracked:  analysis/DO_morphine_gemma_withpermu_firstbatch_min.depression.err
    Untracked:  analysis/DO_morphine_gemma_withpermu_firstbatch_min.depression.out
    Untracked:  analysis/DO_morphine_gemma_withpermu_firstbatch_min.depression.sh
    Untracked:  analysis/Lisa_Tarantino_Interval_needs_mvar_annotation.R
    Untracked:  analysis/Plot_DO_morphine1_SNP.R
    Untracked:  analysis/Plot_DO_morphine1_SNP.Rout
    Untracked:  analysis/Plot_DO_morphine1_SNP.sh
    Untracked:  analysis/Plot_DO_morphine1_SNP.stderr
    Untracked:  analysis/Plot_DO_morphine1_SNP.stdout
    Untracked:  analysis/Plot_DO_morphine1_second_set_SNP.R
    Untracked:  analysis/Plot_DO_morphine1_second_set_SNP.Rout
    Untracked:  analysis/Plot_DO_morphine1_second_set_SNP.sh
    Untracked:  analysis/Plot_DO_morphine1_second_set_SNP.stderr
    Untracked:  analysis/Plot_DO_morphine1_second_set_SNP.stdout
    Untracked:  analysis/download_GSE100356_sra.sh
    Untracked:  analysis/fentanyl_2cohorts_coxph.R
    Untracked:  analysis/fentanyl_2cohorts_coxph.err
    Untracked:  analysis/fentanyl_2cohorts_coxph.out
    Untracked:  analysis/fentanyl_2cohorts_coxph.sh
    Untracked:  analysis/fentanyl_scanone.cph.R
    Untracked:  analysis/fentanyl_scanone.cph.err
    Untracked:  analysis/fentanyl_scanone.cph.out
    Untracked:  analysis/fentanyl_scanone.cph.sh
    Untracked:  analysis/geo_rnaseq.R
    Untracked:  analysis/heritability_first_second_batch.R
    Untracked:  analysis/morphine_fentanyl_survival_time.R
    Untracked:  analysis/nf-rnaseq-b6.R
    Untracked:  analysis/plot_fentanyl_2cohorts_coxph.R
    Untracked:  analysis/scripts/
    Untracked:  analysis/tibmr.R
    Untracked:  analysis/timbr_demo.R
    Untracked:  analysis/workflow_proc.R
    Untracked:  analysis/workflow_proc.sh
    Untracked:  analysis/workflow_proc.stderr
    Untracked:  analysis/workflow_proc.stdout
    Untracked:  analysis/x.R
    Untracked:  analysis/~.sh
    Untracked:  code/PLINKtoCSVR.R
    Untracked:  code/cfw/
    Untracked:  code/gemma_plot.R
    Untracked:  code/process.sanger.snp.R
    Untracked:  code/reconst_utils.R
    Untracked:  data/69k_grid_pgmap.RData
    Untracked:  data/BOT_NTS_rnaseq_results/
    Untracked:  data/CC_SARS-1/
    Untracked:  data/CC_SARS-2/
    Untracked:  data/Composite Post Kevins Program Group 2 Fentanyl Prepped for Hao.xlsx
    Untracked:  data/DO_WBP_Data_JAB_to_map.xlsx
    Untracked:  data/Fentanyl_alternate_metrics.xlsx
    Untracked:  data/FinalReport/
    Untracked:  data/GM/
    Untracked:  data/GM_covar.csv
    Untracked:  data/GM_covar_07092018_morphine.csv
    Untracked:  data/Jackson_Lab_Bubier_MURGIGV01/
    Untracked:  data/Lisa Tarantino Interval needs mvar.xlsx
    Untracked:  data/Lisa_Tarantino_Interval_needs_mvar_annotation.csv
    Untracked:  data/MPD_Upload_October.csv
    Untracked:  data/MPD_Upload_October_updated_sex.csv
    Untracked:  data/Master Fentanyl DO Study Sheet.xlsx
    Untracked:  data/MasterMorphine Second Set DO w DOB2.xlsx
    Untracked:  data/MasterMorphine Second Set DO.xlsx
    Untracked:  data/Morphine CC DO mice Updated with Published inbred strains.csv
    Untracked:  data/Morphine_CC_DO_mice_Updated_with_Published_inbred_strains.csv
    Untracked:  data/cc_variants.sqlite
    Untracked:  data/combined/
    Untracked:  data/fentanyl/
    Untracked:  data/fentanyl2/
    Untracked:  data/fentanyl_1_2/
    Untracked:  data/fentanyl_2cohorts_coxph_data.Rdata
    Untracked:  data/first/
    Untracked:  data/founder_geno.csv
    Untracked:  data/genetic_map.csv
    Untracked:  data/gm.json
    Untracked:  data/gwas.sh
    Untracked:  data/marker_grid_0.02cM_plus.txt
    Untracked:  data/metabolomics_mouse_fecal/
    Untracked:  data/mouse_genes_mgi.sqlite
    Untracked:  data/pheno.csv
    Untracked:  data/pheno_qtl2.csv
    Untracked:  data/pheno_qtl2_07092018_morphine.csv
    Untracked:  data/pheno_qtl2_w_dob.csv
    Untracked:  data/physical_map.csv
    Untracked:  data/rnaseq/
    Untracked:  data/sample_geno.csv
    Untracked:  data/second/
    Untracked:  figure/
    Untracked:  glimma-plots/
    Untracked:  head.pdf
    Untracked:  output/DO_Fentanyl_Cohort2_MinDepressionRR_coefplot.pdf
    Untracked:  output/DO_Fentanyl_Cohort2_MinDepressionRR_coefplot_blup.pdf
    Untracked:  output/DO_Fentanyl_Cohort2_RRDepressionRateHrSLOPE_coefplot.pdf
    Untracked:  output/DO_Fentanyl_Cohort2_RRRecoveryRateHrSLOPE_coefplot.pdf
    Untracked:  output/DO_Fentanyl_Cohort2_RRRecoveryRateHrSLOPE_coefplot_blup.pdf
    Untracked:  output/DO_Fentanyl_Cohort2_StartofRecoveryHr_coefplot.pdf
    Untracked:  output/DO_Fentanyl_Cohort2_StartofRecoveryHr_coefplot_blup.pdf
    Untracked:  output/DO_Fentanyl_Cohort2_Statusbin_coefplot.pdf
    Untracked:  output/DO_Fentanyl_Cohort2_Statusbin_coefplot_blup.pdf
    Untracked:  output/DO_Fentanyl_Cohort2_SteadyStateDepressionDurationHrINTERVAL_coefplot.pdf
    Untracked:  output/DO_Fentanyl_Cohort2_TimetoDead(Hr)_coefplot.pdf
    Untracked:  output/DO_Fentanyl_Cohort2_TimetoDeadHr_coefplot.pdf
    Untracked:  output/DO_Fentanyl_Cohort2_TimetoDeadHr_coefplot_blup.pdf
    Untracked:  output/DO_Fentanyl_Cohort2_TimetoProjectedRecoveryHr_coefplot.pdf
    Untracked:  output/DO_Fentanyl_Cohort2_TimetoProjectedRecoveryHr_coefplot_blup.pdf
    Untracked:  output/DO_Fentanyl_Cohort2_TimetoSteadyRRDepression(Hr)_coefplot.pdf
    Untracked:  output/DO_Fentanyl_Cohort2_TimetoSteadyRRDepressionHr_coefplot.pdf
    Untracked:  output/DO_Fentanyl_Cohort2_TimetoSteadyRRDepressionHr_coefplot_blup.pdf
    Untracked:  output/DO_Fentanyl_Cohort2_TimetoThresholdRecoveryHr_coefplot.pdf
    Untracked:  output/DO_Fentanyl_Cohort2_TimetoThresholdRecoveryHr_coefplot_blup.pdf
    Untracked:  output/DO_morphine_Min.depression.png
    Untracked:  output/DO_morphine_Min.depression22222_violin_chr5.pdf
    Untracked:  output/DO_morphine_Min.depression_coefplot.pdf
    Untracked:  output/DO_morphine_Min.depression_coefplot_blup.pdf
    Untracked:  output/DO_morphine_Min.depression_coefplot_blup_chr5.png
    Untracked:  output/DO_morphine_Min.depression_coefplot_blup_chrX.png
    Untracked:  output/DO_morphine_Min.depression_coefplot_chr5.png
    Untracked:  output/DO_morphine_Min.depression_coefplot_chrX.png
    Untracked:  output/DO_morphine_Min.depression_peak_genes_chr5.png
    Untracked:  output/DO_morphine_Min.depression_violin_chr5.png
    Untracked:  output/DO_morphine_Recovery.Time.png
    Untracked:  output/DO_morphine_Recovery.Time_coefplot.pdf
    Untracked:  output/DO_morphine_Recovery.Time_coefplot_blup.pdf
    Untracked:  output/DO_morphine_Recovery.Time_coefplot_blup_chr11.png
    Untracked:  output/DO_morphine_Recovery.Time_coefplot_blup_chr4.png
    Untracked:  output/DO_morphine_Recovery.Time_coefplot_blup_chr7.png
    Untracked:  output/DO_morphine_Recovery.Time_coefplot_blup_chr9.png
    Untracked:  output/DO_morphine_Recovery.Time_coefplot_chr11.png
    Untracked:  output/DO_morphine_Recovery.Time_coefplot_chr4.png
    Untracked:  output/DO_morphine_Recovery.Time_coefplot_chr7.png
    Untracked:  output/DO_morphine_Recovery.Time_coefplot_chr9.png
    Untracked:  output/DO_morphine_Status_bin.png
    Untracked:  output/DO_morphine_Status_bin_coefplot.pdf
    Untracked:  output/DO_morphine_Status_bin_coefplot_blup.pdf
    Untracked:  output/DO_morphine_Survival.Time.png
    Untracked:  output/DO_morphine_Survival.Time_coefplot.pdf
    Untracked:  output/DO_morphine_Survival.Time_coefplot_blup.pdf
    Untracked:  output/DO_morphine_Survival.Time_coefplot_blup_chr17.png
    Untracked:  output/DO_morphine_Survival.Time_coefplot_blup_chr8.png
    Untracked:  output/DO_morphine_Survival.Time_coefplot_chr17.png
    Untracked:  output/DO_morphine_Survival.Time_coefplot_chr8.png
    Untracked:  output/DO_morphine_combine_batch_peak_violin.pdf
    Untracked:  output/DO_morphine_combined_69k_m2_Min.depression.png
    Untracked:  output/DO_morphine_combined_69k_m2_Min.depression_coefplot.pdf
    Untracked:  output/DO_morphine_combined_69k_m2_Min.depression_coefplot_blup.pdf
    Untracked:  output/DO_morphine_combined_69k_m2_Recovery.Time.png
    Untracked:  output/DO_morphine_combined_69k_m2_Recovery.Time_coefplot.pdf
    Untracked:  output/DO_morphine_combined_69k_m2_Recovery.Time_coefplot_blup.pdf
    Untracked:  output/DO_morphine_combined_69k_m2_Status_bin.png
    Untracked:  output/DO_morphine_combined_69k_m2_Status_bin_coefplot.pdf
    Untracked:  output/DO_morphine_combined_69k_m2_Status_bin_coefplot_blup.pdf
    Untracked:  output/DO_morphine_combined_69k_m2_Survival.Time.png
    Untracked:  output/DO_morphine_combined_69k_m2_Survival.Time_coefplot.pdf
    Untracked:  output/DO_morphine_combined_69k_m2_Survival.Time_coefplot_blup.pdf
    Untracked:  output/DO_morphine_coxph_24hrs_kinship_QTL.png
    Untracked:  output/DO_morphine_cphout.RData
    Untracked:  output/DO_morphine_first_batch_peak_in_second_batch_violin.pdf
    Untracked:  output/DO_morphine_first_batch_peak_in_second_batch_violin_sidebyside.pdf
    Untracked:  output/DO_morphine_first_batch_peak_violin.pdf
    Untracked:  output/DO_morphine_operm.cph.RData
    Untracked:  output/DO_morphine_second_batch_on_first_batch_peak_violin.pdf
    Untracked:  output/DO_morphine_second_batch_peak_ch6surv_on_first_batchviolin.pdf
    Untracked:  output/DO_morphine_second_batch_peak_ch6surv_on_first_batchviolin2.pdf
    Untracked:  output/DO_morphine_second_batch_peak_in_first_batch_violin.pdf
    Untracked:  output/DO_morphine_second_batch_peak_in_first_batch_violin_sidebyside.pdf
    Untracked:  output/DO_morphine_second_batch_peak_violin.pdf
    Untracked:  output/DO_morphine_secondbatch_69k_Min.depression.png
    Untracked:  output/DO_morphine_secondbatch_69k_Min.depression_coefplot.pdf
    Untracked:  output/DO_morphine_secondbatch_69k_Min.depression_coefplot_blup.pdf
    Untracked:  output/DO_morphine_secondbatch_69k_Recovery.Time.png
    Untracked:  output/DO_morphine_secondbatch_69k_Recovery.Time_coefplot.pdf
    Untracked:  output/DO_morphine_secondbatch_69k_Recovery.Time_coefplot_blup.pdf
    Untracked:  output/DO_morphine_secondbatch_69k_Status_bin.png
    Untracked:  output/DO_morphine_secondbatch_69k_Status_bin_coefplot.pdf
    Untracked:  output/DO_morphine_secondbatch_69k_Status_bin_coefplot_blup.pdf
    Untracked:  output/DO_morphine_secondbatch_69k_Survival.Time.png
    Untracked:  output/DO_morphine_secondbatch_69k_Survival.Time_coefplot.pdf
    Untracked:  output/DO_morphine_secondbatch_69k_Survival.Time_coefplot_blup.pdf
    Untracked:  output/DO_morphine_secondbatch_Min.depression.png
    Untracked:  output/DO_morphine_secondbatch_Min.depression_coefplot.pdf
    Untracked:  output/DO_morphine_secondbatch_Min.depression_coefplot_blup.pdf
    Untracked:  output/DO_morphine_secondbatch_Recovery.Time.png
    Untracked:  output/DO_morphine_secondbatch_Recovery.Time_coefplot.pdf
    Untracked:  output/DO_morphine_secondbatch_Recovery.Time_coefplot_blup.pdf
    Untracked:  output/DO_morphine_secondbatch_Status_bin.png
    Untracked:  output/DO_morphine_secondbatch_Status_bin_coefplot.pdf
    Untracked:  output/DO_morphine_secondbatch_Status_bin_coefplot_blup.pdf
    Untracked:  output/DO_morphine_secondbatch_Survival.Time.png
    Untracked:  output/DO_morphine_secondbatch_Survival.Time_coefplot.pdf
    Untracked:  output/DO_morphine_secondbatch_Survival.Time_coefplot_blup.pdf
    Untracked:  output/Fentanyl/
    Untracked:  output/KPNA3.pdf
    Untracked:  output/SSC4D.pdf
    Untracked:  output/TIMBR.test.RData
    Untracked:  output/apr_69kchr_combined.RData
    Untracked:  output/apr_69kchr_k_loco_combined.rds
    Untracked:  output/apr_69kchr_second_set.RData
    Untracked:  output/combine_batch_variation.RData
    Untracked:  output/combined_gm.RData
    Untracked:  output/combined_gm.k_loco.rds
    Untracked:  output/combined_gm.k_overall.rds
    Untracked:  output/combined_gm.probs_8state.rds
    Untracked:  output/coxph/
    Untracked:  output/do.morphine.RData
    Untracked:  output/do.morphine.k_loco.rds
    Untracked:  output/do.morphine.probs_36state.rds
    Untracked:  output/do.morphine.probs_8state.rds
    Untracked:  output/do_Fentanyl_combine2cohort_MeanDepressionBR_coefplot.pdf
    Untracked:  output/do_Fentanyl_combine2cohort_MeanDepressionBR_coefplot_blup.pdf
    Untracked:  output/do_Fentanyl_combine2cohort_MinDepressionBR_coefplot.pdf
    Untracked:  output/do_Fentanyl_combine2cohort_MinDepressionBR_coefplot_blup.pdf
    Untracked:  output/do_Fentanyl_combine2cohort_MinDepressionRR_coefplot.pdf
    Untracked:  output/do_Fentanyl_combine2cohort_MinDepressionRR_coefplot_blup.pdf
    Untracked:  output/do_Fentanyl_combine2cohort_RRRecoveryRateHr_coefplot.pdf
    Untracked:  output/do_Fentanyl_combine2cohort_RRRecoveryRateHr_coefplot_blup.pdf
    Untracked:  output/do_Fentanyl_combine2cohort_StartofRecoveryHr_coefplot.pdf
    Untracked:  output/do_Fentanyl_combine2cohort_StartofRecoveryHr_coefplot_blup.pdf
    Untracked:  output/do_Fentanyl_combine2cohort_Statusbin_coefplot.pdf
    Untracked:  output/do_Fentanyl_combine2cohort_Statusbin_coefplot_blup.pdf
    Untracked:  output/do_Fentanyl_combine2cohort_SteadyStateDepressionDurationHr_coefplot.pdf
    Untracked:  output/do_Fentanyl_combine2cohort_SteadyStateDepressionDurationHr_coefplot_blup.pdf
    Untracked:  output/do_Fentanyl_combine2cohort_SurvivalTime_coefplot.pdf
    Untracked:  output/do_Fentanyl_combine2cohort_SurvivalTime_coefplot_blup.pdf
    Untracked:  output/do_Fentanyl_combine2cohort_TimetoDeadHr_coefplot.pdf
    Untracked:  output/do_Fentanyl_combine2cohort_TimetoDeadHr_coefplot_blup.pdf
    Untracked:  output/do_Fentanyl_combine2cohort_TimetoMostlyDeadHr_coefplot.pdf
    Untracked:  output/do_Fentanyl_combine2cohort_TimetoMostlyDeadHr_coefplot_blup.pdf
    Untracked:  output/do_Fentanyl_combine2cohort_TimetoProjectedRecoveryHr_coefplot.pdf
    Untracked:  output/do_Fentanyl_combine2cohort_TimetoProjectedRecoveryHr_coefplot_blup.pdf
    Untracked:  output/do_Fentanyl_combine2cohort_TimetoRecoveryHr_coefplot.pdf
    Untracked:  output/do_Fentanyl_combine2cohort_TimetoRecoveryHr_coefplot_blup.pdf
    Untracked:  output/first_batch_variation.RData
    Untracked:  output/first_second_survival_peak_chr.xlsx
    Untracked:  output/hsq_1_first_batch_herit_qtl2.RData
    Untracked:  output/hsq_2_second_batch_herit_qtl2.RData
    Untracked:  output/morphine_fentanyl_survival_time.pdf
    Untracked:  output/old_temp/
    Untracked:  output/out_1_operm.RData
    Untracked:  output/pr_69kchr_combined.RData
    Untracked:  output/pr_69kchr_second_set.RData
    Untracked:  output/qtl.morphine.69k.out.combined.RData
    Untracked:  output/qtl.morphine.69k.out.combined_m2.RData
    Untracked:  output/qtl.morphine.69k.out.second_set.RData
    Untracked:  output/qtl.morphine.operm.RData
    Untracked:  output/qtl.morphine.out.RData
    Untracked:  output/qtl.morphine.out.combined_gm.RData
    Untracked:  output/qtl.morphine.out.combined_gm.female.RData
    Untracked:  output/qtl.morphine.out.combined_gm.male.RData
    Untracked:  output/qtl.morphine.out.combined_weight_DOB.RData
    Untracked:  output/qtl.morphine.out.combined_weight_age.RData
    Untracked:  output/qtl.morphine.out.female.RData
    Untracked:  output/qtl.morphine.out.male.RData
    Untracked:  output/qtl.morphine.out.second_set.RData
    Untracked:  output/qtl.morphine.out.second_set.female.RData
    Untracked:  output/qtl.morphine.out.second_set.male.RData
    Untracked:  output/qtl.morphine.out.second_set.weight_DOB.RData
    Untracked:  output/qtl.morphine.out.second_set.weight_age.RData
    Untracked:  output/qtl.morphine.out.weight_DOB.RData
    Untracked:  output/qtl.morphine.out.weight_age.RData
    Untracked:  output/qtl.morphine1.snpout.RData
    Untracked:  output/qtl.morphine2.snpout.RData
    Untracked:  output/sample_all_infor.csv
    Untracked:  output/sample_all_infor.txt
    Untracked:  output/second_batch_pheno.csv
    Untracked:  output/second_batch_variation.RData
    Untracked:  output/second_set_apr_69kchr_k_loco.rds
    Untracked:  output/second_set_gm.RData
    Untracked:  output/second_set_gm.k_loco.rds
    Untracked:  output/second_set_gm.probs_36state.rds
    Untracked:  output/second_set_gm.probs_8state.rds
    Untracked:  output/topSNP_chr5_mindepression.csv
    Untracked:  output/zoompeak_Min.depression_9.pdf
    Untracked:  output/zoompeak_Recovery.Time_16.pdf
    Untracked:  output/zoompeak_Status_bin_11.pdf
    Untracked:  output/zoompeak_Survival.Time_1.pdf
    Untracked:  output/zoompeak_fentanyl_Survival.Time_2.pdf
    Untracked:  sra-tools_v2.10.7.sif

Unstaged changes:
    Modified:   .gitignore
    Modified:   _workflowr.yml
    Deleted:    analysis/CC_SARS-2.Rmd
    Modified:   analysis/CC_SARS.Rmd
    Modified:   analysis/marker_violin.Rmd
    Modified:   output/CC_SARS_Chr16_QTL_interval.pdf
    Modified:   output/CC_SARS_Chr16_plotGeno.pdf
    Modified:   output/CC_SARS_Chr16_plotGeno.png
Note that any generated files, e.g. HTML, png, CSS, etc., are not included in this status report because it is ok for generated content to have uncommitted changes.
These are the previous versions of the repository in which changes were made to the R Markdown (analysis/DEG_analysis_BOT_M_vs_F.Rmd) and HTML (docs/DEG_analysis_BOT_M_vs_F.html) files. If you’ve configured a remote Git repository (see ?wflow_git_remote), click on the hyperlinks in the table below to view the files as they were in that past version.
| File | Version | Author | Date | Message |
|---|---|---|---|---|
| Rmd | 883216f | xhyuo | 2023-12-23 | Sex DEG in tissue |
workflow for rna-seq samples
library
library(stringr)
library(tidyverse)
Warning: replacing previous import 'lifecycle::last_warnings' by
'rlang::last_warnings' when loading 'hms'Warning: replacing previous import 'ellipsis::check_dots_unnamed' by
'rlang::check_dots_unnamed' when loading 'hms'Warning: replacing previous import 'ellipsis::check_dots_used' by
'rlang::check_dots_used' when loading 'hms'Warning: replacing previous import 'ellipsis::check_dots_empty' by
'rlang::check_dots_empty' when loading 'hms'Warning: package 'purrr' was built under R version 4.0.5library(edgeR)
library(limma)
library(Glimma)
library(gplots)
library(org.Mm.eg.db)
library(RColorBrewer)
library(DESeq2)
library(pheatmap)
library(ggrepel)
library(DT)
library(enrichR)
library(cowplot)
library(ggplotify)
library(data.table)
library(WGCNA)
library(grid)
set.seed(123)Collect RNA-seq emase out on gene level abundances.
#define the output directory
####merge all the genes.expected_read_counts####
all.dgerc.file <- list.files(path    = "/projects/compsci/vmp/USERS/heh/DO_Opioid/data/BOT_NTS_rnaseq_results/",
                             pattern = "\\.multiway.genes.expected_read_counts$",
                             full.names = FALSE,
                             all.files  = TRUE,
                             recursive  = TRUE)
all.dgerc.file <- all.dgerc.file[!str_detect(all.dgerc.file, "Undetermined")]
#get the sample id
sampleid <- gsub(".*/", "", all.dgerc.file)
sampleid <- str_extract(sampleid, "^[^_]+_[^_]+")

#BOT
BOT_sample <- map_dfr(
  c("/projects/activities/bubier/rnaseq/fastq/20230707_23-chesler-001/23-chesler-001_QCreport.csv","/projects/activities/bubier/rnaseq/fastq/20230710_23-chesler-001-run2/23-chesler-001-run2_QCreport.csv"), function(x){
    read_csv(x, skip = 16)
}) %>%
  dplyr::mutate(id = str_extract(Sample_Name, "^[^_]+_[^_]+"),
                .before = 1)

sheet <- readxl::read_excel("data/BOT_NTS_rnaseq_results/Bubier Brain Tracking Sheet.xlsx", sheet = 1, col_types = c("text", "text", "text", "numeric", "date", "logical", "text", "text", "text", "text", "text"), range = "A1:K393") %>%
  dplyr::select(1,2,3,5) %>%
  dplyr::distinct()

#data.frame
all.dgerc <- data.frame(file = all.dgerc.file, sampleid = sampleid) %>%
  dplyr::mutate(Tissue = case_when(
    (sampleid %in% BOT_sample$id) ~ "BOT",
    !(sampleid %in% BOT_sample$id) ~ "NTS"
  )) %>%
  dplyr::mutate(id = gsub("\\_GT23.*","",sampleid)) %>%
  dplyr::left_join(sheet, by = c("id" = "JCMS #"))

#39735
all.dgerc$Sex[all.dgerc$id == 39735] = c("F", "F")
all.dgerc$`Strain Name`[all.dgerc$id == 39735] = c("CC019/TauUncJ", "CC019/TauUncJ")
#40042
all.dgerc$Sex[all.dgerc$id == 40042] = c("M", "M")
all.dgerc$`Strain Name`[all.dgerc$id == 40042] = c("CC013/GeniUncJ", "CC013/GeniUncJ")
#40043
all.dgerc$Sex[all.dgerc$id == 40043] = "M"
all.dgerc$`Strain Name`[all.dgerc$id == 40043] = "CC013/GeniUncJ"

#merge
command.merge.dgerc <- paste0("bash -c 'paste ", paste(paste0("<(cut -f 10 /projects/compsci/vmp/USERS/heh/DO_Opioid/data/BOT_NTS_rnaseq_results/", all.dgerc.file,")"), collapse = " "), " > /projects/compsci/vmp/USERS/heh/DO_Opioid/data/BOT_NTS_rnaseq_results/merged.dgerc'")
system(command.merge.dgerc)

#read into R
merged.dgerc <- read.table("data/BOT_NTS_rnaseq_results/merged.dgerc", header = T, sep = "\t")
colnames(merged.dgerc) <- sampleid
expgene <- read.table(file = paste0("data/BOT_NTS_rnaseq_results/",as.character(all.dgerc$file[1])),header=TRUE,sep="\t")
rownames(merged.dgerc) <- expgene[,1]
write.csv(merged.dgerc,file="data/BOT_NTS_rnaseq_results/merged.dgerc.csv",quote=F,row.names=T)

save(merged.dgerc, file="data/BOT_NTS_rnaseq_results/merged.dgerc.RData")
save(all.dgerc, file="data/BOT_NTS_rnaseq_results/all.dgerc.RData")
count matrix and design matrix
load("data/BOT_NTS_rnaseq_results/all.dgerc.RData")
#RNA seq count data
countdata <- get(load("data/BOT_NTS_rnaseq_results/merged.dgerc.RData"))
#floor countdata
countdata <- floor(countdata)
#Removing genes that are lowly expressed as 0
countdata <- countdata[rowSums(countdata) != 0,]

#gene annotation
genes <- AnnotationDbi::select(org.Mm.eg.db, keys=rownames(countdata), columns=c("SYMBOL"),
                               keytype="ENSEMBL")
'select()' returned 1:many mapping between keys and columnsgenes <- genes[!duplicated(genes$ENSEMBL),]
genes <- genes[match(rownames(countdata), genes$ENSEMBL),]
#order
all.equal(rownames(countdata), genes$ENSEMBL)[1] TRUE#"35714_NTS_M" "38604_NTS_M" "38663_NTS_M" "40073_NTS_M"
#design matrix
design.matrix <- all.dgerc %>%
dplyr::select(-1) %>%
dplyr::rename(Strain = 5) %>%
dplyr::mutate(name = case_when(
id %in% c(35714, 38604, 38663, 40073) ~ paste(all.dgerc$sampleid, all.dgerc$Tissue, all.dgerc$Sex, sep = "_"),
TRUE ~ paste(all.dgerc$id, all.dgerc$Tissue, all.dgerc$Sex, sep = "_")
)) %>%
group_by(name) %>%
dplyr::mutate(name = make.unique(as.character(name))) %>%
dplyr::mutate(across(c(Sex, Strain, Tissue), as.factor))
rownames(design.matrix) = design.matrix$nameWarning: Setting row names on a tibble is deprecated.#strain_means
strain_means = read_csv("data/BOT_NTS_rnaseq_results/Project1046/Project1046_strainmeans.csv")
── Column specification ────────────────────────────────────────────────────────
cols(
  measnum = col_double(),
  varname = col_character(),
  strain = col_character(),
  strainid = col_double(),
  sex = col_character(),
  mean = col_double(),
  nmice = col_double(),
  sd = col_double(),
  sem = col_double(),
  cv = col_double(),
  minval = col_double(),
  maxval = col_double(),
  zscore = col_double()
)
strain_means_wide = strain_means %>%
dplyr::select(2,3,5,6) %>%
dplyr::filter(str_detect(varname, "Baseline|Time|Depression|Recovery")) %>%
tidyr::pivot_wider(names_from = varname, values_from = mean) %>%
dplyr::rename(Strain = strain, Sex = sex) %>%
dplyr::mutate(Sex = toupper(Sex))
#left_join
design.matrix.pheno = design.matrix %>%
left_join(strain_means_wide) %>%
dplyr::select(where(~ !all(is.na(.)))) %>%
as.data.frame()Joining, by = c("Sex", "Strain")rownames(design.matrix.pheno) = design.matrix.pheno$name
#design.matrix$group <- factor(paste0(design.matrix$Strain, design.matrix$Tissue))
#order
all.equal(design.matrix$sampleid, colnames(countdata))[1] TRUE#new colname of countdata
colnames(countdata) = rownames(design.matrix)
#subset to BOT
design.matrix <- design.matrix[design.matrix$Tissue == "BOT",]
rownames(design.matrix) = design.matrix$nameWarning: Setting row names on a tibble is deprecated.countdata <- countdata[, rownames(design.matrix)]
all.equal(colnames(countdata), rownames(design.matrix))[1] TRUE#To now construct the DESeqDataSet object from the matrix of counts and the sample information table, we use:
ddsMat <- DESeqDataSetFromMatrix(countData = countdata,
colData = design.matrix,
design = ~Strain + Sex)converting counts to integer mode Note: levels of factors in the design contain characters other than
letters, numbers, '_' and '.'. It is recommended (but not required) to use
only letters, numbers, and delimiters '_' or '.', as these are safe characters
for column names in R. [This is a message, not a warning or an error]QC process
#Pre-filtering the dataset
#perform a minimal pre-filtering to keep only rows that have at least 10 reads total.
keep <- rowSums(counts(ddsMat) >= 10) >= 2
ddsMat <- ddsMat[keep,]
ddsMat
class: DESeqDataSet
dim: 20902 192
metadata(1): version
assays(1): counts
rownames(20902): ENSMUSG00000000001 ENSMUSG00000000028 ...
ENSMUSG00001074846 ENSMUSG00002076083
rowData names(0):
colnames(192): 34303_BOT_F 34304_BOT_F ... 41414_BOT_F 41415_BOT_F
colData names(7): sampleid Tissue ... DOB namenrow(ddsMat)[1] 20902## [1] 27095
# DESeq2 creates a matrix when you use the counts() function
## First convert normalized_counts to a data frame and transfer the row names to a new column called "gene"
# this gives log2(n + 1)
ntd <- normTransform(ddsMat) Note: levels of factors in the design contain characters other than
letters, numbers, '_' and '.'. It is recommended (but not required) to use
only letters, numbers, and delimiters '_' or '.', as these are safe characters
for column names in R. [This is a message, not a warning or an error]normalized_counts <- assay(ntd) %>%
data.frame() %>%
rownames_to_column(var="gene") %>%
as_tibble()
#The variance stabilizing transformation and the rlog
#The rlog tends to work well on small datasets (n < 30), potentially outperforming the VST when there is a wide range of sequencing depth across samples (an order of magnitude difference).
#rld <- vst(ddsMat, blind = FALSE)
#save(rld, file = "data/BOT_NTS_rnaseq_results/BOT_rld.RData")
load("data/BOT_NTS_rnaseq_results/BOT_rld.RData")
#head(assay(rld), 3)
#sample distance
sampleDists <- dist(t(assay(rld)))
sampleDistMatrix <- as.matrix( sampleDists )
colors <- colorRampPalette( rev(brewer.pal(9, "Blues")) )(255)
#annotation
df <- as.data.frame(colData(ddsMat)[, c("Strain", "Sex")])
#heatmap on sample distance
pheatmap(sampleDistMatrix,
clustering_distance_rows = sampleDists,
clustering_distance_cols = sampleDists,
col = colors,
annotation_col = df,
show_rownames = F, show_colnames = F,
annotation_colors = list(
Sex = c("M" = "#0064C9",
"F" ="#B10DC9")),
border_color = NA)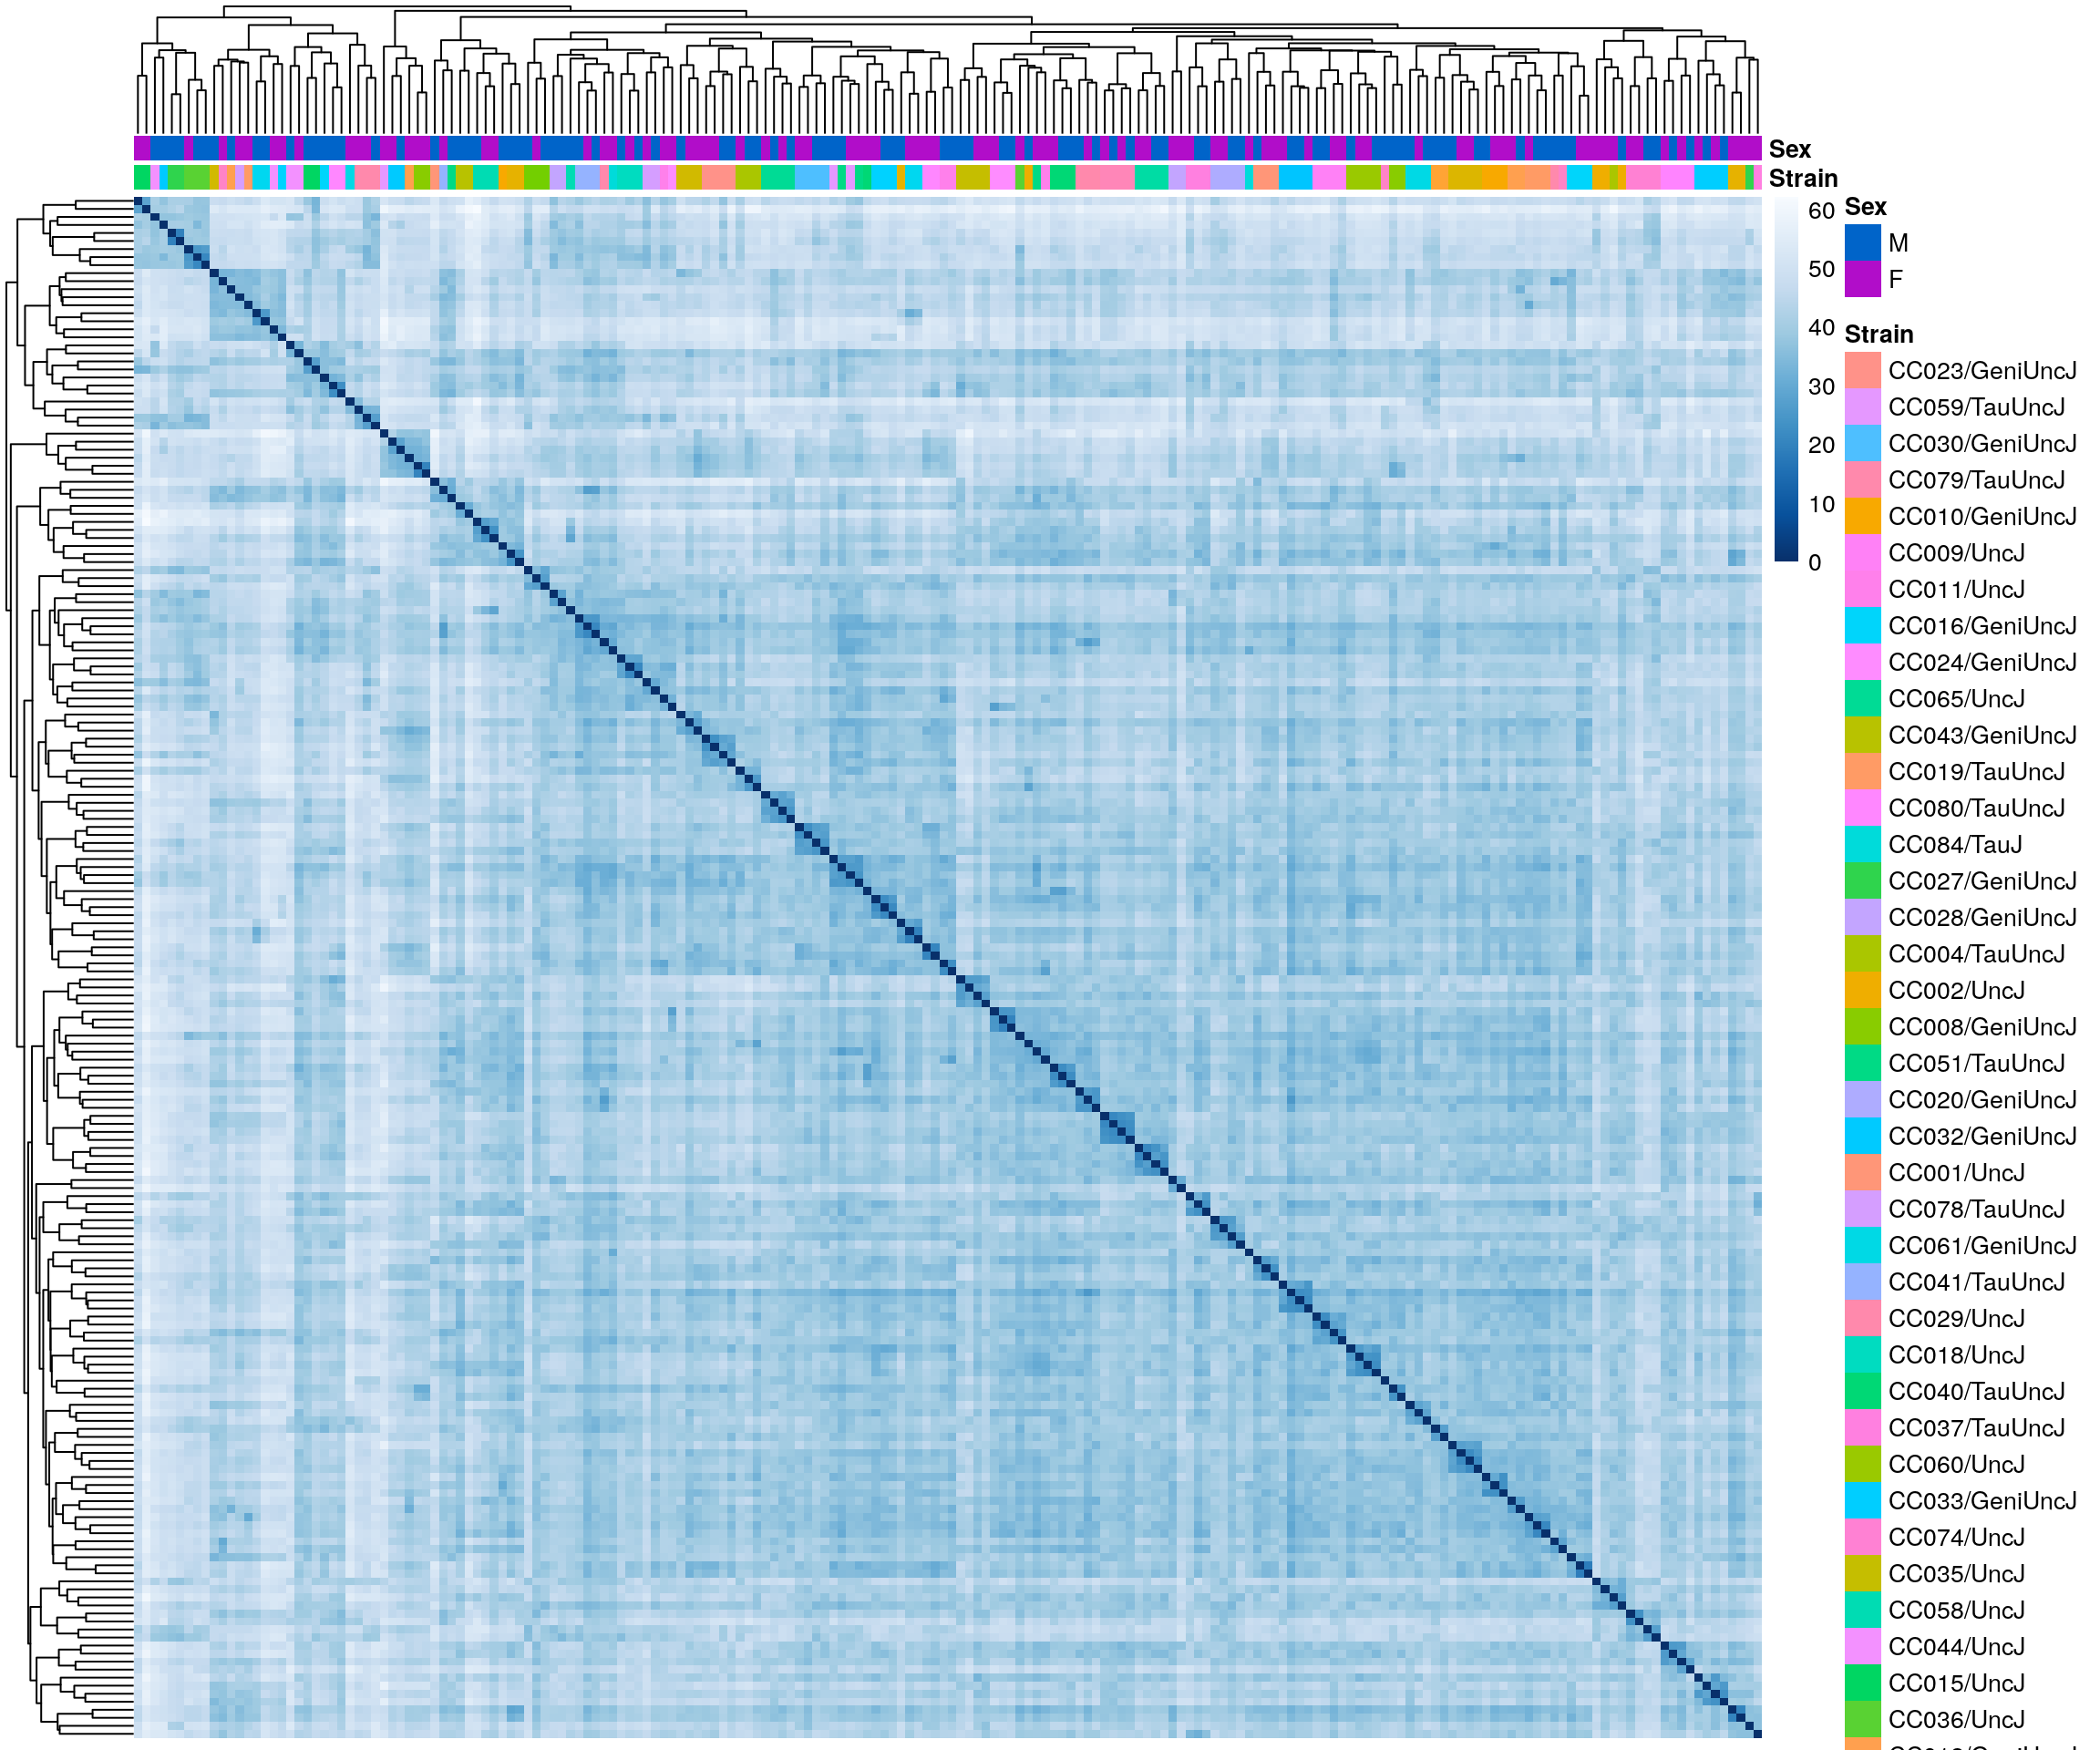
#heatmap on correlation matrix
rld_cor <- cor(assay(rld))
pheatmap(rld_cor,
         annotation_col  = df,
         clustering_distance_rows = "correlation",
         clustering_distance_cols = "correlation",
         show_rownames = F, show_colnames = F,
         annotation_colors = list(
                                  Sex = c("M" = "#0064C9",
                                          "F"    ="#B10DC9")),
         border_color = NA)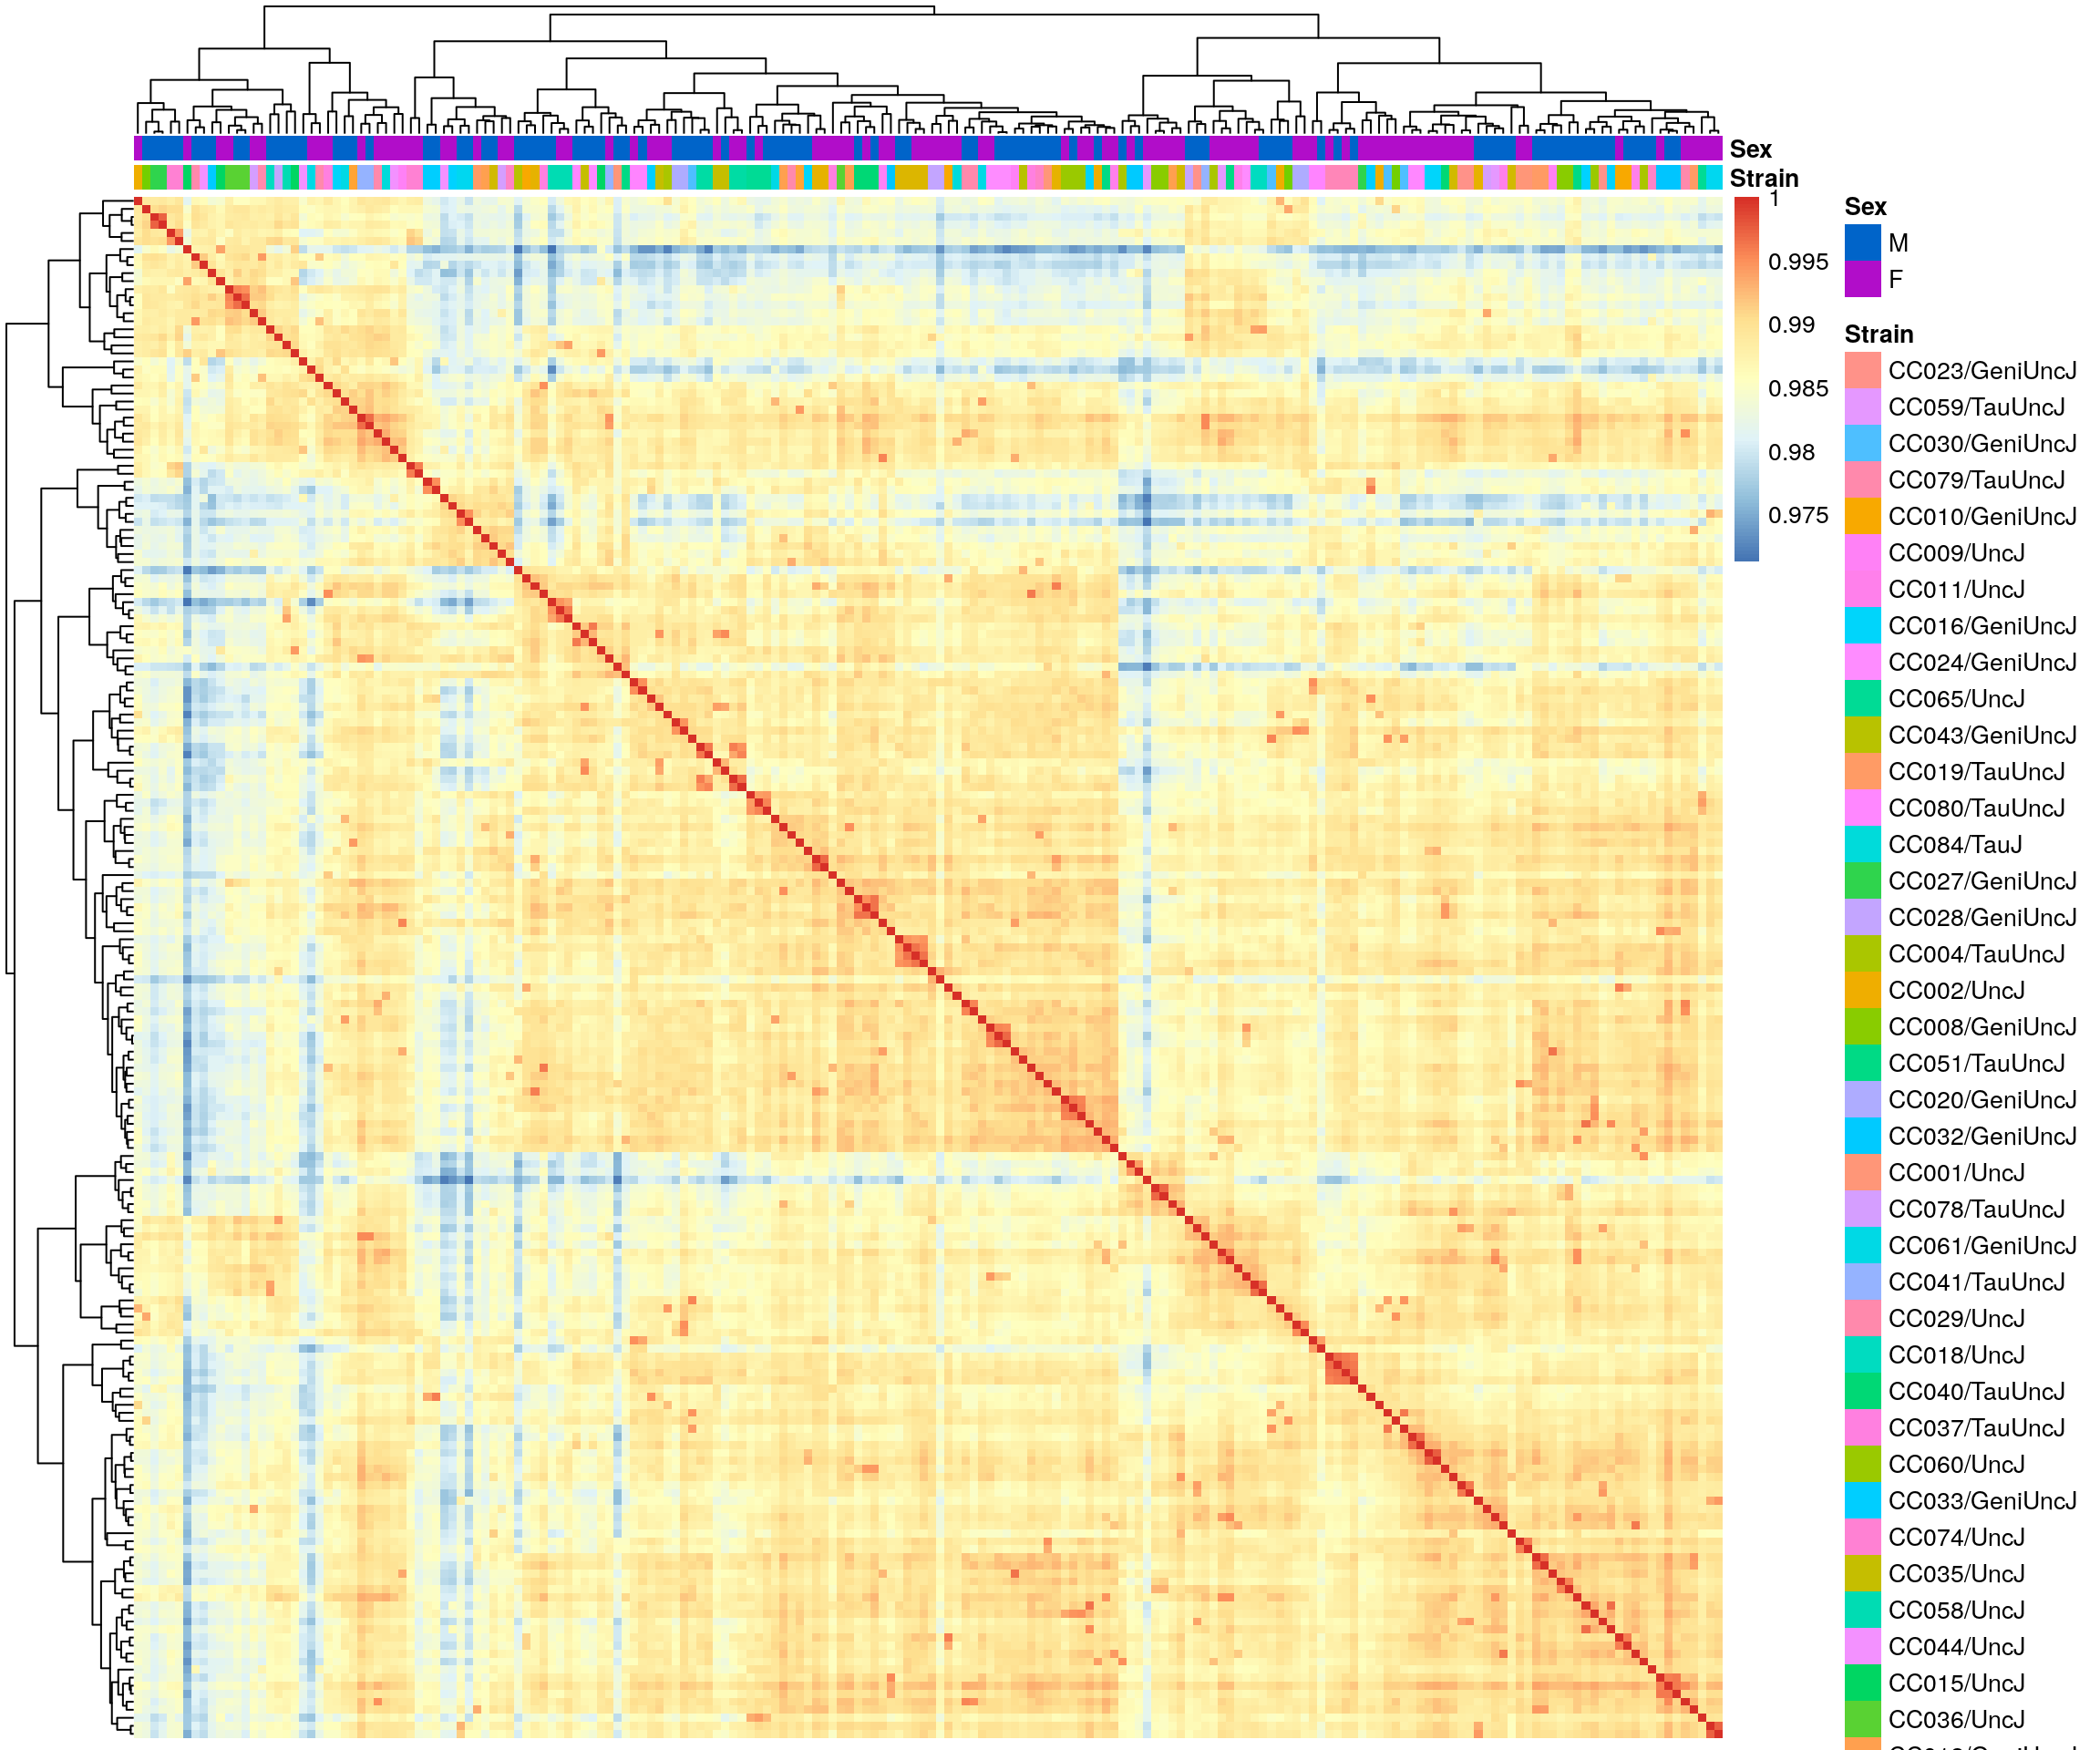
#PCA plot
#Another way to visualize sample-to-sample distances is a principal components analysis (PCA).
pca.plot <- plotPCA(rld, intgroup = c("Sex"), returnData = FALSE)
pca.plot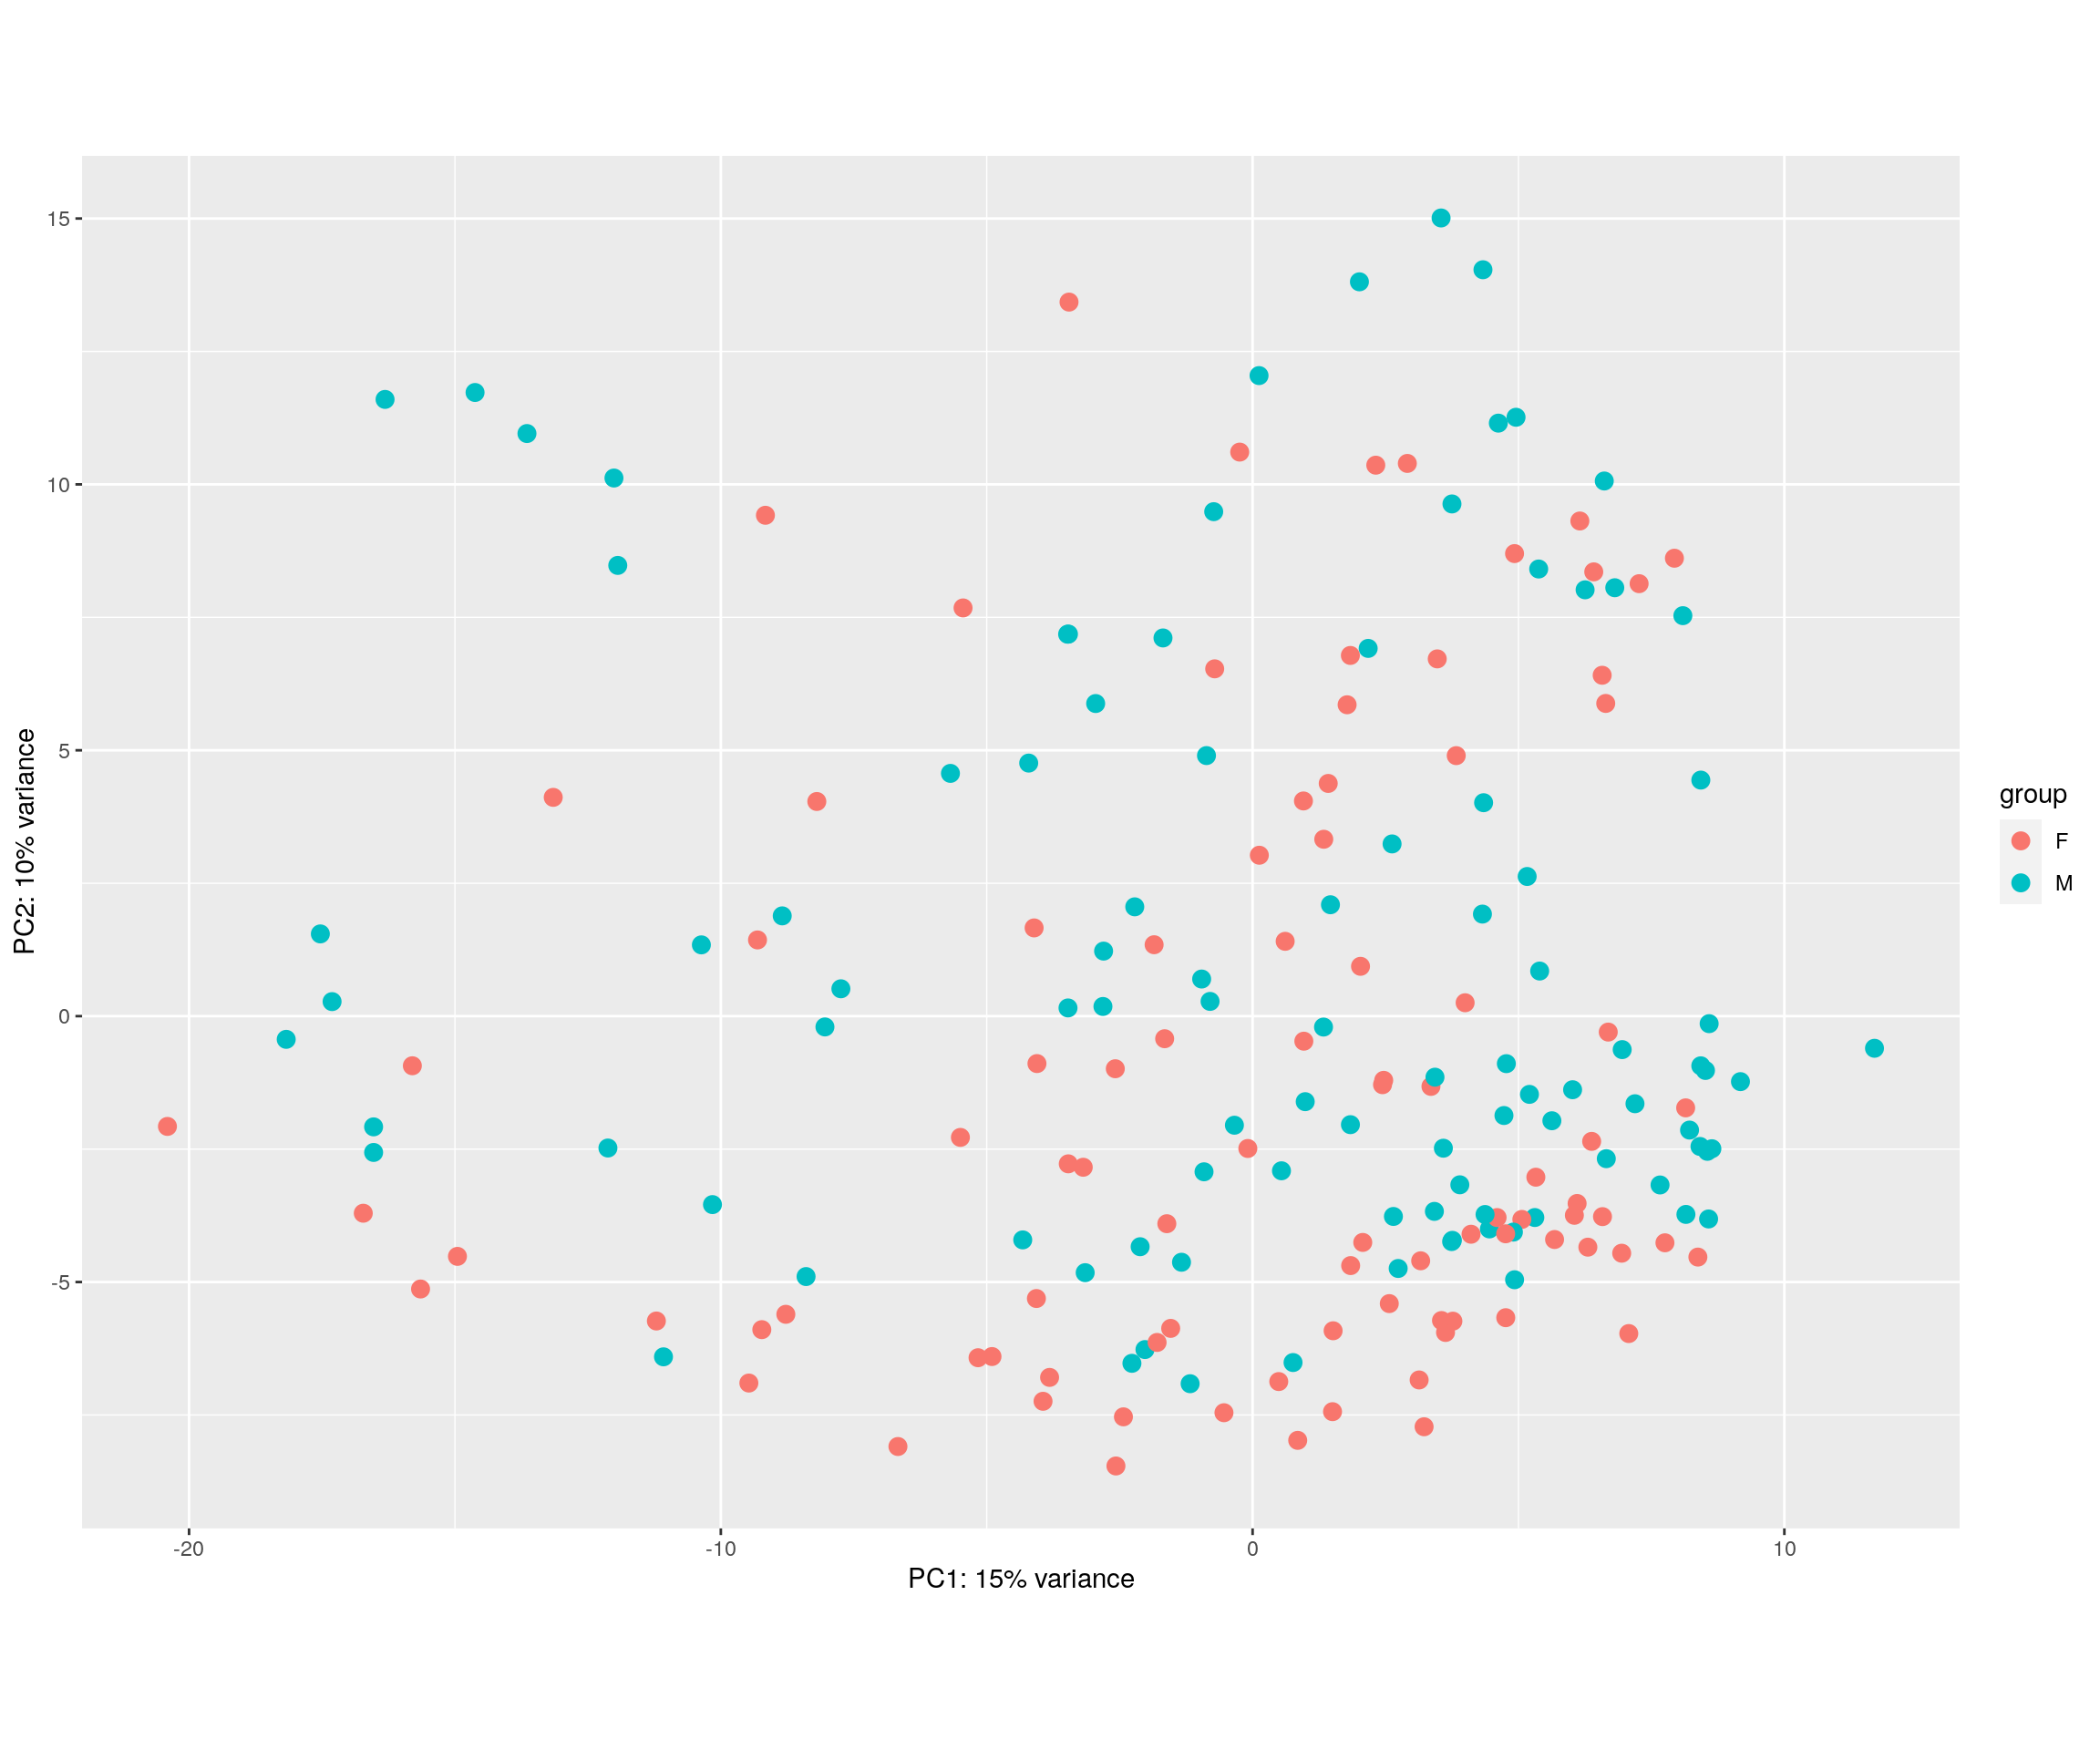
Differential expression analysis without interaction term
design(ddsMat)~Strain + Sex#Running the differential expression pipeline
#res <- DESeq(ddsMat)
#save(res, file = "data/BOT_NTS_rnaseq_results/BOT_res_no_interaction.RData")
load("data/BOT_NTS_rnaseq_results/BOT_res_no_interaction.RData")
resultsNames(res) [1] "Intercept"
[2] "Strain_CC059.TauUncJ_vs_CC023.GeniUncJ"
[3] "Strain_CC030.GeniUncJ_vs_CC023.GeniUncJ"
[4] "Strain_CC079.TauUncJ_vs_CC023.GeniUncJ"
[5] "Strain_CC010.GeniUncJ_vs_CC023.GeniUncJ"
[6] "Strain_CC009.UncJ_vs_CC023.GeniUncJ"
[7] "Strain_CC011.UncJ_vs_CC023.GeniUncJ"
[8] "Strain_CC016.GeniUncJ_vs_CC023.GeniUncJ"
[9] "Strain_CC024.GeniUncJ_vs_CC023.GeniUncJ"
[10] "Strain_CC065.UncJ_vs_CC023.GeniUncJ"
[11] "Strain_CC043.GeniUncJ_vs_CC023.GeniUncJ"
[12] "Strain_CC019.TauUncJ_vs_CC023.GeniUncJ"
[13] "Strain_CC080.TauUncJ_vs_CC023.GeniUncJ"
[14] "Strain_CC084.TauJ_vs_CC023.GeniUncJ"
[15] "Strain_CC027.GeniUncJ_vs_CC023.GeniUncJ"
[16] "Strain_CC028.GeniUncJ_vs_CC023.GeniUncJ"
[17] "Strain_CC004.TauUncJ_vs_CC023.GeniUncJ"
[18] "Strain_CC002.UncJ_vs_CC023.GeniUncJ"
[19] "Strain_CC008.GeniUncJ_vs_CC023.GeniUncJ"
[20] "Strain_CC051.TauUncJ_vs_CC023.GeniUncJ"
[21] "Strain_CC020.GeniUncJ_vs_CC023.GeniUncJ"
[22] "Strain_CC032.GeniUncJ_vs_CC023.GeniUncJ"
[23] "Strain_CC001.UncJ_vs_CC023.GeniUncJ"
[24] "Strain_CC078.TauUncJ_vs_CC023.GeniUncJ"
[25] "Strain_CC061.GeniUncJ_vs_CC023.GeniUncJ"
[26] "Strain_CC041.TauUncJ_vs_CC023.GeniUncJ"
[27] "Strain_CC029.UncJ_vs_CC023.GeniUncJ"
[28] "Strain_CC018.UncJ_vs_CC023.GeniUncJ"
[29] "Strain_CC040.TauUncJ_vs_CC023.GeniUncJ"
[30] "Strain_CC037.TauUncJ_vs_CC023.GeniUncJ"
[31] "Strain_CC060.UncJ_vs_CC023.GeniUncJ"
[32] "Strain_CC033.GeniUncJ_vs_CC023.GeniUncJ"
[33] "Strain_CC074.UncJ_vs_CC023.GeniUncJ"
[34] "Strain_CC035.UncJ_vs_CC023.GeniUncJ"
[35] "Strain_CC058.UncJ_vs_CC023.GeniUncJ"
[36] "Strain_CC044.UncJ_vs_CC023.GeniUncJ"
[37] "Strain_CC015.UncJ_vs_CC023.GeniUncJ"
[38] "Strain_CC036.UncJ_vs_CC023.GeniUncJ"
[39] "Strain_CC012.GeniUncJ_vs_CC023.GeniUncJ"
[40] "Strain_CC013.GeniUncJ_vs_CC023.GeniUncJ"
[41] "Strain_CC026.GeniUncJ_vs_CC023.GeniUncJ"
[42] "Strain_CC083.UncJ_vs_CC023.GeniUncJ"
[43] "Strain_CC003.UncJ_vs_CC023.GeniUncJ"
[44] "Strain_CC017.UncJ_vs_CC023.GeniUncJ"
[45] "Strain_CC025.GeniUncJ_vs_CC023.GeniUncJ"
[46] "Strain_CC057.UncJ_vs_CC023.GeniUncJ"
[47] "Strain_CC005.TauUncJ_vs_CC023.GeniUncJ"
[48] "Strain_CC007.UncJ_vs_CC023.GeniUncJ"
[49] "Strain_CC068.TauUncJ_vs_CC023.GeniUncJ"
[50] "Strain_CC045.GeniUncJ_vs_CC023.GeniUncJ"
[51] "Strain_CC075.UncJ_vs_CC023.GeniUncJ"
[52] "Sex_M_vs_F" #comparison for Sex------
#Building the results table
res.tab.sex <- results(res, name = "Sex_M_vs_F", alpha = 0.05)
res.tab.sexlog2 fold change (MLE): Sex M vs F
Wald test p-value: Sex M vs F
DataFrame with 20902 rows and 6 columns
baseMean log2FoldChange lfcSE stat pvalue
<numeric> <numeric> <numeric> <numeric> <numeric>
ENSMUSG00000000001 1088.94130 0.0244583 0.0155766 1.5701897 0.1163710
ENSMUSG00000000028 42.74364 0.0397497 0.0479228 0.8294529 0.4068482
ENSMUSG00000000031 14.23861 -0.1374083 0.1822485 -0.7539613 0.4508725
ENSMUSG00000000037 32.58990 -0.1550667 0.0622500 -2.4910330 0.0127372
ENSMUSG00000000049 8.21025 -0.0100980 0.1249325 -0.0808273 0.9355793
... ... ... ... ... ...
ENSMUSG00000118669 794.60658 -0.0056311 0.0267657 -0.210385 0.83336737
ENSMUSG00000118670 3.29748 -0.6555320 0.2151595 -3.046726 0.00231349
ENSMUSG00000118671 26.83773 0.0528613 0.0886917 0.596012 0.55116740
ENSMUSG00001074846 1.04726 0.1174986 0.4242783 0.276938 0.78182809
ENSMUSG00002076083 924.61956 -0.0093365 0.0195340 -0.477961 0.63267831
padj
<numeric>
ENSMUSG00000000001 0.683287
ENSMUSG00000000028 0.889938
ENSMUSG00000000031 0.903336
ENSMUSG00000000037 0.355327
ENSMUSG00000000049 0.994286
... ...
ENSMUSG00000118669 0.981949
ENSMUSG00000118670 0.172636
ENSMUSG00000118671 0.928854
ENSMUSG00001074846 0.974758
ENSMUSG00002076083 0.948511summary(res.tab.sex)
out of 20902 with nonzero total read count
adjusted p-value < 0.05
LFC > 0 (up)       : 37, 0.18%
LFC < 0 (down)     : 60, 0.29%
outliers [1]       : 8, 0.038%
low counts [2]     : 0, 0%
(mean count < 0)
[1] see 'cooksCutoff' argument of ?results
[2] see 'independentFiltering' argument of ?results
table(res.tab.sex$padj < 0.05)
FALSE  TRUE
20797    97
#We subset the results table to these genes and then sort it by the log2 fold change estimate to get the significant genes with the strongest down-regulation:
resSig.sex <- subset(res.tab.sex, padj < 0.05)
head(resSig.sex[order(resSig.sex$log2FoldChange), ])log2 fold change (MLE): Sex M vs F
Wald test p-value: Sex M vs F
DataFrame with 6 rows and 6 columns
baseMean log2FoldChange lfcSE stat pvalue
<numeric> <numeric> <numeric> <numeric> <numeric>
ENSMUSG00000086503 10321.57885 -10.420687 0.227811 -45.74267 0.00000e+00
ENSMUSG00000021342 11.51764 -6.997740 0.728407 -9.60691 7.47601e-22
ENSMUSG00000085715 61.87573 -4.958377 0.167115 -29.67053 1.84357e-193
ENSMUSG00000048173 5.13356 -2.853890 0.553809 -5.15320 2.56079e-07
ENSMUSG00000057816 5.60881 -0.793620 0.156646 -5.06633 4.05567e-07
ENSMUSG00000100586 21.84666 -0.616218 0.144013 -4.27891 1.87808e-05
padj
<numeric>
ENSMUSG00000086503 0.00000e+00
ENSMUSG00000021342 9.18845e-19
ENSMUSG00000085715 5.50279e-190
ENSMUSG00000048173 1.78351e-04
ENSMUSG00000057816 2.64810e-04
ENSMUSG00000100586 9.52119e-03# with the strongest up-regulation:
head(resSig.sex[order(resSig.sex$log2FoldChange, decreasing = TRUE), ])log2 fold change (MLE): Sex M vs F
Wald test p-value: Sex M vs F
DataFrame with 6 rows and 6 columns
baseMean log2FoldChange lfcSE stat pvalue
<numeric> <numeric> <numeric> <numeric> <numeric>
ENSMUSG00000069044 6.73998 19.59516 2.965183 6.60841 3.88457e-11
ENSMUSG00000069045 1135.46965 14.99858 0.320150 46.84860 0.00000e+00
ENSMUSG00000069049 438.83830 14.39405 0.313528 45.90998 0.00000e+00
ENSMUSG00000068457 533.00137 12.27880 0.292741 41.94418 0.00000e+00
ENSMUSG00000056673 614.17053 10.66517 0.257243 41.45953 0.00000e+00
ENSMUSG00000099876 17.12456 7.17283 0.255241 28.10214 9.22449e-174
padj
<numeric>
ENSMUSG00000069044 3.68929e-08
ENSMUSG00000069045 0.00000e+00
ENSMUSG00000069049 0.00000e+00
ENSMUSG00000068457 0.00000e+00
ENSMUSG00000056673 0.00000e+00
ENSMUSG00000099876 2.40921e-170Visualization
#Visualization for Sex result------
#Volcano plot
## Obtain logical vector regarding whether padj values are less than 0.05
threshold_OE <- (res.tab.sex$padj < 0.05 & abs(res.tab.sex$log2FoldChange) >= 1)
## Determine the number of TRUE values
length(which(threshold_OE))
[1] 11## Add logical vector as a column (threshold) to the res.tab.sex
res.tab.sex$threshold <- threshold_OE
## Sort by ordered padj
res.tab.sex_ordered <- res.tab.sex %>%
data.frame() %>%
rownames_to_column(var="ENSEMBL") %>%
arrange(padj) %>%
mutate(genelabels = "") %>%
as_tibble() %>%
left_join(genes)Joining, by = "ENSEMBL"## Create a column to indicate which genes to label
res.tab.sex_ordered$genelabels[1:10] <- res.tab.sex_ordered$SYMBOL[1:10]
#display res.tab.sex_ordered
DT::datatable(res.tab.sex_ordered[res.tab.sex_ordered$padj < 0.05,],
filter = list(position = 'top', clear = FALSE),
extensions = 'Buttons',
options = list(dom = 'Blfrtip',
buttons = c('csv', 'excel'),
lengthMenu = list(c(10,25,50,-1),
c(10,25,50,"All")),
pageLength = 40,
scrollY = "300px",
scrollX = "40px"),
caption = htmltools::tags$caption(style = 'caption-side: top; text-align: left; color:black; font-size:200% ;','DEG analysis sex results (fdr < 0.05)'))#Volcano plot
res.tab.sex_ordered <- res.tab.sex_ordered %>%
dplyr::mutate(padj = if_else(padj == 0, 7.571541e-245, padj))
volcano.plot.sex <- ggplot(res.tab.sex_ordered) +
geom_point(aes(x = log2FoldChange, y = -log10(padj), colour = threshold)) +
scale_color_manual(values=c("blue", "red")) +
geom_text_repel(aes(x = log2FoldChange, y = -log10(padj),
label = genelabels,
size = 1.5)) +
ggtitle("DEG for sex Male vs Female") +
xlab("log2 fold change") +
ylab("-log10 adjusted p-value") +
theme(legend.position = "none",
plot.title = element_text(size = rel(1.5), hjust = 0.5),
axis.title = element_text(size = rel(1.25)))
volcano.plot.sexWarning: Removed 8 rows containing missing values (geom_point).Warning: Removed 9 rows containing missing values (geom_text_repel).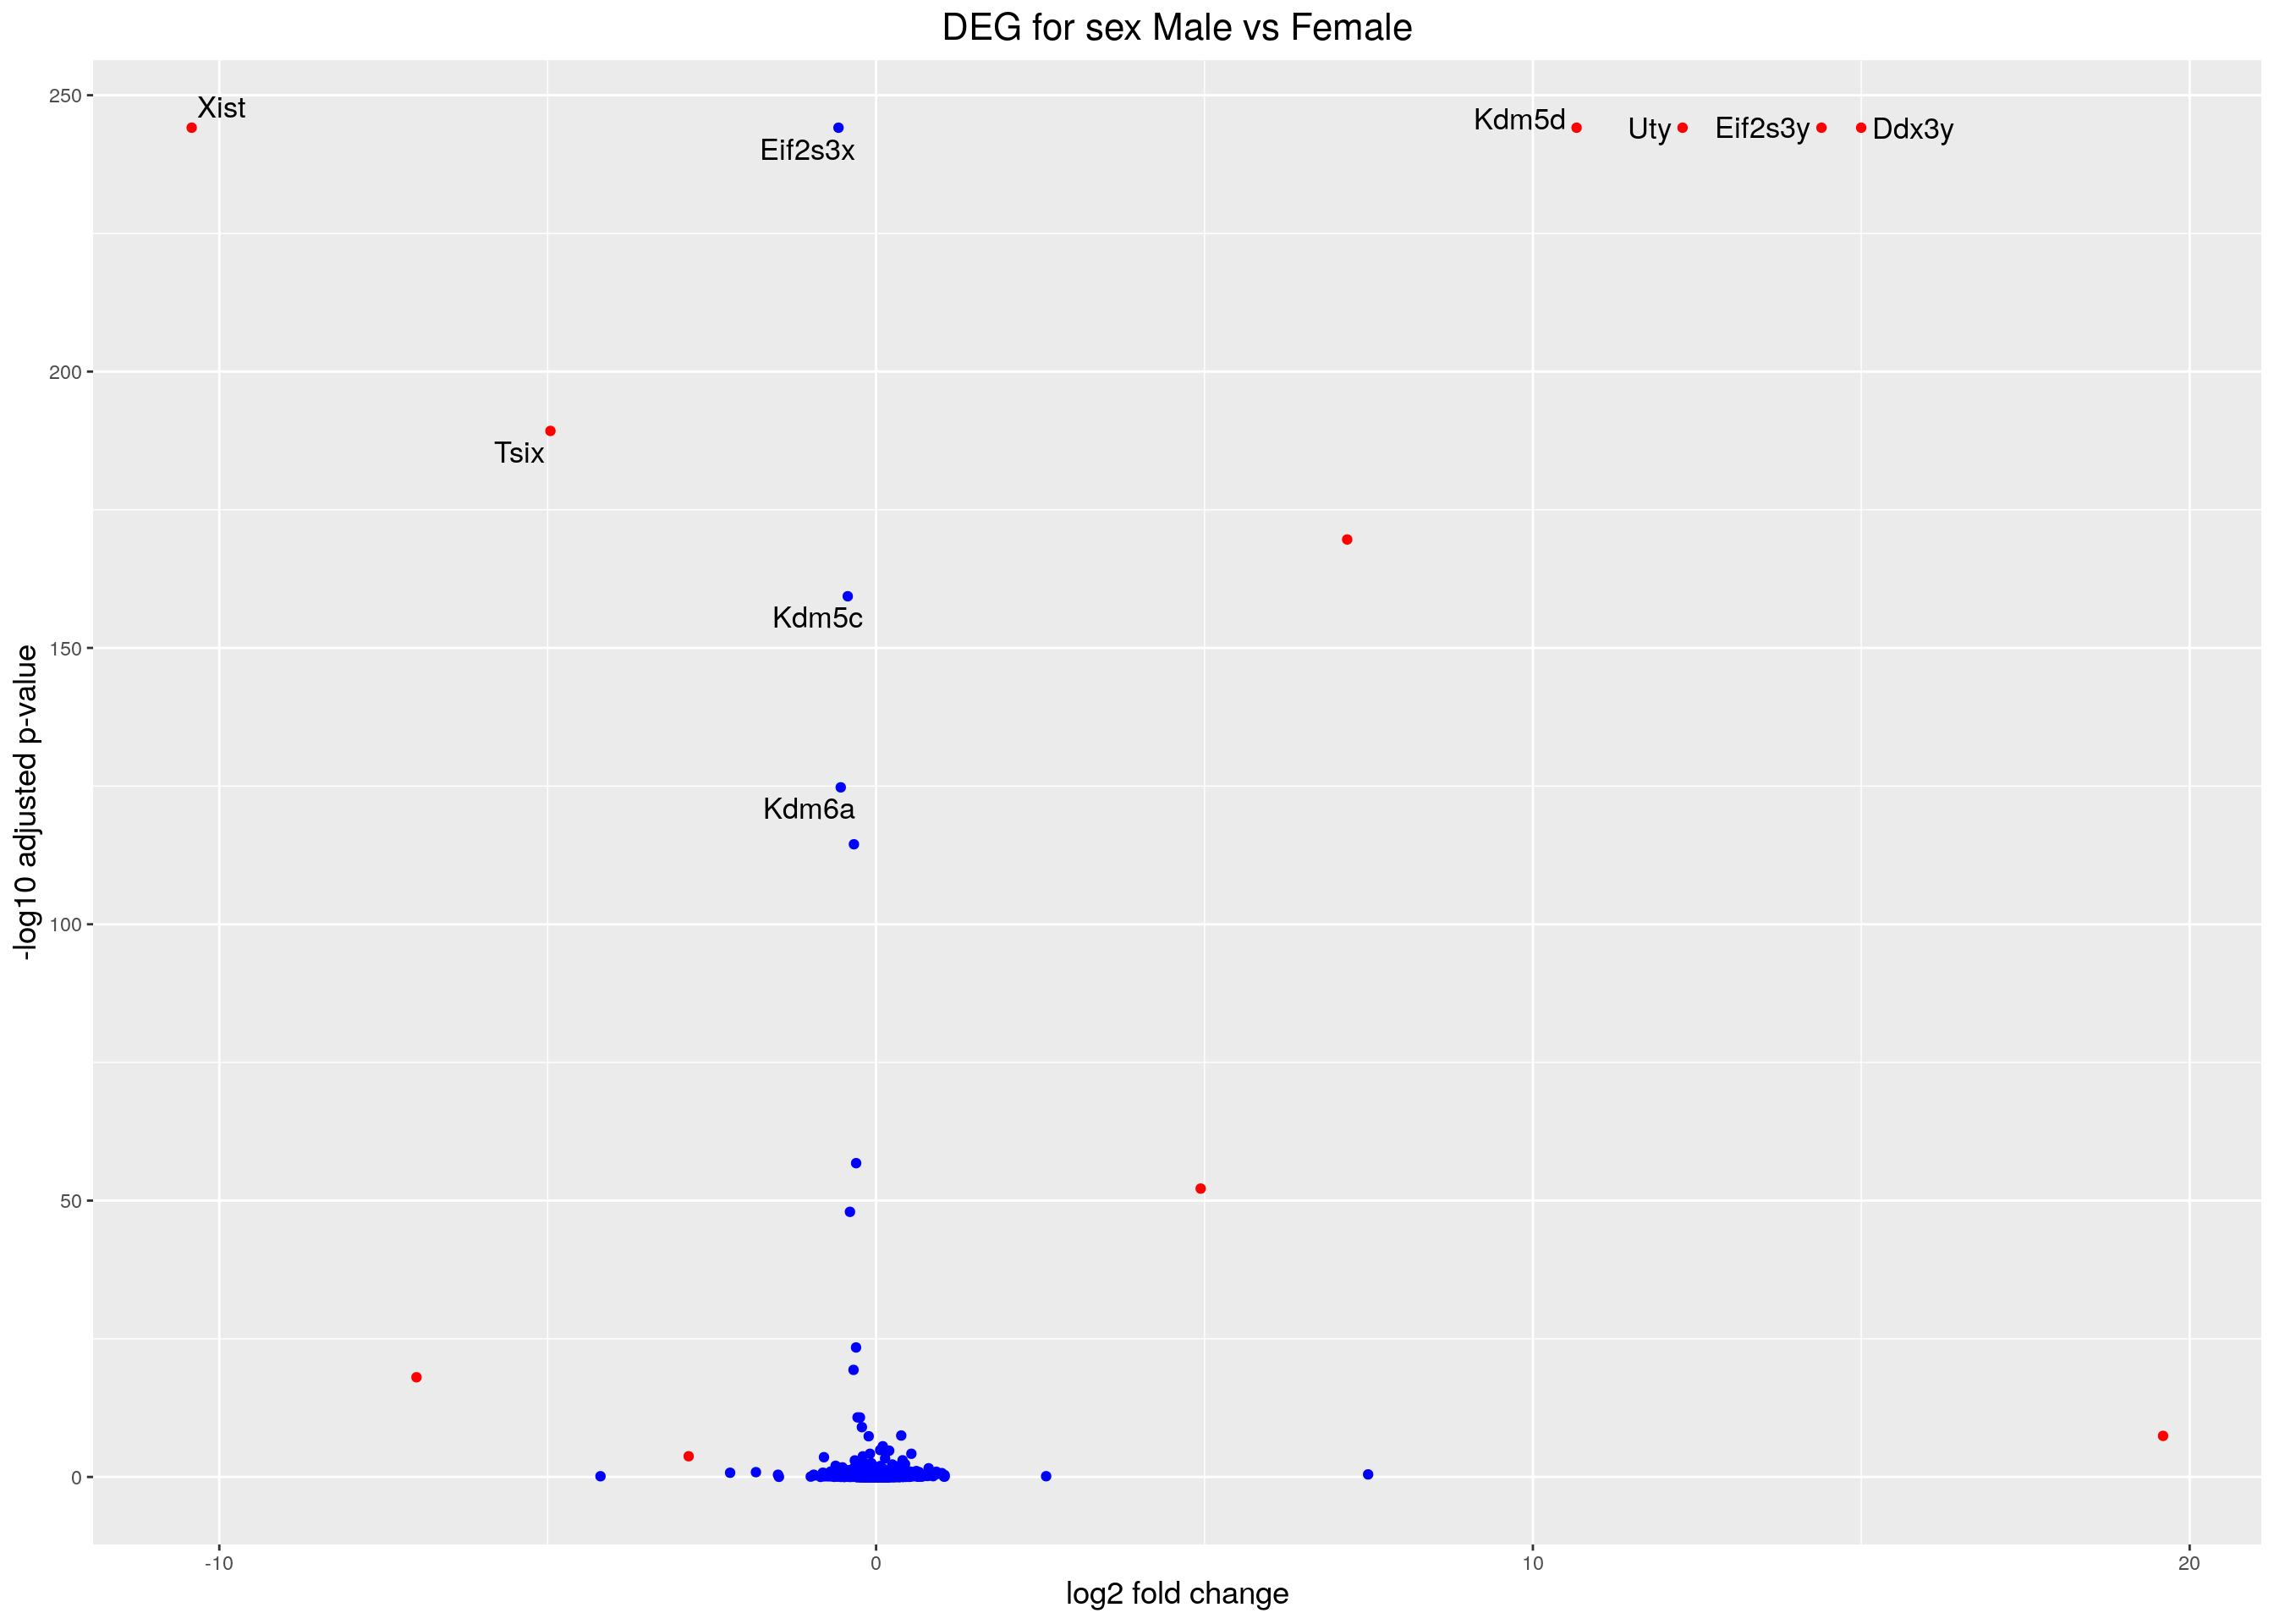
#heatmap
# Extract normalized expression for significant genes fdr < 0.05 & abs(log2FoldChange) >= 1)
normalized_counts_sig.sex <- normalized_counts %>%
  filter(gene %in% rownames(subset(resSig.sex, padj < 0.05 & abs(log2FoldChange) >= 1)))

### Set a color palette
heat_colors <- brewer.pal(6, "YlOrRd")
#annotation
df <- as.data.frame(colData(ddsMat)[,c("Strain", "Sex")])
### Run pheatmap using the metadata data frame for the annotation
dat = as.matrix(normalized_counts_sig.sex[,-1])
colnames(dat) = rownames(df)
pheatmap(dat,
         color = heat_colors,
         cluster_rows = T,
         show_rownames = F,
         annotation_col  = df,
         annotation_colors = list(
                                  Sex = c("M" = "#0064C9",
                                          "F"    ="#B10DC9")),
         border_color = NA,
         fontsize = 10,
         scale = "row",
         fontsize_row = 10,
         height = 20,
         main = "Heatmap of the top DEGs in Sex Male vs Femal(fdr < 0.05 & abs(log2FoldChange) >= 1)")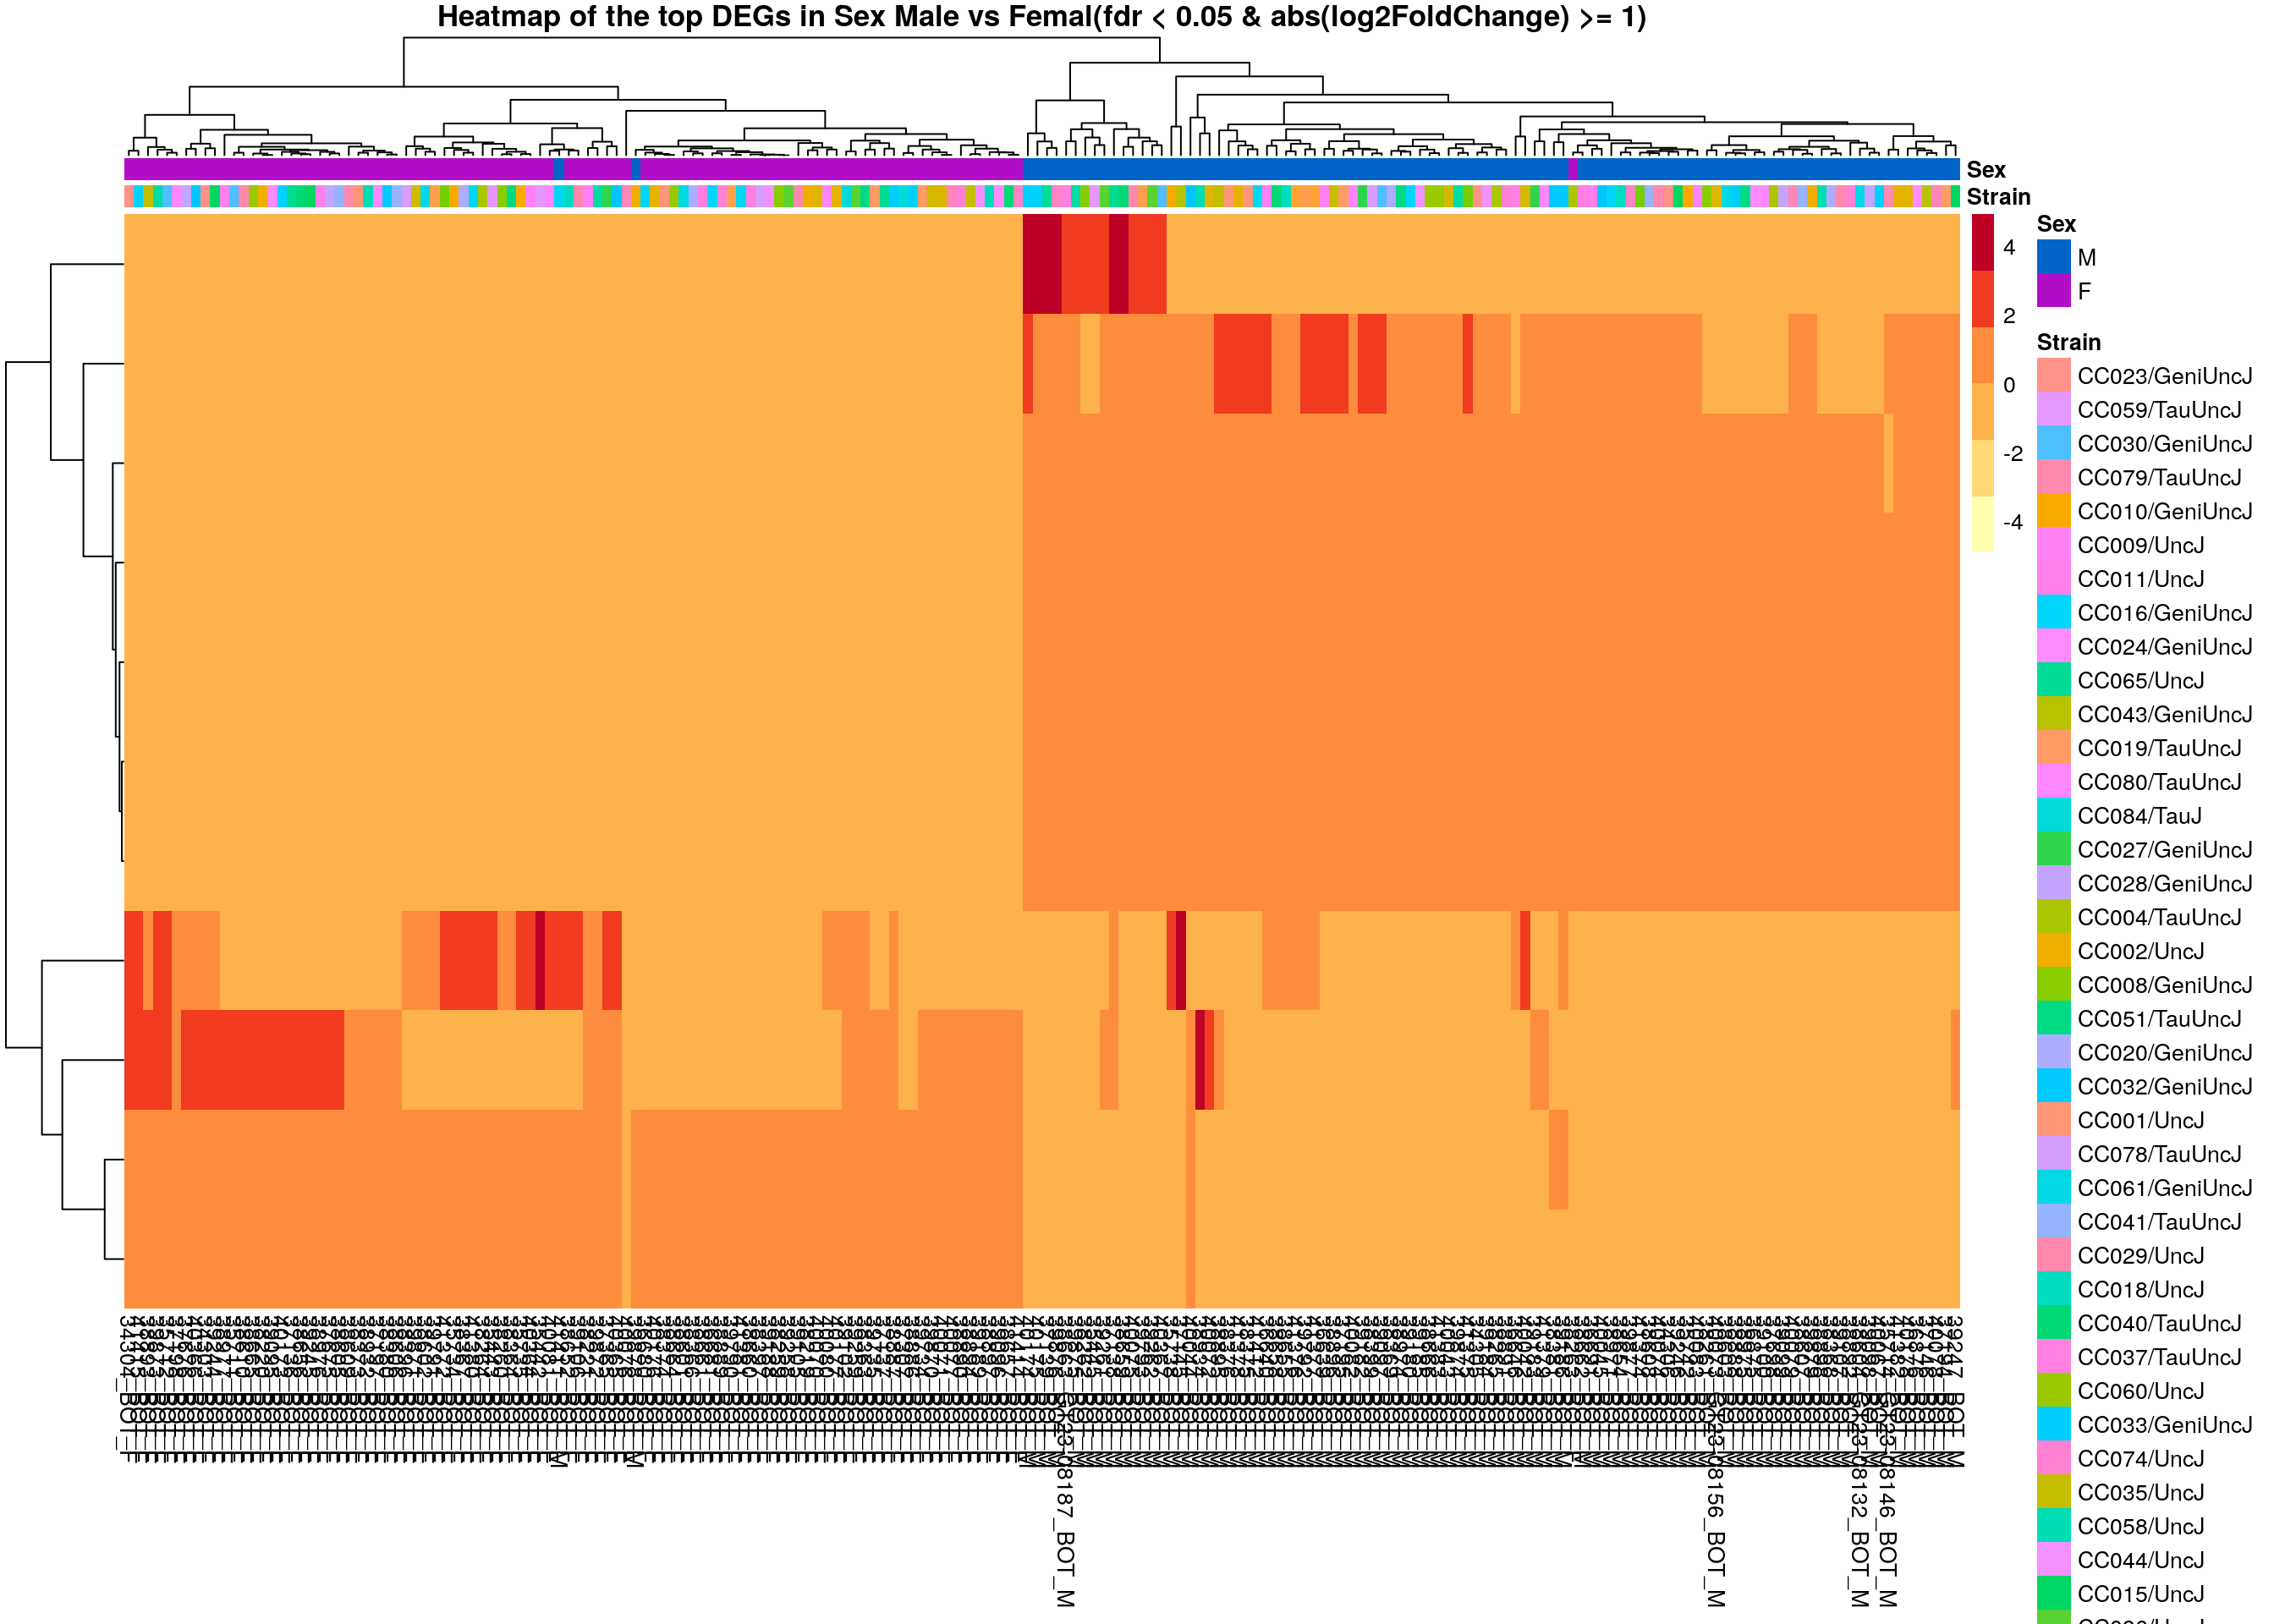
Enrichment
#enrichment analysis
dbs <- c("WikiPathways_2019_Mouse",
         "GO_Biological_Process_2021",
         "GO_Cellular_Component_2021",
         "GO_Molecular_Function_2021",
         "KEGG_2019_Mouse",
         "Mouse_Gene_Atlas",
         "MGI_Mammalian_Phenotype_Level_4_2019")

#sex results------
resSig.sex.tab <- resSig.sex %>%
  data.frame() %>%
  rownames_to_column(var="ENSEMBL") %>%
  as_tibble() %>%
  left_join(genes)
Joining, by = "ENSEMBL"#up-regulated sex genes---------------------------
up.genes <- resSig.sex.tab %>%
filter(log2FoldChange > 0) %>%
pull(SYMBOL)
#up-regulated genes enrichment
up.genes.enriched <- enrichr(as.character(na.omit(up.genes)), dbs)Uploading data to Enrichr... Done.
Querying WikiPathways_2019_Mouse... Done.
Querying GO_Biological_Process_2021... Done.
Querying GO_Cellular_Component_2021... Done.
Querying GO_Molecular_Function_2021... Done.
Querying KEGG_2019_Mouse... Done.
Querying Mouse_Gene_Atlas... Done.
Querying MGI_Mammalian_Phenotype_Level_4_2019... Done.
Parsing results... Done.for (j in 1:length(up.genes.enriched)){
up.genes.enriched[[j]] <- cbind(data.frame(Library = names(up.genes.enriched)[j]),up.genes.enriched[[j]])
}
up.genes.enriched <- do.call(rbind.data.frame, up.genes.enriched) %>%
filter(Adjusted.P.value <= 0.05) %>%
mutate(logpvalue = -log10(P.value)) %>%
arrange(desc(logpvalue))
#display up.genes.enriched
DT::datatable(up.genes.enriched,filter = list(position = 'top', clear = FALSE),
extensions = 'Buttons',
options = list(dom = 'Blfrtip',
buttons = c('csv', 'excel'),
lengthMenu = list(c(10,25,50,-1),
c(10,25,50,"All")),
pageLength = 40,
scrollY = "300px",
scrollX = "40px")
)#barpot
up.genes.enriched.plot <- up.genes.enriched %>%
filter(Adjusted.P.value <= 0.05) %>%
mutate(Term = fct_reorder(Term, -logpvalue)) %>%
ggplot(data = ., aes(x = Term, y = logpvalue, fill = Library, label = Overlap)) +
geom_bar(stat = "identity") +
geom_text(position = position_dodge(width = 0.9),
hjust = 0) +
theme_bw() +
ylab("-log(p.value)") +
xlab("") +
ggtitle("Enrichment of up-regulated sex genes \n(Adjusted.P.value <= 0.05)") +
theme(plot.background = element_blank() ,
panel.border = element_blank(),
panel.background = element_blank(),
#legend.position = "none",
plot.title = element_text(hjust = 0),
panel.grid.major = element_blank(),
panel.grid.minor = element_blank()) +
theme(axis.line = element_line(color = 'black')) +
theme(axis.title.x = element_text(size = 12, vjust=-0.5)) +
theme(axis.title.y = element_text(size = 12, vjust= 1.0)) +
theme(axis.text = element_text(size = 12)) +
theme(plot.title = element_text(size = 12)) +
coord_flip()
up.genes.enriched.plot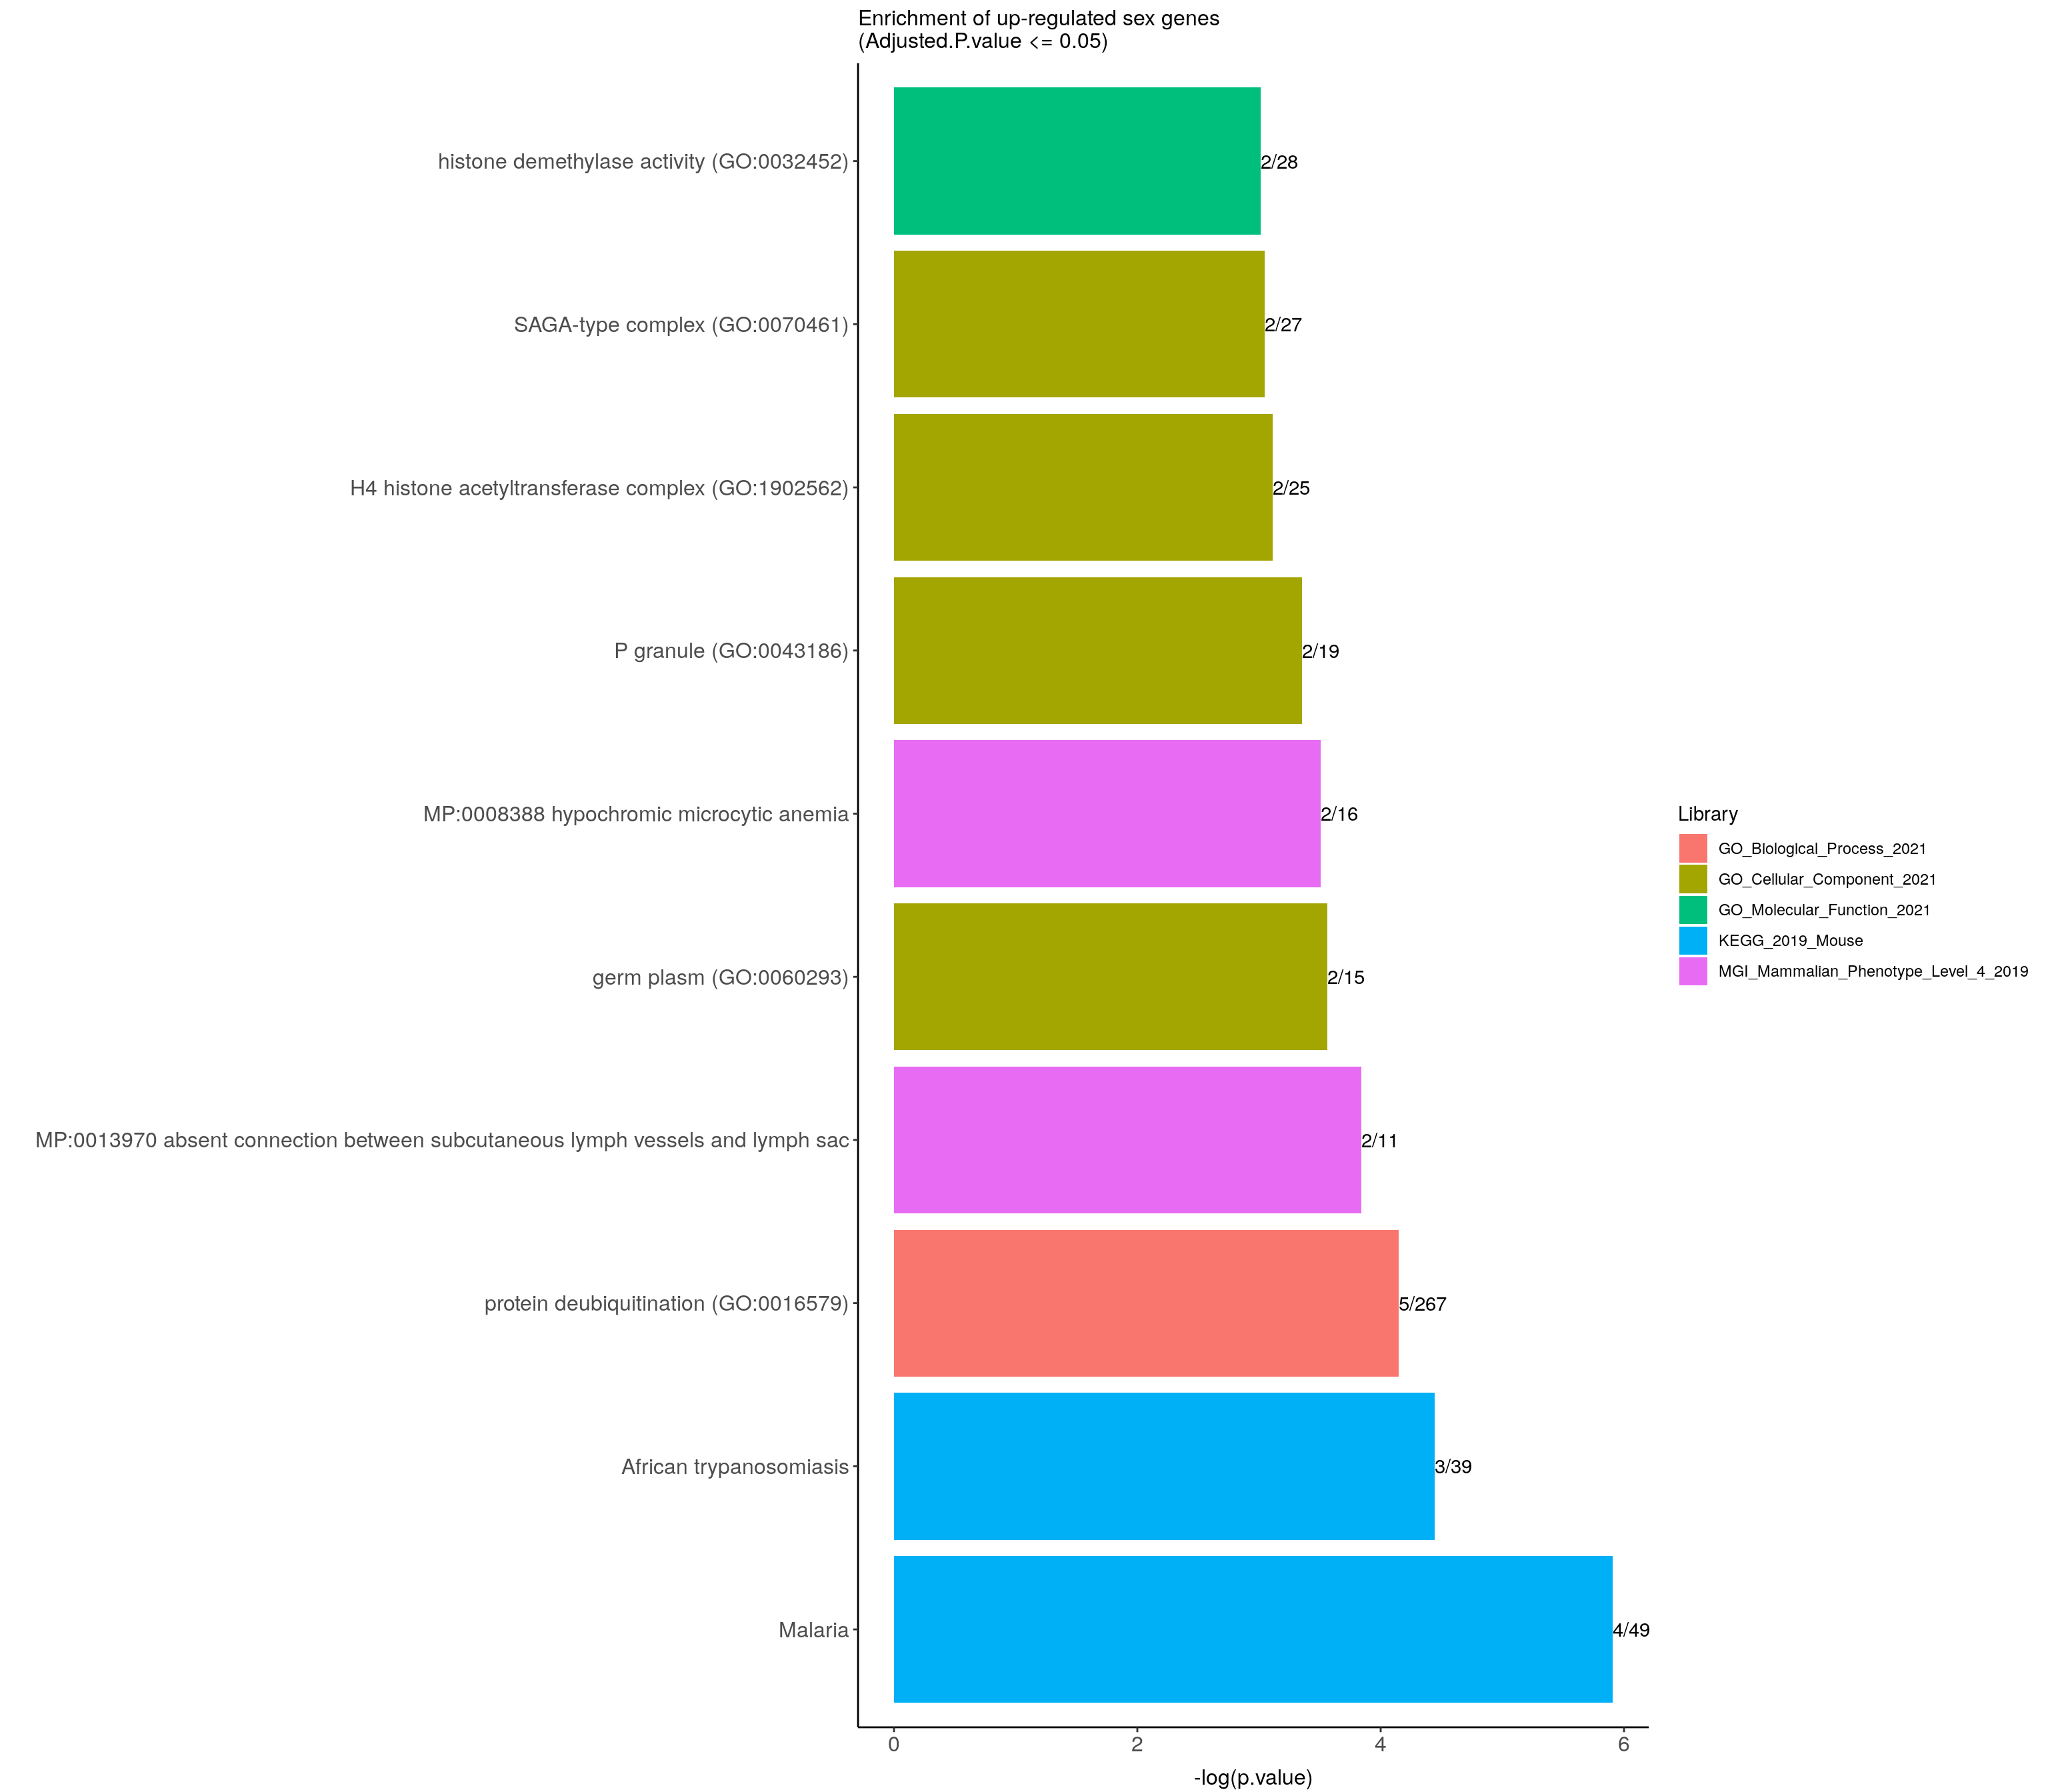
#down-regulated sex genes---------------------------
down.genes <- resSig.sex.tab %>%
  filter(log2FoldChange < 0) %>%
  pull(SYMBOL)
#down-regulated genes enrichment
down.genes.enriched <- enrichr(as.character(na.omit(down.genes)), dbs)
Uploading data to Enrichr... Done.
Querying WikiPathways_2019_Mouse... Done.
Querying GO_Biological_Process_2021... Done.
Querying GO_Cellular_Component_2021... Done.
Querying GO_Molecular_Function_2021... Done.
Querying KEGG_2019_Mouse... Done.
Querying Mouse_Gene_Atlas... Done.
Querying MGI_Mammalian_Phenotype_Level_4_2019... Done.
Parsing results... Done.for (j in 1:length(down.genes.enriched)){
down.genes.enriched[[j]] <- cbind(data.frame(Library = names(down.genes.enriched)[j]),down.genes.enriched[[j]])
}
down.genes.enriched <- do.call(rbind.data.frame, down.genes.enriched) %>%
filter(Adjusted.P.value <= 0.05) %>%
mutate(logpvalue = -log10(P.value)) %>%
arrange(desc(logpvalue))
#display down.genes.enriched
DT::datatable(down.genes.enriched,
filter = list(position = 'top', clear = FALSE),
extensions = 'Buttons',
options = list(dom = 'Blfrtip',
buttons = c('csv', 'excel'),
lengthMenu = list(c(10,25,50,-1),
c(10,25,50,"All")),
pageLength = 40,
scrollY = "300px",
scrollX = "40px")
)#barpot
down.genes.enriched.plot <- down.genes.enriched %>%
filter(Adjusted.P.value <= 0.05) %>%
mutate(Term = fct_reorder(Term, -logpvalue)) %>%
ggplot(data = ., aes(x = Term, y = logpvalue, fill = Library, label = Overlap)) +
geom_bar(stat = "identity") +
geom_text(position = position_dodge(width = 0.9),
hjust = 0) +
theme_bw() +
ylab("-log(p.value)") +
xlab("") +
ggtitle("Enrichment of down-regulated sex genes \n(Adjusted.P.value <= 0.05)") +
theme(plot.background = element_blank() ,
panel.border = element_blank(),
panel.background = element_blank(),
#legend.position = "none",
plot.title = element_text(hjust = 0),
panel.grid.major = element_blank(),
panel.grid.minor = element_blank()) +
theme(axis.line = element_line(color = 'black')) +
theme(axis.title.x = element_text(size = 12, vjust=-0.5)) +
theme(axis.title.y = element_text(size = 12, vjust= 1.0)) +
theme(axis.text = element_text(size = 12)) +
theme(plot.title = element_text(size = 12)) +
coord_flip()
down.genes.enriched.plot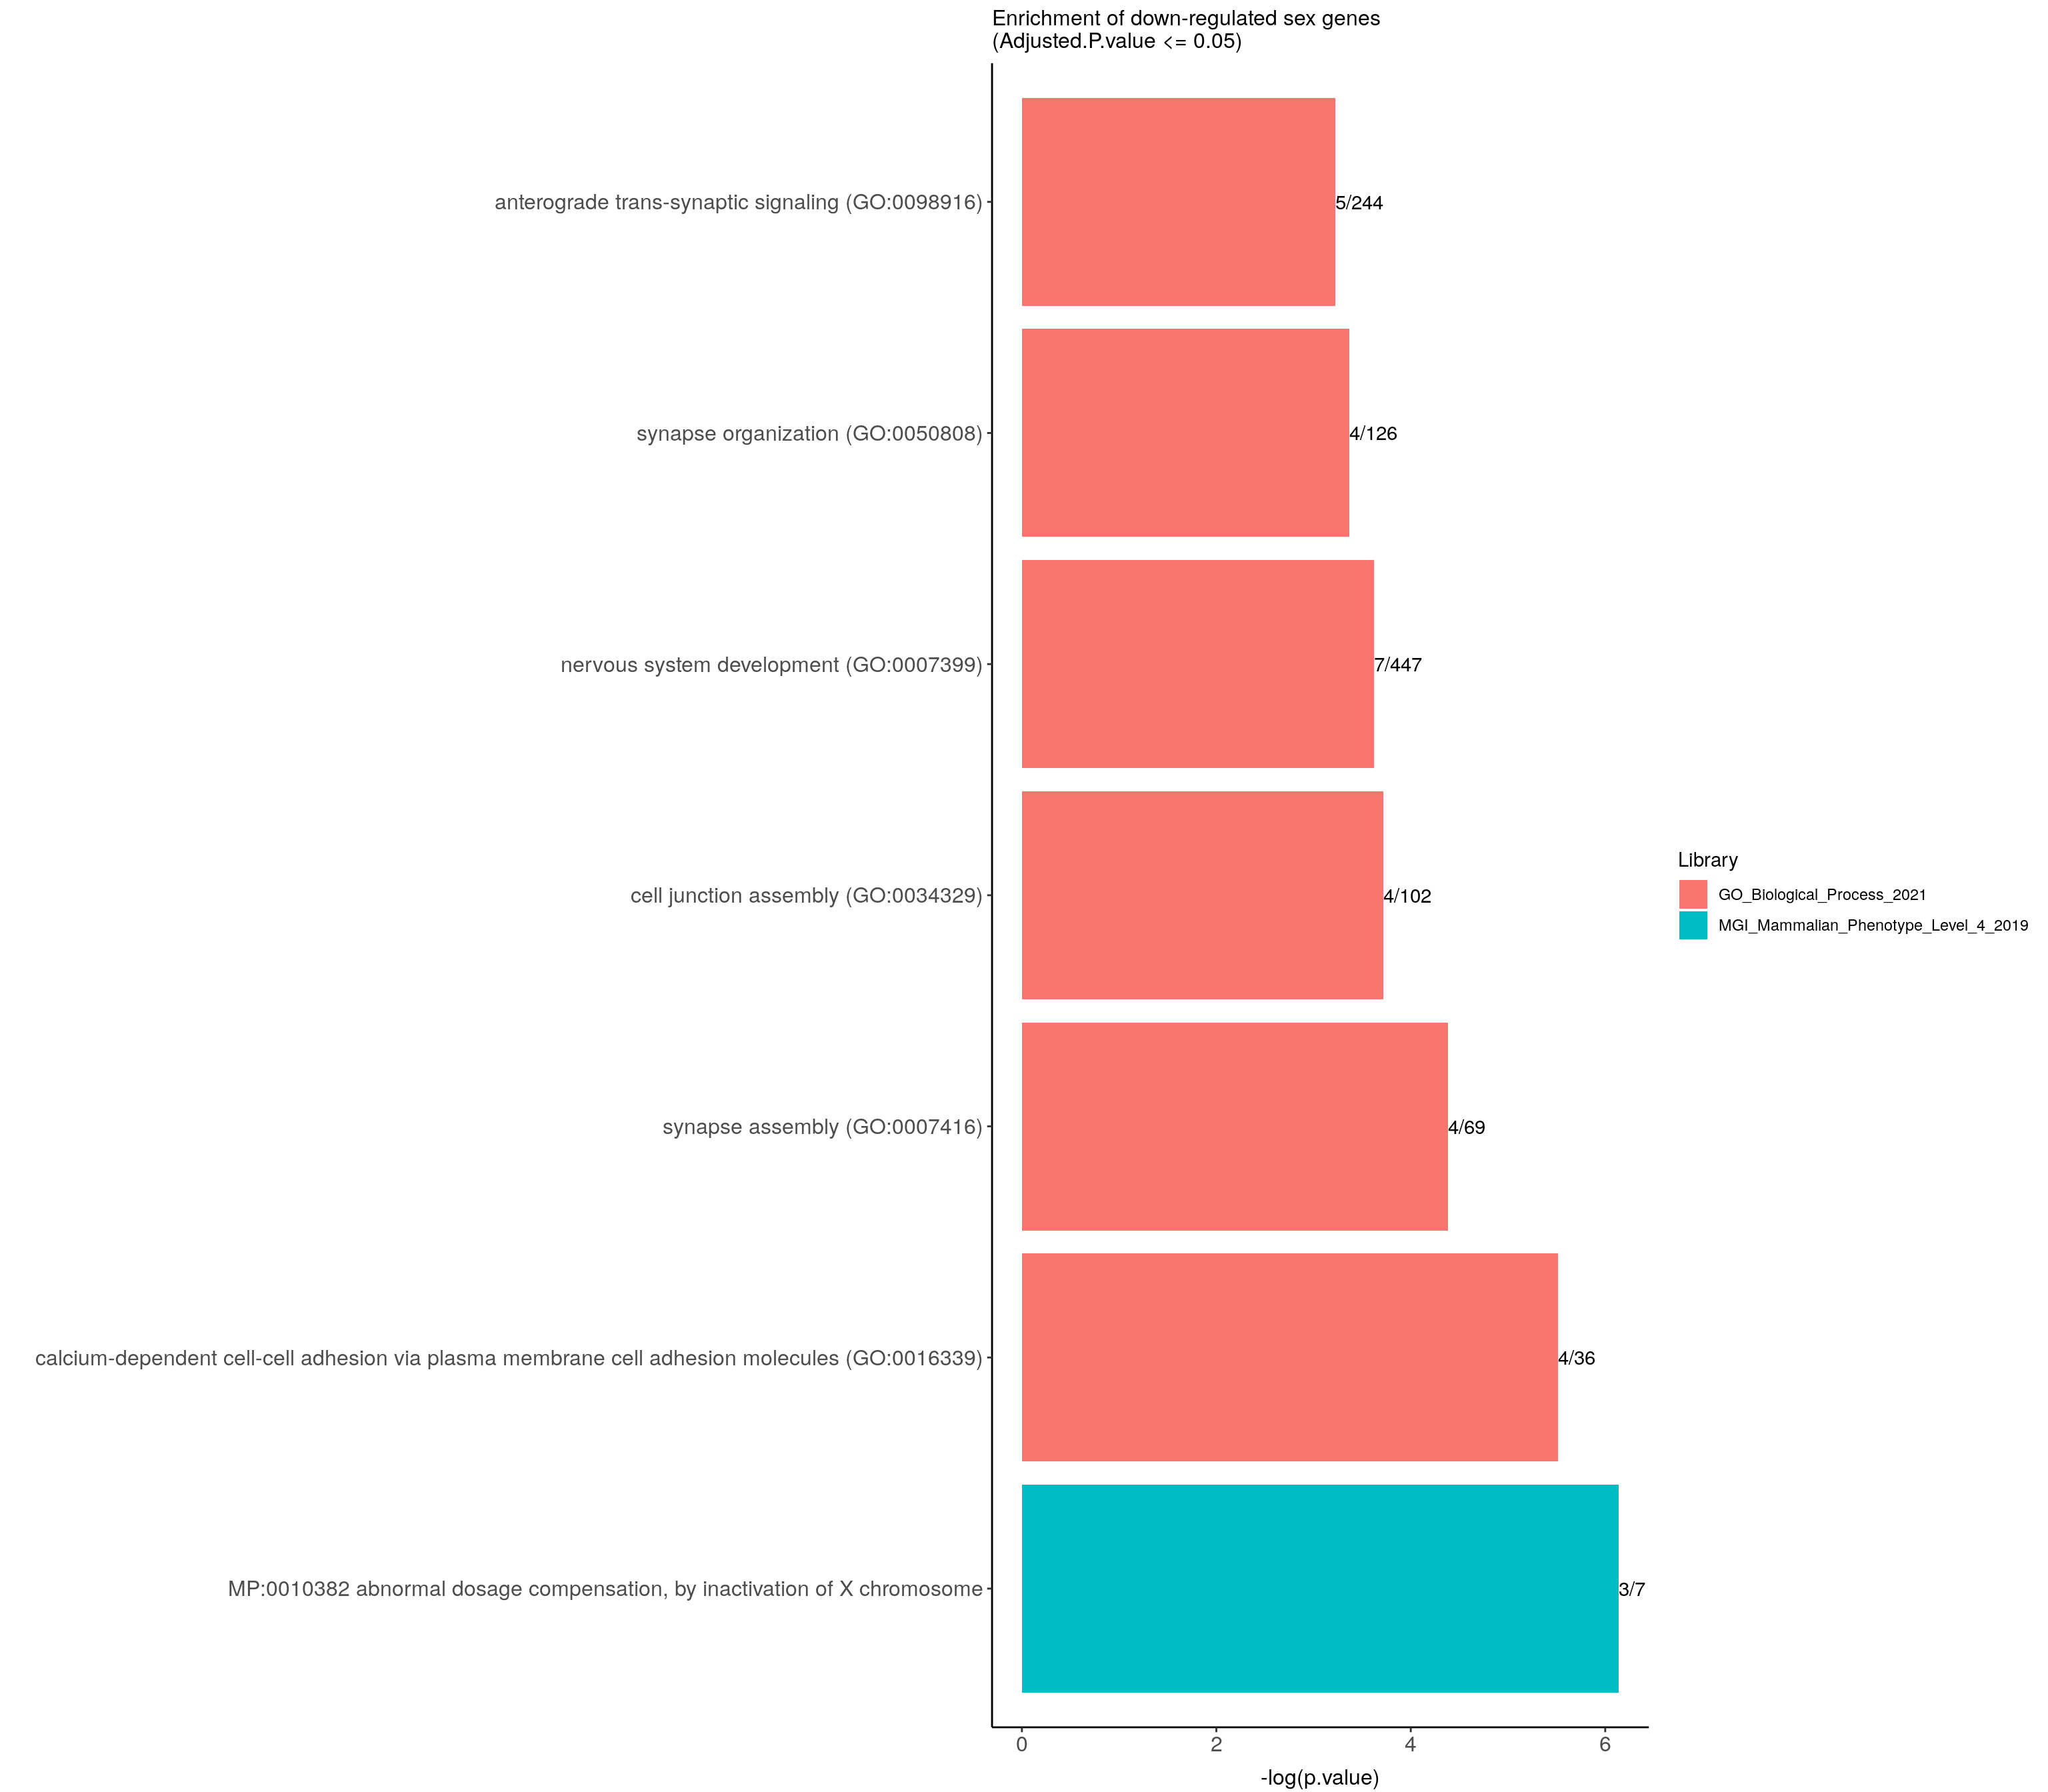
sessionInfo()R version 4.0.3 (2020-10-10)
Platform: x86_64-pc-linux-gnu (64-bit)
Running under: Ubuntu 20.04.2 LTS
Matrix products: default
BLAS/LAPACK: /usr/lib/x86_64-linux-gnu/openblas-pthread/libopenblasp-r0.3.8.so
locale:
[1] LC_CTYPE=en_US.UTF-8 LC_NUMERIC=C
[3] LC_TIME=en_US.UTF-8 LC_COLLATE=en_US.UTF-8
[5] LC_MONETARY=en_US.UTF-8 LC_MESSAGES=C
[7] LC_PAPER=en_US.UTF-8 LC_NAME=C
[9] LC_ADDRESS=C LC_TELEPHONE=C
[11] LC_MEASUREMENT=en_US.UTF-8 LC_IDENTIFICATION=C
attached base packages:
[1] grid parallel stats4 stats graphics grDevices utils
[8] datasets methods base
other attached packages:
[1] WGCNA_1.69 fastcluster_1.1.25
[3] dynamicTreeCut_1.63-1 data.table_1.13.6
[5] ggplotify_0.0.5 cowplot_1.1.1
[7] enrichR_3.0 DT_0.17
[9] ggrepel_0.9.1 pheatmap_1.0.12
[11] DESeq2_1.30.1 SummarizedExperiment_1.20.0
[13] MatrixGenerics_1.2.1 matrixStats_0.58.0
[15] GenomicRanges_1.42.0 GenomeInfoDb_1.26.7
[17] RColorBrewer_1.1-2 org.Mm.eg.db_3.12.0
[19] AnnotationDbi_1.52.0 IRanges_2.24.1
[21] S4Vectors_0.28.1 Biobase_2.50.0
[23] BiocGenerics_0.36.1 gplots_3.1.1
[25] Glimma_2.0.0 edgeR_3.32.1
[27] limma_3.46.0 forcats_0.5.1
[29] dplyr_1.0.4 purrr_0.3.4
[31] readr_1.4.0 tidyr_1.1.2
[33] tibble_3.0.6 ggplot2_3.3.3
[35] tidyverse_1.3.0 stringr_1.4.0
[37] workflowr_1.6.2
loaded via a namespace (and not attached):
[1] readxl_1.3.1 backports_1.2.1 Hmisc_4.4-2
[4] splines_4.0.3 crosstalk_1.1.1 BiocParallel_1.24.1
[7] digest_0.6.27 foreach_1.5.1 htmltools_0.5.1.1
[10] GO.db_3.12.1 checkmate_2.0.0 magrittr_2.0.1
[13] memoise_2.0.0 cluster_2.1.1 doParallel_1.0.16
[16] annotate_1.68.0 modelr_0.1.8 jpeg_0.1-8.1
[19] colorspace_2.0-0 blob_1.2.1 rvest_0.3.6
[22] haven_2.3.1 xfun_0.21 crayon_1.4.1
[25] RCurl_1.98-1.2 jsonlite_1.7.2 genefilter_1.72.1
[28] impute_1.64.0 survival_3.2-7 iterators_1.0.13
[31] glue_1.4.2 gtable_0.3.0 zlibbioc_1.36.0
[34] XVector_0.30.0 DelayedArray_0.16.3 scales_1.1.1
[37] DBI_1.1.1 Rcpp_1.0.6 htmlTable_2.1.0
[40] xtable_1.8-4 gridGraphics_0.5-1 foreign_0.8-81
[43] bit_4.0.4 preprocessCore_1.52.1 Formula_1.2-4
[46] htmlwidgets_1.5.3 httr_1.4.2 ellipsis_0.3.1
[49] farver_2.0.3 pkgconfig_2.0.3 XML_3.99-0.5
[52] nnet_7.3-15 dbplyr_2.1.0 locfit_1.5-9.4
[55] labeling_0.4.2 tidyselect_1.1.0 rlang_1.0.2
[58] later_1.1.0.1 munsell_0.5.0 cellranger_1.1.0
[61] tools_4.0.3 cachem_1.0.4 cli_2.3.0
[64] generics_0.1.0 RSQLite_2.2.3 broom_0.7.4
[67] evaluate_0.14 fastmap_1.1.0 yaml_2.2.1
[70] knitr_1.31 bit64_4.0.5 fs_1.5.0
[73] caTools_1.18.1 whisker_0.4 xml2_1.3.2
[76] compiler_4.0.3 rstudioapi_0.13 curl_4.3
[79] png_0.1-7 reprex_1.0.0 geneplotter_1.68.0
[82] stringi_1.5.3 highr_0.8 lattice_0.20-41
[85] Matrix_1.3-2 vctrs_0.3.6 pillar_1.4.7
[88] lifecycle_1.0.0 BiocManager_1.30.10 bitops_1.0-6
[91] httpuv_1.5.5 R6_2.5.0 latticeExtra_0.6-29
[94] promises_1.2.0.1 gridExtra_2.3 KernSmooth_2.23-18
[97] codetools_0.2-18 gtools_3.8.2 assertthat_0.2.1
[100] rprojroot_2.0.2 rjson_0.2.20 withr_2.4.1
[103] GenomeInfoDbData_1.2.4 hms_1.0.0 rpart_4.1-15
[106] rmarkdown_2.6 rvcheck_0.1.8 git2r_0.28.0
[109] lubridate_1.7.9.2 base64enc_0.1-3 This R Markdown site was created with workflowr